User login
Impact of varicella vaccination on herpes zoster is not what was expected
MALMO, SWEDEN – The unique 20-year U.S. experience with pediatric universal varicella vaccination hasn’t resulted in the anticipated increase in herpes zoster predicted by the exogenous boosting hypothesis, Lara J. Wolfson, PhD, reported at the annual meeting of the European Society for Paediatric Infectious Diseases.
In fact, the opposite has occurred. And this finding – based upon hard data – should be of considerable interest to European health officials who have been considering introducing universal varicella vaccination into their national health care systems but have refrained because of theoretical concerns raised by the venerable exogenous boosting hypothesis, noted Dr. Wolfson, director of outcomes research at the Merck Center for Observational and Real-World Evidence, Kenilworth, N.J.
The exogenous boosting hypothesis, which dates back to the mid-1960s, holds that reexposure to wild circulating varicella virus prevents development of herpes zoster later in life. Conversely, by vaccinating children against varicella, opportunities are diminished for reexposure to wild type virus among adults who weren’t vaccinated against varicella, so the hypothesis would predict an increase in the incidence of herpes zoster that should peak 15-35 years after introduction of universal varicella vaccination.
“The same virus that causes varicella in children later reactivates after going dormant in the dorsal root ganglia, and it reactivates as herpes zoster, which is 10 times more severe than chicken pox and leads to 10 times the health care costs. So if in fact implementing a universal varicella vaccine program would lead to an increased incidence of herpes zoster, this would be a bad thing,” the researcher explained.
However, the predictive models based upon the exogenous boosting hypothesis are built upon scanty data. And the models have great difficulty in adjusting for the changes in population dynamics that have occurred in the United States and Western Europe during the past quarter century: namely, declining birth rates coupled with survival to an older age.
Dr. Wolfson presented a retrospective study of deidentified administrative claims data from the MarketScan database covering roughly one-fifth of the U.S. population during 1991-2016. Her analysis broke down the annual incidence of varicella and herpes zoster in three eras: 1991-1995, which was the pre–varicella vaccination period; 1996-2006, when single-dose universal varicella vaccination of children was recommended; and 2007-2016, when two-dose vaccination became standard.
The first key study finding was that herpes zoster rates in the United States already were climbing across all age groups back in 1991-1995; that is, before introduction of universal varicella vaccination. Why? Probably because of those changes in population dynamics, although that’s speculative. The second key finding was that contrary to the exogenous boosting hypothesis prediction that the annual incidence of herpes zoster would accelerate after introduction of universal varicella vaccination, the rate of increase slowed, then plateaued during 2013-2016, most prominently in individuals aged 65 or older.
“In comparing the pre–universal varicella vaccination period to the one- or two-dose period or the total 20 years of vaccination, what we saw consistently across every age group is that herpes zoster is decelerating. There is actually less increase in the rate of herpes zoster than before varicella vaccination,” Dr. Wolfson said.
Uptake of the herpes zoster vaccine, introduced in the United States in 2008, was too low during the study years to account for this trend, she added.
Most dramatically, the incidence of herpes zoster among youths under age 18 years plummeted by 61.4%, from 88 per 100,000 person-years in 1991-1995 to 34 per 100,000 in 2016.
And of course, varicella disease has sharply declined in all age groups following the introduction of universal pediatric varicella vaccination, Dr. Wolfson observed.
Her study was supported by her employer, Merck.
REPORTING FROM ESPID 2018
Key clinical point: The exogenous boosting hypothesis that universal pediatric varicella vaccination would result in an increase in herpes zoster hasn’t been borne out by the U.S. experience.
Major finding: rather than accelerating as some had forecast.
Study details: This was a retrospective study of the annual incidence of varicella and herpes zoster during 1991-2016 in roughly one-fifth of the U.S. population.
Disclosures: The study was sponsored by Merck and presented by a company employee.
Study pinpoints skin cancer risk factors after hematopoietic cell transplant
CHICAGO – The 10-year incidence rates for both squamous cell carcinoma and basal cell carcinoma arising after hematopoietic cell transplantation are impressively high at 17%-plus for each, but the malignancies occur on two very different timelines, according to Jeffrey F. Scott, MD, a fellow in micrographic surgery and dermatologic oncology at Case Western Reserve University in Cleveland.
Most of the squamous cell carcinomas (SCCs) in a large multicenter retrospective study developed within the first 5 years following hematopoietic cell transplantation (HCT), while the majority of the basal cell carcinomas (BCCs) occurred after that point, Dr. Scott reported at the annual meeting of the American College of Mohs Surgery.
He presented the results of the study, which included 876 HCT recipients followed for a mean of 6.1 years. The study objective was to pin down the risk factors for skin cancer after HCT, especially the patient-specific ones. This has become a pressing issue because the use of HCT is steadily growing, and the 5-year survival rate now exceeds 50%.
The transplant-specific risk factors have previously been fairly well described by others. They include the donor source, type of disease, the conditioning regimen, whether whole body irradiation was used, immunosuppression, graft versus host disease (GVHD), and others.
The patient-centric risk factors, in contrast, have not been well characterized. And it’s critical to thoroughly understand these risk factors in order to develop targeted prevention and surveillance strategies, Dr. Scott said.
“There remains a significant knowledge gap within our field. I would venture that the majority of this audience has treated a patient with skin cancer who has had a transplant,” he said. “Yet when a patient asks us, ‘Doc, what is my risk for skin cancer after my HCT?’ we’re really unable to give them an accurate and complete assessment of that risk. That’s because we’re missing the second major category of risk factors: the patient-specific risk factors.”
The reason for that, he added, is that the major population-based studies and national HCT registries are run by hematologists and oncologists, and they haven’t adequately captured the patient-specific skin cancer risk factors. But these are variables very familiar to dermatologists. They include skin phenotype, history of UV radiation exposure, and history of pre-HCT skin cancer.
Dr. Scott said the multicenter study he presented has two major advantages over prior studies: its large size and thorough followup. Nearly all 876 patients were followed by both an oncologist and a dermatologist at the same institution.
During followup, the HCT recipients collectively developed 63 SCCs, 55 BCCs, and 16 malignant melanomas. The 5- and 10-year incidence rates for SCC were 10.6% and 17.2%. For BCC, the 5- and 10-year rates were 5.7% and 17.6%. All 16 cases of melanoma occurred within 5 years after HCT.
In multivariate Cox proportional hazard analyses, photodamage documented on examination was independently associated with a 3.2-fold increased risk of post-HCT SCC and a 3.5-fold increased risk of BCC.
A pre-transplant history of BCC was associated with a 3.9-fold increased likelihood of developing a BCC afterwards. Similarly, a pre-HCT history of SCC conferred a 4.2-fold increased risk of post-transplant SCC and was also independently associated with a 6.6-fold increased risk of developing melanoma post-HCT.
Fitzpatrick skin types I and II were respectively associated with 9.3- and 7.2-fold increased risks of post-HCT nonmelanoma skin cancer, compared with skin types III-VI.
Acute GVHD wasn’t associated with an increased risk of nonmelanoma skin cancer after HCT. However, in an observation that hasn’t previously been reported by others, chronic GVHD with skin involvement was associated with a 2.7-fold increased likelihood of SCC post-HCT, Dr. Scott noted.
What’s next for Dr. Scott and his coinvestigators? “Our ultimate goal with this project is to develop an interactive risk assessment tool like the National Cancer Institute’s Breast Cancer Risk Assessment Tool that can be online and used by patients and providers to estimate their individualized risk of basal cell carcinoma, squamous cell carcinoma, and melanoma after HCT,” he said.
Dr. Scott reported having no financial conflicts related to the study.
REPORTING FROM THE ACMS ANNUAL MEETING
Key clinical point:
Major finding: Photodamage documented on examination more than triples the risk of developing nonmelanoma skin cancer after hematopoietic cell transplantation.
Study details: A multicenter retrospective study of 876 hematopoietic cell recipients followed for a mean of 6.1 years.
Disclosures: The presenter reported having no financial conflicts related to the study, which was conducted without commercial support.
Make adult immunization a profit center
NEW ORLEANS – It’s a widespread misconception among internists: Implementing an office-based adult immunization program is a potential financial sinkhole and just isn’t worth the hassle.
That’s utterly wrong, Jason M. Goldman, MD, declared at the annual meeting of the American College of Physicians.
“But it is virtually impossible to lose money giving vaccines,” he countered. “You may not be able to retire on it, but you’re certainly not going to break the bank – and you’re not going to lose money. And more importantly, you’re doing what’s best for the patient. This is one of the few times where the payers and the government recognize that doing what’s best for the patient can actually be profitable in running a practice.”
At the annual meeting of the American College of Physicians, he detailed how to create a successful immunization program, offering money-saving tips on vaccine purchasing and proper storage, as well as wading into the complexities of coding and billing – which, by the way, he insisted actually is not daunting.
“The vaccine schedule is not nearly as complicated as it appears,” according to Dr. Goldman. “Read through it. Look at it. As automatically as you say, ‘You’re over 50, get a colonoscopy,’ you can very quickly learn to look at a patient and say, ‘These are your diseases, this is your age, these are the vaccines you need.’
“This is not difficult. If I can do it, anyone can do it,” Dr. Goldman noted. “Start simple with one or two vaccines until you hit your comfort level; then you can get more advanced. I do the travel vaccines – yellow fever, typhus, the whole gamut. And it’s just as easy vaccinating for that as for any of the others.”
Why implement adult immunization?
Many internists send patients off to a pharmacy for their vaccinations. That’s simply not good medical care, Dr. Goldman said.
“We are the primary care doctors,” he said. “We are the ones who should be vaccinating our patients, for several reasons: It’s the standard of care. It’s good medical practice.”
And Dr. Goldman frequently doesn’t receive any reports from the pharmacies. That means patients come to his office and have no idea what vaccines they received.
“That’s not good documentation,” he cautioned. “And when patients go into the hospital, they all get Pneumovax every single week because the hospital isn’t keeping documentation.”
The bottom line with vaccinating: “Whether you’re in a small group, a solo practitioner, or in a large health system, the vaccine programs work. They prevent disease and save lives. It’s easy to incorporate into your practice. And it is profitable.”
How profitable?
Dr. Goldman has the answer. For a great many different vaccines, he has calculated his average cost for the needle, syringe, medical assistant, time in the room, and other factors involved in running his practice. He also knows from experience the average purchase price paid for a given vaccine, the typical reimbursement for that vaccine, plus the reimbursement for its administration, which is a separate yet necessary coding/billing item.
The typical net profit ranges from $21.50 for high-dose influenza vaccine to, at the top end, $47.41 for meningococcal group B vaccine (Bexsero) and $49.58 for recombinant human papillomavirus 9-valent vaccine (Gardasil-9).
Purchasing and storage considerations
Always buy vaccines directly from the manufacturer; it’s a better deal than going through a middleman, who’ll invariably take a cut out of what should be the physician’s profit.
Each of the major vaccine makers has a dedicated vaccine purchase website where a physician can sign up for an account and order the company’s vaccines. These include Merck (www.merckvaccines.com), Aventis (www.vaccineshoppe.com), Pfizer (www.pfizerprime.com), and GlaxoSmithKline (www.gskdirect.com).
You’ll get a discount by buying multiple different vaccines on the same order.
“You can defer payment of your invoice for several months,” Dr. Goldman explained. “You purchase the vaccines now, but you don’t have to pay for them until 3-4 months later. By then, hopefully, you’ll have received reimbursement. So, your cost is covered, and you have profit on the side.”
For paying promptly on the due date, the manufacturer will provide an additional discount. The easiest way to do that is to have the money automatically charged to a credit card on that date.
Also, the vaccine manufacturers’ staff are happy to provide reliably expert reimbursement guidance.
With a little experience, it’s easy to predict how many vaccines will be used per month, Dr. Goldman said. Order what’s needed, so there aren’t a bunch of vaccines expiring in the office.
“However, even if that does happen, all is not lost,” he noted. “You can call up the manufacturer, and many of them will take back unused or even expired vaccines for full credit to the account. So, again, you really can’t lose money.”
With regard to vaccine storage, don’t skimp on the refrigerator and/or freezer. Get a professional model. And follow the best practices as described in the Centers for Disease Control and Prevention toolkit.
“It’s really common sense: Don’t use a dorm-type refrigerator; don’t put food or beverages in there; make sure the vaccines are appropriately stored; check the temperature every day; make sure if you lose power, your building has a backup generator,” he explained. “If you train your staff the right way, they’ll be able to handle it so you don’t have to worry about it. You just have to look at the logs and make sure they’re doing it.”
Use standing orders
Studies show that standing orders result in higher vaccination rates.
“You’re empowering the nurses or other staff members to act within the full extent of their license,” Dr. Goldman said. “It takes the burden off the physician to have to do anything that can be delegated to other individuals to make sure patients get vaccinated.”
Coding and billing for commercially insured patients
All vaccines have the same ICD-10 diagnostic code: Z23. And each vaccine has its own CPT code. For example, 90750 for Shingrix, the new herpes zoster vaccine; 90715 for Tdap; and 90686 for quadrivalent influenza.
But there are two components to the CPT code for a vaccination: the individual vaccine code and the administration code.
If you give one vaccination to a non-Medicare patient, the administration code is 90471. If you give a second vaccination during the same visit, its administration code is 90472. If you give a patient, say, four vaccines during one visit, you would bill the first using the administration code 90471, and the others as 90472 times three units.
If the vaccines are being given during a legitimate office visit, the physician can bill for both by employing modifiers 25 and 59. Modifier 25 goes with the appropriate E/M code for the office visit; it serves to tell the coding system that other things are going on in addition to the billable office visit. Modifier 59 needs to be attached to both the specific vaccine code and the vaccine administration code for reimbursement to occur.
Billing for vaccines for all commercially insured patients go through the office’s normal claims process.
Immunizing Medicare patients
For patients under Medicare Part B, vaccines for influenza, pneumonia, and hepatitis B have their own individual G codes: G0008 for influenza, G0009 for a pneumonia vaccine, and G0010 for hepatitis B. If a Medicare patient also gets an additional vaccine other than one of those three during the visit, administration code 90472 is applied to it. Those G-code bills are also submitted through the office’s normal claims process.
Under Medicare, vaccines for herpes zoster, hepatitis A, and Tdap are a special case. They are considered drugs and are covered under Medicare Part D.
“To bill that, you have to tell Medicare that you’re acting as a pharmacy,” Dr. Goldman explained. “You go to www.mytransactRX.com. You request there to be seen as a pharmacy billing for a drug. You will then be able to receive direct payment into your bank account from your Medicare payer. It will also allow you to check out patient coverage, print out proof of coverage, and submit the claim through the portal.”
If the Medicare patient doesn’t have a drug plan for those vaccines, or if the information in the system isn’t up to date, it’s a good idea to download the Advanced Beneficiary Notice of Noncoverage from the Medicare website and have the patient sign it. It spells out what the patient’s financial responsibility could be.
“The ABN also protects you as a provider, because it shows you’re not trying to balance-bill the patient,” he noted.
Dr. Goldman implored his internist colleagues to stand up and become the stewards of adult immunization.
“Remember: Keep calm and vaccinate,” he urged.
He reported having no relevant financial conflicts.
REPORTING FROM ACP INTERNAL MEDICINE
CRP apheresis: A promising new STEMI therapy
PARIS – Removal of circulating C-reactive protein (CRP) via selective extracorporeal apheresis shows considerable promise as a safe and effective adjunctive therapy for ST-segment elevation MI in an interim analysis of an ongoing, multicenter, German, randomized, proof-of-concept trial, Christoph D. Garlichs, MD, reported at the annual meeting of the European Association of Percutaneous Cardiovascular Interventions.
In the first 64 of 80 scheduled, randomized ST-segment elevation MI (STEMI) patients participating in the CRP Apheresis in the Acute Myocardial Infarction (CAMI 1) trial, CRP apheresis plus standard European Society of Cardiology guideline-recommended STEMI therapy, including complete coronary revascularization, resulted in a 47% reduction in infarct area by cardiac MRI performed 2-7 days post infarct, compared with standard therapy alone, which is the primary study endpoint, reported Dr. Garlichs, a cardiologist and head of the internal medicine clinic at Deaconess Hospital in Flensburg, Germany.

Cardiac MRI will be repeated in all 80 CAMI 1 participants 12 weeks post-MI, Dr. Garlichs added at a session on outside-the-box technologies in the cardiovascular pipeline.
The theory behind CRP apheresis in the treatment of MI is that high serum levels of CRP during acute cardiac events are a key player in the resultant myocardial damage because CRP activates the complement system, promoting destruction of stressed cardiac myocytes by macrophages. This is CRP as a mediator of myocardial tissue damage, not in the protein’s more familiar role as a systemic inflammation marker reflecting damage to coronary arteries, which is a whole different story.
“If you remove CRP from the system, complement will not be activated and myocardial cells regain viability,” Dr. Garlichs explained.
This has been established in animal studies, with elucidation of the specific mechanisms involved. The same process figures prominently in cerebral damage from stroke, he continued.
The device utilized for CRP apheresis in CAMI 1 is the PentraSorb CRP adsorber, produced by Henningsdorf, Germany–based Pentracor and already approved for marketing throughout Europe. The treatment regimen consists of two treatment sessions, each lasting roughly 4 hours. The first begins 24 hours after STEMI symptom onset, the second comes 24 hours later. If the serum CRP is above 30 mg/L a few hours after the second session, a third session is given 24 hours later.
In each session, 6,000 mL of plasma gets filtered via peripheral venous access. CRP levels were reduced by an average of 70%, and there have been no side effects or safety issues to date.
Discussant and entrepreneur Peter J. Fitzgerald, MD, PhD, said that if the magnitude of infarct size reduction, as measured by cardiac MRI, holds up in the final results, the device would be approvable for treatment of acute MI based upon Food and Drug Administration criteria.
Dr. Garlichs said that once CAMI 1 is finished, a similar randomized trial in stroke patients is planned.
“But you’ve got to get it approved,” said Dr. Fitzgerald, a cardiologist who has founded and/or been a principal in more than a dozen U.S. medical device start-up companies and serves as director of the Center for Cardiovascular Technology at Stanford (Calif.) University. “You can’t jump to the head until you get the heart approved.”
Towards that goal, he suggested that the investigators focus heavily on STEMI patients who have large anterior MIs, which he called “the tombstones.”
“I don’t care what the therapy is, it doesn’t work unless you look at anterior MIs,” said Dr. Fitzgerald.
As it turns out, Dr. Garlichs said, in fact most of the STEMI patients enrolled in CAMI 1 have had anterior MIs.
Asked if CRP apheresis might have a potential role in the treatment of RA and other autoimmune disorders marked by elevated CRP, Dr. Garlichs said indeed it does. But he noted that, in order to utilize the procedure on a regular long-term basis to treat a chronic disease such as RA as opposed to an acute cardiac or cerebrovascular event, a slew of new clinical trials will be required.
Dr. Garlichs serves as a consultant to Pentracor, which sponsored CAMI 1.
PARIS – Removal of circulating C-reactive protein (CRP) via selective extracorporeal apheresis shows considerable promise as a safe and effective adjunctive therapy for ST-segment elevation MI in an interim analysis of an ongoing, multicenter, German, randomized, proof-of-concept trial, Christoph D. Garlichs, MD, reported at the annual meeting of the European Association of Percutaneous Cardiovascular Interventions.
In the first 64 of 80 scheduled, randomized ST-segment elevation MI (STEMI) patients participating in the CRP Apheresis in the Acute Myocardial Infarction (CAMI 1) trial, CRP apheresis plus standard European Society of Cardiology guideline-recommended STEMI therapy, including complete coronary revascularization, resulted in a 47% reduction in infarct area by cardiac MRI performed 2-7 days post infarct, compared with standard therapy alone, which is the primary study endpoint, reported Dr. Garlichs, a cardiologist and head of the internal medicine clinic at Deaconess Hospital in Flensburg, Germany.
Cardiac MRI will be repeated in all 80 CAMI 1 participants 12 weeks post-MI, Dr. Garlichs added at a session on outside-the-box technologies in the cardiovascular pipeline.
The theory behind CRP apheresis in the treatment of MI is that high serum levels of CRP during acute cardiac events are a key player in the resultant myocardial damage because CRP activates the complement system, promoting destruction of stressed cardiac myocytes by macrophages. This is CRP as a mediator of myocardial tissue damage, not in the protein’s more familiar role as a systemic inflammation marker reflecting damage to coronary arteries, which is a whole different story.
“If you remove CRP from the system, complement will not be activated and myocardial cells regain viability,” Dr. Garlichs explained.
This has been established in animal studies, with elucidation of the specific mechanisms involved. The same process figures prominently in cerebral damage from stroke, he continued.
The device utilized for CRP apheresis in CAMI 1 is the PentraSorb CRP adsorber, produced by Henningsdorf, Germany–based Pentracor and already approved for marketing throughout Europe. The treatment regimen consists of two treatment sessions, each lasting roughly 4 hours. The first begins 24 hours after STEMI symptom onset, the second comes 24 hours later. If the serum CRP is above 30 mg/L a few hours after the second session, a third session is given 24 hours later.
In each session, 6,000 mL of plasma gets filtered via peripheral venous access. CRP levels were reduced by an average of 70%, and there have been no side effects or safety issues to date.
Discussant and entrepreneur Peter J. Fitzgerald, MD, PhD, said that if the magnitude of infarct size reduction, as measured by cardiac MRI, holds up in the final results, the device would be approvable for treatment of acute MI based upon Food and Drug Administration criteria.
Dr. Garlichs said that once CAMI 1 is finished, a similar randomized trial in stroke patients is planned.
“But you’ve got to get it approved,” said Dr. Fitzgerald, a cardiologist who has founded and/or been a principal in more than a dozen U.S. medical device start-up companies and serves as director of the Center for Cardiovascular Technology at Stanford (Calif.) University. “You can’t jump to the head until you get the heart approved.”
Towards that goal, he suggested that the investigators focus heavily on STEMI patients who have large anterior MIs, which he called “the tombstones.”
“I don’t care what the therapy is, it doesn’t work unless you look at anterior MIs,” said Dr. Fitzgerald.
As it turns out, Dr. Garlichs said, in fact most of the STEMI patients enrolled in CAMI 1 have had anterior MIs.
Asked if CRP apheresis might have a potential role in the treatment of RA and other autoimmune disorders marked by elevated CRP, Dr. Garlichs said indeed it does. But he noted that, in order to utilize the procedure on a regular long-term basis to treat a chronic disease such as RA as opposed to an acute cardiac or cerebrovascular event, a slew of new clinical trials will be required.
Dr. Garlichs serves as a consultant to Pentracor, which sponsored CAMI 1.
REPORTING FROM EUROPCR 2018
Serum uromodulin independently predicts mortality in CAD
ORLANDO – Low serum uromodulin proved to be an independent predictor of all-cause mortality in a prospective study of 529 patients with stable coronary artery disease followed for up to 8 years, according to Christoph Saely, MD, vice president of the Vorarlberg Institute for Vascular Investigation and Treatment in Feldkirch, Austria.
“Baseline serum uromodulin is a valuable biomarker to predict overall mortality in coronary patients independent from kidney disease and the presence of type 2 diabetes. The lower the serum uromodulin, the higher the mortality,” he noted in an interview at the annual meeting of the American College of Cardiology.

In addition to presenting new evidence at ACC 2018 of serum uromodulin’s merits as a predictor of increased mortality risk in patients with CAD, Dr. Saely and his coinvestigators also showed that low serum uromodulin is associated with chronic kidney disease, type 2 diabetes, and prediabetes. Moreover, those with normal glucose metabolism and kidney function but a low serum uromodulin at baseline were at increased risk of developing abnormal glucose metabolism and impaired renal function during 4 years of follow-up.
Of the 529 patients with stable CAD, 95 died during follow-up. Among those with a low baseline serum uromodulin, defined bimodally as a level below 123.3 ng/mL, the mortality rate was 27.6%, roughly twice the 13.7% figure in patients with a baseline uromodulin above that threshold.
In a multivariate analysis adjusted extensively for age, sex, smoking, LDL cholesterol, HDL cholesterol, C-reactive protein, diabetes, estimated glomerular filtration rate, and N-terminal pro b-type natriuretic peptide level, a high baseline serum uromodulin was independently associated with a 43% reduction in the risk of mortality, according to Dr. Saely, who is both a cardiologist and an endocrinologist.
The overall mortality rate was 41% in patients with diabetes and a low baseline uromodulin, 20% in those with low uromodulin but not diabetes, 18% in diabetic patients with high uromodulin, and less than 13% with high uromodulin and no diabetes.
Enzyme-linked immunosorbent assay tests for uromodulin are marketed in Europe but remain investigational for now in the United States.
Dr. Saely reported having no financial conflicts of interest; the study was conducted without commercial support.
SOURCE: Saely C. ACC 2018, Abstract 1212-418/418.
ORLANDO – Low serum uromodulin proved to be an independent predictor of all-cause mortality in a prospective study of 529 patients with stable coronary artery disease followed for up to 8 years, according to Christoph Saely, MD, vice president of the Vorarlberg Institute for Vascular Investigation and Treatment in Feldkirch, Austria.
“Baseline serum uromodulin is a valuable biomarker to predict overall mortality in coronary patients independent from kidney disease and the presence of type 2 diabetes. The lower the serum uromodulin, the higher the mortality,” he noted in an interview at the annual meeting of the American College of Cardiology.
In addition to presenting new evidence at ACC 2018 of serum uromodulin’s merits as a predictor of increased mortality risk in patients with CAD, Dr. Saely and his coinvestigators also showed that low serum uromodulin is associated with chronic kidney disease, type 2 diabetes, and prediabetes. Moreover, those with normal glucose metabolism and kidney function but a low serum uromodulin at baseline were at increased risk of developing abnormal glucose metabolism and impaired renal function during 4 years of follow-up.
Of the 529 patients with stable CAD, 95 died during follow-up. Among those with a low baseline serum uromodulin, defined bimodally as a level below 123.3 ng/mL, the mortality rate was 27.6%, roughly twice the 13.7% figure in patients with a baseline uromodulin above that threshold.
In a multivariate analysis adjusted extensively for age, sex, smoking, LDL cholesterol, HDL cholesterol, C-reactive protein, diabetes, estimated glomerular filtration rate, and N-terminal pro b-type natriuretic peptide level, a high baseline serum uromodulin was independently associated with a 43% reduction in the risk of mortality, according to Dr. Saely, who is both a cardiologist and an endocrinologist.
The overall mortality rate was 41% in patients with diabetes and a low baseline uromodulin, 20% in those with low uromodulin but not diabetes, 18% in diabetic patients with high uromodulin, and less than 13% with high uromodulin and no diabetes.
Enzyme-linked immunosorbent assay tests for uromodulin are marketed in Europe but remain investigational for now in the United States.
Dr. Saely reported having no financial conflicts of interest; the study was conducted without commercial support.
SOURCE: Saely C. ACC 2018, Abstract 1212-418/418.
REPORTING FROM ACC 2018
Key clinical point: The lower the baseline serum uromodulin in patients with CAD, the higher the subsequent mortality.
Major finding: A high baseline serum uromodulin was independently associated with a 43% reduction in all-cause mortality in patients with stable coronary artery disease.
Study details: This was a prospective study of 529 patients with stable CAD followed for up to 8 years.
Disclosures: The presenter reported having no financial conflicts regarding the study, which was conducted without commercial support.
Source: Saely C. ACC 2018, Abstract 1212-418/418.
Antidepressant therapy after MI, stroke cut CVD events
ORLANDO – Although cardiologists and neurologists aren’t typically the physicians who diagnose and treat major depressive disorder that’s newly identified in patients after MI or stroke, they’re the ones who’ll deal with the cardiovascular consequences if the mood disorder isn’t adequately treated.
That was a key message of a study presented by interventional cardiologist Sripal Bangalore, MD, at the annual meeting of the American College of Cardiology.
In his retrospective cohort study of 1,568 patients diagnosed with and treated for major depressive disorder (MDD) following an initial acute MI or stroke, antidepressant therapy deemed inadequate by either of two prespecified measures was associated during a mean follow-up of 2 years with a 20% higher risk of the primary endpoint – a composite of recurrent MI, stroke, angina, or heart failure – than the risk in patients who received what was judged to be adequate antidepressant pharmacotherapy. A precondition for study inclusion was that a patient could not have been taking any antidepressant during the year prior to the index MI or stroke.
The study utilized nationwide claims data from the Truven Health MarketScan Claims Database for 2010-2015. Depression therapy was considered adequate if during the first 90 days following diagnosis of MDD two conditions were met: a patient aged 65 or younger had to be on the equivalent of at least 20 mg of fluoxetine per day, or if older then on a fluoxetine-equivalent dose of at least 10 mg/day, and pharmacy records had to indicate the patient was covered by the antidepressant prescription for at least 72 of those 90 days.
The prevalence of inadequate antidepressant therapy for MDD by these criteria among these patients with known cardiovascular disease was eyebrow-raisingly high: fully 60%, noted Dr. Bangalore of New York University.
In a multivariate logistic regression analysis adjusted for baseline factors that could affect the propensity to receive adequate antidepressant care, Dr. Bangalore and his coinvestigators broke down the risks of insufficient antidepressant therapy associated with each of the individual components of the composite primary endpoint. The 1.2- and 1.95-fold increased risks of stroke and angina, respectively, were statistically significant. However, the 1.37-fold higher risk of MI and 1.14-fold greater risk of heart failure than in adequately treated patients with MDD, while trending in the same direction, didn’t achieve significance.
Dr. Bangalore reported serving as a consultant to Pfizer, which funded the study, as well as to Abbott, Gilead Sciences, and Merck.
REPORTING FROM ACC 2018
Key clinical point: Make sure patients with newly diagnosed depression post-MI or stroke are getting adequate antidepressant therapy from their primary care physician or psychiatrist.
Major finding: Patients with a first MI or stroke subsequently diagnosed with major depressive disorder were 20% more likely to experience a recurrent cardiovascular event if their antidepressant therapy was judged insufficient than if adequate.
Study details: This was a retrospective cohort study of health insurance claims data for 1,568 patients with an initial diagnosis of MI or stroke who were subsequently diagnosed with and treated for major depressive disorder.
Disclosures: The presenter reported serving as a consultant to Pfizer, which funded the study.
TAVR for low-risk patients shines at 6 years in NOTION
PARIS – Follow-up data from a randomized trial of transcatheter versus surgical aortic valve replacement in low-surgical-risk patients with symptomatic severe aortic stenosis showed sustained superior hemodynamic valve performance and less structural valve deterioration in the transcatheter group through 6 years, Lars Sondergaard, MD, reported at the annual meeting of the European Association of Percutaneous Cardiovascular Interventions.
Moreover, the rate of bioprosthetic valve failure as formally defined in a recent European consensus statement (Eur Heart J. 2017 Dec 1;38[45]:3382-90) was similarly low in the transcatheter aortic valve replacement (TAVR) and surgical aortic valve replacement (SAVR) arms at about 7%, in the randomized study known as NOTION (Nordic Aortic Valve Intervention), added Dr. Sondergaard, professor of cardiology at the University of Copenhagen, who was a coauthor of the consensus statement.

“As we look to expand TAVR to younger patients with longer life expectancy, durability, of course, becomes much more important,” the cardiologist observed.
NOTION was a pioneering prospective, multicenter, nonblinded, randomized trial of first-generation TAVR technology. The 280 participants, average age 79 years, were truly a low-surgical-risk population, with a mean Society of Thoracic Surgeons risk score of 3%.
NOTION is a small trial, but the results at 6 years of a planned 10-year follow-up augur well for TAVR success in the large, ongoing, definitive, randomized trials of TAVR versus SAVR in low-risk patients. That’s because NOTION participants were treated in 2009-2013, when the self-expanding TAVR CoreValve was implanted on the basis of aortic annulus measurements obtained via echocardiography, which is considerably less accurate than CT, the standard practice today. For this reason, it’s highly unlikely that the larger, ongoing trials, including PARTNER 3 and the Medtronic Evolut Transcatheter Aortic Valve Replacement in Low Risk Patients trial, will experience moderate paravalvular leak rates anything like the 20.9% rate seen in the TAVR group in NOTION, where the SAVR group’s rate was just 1.5%.
“I’m sure quite a few of the NOTION patients would have a larger TAVR valve prosthesis if they were treated today,” according to Dr. Sondergaard.
Valve function
The rate of moderate hemodynamic structural valve deterioration through 6 years of follow-up was 3.6% in the TAVR arm, compared with 23.7% in the SAVR group. The rate of nonstructural valve deterioration was 54.0% with TAVR and 57.8% with SAVR, and there were no cases of moderate or severe aortic regurgitation in either group.
The mean aortic valve gradient in the TAVR group went from 44.9 mm Hg at baseline to 12.2 mm Hg at 3 months and to 14.7 mm Hg at 6 years. In the SAVR group, the figures were 44.9 mm Hg, 8.3 mm Hg, and 9.9 mm Hg, respectively.
The effective orifice area in the TAVR group improved from 0.74 cm2 at baseline to 1.37 cm2 at 3 months and to 1.16 cm2 at 6 years. With SAVR, the effective orifice area was 0.74 cm2 at baseline, 1.66 cm2 at 3 months, and 1.53 cm2 at 6 years.
Clinical outcomes
Through 6 years of follow-up, there were no cases of thrombosis in either study arm, and the rate of endocarditis was just under 6% in each group through 6 years. All-cause mortality through 6 years was 42.5% in the TAVR group, not significantly different from the 37.7% rate in the SAVR arm.
The valve-related death rate was 5.0% in the TAVR arm and similar at 3.7% with SAVR. Reintervention occurred in 2.2% of TAVR patients and in 0.7% of SAVR patients. Severe hemodynamic structural valve deterioration was documented in 0.7% of TAVR patients and 3.0% of SAVR patients. The overall rate of bioprosthetic valve failure – a composite of these three endpoints – was 7.5% with TAVR and similar at 6.7% with SAVR.
Session cochair Alain G. Cribier, MD, a TAVR pioneer who is professor of medicine and director of cardiology at Charles Nicolle Hospital, University of Rouen (France), declared, “This is extremely encouraging.”
However, discussant Corrado Tamburino, MD, was more circumspect.
“If you look, there’s a trend for increased all-cause mortality in the TAVR versus SAVR group at 6 years. This could be related to the big difference in paravalvular leak. Do you think paravalvular leak could have a real impact on mortality?” asked Dr. Tamburino, professor of cardiology at the University of Catania, Italy.
Not in the NOTION study, where they looked for but didn’t find any such association, according to Dr. Sondergaard.
“If you look at the survival curves from the beginning out to 6 years, you’ll see that the lines cross each other several times, so this small difference right now could just be random. I don’t think we can say there’s a higher mortality rate with TAVR for the time being,” he added.
The NOTION trial was funded by the Danish Heart Foundation. Dr. Sondergaard reported receiving research grants from and/or serving as a consultant to Abbott, Boston Scientific, Edwards Lifesciences, Medtronic, and Symetis.
PARIS – Follow-up data from a randomized trial of transcatheter versus surgical aortic valve replacement in low-surgical-risk patients with symptomatic severe aortic stenosis showed sustained superior hemodynamic valve performance and less structural valve deterioration in the transcatheter group through 6 years, Lars Sondergaard, MD, reported at the annual meeting of the European Association of Percutaneous Cardiovascular Interventions.
Moreover, the rate of bioprosthetic valve failure as formally defined in a recent European consensus statement (Eur Heart J. 2017 Dec 1;38[45]:3382-90) was similarly low in the transcatheter aortic valve replacement (TAVR) and surgical aortic valve replacement (SAVR) arms at about 7%, in the randomized study known as NOTION (Nordic Aortic Valve Intervention), added Dr. Sondergaard, professor of cardiology at the University of Copenhagen, who was a coauthor of the consensus statement.
“As we look to expand TAVR to younger patients with longer life expectancy, durability, of course, becomes much more important,” the cardiologist observed.
NOTION was a pioneering prospective, multicenter, nonblinded, randomized trial of first-generation TAVR technology. The 280 participants, average age 79 years, were truly a low-surgical-risk population, with a mean Society of Thoracic Surgeons risk score of 3%.
NOTION is a small trial, but the results at 6 years of a planned 10-year follow-up augur well for TAVR success in the large, ongoing, definitive, randomized trials of TAVR versus SAVR in low-risk patients. That’s because NOTION participants were treated in 2009-2013, when the self-expanding TAVR CoreValve was implanted on the basis of aortic annulus measurements obtained via echocardiography, which is considerably less accurate than CT, the standard practice today. For this reason, it’s highly unlikely that the larger, ongoing trials, including PARTNER 3 and the Medtronic Evolut Transcatheter Aortic Valve Replacement in Low Risk Patients trial, will experience moderate paravalvular leak rates anything like the 20.9% rate seen in the TAVR group in NOTION, where the SAVR group’s rate was just 1.5%.
“I’m sure quite a few of the NOTION patients would have a larger TAVR valve prosthesis if they were treated today,” according to Dr. Sondergaard.
Valve function
The rate of moderate hemodynamic structural valve deterioration through 6 years of follow-up was 3.6% in the TAVR arm, compared with 23.7% in the SAVR group. The rate of nonstructural valve deterioration was 54.0% with TAVR and 57.8% with SAVR, and there were no cases of moderate or severe aortic regurgitation in either group.
The mean aortic valve gradient in the TAVR group went from 44.9 mm Hg at baseline to 12.2 mm Hg at 3 months and to 14.7 mm Hg at 6 years. In the SAVR group, the figures were 44.9 mm Hg, 8.3 mm Hg, and 9.9 mm Hg, respectively.
The effective orifice area in the TAVR group improved from 0.74 cm2 at baseline to 1.37 cm2 at 3 months and to 1.16 cm2 at 6 years. With SAVR, the effective orifice area was 0.74 cm2 at baseline, 1.66 cm2 at 3 months, and 1.53 cm2 at 6 years.
Clinical outcomes
Through 6 years of follow-up, there were no cases of thrombosis in either study arm, and the rate of endocarditis was just under 6% in each group through 6 years. All-cause mortality through 6 years was 42.5% in the TAVR group, not significantly different from the 37.7% rate in the SAVR arm.
The valve-related death rate was 5.0% in the TAVR arm and similar at 3.7% with SAVR. Reintervention occurred in 2.2% of TAVR patients and in 0.7% of SAVR patients. Severe hemodynamic structural valve deterioration was documented in 0.7% of TAVR patients and 3.0% of SAVR patients. The overall rate of bioprosthetic valve failure – a composite of these three endpoints – was 7.5% with TAVR and similar at 6.7% with SAVR.
Session cochair Alain G. Cribier, MD, a TAVR pioneer who is professor of medicine and director of cardiology at Charles Nicolle Hospital, University of Rouen (France), declared, “This is extremely encouraging.”
However, discussant Corrado Tamburino, MD, was more circumspect.
“If you look, there’s a trend for increased all-cause mortality in the TAVR versus SAVR group at 6 years. This could be related to the big difference in paravalvular leak. Do you think paravalvular leak could have a real impact on mortality?” asked Dr. Tamburino, professor of cardiology at the University of Catania, Italy.
Not in the NOTION study, where they looked for but didn’t find any such association, according to Dr. Sondergaard.
“If you look at the survival curves from the beginning out to 6 years, you’ll see that the lines cross each other several times, so this small difference right now could just be random. I don’t think we can say there’s a higher mortality rate with TAVR for the time being,” he added.
The NOTION trial was funded by the Danish Heart Foundation. Dr. Sondergaard reported receiving research grants from and/or serving as a consultant to Abbott, Boston Scientific, Edwards Lifesciences, Medtronic, and Symetis.
REPORTING FROM EUROPCR 2018
Key clinical point: TAVR provided superior hemodynamic valve performance and less structural valve deterioration than SAVR in low-surgical-risk patients through 6 years of follow-up.
Major finding: The rate of moderate hemodynamic structural valve deterioration through 6 years was 3.6% with TAVR and 23.7% with SAVR.
Study details: An analysis of 6-year follow-up data from NOTION, a prospective, multicenter, randomized trial in 280 low-surgical-risk patients.
Disclosures: NOTION was funded by the Danish Heart Foundation. The presenter reported receiving research grants from and/or serving as a consultant to several medical device companies.
Vaccine-related febrile seizures have zero developmental impact
MALMO, SWEDEN – Children who experience a febrile seizure in conjunction with a vaccination have developmental outcomes comparable with those of children who have non–vaccine-related febrile seizures and healthy controls who’ve never had a febrile seizure, according to the first prospective case-control cohort study to examine the issue.
This finding has important implications for clinical practice, Lucy Deng, MD, observed at the annual meeting of the European Society for Paediatric Infectious Diseases.
“Febrile seizures associated with a vaccine can decrease parent and provider confidence in vaccine safety,” the pediatrician noted. Based upon her study results, however, physicians now can offer a truly evidence-based message of reassurance.

“If you have a child with a vaccine-related febrile seizure, you can give the same advice to those parents as for anyone else who’s had a febrile seizure, in that there is no difference in the clinical outcomes of vaccine-proximate and non–vaccine-proximate febrile seizures. Vaccine-proximate febrile seizures are usually brief, they don’t require any antiepileptic drugs, their length of stay is usually less than a day, and developmentally at 12-24 months post initial febrile seizure, they’re exactly the same as children who’ve never had a seizure before or who’ve had a non-vaccine-related febrile seizure,” said Dr. Deng of the National Centre for Immunisation Research and Surveillance in Sydney.
The impetus for her study was straightforward: “We all know that most children with a history of febrile seizures have normal behavior, intelligence, and academic achievement and do not later develop epilepsy. What we didn’t know before is if all of these facts apply to vaccine-proximate febrile seizures,” she explained.
The clinical severity analysis portion of this prospective case-control cohort study included 1,085 children with febrile seizures seen at five Australian children’s hospitals. Sixty-eight of them had vaccine-proximate febrile seizures, for a 6.6% rate. The febrile seizures in the other 1,027 children didn’t occur within 2 weeks following a vaccination.
Measles vaccine was implicated in 56 of the 68 children with vaccine-proximate febrile seizures, or 82%. Because Australian children receive their first measles-containing vaccine at age 12 months, the average age of the cohort with vaccine-proximate febrile seizures was 13 months, significantly younger than the 20-month average for children with non–vaccine-related febrile seizures.
In a multivariate analysis adjusted for patient age, gender, and history of prior afebrile seizures, the groups with vaccine-proximate and vaccine-unrelated febrile seizures didn’t differ significantly in terms of the proportion with a hospital length of stay greater than 1 day (20% vs. 15%), ICU admission (1.5% vs. 2.3%), seizure duration of more than 15 minutes (16% vs. 12%), repeat seizures within 24 hours (9% vs. 10%), or discharge on antiepileptic medication (4.4% vs. 4.3%).
In the developmental outcomes analysis, 62 of the children with vaccine-proximate febrile seizures, 70 with vaccine-unrelated febrile seizures, and 85 healthy controls with no seizure history underwent formal assessment using the third edition of the Bayley Scales of Infant and Toddler Development 12-24 months after their initial febrile seizure. Scores adjusted for years of maternal education were closely similar in all three groups across all five test domains: cognitive, language, motor, social-emotional, and general-adaptive.
Dr. Deng reported having no financial conflicts of interest regarding the study, which was partially funded by the Australian National Centre for Immunisation Research and Surveillance.
MALMO, SWEDEN – Children who experience a febrile seizure in conjunction with a vaccination have developmental outcomes comparable with those of children who have non–vaccine-related febrile seizures and healthy controls who’ve never had a febrile seizure, according to the first prospective case-control cohort study to examine the issue.
This finding has important implications for clinical practice, Lucy Deng, MD, observed at the annual meeting of the European Society for Paediatric Infectious Diseases.
“Febrile seizures associated with a vaccine can decrease parent and provider confidence in vaccine safety,” the pediatrician noted. Based upon her study results, however, physicians now can offer a truly evidence-based message of reassurance.
“If you have a child with a vaccine-related febrile seizure, you can give the same advice to those parents as for anyone else who’s had a febrile seizure, in that there is no difference in the clinical outcomes of vaccine-proximate and non–vaccine-proximate febrile seizures. Vaccine-proximate febrile seizures are usually brief, they don’t require any antiepileptic drugs, their length of stay is usually less than a day, and developmentally at 12-24 months post initial febrile seizure, they’re exactly the same as children who’ve never had a seizure before or who’ve had a non-vaccine-related febrile seizure,” said Dr. Deng of the National Centre for Immunisation Research and Surveillance in Sydney.
The impetus for her study was straightforward: “We all know that most children with a history of febrile seizures have normal behavior, intelligence, and academic achievement and do not later develop epilepsy. What we didn’t know before is if all of these facts apply to vaccine-proximate febrile seizures,” she explained.
The clinical severity analysis portion of this prospective case-control cohort study included 1,085 children with febrile seizures seen at five Australian children’s hospitals. Sixty-eight of them had vaccine-proximate febrile seizures, for a 6.6% rate. The febrile seizures in the other 1,027 children didn’t occur within 2 weeks following a vaccination.
Measles vaccine was implicated in 56 of the 68 children with vaccine-proximate febrile seizures, or 82%. Because Australian children receive their first measles-containing vaccine at age 12 months, the average age of the cohort with vaccine-proximate febrile seizures was 13 months, significantly younger than the 20-month average for children with non–vaccine-related febrile seizures.
In a multivariate analysis adjusted for patient age, gender, and history of prior afebrile seizures, the groups with vaccine-proximate and vaccine-unrelated febrile seizures didn’t differ significantly in terms of the proportion with a hospital length of stay greater than 1 day (20% vs. 15%), ICU admission (1.5% vs. 2.3%), seizure duration of more than 15 minutes (16% vs. 12%), repeat seizures within 24 hours (9% vs. 10%), or discharge on antiepileptic medication (4.4% vs. 4.3%).
In the developmental outcomes analysis, 62 of the children with vaccine-proximate febrile seizures, 70 with vaccine-unrelated febrile seizures, and 85 healthy controls with no seizure history underwent formal assessment using the third edition of the Bayley Scales of Infant and Toddler Development 12-24 months after their initial febrile seizure. Scores adjusted for years of maternal education were closely similar in all three groups across all five test domains: cognitive, language, motor, social-emotional, and general-adaptive.
Dr. Deng reported having no financial conflicts of interest regarding the study, which was partially funded by the Australian National Centre for Immunisation Research and Surveillance.
REPORTING FROM ESPID 2018
Key clinical point: Parents now can confidently be reassured that vaccine-proximate febrile seizures have no long-term consequences.
Major finding: as in controls with no seizure history.
Study details: This prospective case-control study comprised 1,180 children at five Australian children’s hospitals.
Disclosures: The study was partially funded by the Australian National Centre for Immunisation Research and Surveillance. The presenter reported having no financial conflicts.
Jump start immunizations in NICU
MALMO, SWEDEN – The neonatal intensive care unit often represents a lost opportunity to bring an infant fully up to date for recommended age-appropriate immunizations – but it needn’t be that way, Raymond C. Stetson, MD, declared at the annual meeting of the European Society for Paediatric Infectious Diseases.
“We were able to find that within our unit a small number of quality improvement measures enabled us to drastically increase our vaccination rate in this population. I think this shows that other units ought to be auditing their immunization rates, and if they find similar root causes of low rates our experience could be generalized to those units as well,” Dr. Stetson said.
It’s well established that premature infants are at increased risk for underimmunization. Dr. Stetson and his coinvestigators deemed the baseline 56% on-time immunization rate in their NICU patients to be unacceptable, because underimmunized infants are more vulnerable to vaccine-preventable illnesses after discharge. So using the quality improvement methodology known as DMAIC – for Define, Measure, Analyze, Improve, Control – the investigators surveyed Mayo NICU physicians and nurses and identified three root causes of the quality gap: lack of staff knowledge of the routine immunization schedule, lack of awareness of when a NICU patient’s vaccines were actually due, and parental vaccine hesitancy.
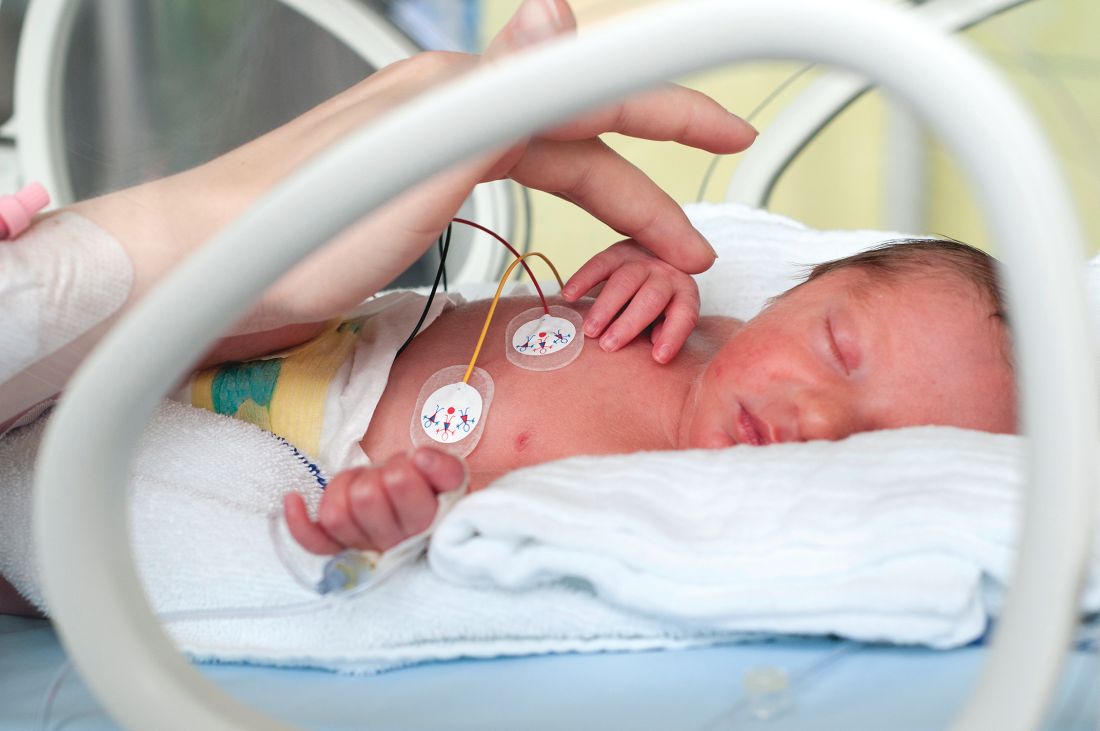
Session chair Karina Butler, MD, was clearly impressed.
“You make it sound so easy to get such an increment. What were the barriers and obstacles you ran into?” asked Dr. Butler of Temple Street Children’s University Hospital, Dublin.
“Certain providers in our group were a bit more hesitant about giving vaccines,” Dr. Stetson replied. “There had to be a lot of provider education to get them to use the resources we’d created. And parental vaccine hesitancy was a barrier for us. Of that 6% of infants who weren’t fully up to date at discharge, the majority of those were due to parental vaccine hesitancy. I think that’s still a barrier that’s going to need more work.”
Dr. Stetson reported having no relevant financial disclosures.
MALMO, SWEDEN – The neonatal intensive care unit often represents a lost opportunity to bring an infant fully up to date for recommended age-appropriate immunizations – but it needn’t be that way, Raymond C. Stetson, MD, declared at the annual meeting of the European Society for Paediatric Infectious Diseases.
“We were able to find that within our unit a small number of quality improvement measures enabled us to drastically increase our vaccination rate in this population. I think this shows that other units ought to be auditing their immunization rates, and if they find similar root causes of low rates our experience could be generalized to those units as well,” Dr. Stetson said.
It’s well established that premature infants are at increased risk for underimmunization. Dr. Stetson and his coinvestigators deemed the baseline 56% on-time immunization rate in their NICU patients to be unacceptable, because underimmunized infants are more vulnerable to vaccine-preventable illnesses after discharge. So using the quality improvement methodology known as DMAIC – for Define, Measure, Analyze, Improve, Control – the investigators surveyed Mayo NICU physicians and nurses and identified three root causes of the quality gap: lack of staff knowledge of the routine immunization schedule, lack of awareness of when a NICU patient’s vaccines were actually due, and parental vaccine hesitancy.
Session chair Karina Butler, MD, was clearly impressed.
“You make it sound so easy to get such an increment. What were the barriers and obstacles you ran into?” asked Dr. Butler of Temple Street Children’s University Hospital, Dublin.
“Certain providers in our group were a bit more hesitant about giving vaccines,” Dr. Stetson replied. “There had to be a lot of provider education to get them to use the resources we’d created. And parental vaccine hesitancy was a barrier for us. Of that 6% of infants who weren’t fully up to date at discharge, the majority of those were due to parental vaccine hesitancy. I think that’s still a barrier that’s going to need more work.”
Dr. Stetson reported having no relevant financial disclosures.
REPORTING FROM ESPID 2018
Key clinical point:
Major finding: Only 56% of 754 NICU patients from 2015 through mid-2017 were up to date for the ACIP-recommended vaccinations at discharge or transfer. After an intervention, the on-time immunization rate rose to 94% in 155 patients discharged during the first 6 months.
Study details: A study comparing 754 NICU patients prior to intervention and 155 after intervention.
Disclosures: Dr. Stetson reported having no relevant financial disclosures.
Source: Stetson R. E-Poster Discussion Session 04.
Ad hoc PCI dominates in elderly
ORLANDO – Ad hoc percutaneous coronary intervention is performed nearly six times more frequently than planned PCI in older patients undergoing elective PCI for stable coronary artery disease, according to a national study of Medicare claims data for 2009-2014.
The data showed no evident downside to ad hoc PCI in patients over age 65. Indeed, the ad hoc PCI strategy was associated with a significantly lower adjusted risk of in-hospital bleeding, compared with non–ad hoc PCI. The two approaches didn’t differ significantly in terms of in-hospital acute kidney injury or mortality, Kamil F. Faridi, MD, reported at the annual meeting of the American College of Cardiology.
In the past, concern had been voiced that ad hoc PCI – that is, PCI performed during the same session as diagnostic coronary angiography – doesn’t allow time for optimization of medical therapy prior to intervention, which might in theory result in worse outcomes. But such was not the case in a study of 169,434 patients age 65 years and up who underwent PCI for stable CAD with no evidence of acute coronary syndrome.
Moreover, ad hoc PCI offers several distinct advantages: a single vascular access, shorter net time in hospital, and lower cost, noted Dr. Faridi, of Beth Israel Deaconess Medical Center in Boston.
The proportion of elective PCIs that were performed on an ad hoc basis rose during the study years, from 77% in 2009 to 85% in 2014.
Patients who underwent ad hoc PCI were more likely to have angina symptoms before intervention. They were less likely to have peripheral vascular disease, heart failure, chronic kidney disease, complex lesion anatomy, or multivessel PCI than were patients who had planned PCI. Non–ad hoc PCI was more likely to occur at high-volume centers.
The in-hospital bleeding rate was 2.9% in the ad hoc PCI group, significantly lower than the 3.8% rate in the planned PCI patients. In an analysis adjusted for potential confounders, this translated to a 14% relative risk reduction. In-hospital acute kidney injury occurred in 8.0% of the ad hoc PCI group and 9.2% of the planned PCI group. The in-hospital mortality rate was 0.4% with ad hoc and 0.5% with planned PCI.
Dr. Faridi’s study was supported by the ACC National Cardiovascular Data Registry. He reported having no financial conflicts.
SOURCE: Faridi KF. ACC 2018, Abstract 1306-468/468
REPORTING FROM ACC 2018
Key clinical point: Ad hoc PCI in older patients has a lower bleeding risk than non–ad hoc PCI.
Major finding: Older patients undergoing ad hoc PCI for stable CAD were 14% less likely to experience significant in-hospital bleeding than were those undergoing planned PCI.
Study details: This was a retrospective study of nearly 170,000 patients age 65 years or older who underwent elective PCI for stable CAD.
Disclosures: The study was supported by the ACC National Cardiovascular Data Registry. The presenter reported having no financial conflicts.
Source: Faridi KF. ACC 2018, Abstract 1306-468/468