User login
Melanoma and Sildenafil: “Enhanced” Risk?
A recently published prospective cohort study reported that sildenafil use may increase the risk for melanoma (JAMA Intern Med. 2014;174:964-970). BRAF activation, which is pathogenic in some melanoma variants, downregulates phosphodiesterase 5A and sildenafil downregulates phosphodiesterase 5A, surmising that either one may enhance melanoma invasion. The Health Professionals’ Follow-up Study cohort was utilized, which has prospectively evaluated male health professionals’ nutrition and incidences of serious illnesses since 1986. In 2000, more than 25,000 men were interviewed about sildenafil use for erectile dysfunction, and the incidence of skin cancer was obtained by questionnaire every 2 years for 10 years. The questionnaire showed that 142 melanomas were diagnosed, and recent or prior sildenafil use (with no breakdown of frequency of dosing) was significantly associated with increased risk for melanoma (hazard ratio, 1.84 for recent use; 1.92 for ever use) adjusted for age, erectile dysfunction without sildenafil, and several skin-related and genetic melanoma risk factors. No other types of skin cancer exhibited this risk trend.
What’s the issue?
Vascular tone and manipulation of such is a contender as a hot topic in melanoma given that even aspirin has been implicated as a risk factor. Unfortunately, similar to the aspirin data, without a true continuum providing any sildenafil dosage or frequency relationship to the development of melanoma, especially for this very short half-life medication, we likely cannot consider sildenafil as a hazard in patients at high risk for melanoma as we do for smokers and oral contraceptives, or alcoholics and terbinafine. Because UV radiation is the only behavioral risk factor linked to melanoma and considering that so many of our male patients take this class of drug, in your opinion what percentage of your patients in this risk category follow strict sun protection? Should we mention this potential association to them?

Dermatologic Complications From Sojourns Abroad

Global travel has become ubiquitous for recreational, occupational, educational, humanitarian, and other purposes. For this reason, those who travel may encounter and acquire diseases from countries outside their normal habitat. A recent fascinating session from the Summer American Academy of Dermatology Meeting, “Infectious Disease and Infestations in Returned Travelers: The Americas,” highlighted current trends relating to this phenomenon.
Dr. Natasha Mesinkovska noted that Americans are most likely to travel within the Americas, particularly to Mexico, Canada, and the Dominican Republic, but also to England and France. Conversely, approximately 66 million visitors from other regions visit the United States annually. GeoSentinel surveillance clinics suggest that diarrhea and febrile illness, such as malaria, are the most common concerns reported among returning travelers who are ill. Dermatologic concerns account for approximately 18% of all problems (Int J Infect Dis. 2008;12:593-602), and many of these are either cosmopolitan infections (eg, scabies, herpes, staphylococcal) or specific tropical infections (eg, cutaneous larva migrans, tungiasis, leishmaniasis, myiasis). Because many tropical infections are associated with insect vectors, particularly mosquitoes, the prophylactic use of repellant products such as 30% to 35% DEET is advisable. Also, travelers should avoid contact with sand, soil, stagnant water, and farm animals; drink only pasteurized liquids; close hotel windows; and sleep under mosquito netting, where appropriate.
Dr. Ron (Ronald) Rapini reviewed the various diagnostic procedures that may be used for unusual infections associated with the Americas. Diagnostic techniques include potassium hydroxide preparation, routine biopsy, biopsy with special stains, culture, and serologic testing. For example, South American blastomycosis is associated with 90% sensitive and 80% specific serologic test, and Gomori methenamine-silver or Periodic acid–Schiff stains may reveal the characteristic mariner’s wheel organisms in tissue.
Dr. Dirk Elston reviewed the nuances of dealing with worms and insects. Ivermectin may be given to kill the maggots that cause myiasis; the dead maggots can then be easily removed about a week later, as spines that lodge them into the tissue have retracted. A snake venom extractor may be utilized to suck these maggots out of infested tissue. Recurring scabies may lead to chronic impetigo and thence to glomerulonephritis and renal failure. Use of the dermatoscope may aid in the diagnosis of scabies. Many cases of so-called prurigo nodularis may actually be due to repeated bed bug bites. Both reduviid bugs and wild and domestic mammals have been found to harbor the etiologic trypanosomes of Chagas disease within the continental United States (Clin Microbiol Rev. 2011;24:655-681). Cyclic fevers should at least suggest the diagnosis of the tick-borne illness babesiosis.
Dr. Jose Dario Martinez reviewed the problem of “rash and fever.” Among the common culprits associated with such a presentation are dengue and chikungunya. Both are mosquito borne and both have now been seen in the United States, most commonly in returning travelers but also rarely as autochthonous infection. “Islands of normal in a sea of red”–appearing skin associated with fever, headache, retro-orbital pain, any sign of bleeding diathesis, and thrombocytopenia suggests dengue hemorrhagic fever. IgM serologic tests may be positive approximately 5 days into the infection, but polymerase chain reaction tests may be even more rapid. Promising work on a 3-dose quadrivalent dengue vaccine recently has been published (Lancet. July 10, 2014. doi:10.1016/S0140-6736(14)61142-9). Chikungunya, once previously limited to parts of Asia and Africa, is now present in the Americas. As of August 2014, local transmission had been identified in 31 countries or territories in the Caribbean, Central America, South America, or North America including the United States. Clinically, this disorder resembles dengue with less bleeding diathesis and more severe polyarthralgia. Reverse transcription–polymerase chain reaction testing can confirm the diagnosis in less than a week after infection. Treatment is supportive only, and a vaccine is under testing.
I discussed the ever-expanding worldwide epidemic of bed bug infestation, as verified by reports on a global bed bug registry Web site. Although bed bugs have not yet been reported to transmit disease to humans, the bite is pruritic and may be associated with severe emotional ramifications (Psychosomatics. 2012;53:85-91). Bed bugs can be detected by visual inspection of typical hiding places within 3 feet of the bed; expensive but very sensitive lures and bed bug–detecting canines also can be used to verify an infestation. Clearing bed bug infestations may require a complex multipronged approach, including thorough vacuuming and steaming, placing traps and desiccants, spreading insecticides, and thermal remediation. To avoid bringing bed bugs into the home following a trip, travelers are advised to check for bed bug infestation of hotel rooms, keep luggage off the floor and hang clothing up high, and launder clothes immediately upon returning home.
What’s the issue?
Travelers are potentially subject to many complications relating to their sojourn, particularly those of an infectious nature. Bugs and worms and unicellular parasites account for many of these complications. This situation is not static but remains perpetually evolving, as evidenced by the recent and rapid appearance of chikungunya, a virus in North America. To whom would you turn for advice or consultation if your patient returned from an exotic destination with a fever and skin abnormalities with which you have no familiarity?

Mastering the Masseter Muscle: Tailored Treatment of Masseter Hypertrophy

In the article “Classification of Masseter Hypertrophy for Tailored Botulinum Toxin Type A Treatment” (Plast Reconstr Surg. 2014;134:209e-218e), Xie et al systemically classified and compared degrees of masseter hypertrophy and then prospectively used this system to tailor treatment with botulinum toxin type A. The authors identified 5 different bulging types of a contracted masseter: minimal, mono, double, triple, and excessive. Ultrasound studies and cadaver dissections were used to identify the bulging type and showed that the masseter consists of 3 different muscle layers that exhibit different directions of muscle contraction. These muscle layers are innervated by separate nerve branches that originate from the nervus massetericus, the most prominent part of the masseter bulge corresponding to the distribution region of the nervus massetericus in the central lower one-third region. The authors concluded that an injection close to the nerve endings at this site of insertion would allow for a reduced injection dosage and limited dispersion. Therefore, they chose the most prominent point of the bulging masseter while clenching as the ideal initial injection point.
What’s the issue?
The off-label use of botulinum toxin type A for the treatment of masseter hypertrophy is becoming more popular. It has been used for aesthetic volume reduction of the masseter and lower-face recontouring. Masseter hypertrophy can cause a prominent mandibular angle resulting in a wide counter of the lower face, which can be a cause of aesthetic concern in women and men as well as individuals of many ethnicities, such as those of Asian descent. The reported doses of neurotoxin as well as injection points and techniques vary, making it difficult to translate into clinical practice. Xie et al have suggested a tailored approach to the treatment of masseter hypertrophy rather than injecting in a prototypical approach. The authors had the patient clench and palpated the masseter to classify it into 1 of 5 types. Then the main injection point was into the belly of the most prominent bulge. Further injection points (range, 1–3) were used depending on the type of masseter hypertrophy. The minimal dose of botulinum toxin type A used was 20 U with the highest amount being 40 U. The greatest effect in reduction of masseter hypertrophy occurred at 3 months. Adverse effects encountered were on par with prior reports and included unnatural smile, concavity below the zygomatic arch, and even paradoxical bulging. The overall complication rate was 9.1% (20/220), but it was 60% among patients who received higher doses. With this classification system and injection pattern described, the authors noted a reduction in injection dose and therefore complication rates as well as significantly reduced masseter volume and improved lower face contour (P<.01). When it comes to masseter injections and lower-face shaping, what is your method?

Patching Psoriasis
Patch testing is one of the major diagnostic tools in the evaluation of allergic contact dermatitis. One limitation of patch testing is the use of steroids prior to testing. Because steroids may suppress a positive test reaction, the use of topical steroids on the test site or oral steroids should be discontinued for at least 2 weeks prior to testing. Therefore, it is interesting to consider the effect of biologics on the reliability of patch testing.
Kim et al (Dermatitis. 2014;25:182-190) evaluated the prevalence of positive patch tests in psoriasis patients receiving biologics and whether these results differed from those of psoriasis patients who were not receiving biologics. An institutional review board–approved retrospective chart review was performed for individuals with psoriasis who were patch tested from January 2002 to 2012 at Tufts Medical Center in Boston, Massachusetts. Patients were selected if they had a history of psoriasis, psoriatic arthritis, and patch testing as identified by International Classification of Diseases, Ninth Revision, codes 696.1, 696.0, and 95044, respectively, in their medical records. Patients were patch tested using a modified North American Contact Dermatitis Group standard and cosmetics series. Readings were performed at 48 hours and 72 to 96 hours. The North American Contact Dermatitis Group grading system was used to grade reactions.
The chart review included 15 psoriasis patients who were on biologics (cases) and 16 psoriasis patients who were not on biologics (control subjects). The biologics used were ustekinumab (n=7), etanercept (n=4), adalimumab (n=3), and infliximab (n=1). The authors determined that 80% (12/15) of cases had at least 1 positive reaction compared with 81% (13/16) of control subjects, 67% (10/15) of cases had 2+ positive reactions compared with 63% (10/16) of control subjects, and 27% (4/15) of cases had 3+ positive reactions compared with 38% (6/16) of control subjects. These differences were not statistically significant.
Given the limitation of the small number of patients evaluated, the authors concluded that biologics do not appear to influence the abilities of patients with psoriasis to mount a positive patch test.
What’s the issue?
This study is small, but the findings do give an indication that the biologic agents utilized for psoriasis do not suppress patch test reactions. These data are not typically what we collect in this population, but it is nice to know. What has been your experience in patch testing patients on biologic therapy?

The Asterisk
In early July, a media blast regarding the safety of spray sunscreens was disseminated. Consumer Reports commented on a US Food and Drug Administration (FDA) investigation of sunscreen in the spray vehicle, stating that consumers should not apply them on children until the safety of these agents is determined by an ongoing FDA analysis. The focus of FDA concern is the inhalation of nanoparticles in these products, particularly those containing titanium dioxide. The report also provided instructions for safe application of spray sunscreen in adults, such as avoiding the face and applying evenly for best results.
What’s the issue?
I read this consumer article with great interest and attention. I not only use spray sunscreen on my toddler and myself, but I also often recommend it to patients who despise the feel and inconvenience of cream-based sunscreens. Also, the ability to independently reach areas such as the mid-back provides ease of application in the spray form. That being said, I do note that these sunscreens should not be used on the face and should be applied outdoors to reduce inhalation. The age of nanomedicine provides an unknown risk, given the potential of new and more invasive chemical exposure. However, the aggressiveness with which this report was disseminated through the press was not well founded.
The FDA started this investigation in 2011, which was disclosed by Consumer Reports using a tiny asterisk in the July 2014 report. The FDA has not made any statements for or against spray sunscreens except to say that consumers should avoid open flames during application. In fact, the American Academy of Dermatology’s educational page on sunscreen has acknowledged the unknown risk of spray sunscreens since 2011. Given that this consumer “update,” which did not provide any new information, was released by the press in the throes of the summer sun, it has bolstered patient doubts about what dermatologists recommend regarding sunscreen and its safety. Do you use or recommend spray sunscreens? How do you feel about the manner in which the popular media depicts sunscreens in recent years?
We want to know your views! Tell us what you think.
Reader Comments
I usually ask our patients to apply sprays outside and directed so the spray is dispersed downwind if possible. This at the beach or golf course. I also ask them to hold their breaths to not inhale the mist. I still however ask to use a cream or lotion at home and use the sprays as a secondary application.
--Michael A. Scannon, MD
Darrel Rigel showed several years ago that most people use one quarter to one third the proper amount of sunscreen needed to attain the SPF on the label. Sprays encourage using even less. In a use test I performed for a sunscreen company several years ago, our subjects had white round patches of unburned skin among their sunburns. Uniform coverage is difficult to achieve.
--Christopher G. Nelson, MD
Filler Placement

In a recently published article in the Journal of Cosmetic Dermatology (2014;13:91-98), Goodier et al compared low volume deep placement cheek injection and mid to deep dermal nasolabial fold injection for the correction of nasolabial folds with hyaluronic acid (HA) filler. In this split-face study, 3 injection techniques were utilized: (1) deep bolus injection into the mid to lateral cheek, (2) mid to deep dermal injection into the nasolabial fold, or (3) both techniques. Results were assessed in 4 to 6 weeks by a blinded investigator.
Globally, patients and investigators noted no statistical difference using the wrinkle severity score. All 3 techniques showed improvement. Patients preferred injection using both techniques, which was associated with the greatest amount of filler product injected. The authors concluded that injection of a dermal HA filler into either the nasolabial fold or mid to lateral cheek resulted in similar improvement for the correction of the nasolabial folds.
What’s the issue?
Although this study used a single HA agent, it showed that patients’ nasolabial folds improved using both techniques: deep depot placement in the cheeks and mid to deep dermal nasolabial fold injection. It may come as no surprise that patients in this study showed a slight preference for both techniques. Although the trend now is to add volume and not fill, a combination of these techniques may give the best outcomes. What do you use in your practice? A study comparing different HA fillers available or one comparing HA to non-HA products would be interesting. Which agents do you use in your practice for nasolabial fold correction?

Accountable Care Organizations: Theory and Practice
Since early 2012, a growing number of independent physician groups, physician-hospital organizations, hospitals and their employed physicians, and fully integrated health systems have entered into contracts with both CMS and commercial insurers to become accountable care organizations (ACOs). It is estimated that the health care of close to 20 million patients is now being provided under such arrangements [1].
ACOs are one manifestation of payment reform intended to slow the unsustainable cost of health care in the United States. While the details of the payment models vary widely, with many combinations of fee-for-service, bundled, and capitated arrangements, the underlying goal is consistent: ACOs are held accountable for both the cost and quality of care for a specific population. While some ACO models offer the promise of shared savings alone, others offer potential savings but also entail associated risk [2]. That pre-specified quality targets have to be met before savings can be accessed is presented as a safeguard against the perceived excesses of the managed care experience of the 1990s.
To succeed as an ACO, health care organizations face sobering structural, fiscal, and—perhaps most daunting—cultural challenges. Coordinating care between providers [3,4] and across episodes and sites of care—not a traditional strength of many provider entities—will become increasingly important. Creating equitable systems to distribute whatever savings are garnered may disrupt traditional relationships between primary care and specialist providers. Convincing organizations to make the necessary investment in an “evolved” primary care infra-structure—a prerequisite for accomplishing the goals of decreasing unnecessary and expensive health resource utilization—will be problematic in an era of shrinking overall reimbursement [5]. Finally, convincing clinicians that this model means that they are quite literally “in it together” will challenge long-standing and proud departmental and divisional identities and silos [6].
Recognizing that this grand experiment is still very much in its formative stages, we nonetheless thought that this was an opportune time to examine ACOs from several perspectives. Over the next few issues and beginning with this issue [7], we will sequentially hear from an expert in health care policy analysis, a clinician-leader working in a high-functioning patient-centered medical home practice, and a team in a large health care system charged with the overall success of population health management. We are confident that you will find these observations timely, interesting, and informative. We welcome your feedback.
1. Muhlestein D. Accountable care growth in 2014: a look ahead. Health Affairs blog. 2014 Jan 29. Available at http://healthaffairs.org/blog/2014/01/29/accountable-care-growth-in-2014-a-look-ahead/.
2. Weissman JS, Bailit M, D’Andrea G, Rosenthal MB. The design and application of shared savings programs: lessons from early adopters. Health Affairs 2012;31:1959–68.
3. Greenberg JO, Barnett ML, Spinks MA, et al. The “medical neighborhood”: integrating primary and specialty care for ambulatory patients. JAMA Intern Med 2014;174:454–7.
4. Song Z, Sequist TD, Barnett ML. Patient referrals: a linchpin for increasing the value of care. JAMA. Published online July 03, 2014. Available at http://jama.jamanetwork.com/article.aspx?articleid=1886863.
5. Rittenhouse DR, Shortell SM, Fisher ES. Primary care and accountable care – two essential elements of delivery-system reform. N Engl J Med 2009;361:2301–3.
6. Song Z, Lee TH. The era of delivery system reform begins. JAMA 2013;309:35–6.
7. Song Z. Accountable care organizations: early results and future challenges. J Clin Outcomes Manag 2014;8:364–71
Since early 2012, a growing number of independent physician groups, physician-hospital organizations, hospitals and their employed physicians, and fully integrated health systems have entered into contracts with both CMS and commercial insurers to become accountable care organizations (ACOs). It is estimated that the health care of close to 20 million patients is now being provided under such arrangements [1].
ACOs are one manifestation of payment reform intended to slow the unsustainable cost of health care in the United States. While the details of the payment models vary widely, with many combinations of fee-for-service, bundled, and capitated arrangements, the underlying goal is consistent: ACOs are held accountable for both the cost and quality of care for a specific population. While some ACO models offer the promise of shared savings alone, others offer potential savings but also entail associated risk [2]. That pre-specified quality targets have to be met before savings can be accessed is presented as a safeguard against the perceived excesses of the managed care experience of the 1990s.
To succeed as an ACO, health care organizations face sobering structural, fiscal, and—perhaps most daunting—cultural challenges. Coordinating care between providers [3,4] and across episodes and sites of care—not a traditional strength of many provider entities—will become increasingly important. Creating equitable systems to distribute whatever savings are garnered may disrupt traditional relationships between primary care and specialist providers. Convincing organizations to make the necessary investment in an “evolved” primary care infra-structure—a prerequisite for accomplishing the goals of decreasing unnecessary and expensive health resource utilization—will be problematic in an era of shrinking overall reimbursement [5]. Finally, convincing clinicians that this model means that they are quite literally “in it together” will challenge long-standing and proud departmental and divisional identities and silos [6].
Recognizing that this grand experiment is still very much in its formative stages, we nonetheless thought that this was an opportune time to examine ACOs from several perspectives. Over the next few issues and beginning with this issue [7], we will sequentially hear from an expert in health care policy analysis, a clinician-leader working in a high-functioning patient-centered medical home practice, and a team in a large health care system charged with the overall success of population health management. We are confident that you will find these observations timely, interesting, and informative. We welcome your feedback.
1. Muhlestein D. Accountable care growth in 2014: a look ahead. Health Affairs blog. 2014 Jan 29. Available at http://healthaffairs.org/blog/2014/01/29/accountable-care-growth-in-2014-a-look-ahead/.
2. Weissman JS, Bailit M, D’Andrea G, Rosenthal MB. The design and application of shared savings programs: lessons from early adopters. Health Affairs 2012;31:1959–68.
3. Greenberg JO, Barnett ML, Spinks MA, et al. The “medical neighborhood”: integrating primary and specialty care for ambulatory patients. JAMA Intern Med 2014;174:454–7.
4. Song Z, Sequist TD, Barnett ML. Patient referrals: a linchpin for increasing the value of care. JAMA. Published online July 03, 2014. Available at http://jama.jamanetwork.com/article.aspx?articleid=1886863.
5. Rittenhouse DR, Shortell SM, Fisher ES. Primary care and accountable care – two essential elements of delivery-system reform. N Engl J Med 2009;361:2301–3.
6. Song Z, Lee TH. The era of delivery system reform begins. JAMA 2013;309:35–6.
7. Song Z. Accountable care organizations: early results and future challenges. J Clin Outcomes Manag 2014;8:364–71
Accountable Care Organizations: Early Results and Future Challenges
From the Harvard Medical School and the Department of Medicine, Massachusetts General Hospital, Boston, MA.
In recent years, the growth of health care spending has climbed to the top of the domestic policy agenda. Medicare spending growth is now recognized as the biggest driver of the federal debt [1,2].Medicaid spending growth puts similar pressure on states. In the private sector, employee health care costs increasingly weigh on company balance sheets, affecting business operations and employee wages. All the while, individuals and families face insurance premium growth that far outpaces real income growth.
Out of this recent history emerged a broad recognition that health care spending growth is unsustainable at current rates. If Medicare spending continues to exceed gross domestic product (GDP) by 2.5 percentage points per year—the traditional gap over the past 4 decades—a greater than 160% increase in individual income taxes would be needed to pay for it [3].Even if the gap was 1 percentage point, the increase in income taxes needed would still be over 70%, with consequent contraction in GDP of 3% to 16% by 2015 [4,5].Other consequences, such as significant cuts in Medicare benefits or shifting of costs onto patients, are equally undesirable [6,7].
Policy options for slowing health care spending are varied. Some focus on changing the provider’s incentives, while others focus on changing the patient’s incentives. Some are based on federal solutions [8],while others are based on market solutions [9].In the current policy landscape, payment reform for physicians and hospitals has emerged as a leading candidate for addressing health care spending. Public and private payers are increasingly changing the way that providers are paid, moving away from fee-for-service towards bundled or global payments for populations of patients. Physicians and hospitals are in turn forming integrated provider organizations to take on these new payment systems. The pace of this change has been growing.
Key Features of the ACO Concept
An accountable care organization (ACO) is a group of providers—that can include both physicians and hospitals—that accepts joint responsibility for health care spending and quality for a defined population of patients. The ACO concept can be considered an extension of the staff-model health maintenance organization (HMO) [13,14].It also shares features with the patient-centered medical home (PCMH) model in its focus on a robust primary care nexus that serves to coordinate a patient’s care [15,16].Three key characteristics are embedded in this definition.
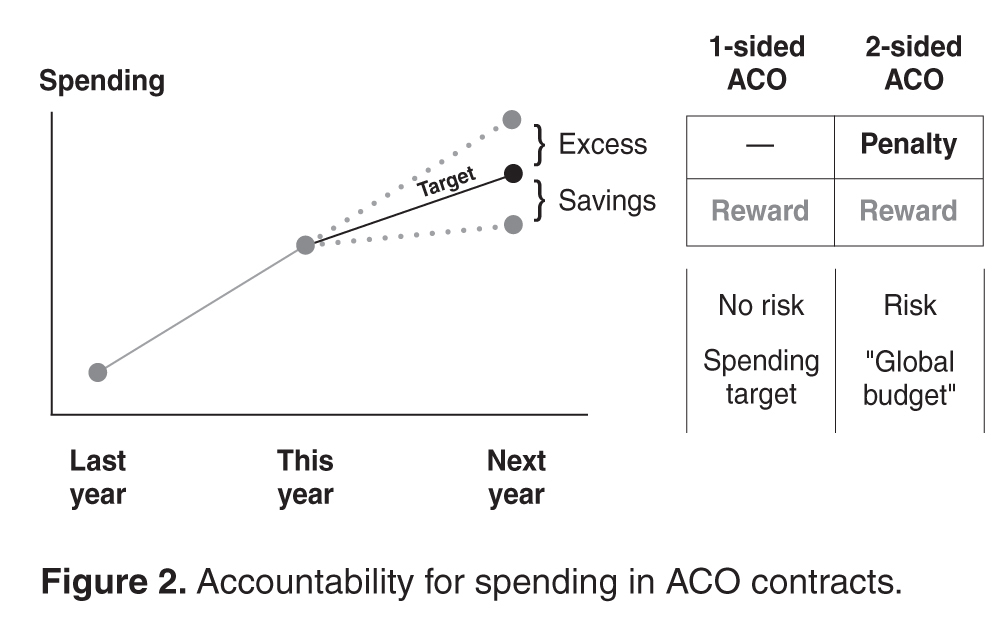
The first is joint accountability. In an ACO contract, incentives for providers are agreed upon at the organizational level. Physicians and hospitals bear the financial risks and rewards of the ACO contract together. Shared savings, quality bonuses, and other incentives are determined by how the organization performs as a whole rather than any individual physician, practice, or hospital. In this way, physicians across specialties and care settings are incentivized to approach patient care collectively and coordinate care more effectively.
Third, an ACO is responsible for the care of a population of people. Each year, spending and quality are measured for the population attributed, or assigned, to the ACO. Attribution of patients to organizations can take place in two ways. It can be prospective, meaning that before the start of a contract year, the ACO knows exactly the patients whose spending and quality it is responsible for. This is typically more feasible in commercial ACO contracts, especially in the HMO population, where patients designate a primary care physician at the beginning of the year. Otherwise, attribution is typically retrospective, such as in the Medicare ACO programs, where beneficiaries are assigned to organizations at the end of a contract year based on the organization which accounted for the plurality of a patient’s medical spending or primary care spending.
Evidence to Date
While formal results from most ACOs today are not yet available, several notable ACO experiments have been evaluated. These include early results from the Medicare ACO programs, previous evaluations of the Medicare Physician Group Practice Demonstration (a predecessor of today’s ACO contracting model), and early results from commercial ACO contracts, such as the Blue Cross Blue Shield of Massachusetts global budget contract.
In interpreting lessons from these evaluations, several questions are worth keeping in mind. If a new payment system is correlated with changes in medical spending, is this explained by underlying changes in prices or in quantities? Since medical spending is the product of prices of services and quantities (volume) of services, an intervention that affects spending must affect either the prices or the volume of care. In the Medicare program, where prices are standardized, a global budget contract that works off of the underlying physician fee schedule would only affect spending through volume. In the private insurance sector, however, an ACO contract may affect spending through both volume and prices, since variations in prices across providers creates an opportunity for savings if care is obtained through a less expensive provider.
Separate from its relationship to medical spending, which is measured through the claims submitted by providers, what is the connection between a new payment system and total payouts from the insurer to the provider? An ACO contract contains a variety of incentives to providers that may generate additional payments from the insurer (most notably shared savings and quality bonuses). These non-claims payments may partially or entirely offset savings obtained through medical claims, making them an important dimension in the evaluation of the contract. Yet they are also different from medical claim dollars in a meaningful way. Changes in medical spending reflect underlying physician (or patient) behavior—what care is delivered and how much of it is delivered—whereas non-claims payments reflect the incentive structure of the contract.
On the quality dimension, it is worth noting whether a new payment system has similar effects on process and outcome measures. Process measures, which have been widely used by health plans, are operationally similar to additional items on a fee schedule, whereby the delivery of a service effectively generates a payment. Clinical outcome measures, such as blood pressure or cholesterol, and patient experience measures, on the other hand, cannot be fulfilled by simply checking off a box. Therefore, these measures may represent quality in a more meaningful way.
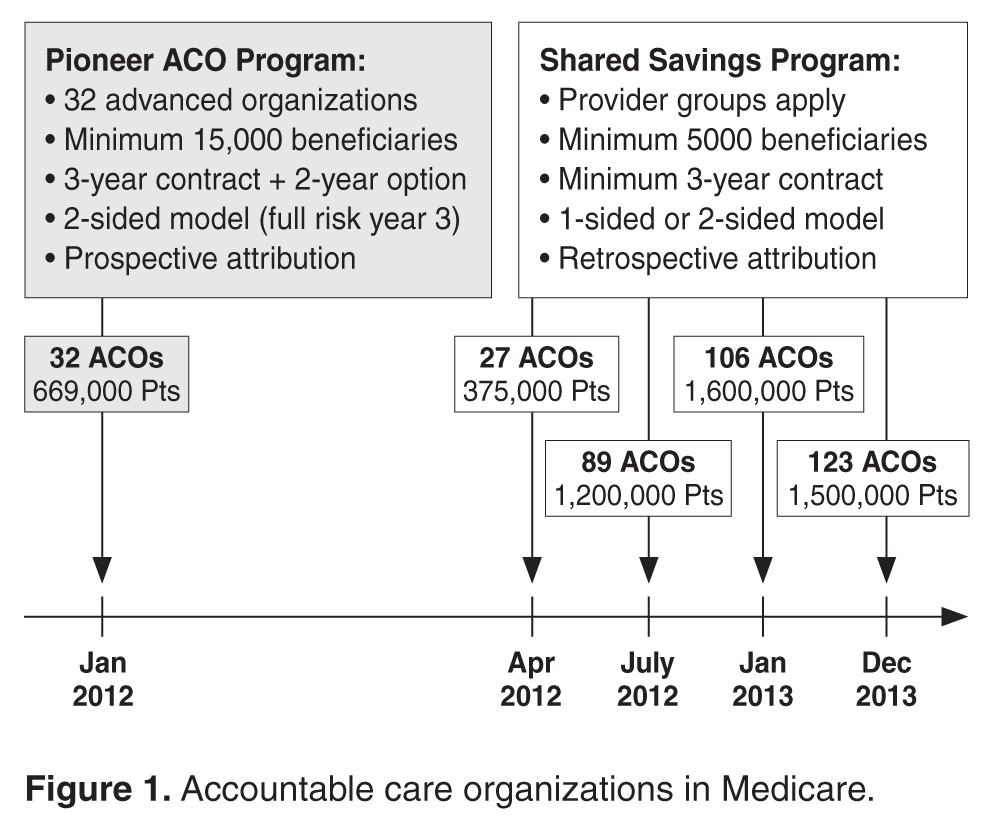
Early Results from Medicare ACOs
Thirty-two provider organizations entered the Pioneer ACO program in 2012, with about 669,000 Medicare beneficiaries attributed to these organizations. According to CMS, medical spending growth for ACO beneficiaries was 0.3% in the first year, compared to 0.8% for similar beneficiaries outside of these organizations [18].This generated a gross savings of $87.6 million in 2012, of which $33 million were returned to the Medicare trust fund. These savings were driven by 13 ACOs, with another 17 ACOs not reporting statistically significant changes in spending and 2 ACOs garnering losses with spending above the target of about $4 million total. Lower rates of admissions and readmissions largely explained the savings. A separate analysis comparing these ACOs to their local markets estimated a higher year 1 savings of $147 million dollars, driven by 8 ACOs whose savings ranged from $396 to $1224 per beneficiary per year [19].
Pioneer ACOs also earned over $76 million for quality. In the first year, quality bonuses were awarded for the reporting of quality measures rather than for performance, and all 32 ACOs successfully reported. According to CMS, Pioneer ACOs on average performed better than fee-for-service Medicare beneficiaries on 15 clinical quality measures for which comparison data were available, including blood pressure control and cholesterol control for diabetic patients. A complete analysis of quality performance is not yet available.
In the Medicare Shared Savings Program, interim results from CMS for the first 2 cohorts of ACOs showed that 29 of the 114 organizations lowered spending sufficiently enough to generate shared savings while 2 organizations had shared losses [20].This suggests that the great majority of ACOs spent close to their target. Final results on spending and quality are pending.
Results from the Medicare Physician Group Practice Demonstration
Ten provider organizations entered one-sided ACO-type contracts with Medicare in 2005 via the Physician Group Practice Demonstration. In this contract, organizations shared in savings provided that their spending was at least 2% below target and they achieved threshold performance on certain quality measures, most of which were process metrics.
In year 1, only one organization decreased spending enough to earn a shared savings, but after 3 years, five organizations had generated shared savings, although half of the savings were awarded to one organization [21].A recent analysis showed that 4 organizations sustained shared savings by the end of the program, with savings concentrated in acute care, readmissions, and beneficiaries who are dually eligible for Medicaid. Across the 10 organizations, financial performance ranged from average savings of $866 to increased spending of $749 per beneficiary per year [22].In total, about $78 million in savings were generated by this demonstration. Although a positive finding, this is a relatively small amount in the context of total Medicare expenditures [23,24].
On quality, all organizations met threshold performance on at least 29 of the 32 measures by the end of 5 years [21]. Most of these were process measures focused on coronary artery disease, diabetes, heart failure, hypertension, and preventive care [25].
Early Results from Commercial ACO Contracts
One of the early commercial ACO contracts to be evaluated was the Blue Cross Blue Shield of Massachusetts Alternative Quality Contract (AQC) [26].Initially implemented in 2009, the AQC is a multi-year contract that pays provider organizations a risk-adjusted global budget over the continuum of care. Seven organizations in Massachusetts entered the contract in the first year, and 4 more entered in 2010. Enrollees in HMO plans were prospectively attributed to their ACO by their designation of a primary care physician. The AQC is a two-sided contract that offered an additional 10% of an organization’s budget as a bonus for performance on 64 quality measures, half outpatient measures and half inpatient. Budget growth rates were tied to inflation and terms of its growth were negotiated with the organizations [27].
Over the first 2 years, the contract was associated with a decrease in medical spending of about $90 per enrollee per year, a –2.8% change (–1.9% in year 1 and –3.3% in year 2) [28].These savings were concentrated in procedures, imaging, and tests in the outpatient facility setting, and were largely explained by lower prices achieved by referring patients to less expensive providers. They were also concentrated in organizations that entered the AQC from fee-for-service, rather than prior risk contracts, and driven by enrollees with the highest expected spending. Over the second year, decreases in volume for certain services, such as percutaneous coronary interventions, began to contribute more to the savings [29].However, medical savings in the first 2 years were exceeded by non-claims payments, including shared savings and quality bonuses [27,28].The AQC was also associated with improvements in outpatient quality, including chronic care management measures (3.7 percentage points increase per year), adult preventive measures (0.4 percentage points per year), and pediatric quality measures (1.3 percentage points per year). Outcome measures such as hemoglobin A1c, LDL cholesterol, and blood pressure also showed an upward trend in the early years [28].Inpatient quality measures have yet to be examined.
Elsewhere in the country, Cigna’s Collaborative Accountable Care model was rolled out in 2009 with provider organizations in New Hampshire, Texas, and Arizona. A one-sided shared savings contract, it features a care coordination fee that is counted towards a practice’s medical spending, helping fund registered nurses who work as care coordinators. Interim results in 2012 suggested cost savings and quality improvements, but they were not statistically significant [30].A two-sided contract between Blue Shield of California and the California Public Employees’ Retirement System slowed medical costs by shortening admission and reducing readmissions [31].Most recently, an accountable care partnership between Anthem Blue Cross and HealthCare Partners physician group in California claimed $4.7 million in savings in the first half of 2013 for 55,000 patients in preferred provider organization (PPO) plans [32].These savings were driven by an 18% reduction in inpatient days, 4% reduction in overall admissions, and a 4% reduction in visits for radiology and lab tests, although specific price and volume contributions are yet unknown. Similar to the AQC, the Anthem contract is a 5-year agreement. Unlike the initial AQC contract, shared savings were tied to meeting a quality threshold and HealthCare Partners did not bear downside risk in year 1 [33].
Lessons Learned
Strengths of the ACO Model
Evidence to date points to both the potential of ACOs to slow spending and improve quality, but also the significant obstacles that they face. One of the encouraging lessons so far is that quality of care need not be threatened by a contract that rewards savings, provided that meaningful incentives for quality are in place. In both public and private two-sided contracts, process quality seemed to consistently improve. However, less is known about performance on outcome measures, which is ultimately a more meaningful metric for patients.
Broadly speaking, ACO contracts may be able to induce changes in physician behavior that could lead to medical savings. The low hanging fruit in Medicare seems to be admissions and readmissions, while that in commercial contracts may be lower prices obtained by changing referral patterns. While these medical savings reveal changes in clinical decision-making, it is still poorly understood whether clinical choices geared towards higher value can extend to areas of utilization where wasteful care may be concentrated. Little is also known about whether an ACO’s physicians and hospitals are in agreement over these changes in utilization or referral patterns, given their consequences for referral business and admissions. Moreover, there has yet to be evidence suggesting that medical savings can be larger than non-claims payments (rewards and bonuses to the ACOs) in a given year, generating net savings to the health care system. This may well take time to materialize given the initial investment costs and inducements for provider participation embedded in the early year incentives, but it is an important metric of success.
ACOs serve as a vehicle for payment reform and organizational reform among providers. They bring physicians across specialties and hospitals together under the same contractual roof, allowing the organization to determine how it allocates its resources under the spending target. Historically, policies aimed to slow health care spending have focused on either cutting prices (provider fees) or constraining volume (gatekeeping, prior authorization, and utilization review, etc.), but both types of strategies have been complicated by unintended consequences. Medicare fee cuts have traditionally been followed by compensatory increases in utilization or intensity of coding, offsetting the intended savings to a significant degree [34–37].Managed care techniques have met resistance from both physicians and patients [38,39].A spending target or budget takes an alternative approach; rather than controlling prices or quantities directly, it seeks to control total spending. Although the underlying fee schedule is retained for accounting, a spending target or especially a global budget pushes the organization to decide what care is high or low value.
A two-sided contract imposes stronger incentives on the ACO than a one-sided contract, which is both a strength and a weakness. While ACOs facing downside risk may respond earlier to the incentives, as some of the evidence thus far suggests, this risk may also propel ACOs to abandon this contracting model. In the Medicare Pioneer ACO program, for example, 9 of the 32 organizations exited the contract after year 1, which was allowed given the voluntary nature of participation. Seven organizations opted for the one-sided Medicare Shared Savings Program in year 2 and two left the ACO programs altogether. Downside risk was thought to be a principal concern for these organizations [40].Massachusetts providers in the AQC have thus far remained in the contract, but the AQC was a multi-year agreement to begin with.
Spillovers are another potential strength of the ACO model. Given that organizations care for patients across multiple payers, strong payment incentives in one payer population may affect care broadly. In the AQC, for example, recent evidence showed slowing of spending for Medicare beneficiaries associated with the contract in similar settings and categories of care as for the Blue Cross Blue Shield patients [41].
Weaknesses of the ACO Model
Still in its nascent stages, the ACO paradigm faces a number of challenges. Some relate to inherent weaknesses of the model, while others relate to the institutions and economics of the broader health care economy. At a contractual level, a key challenge is setting the target growth rate of the budget. If too low, providers may be overly constrained; if too high, providers may not have enough incentive to change practice. In an extreme case, if the target is set above what spending would have been under the old arrangement, an ACO contract can in fact be cost increasing on claims spending alone. Financial rewards such as shared savings and quality bonuses can help offset the risk, but they also make it more difficult for the ACO contract to generate net savings.
Achieving the right balance of risks and rewards is difficult. As noted above, a one-sided contract may not be strong enough to induce behavior change [42,43],but a two-sided contract may be too risky, driving providers who are unable to align incentives and coordinate care to exit the model [44].Although the percentage of shared risk borne by payer versus provider can be negotiated, putting financial risk on providers in a palatable way will be a key challenge. Financial risk can be more daunting if ACOs do not know in advance which patients they are responsible for, as in contracts with retrospective attribution rules and enrollees in unmanaged plans. A payer can help providers handle risk by sharing data on spending and identifying potential areas of overuse and low value care. Payers can help further by implementing risk corridors, providing reinsurance, or improving risk adjustment of the organization’s global budget. But with all that said, it remains to be seen whether providers around the country will be willing to bear substantive risk.
Within the ACO, a primary challenge is dividing up risks and rewards among constituent providers. How much shared savings are given to the hospital, to primary care physicians, or to specialists? What share should each specialty receive? What about shared losses, should spending exceed the target? In a two-sided ACO contract, these questions are particularly salient as global budgets change the business model for providers. Revenue centers under fee-for-service become cost centers. Organizations are confronted with difficult tradeoffs. The ability of providers across specialties to find common ground will be crucial, and leadership from providers will be key [45].Physicians have established themselves as leaders of the majority of ACOs today [46].It remains to be seen whether these organizations can keep providers together through the tradeoffs.
Patient trust in the ACO model has yet to be established. The managed care backlash of the 1990s suggests that patient buy-in will be crucial for the sustainability of ACOs. ACOs can have similarities to the HMO that traditionally produce negative associations, including downside risk, gatekeeping, or managed care techniques. To earn patients’ trust, ACOs will need to prove their value, such as through delivering better preventive care, less expensive care, more holistic care through stronger teams of providers, or smoother transitions of care across settings. The task of primary care medical homes to provide patient-centered care and coordinate across specialists effectively will be crucial. While today’s ACOs may be better positioned because of risk sharing, quality bonuses, risk adjustment, electronic medical records, or other innovations, the patient’s experience may ultimately be the arbiter.
Broader Challenges
While clinical integration is a central tenet of ACOs, consolidation between providers is simultaneously a chief concern for policymakers. Consolidation generally reduces competition and drives up prices, which is at odds with the goals of cost containment [47,48].Across the nation, physicians are consolidating with hospitals and health systems at an increasing rate, with recent surveys reporting that the proportion of independent physicians has steadily declined to below 50% [49–52].Increasing the number of covered lives is a dominant growth strategy under risk contracts, and more covered lives also increases an ACO’s bargaining power during acquisitions of specialist practices, whose referrals are better protected by inclusion in the provider network. As this trend continues, its effect on commercial prices will likely be scrutinized [53,54].
The ACO paradigm may also have significant effects on the physician labor market. Over the past 4 decades, the rate of physician specialization has grown dramatically [55].Fee-for-service incentives were aligned with specialization, but a rapid transition to alternative payment systems may disrupt the more gradually evolving physician labor market. Most medical school graduates today choose to specialize, as do most graduates of general medicine training programs [56,57],yet it is unclear to what degree the demand for specialists will continue to grow in the accountable care era. Specialty services tend to be of higher cost than generalist services. In some situations, high-cost services are more likely to be of lower value [58–60].Yet having specialists allows an organization to integrate services across the continuum of care, for which they are now financially responsible. As a new generation of specialists prepares to enter practice, whether the health care system will be able to support them and fulfill their expectations about their practice environment may be in question.
Looking into the Future
The landscape of payment and organization in health care will likely continue to migrate towards the ACO concept [61,62]. As the federal government, states, and individual payers move in similar directions, physicians and hospitals will face increasing pressures to change and adapt to new incentives surrounding cost and quality. Whether ACOs succeed in slowing spending while improving quality may have important ramifications for future stages of health care reform. For example, the growing debate in Washington, DC, over the future of Medicare financing may be informed, in part, by whether ACOs succeed within the traditional Medicare program. Market-based reforms, such as converting Medicare into a premium support program whereby private insurers compete to insure Medicare beneficiaries for a pre-defined contribution from the federal government, have been gaining momentum in recent years. Although not without concerns, such proposals would expect to gain consideration if the ACO model does not succeed.
Perhaps the most meaningful contribution of the ACO model is that it gives providers a reason to change the culture of medicine. It asks providers across specialties to work together and coordinate care in a way that was not rewarded under fee-for-service. It asks organizations to stitch the separate pieces of the patient’s care trajectory together through teamwork. In the long run, this may be the most intangible but substantive legacy that the ACO model provides. Under a single, collective contract at the organizational level, providers are quite literally in it together. If providers can break down silos, improve care coordination, and manage population health with a collective vision towards keeping patients healthy, the ACO paradigm would be able to claim a profound achievement. Such changes, however, will take time and they are not guaranteed.
Corresponding author: Zirui Song, MD, PhD, Department of Medicine, Massachusetts General Hospital, 55 Fruit St., Boston, MA 02114, zirui_song@post.harvard.edu.
Funding/support: Supported by a grant from the National Institute on Aging F30 AG039175.
Financial disclosures: None.
1. Orszag PR, Ellis P. The challenge of rising health care costs—a view from the Congressional Budget Office. N Engl J Med 2007;357:1793–5.
2. Chernew ME, Hirth RA, Cutler DM. Increased spending on health care: long- term implications for the nation. Health Aff (Millwood) 2009;28:1253–5.
3. Congressional Budget Office. Financing projected spending in the long run. Washington, DC: Congressional Budget Office; 2007 Jul 9.
4. Financing projected spending in the long run: letter from Peter R. Orszag, director, Congressional Budget Office, to Senator Judd Gregg, 9 Jul 2007.
5. Baicker K, Chernew ME. The economics of financing Medicare. N Engl J Med 2011;28;365:e7.
6. Chernew ME, Baicker K, Hsu J. The specter of financial armageddon—health care and federal debt in the United States. N Engl J Med 2010;362:1166–8.
7. Newhouse JP. Assessing health reform’s impact on four key groups of Americans. Health Aff (Millwood). 2010;29:1714–24.
8. Emanuel E, Tanden N, Altman S, et al. A systemic approach to containing health care spending. N Engl J Med 2012;367:949–54.
9. Antos JR, Pauly MV, Wilensky GR. Bending the cost curve through market-based incentives. N Engl J Med 2012;367:954–8.
10. Centers for Medicare and Medicaid Services. More partnerships between doctors and hospitals strengthen coordinated care for Medicare beneficiaries. 2013 Dec 23.
11. Fisher ES, McClellan MB, Safran DG. Building the path to accountable care. N Engl J Med 2011;365:2445–7.
12. Muhlestein D. Accountable care growth in 2014: a look ahead. Health Affairs Blog. 2014 Jan 29. Available at http://healthaffairs.org/blog/2014/01/29/accountable-care-growth-in-2014-a-look-ahead/.
13. Fisher ES, Shortell SM. Accountable care organizations: accountable for what, to whom, and how. JAMA 2010;304:1715–6.
14. Fisher ES, Staiger DO, Bynum JP, Gottlieb DJ. Creating accountable care organizations: the extended hospital medical staff. Health Aff (Millwood) 2007;26:w44–w57.
15. Rittenhouse DR, Shortell SM. The patient-centered medical home: will it stand the test of health reform? JAMA 2009;301:2038–40.
16. Bodenheimer T, Grumbach K, Berenson RA. A lifeline for primary care. N Engl J Med 2009;360:2693–6.
17. Centers for Medicare and Medicaid Services. Improving quality of care for Medicare patients: accountable care organizations. 2011 Oct 20.
18. Centers for Medicare and Medicaid Services. Press release: Pioneer accountable care organizations succeed in improving care, lowering costs. 2013 Jul 16. Available at www.cms.gov/Newsroom/MediaReleaseDatabase/Press-Releases/2013-Press-Releases-Items/2013-07-16.html.
19. L&M Policy Research. Effect of Pioneer ACOs on Medicare spending in the first year. 2013 Nov 3. Available at http://innovation.cms.gov/Files/reports/PioneerACOEvalReport1.pdf.
20. Centers for Medicare and Medicaid Services. Performance year 1 interim results for ACOs that started in April and July 2012. 2014 Jan 30. Available at www.cms.gov/Medicare/Medicare-Fee-for-Service-Payment/sharedsavingsprogram/Downloads/PY1-InterimResultsTable.pdf.
21. Wilensky GR. Lessons from the Physician Group Practice Demonstration — a sobering reflection. N Engl J Med 2011;365:1659–61.
22. Colla CH, Wennberg DE, Meara E, et al. Spending differences associated with the Medicare Physician Group Practice Demonstration. JAMA 2012;308:1015–23.
23. Berwick DM. Launching accountable care organizations—the proposed rule for the Medicare Shared Savings Program N Engl J Med 2011;364:e32.
24. Haywood TT, Kosel KC. The ACO model—a three-year financial loss? N Engl J Med 2011;364.
25. Iglehart JK. Assessing an ACO prototype—Medicare’s Physician Group Practice Demonstration. N Engl J Med 2011;364:198–200.
26. Chernew ME, Mechanic RE, Landon BE, Safran DG. Private-payer innovation in Massachusetts: the “Alternative Quality Contract.” Health Aff (Millwood). 2011;30:51–61.
27. Song Z, Safran DG, Landon BE, et al. Health care spending and quality in year 1 of the alternative quality contract. N Engl J Med 2011;365:909–18.
28. Song Z, Safran DG, Landon BE, et al. The ‘Alternative Quality Contract,’ based on a global budget, lowered medical spending and improved quality. Health Aff (Millwood). 2012;31:1885–94.
29. Song Z, Fendrick AM, Safran DG, et al. Global budgets and technology-intensive medical services. Healthcare (Amst) 2013;1:15–21.
30. Salmon RB, Sanderson MI, Walters BA, et al. A collaborative accountable care model in three practices showed promising early results on costs and quality of care. Health Aff (Millwood). 2012;31:2379–87.
31. Markovich P. A global budget pilot project among provider partners and Blue Shield of California led to savings in first two years. Health Aff (Millwood) 2012;31:1969–76.
32. Terhune C. Anthem, HealthCare Partners save $4.7 million by coordinating care. Los Angeles Times. 2014 Jun 6. Available at www.latimes.com/business/money/la-fi-anthem-healthcare-partners-20140605-story.html.
33. Gbemudu JN, Larson BK, Van Citters AD, et al. HealthCare Partners: building on a foundation of global risk management to achieve accountable care. Commonwealth Fund Pub. 1572, Vol 2. 2012 Jan.
34. Rice TH. The impact of changing Medicare reimbursement rates on physician- induced demand. Med Care 1983;21:803–15.
35. Nguyen NX, Derrick FW. Physician behavioral response to a Medicare price reduction. Health Serv Res 1997;32:283–98.
36. Yip WC. Physician response to Medicare fee reductions:changes in the volume of coronary artery bypass graft (CABG) surgeries in the Medicare and private sectors. J Health Econ 1998;17:675–99.
37. Song Z, Ayanian JZ, Wallace J, et al. Unintended consequences of eliminating medicare payments for consultations. JAMA Intern Med 2013;173:15–21.
38. Marquis MS, Rogowski JA, Escarce JJ. The managed care backlash: did consumers vote with their feet? Inquiry 2004-2005 Winter;41:376–90.
39. Cooper PF, Simon KI, Vistnes J. A closer look at the managed care backlash. Med Care 2006 May;44(5 Suppl):I4–11.
40. Song Z. Pioneer accountable care organizations: lessons from year 1. In: Curfman G, Morrissey S, Morse G, Prokesch S, editors. Insight Center: leading health care innovation. N Engl J Med/Harv Bus Rev. 2013 Oct 8. Available at http://images.nejm.org/editorial/supplementary/2013/hbr06-song.pdf.
41. McWilliams JM, Landon BE, Chernew ME. Changes in health care spending and quality for Medicare beneficiaries associated with a commercial ACO contract. JAMA 2013;310:829–36.
42. Berenson RA. Shared savings program for accountable care organizations: a bridge to nowhere? Am J Manag Care 2010;16:721–6.
43. Meyer H. Accountable care organization prototypes: winners and losers? Health Aff (Millwood) 2011;30:1227–31.
44. Burns LR, Pauly MV. Accountable care organizations may have difficulty avoiding the failures of integrated delivery networks of the 1990s. Health Aff (Millwood) 2012;31:2407–16.
45. Song Z, Lee TH. The era of delivery system reform begins. JAMA 2013;309:35–6.
46. Colla CH, Lewis VA, Shortell SM, Fisher ES. First national survey of ACOs finds that physicians are playing strong leadership and ownership roles. Health Aff (Millwood) 2014;33:964–71.
47. Baicker K, Levy H. Coordination versus competition in health care reform. N Engl J Med 2013;369:789–91.
48. Baker LC, Bundorf MK, Kessler DP. Vertical integration: hospital ownership of physician practices is associated with higher prices and spending. Health Aff (Millwood). 2014;33:756–63.
49. Isaacs SL, Jellinek PS, Ray WL. The independent physician--going, going.... N Engl J Med 2009;360:655–7.
50. Kocher R, Sahni NR. Hospitals’ race to employ physicians--the logic behind a money-losing proposition. N Engl J Med 2011;364:1790–3.
51. Gold J. Hospitals lure doctors away from private practice. Kaiser Health News, October 12, 2010.
52. Accenture. Clinical transformation: new business models for a new era in healthcare. 2012. Available at www.accenture.com/SiteCollectionDocuments/PDF/Accenture-Clinical-Transformation-New-Business-Models-for-a-New-Era-in-Healthcare.pdf.
53. Fraud and abuse: Leibenluft RF. ACOs and the enforcement of fraud, abuse, and antitrust laws. N Engl J Med 2011;364:99–101.
54. Kreindler SA, Larson BK, Wu FM, et al. Interpretations of integration in early accountable care organizations. Milbank Q 2012;90:457–83.
55. Cassel CK, Reuben DB. Specialization, subspecialization, and subsubspecialization in internal medicine. N Engl J Med 2011;364:1169–73.
56. West CP, Dupras DM. General medicine vs subspecialty career plans among internal medicine residents. JAMA 2012;308:2241–7.
57. Schwartz MD, Durning S, Linzer M, Hauer KE. Changes in medical students’ views of internal medicine careers from 1990 to 2007. Arch Intern Med 2011;171:744-749.
58. Schwartz AL, Landon BE, Elshaug AG, et al. Measuring low-value care in Medicare. JAMA Intern Med 2014 May 12. [Epub ahead of print]
59. American Board of Internal Medicine Foundation. Choosing wisely: lists of five things physicians and patients should question. Accessed 26 May 2013 at www.choosingwisely.org/doctor-patient-lists/.
60. Cassel CK, Guest JA. Choosing Wisely: helping physicians and patients make smart decisions about their care. JAMA 2012;307:1801–2.
61. Lewis VA, Colla CH, Carluzzo KL, et al. Accountable care organizations in the United States: market and demographic factors associated with formation. Health Serv Res 2013;48(6 Pt 1):1840–58.
62. Conrad D, Grembowski D, Gibbons C, et al. A report on eight early-stage state and regional projects testing value-based payment. Health Aff (Millwood) 2013;32:998–1006.
From the Harvard Medical School and the Department of Medicine, Massachusetts General Hospital, Boston, MA.
In recent years, the growth of health care spending has climbed to the top of the domestic policy agenda. Medicare spending growth is now recognized as the biggest driver of the federal debt [1,2].Medicaid spending growth puts similar pressure on states. In the private sector, employee health care costs increasingly weigh on company balance sheets, affecting business operations and employee wages. All the while, individuals and families face insurance premium growth that far outpaces real income growth.
Out of this recent history emerged a broad recognition that health care spending growth is unsustainable at current rates. If Medicare spending continues to exceed gross domestic product (GDP) by 2.5 percentage points per year—the traditional gap over the past 4 decades—a greater than 160% increase in individual income taxes would be needed to pay for it [3].Even if the gap was 1 percentage point, the increase in income taxes needed would still be over 70%, with consequent contraction in GDP of 3% to 16% by 2015 [4,5].Other consequences, such as significant cuts in Medicare benefits or shifting of costs onto patients, are equally undesirable [6,7].
Policy options for slowing health care spending are varied. Some focus on changing the provider’s incentives, while others focus on changing the patient’s incentives. Some are based on federal solutions [8],while others are based on market solutions [9].In the current policy landscape, payment reform for physicians and hospitals has emerged as a leading candidate for addressing health care spending. Public and private payers are increasingly changing the way that providers are paid, moving away from fee-for-service towards bundled or global payments for populations of patients. Physicians and hospitals are in turn forming integrated provider organizations to take on these new payment systems. The pace of this change has been growing.
Key Features of the ACO Concept
An accountable care organization (ACO) is a group of providers—that can include both physicians and hospitals—that accepts joint responsibility for health care spending and quality for a defined population of patients. The ACO concept can be considered an extension of the staff-model health maintenance organization (HMO) [13,14].It also shares features with the patient-centered medical home (PCMH) model in its focus on a robust primary care nexus that serves to coordinate a patient’s care [15,16].Three key characteristics are embedded in this definition.
The first is joint accountability. In an ACO contract, incentives for providers are agreed upon at the organizational level. Physicians and hospitals bear the financial risks and rewards of the ACO contract together. Shared savings, quality bonuses, and other incentives are determined by how the organization performs as a whole rather than any individual physician, practice, or hospital. In this way, physicians across specialties and care settings are incentivized to approach patient care collectively and coordinate care more effectively.
Third, an ACO is responsible for the care of a population of people. Each year, spending and quality are measured for the population attributed, or assigned, to the ACO. Attribution of patients to organizations can take place in two ways. It can be prospective, meaning that before the start of a contract year, the ACO knows exactly the patients whose spending and quality it is responsible for. This is typically more feasible in commercial ACO contracts, especially in the HMO population, where patients designate a primary care physician at the beginning of the year. Otherwise, attribution is typically retrospective, such as in the Medicare ACO programs, where beneficiaries are assigned to organizations at the end of a contract year based on the organization which accounted for the plurality of a patient’s medical spending or primary care spending.
Evidence to Date
While formal results from most ACOs today are not yet available, several notable ACO experiments have been evaluated. These include early results from the Medicare ACO programs, previous evaluations of the Medicare Physician Group Practice Demonstration (a predecessor of today’s ACO contracting model), and early results from commercial ACO contracts, such as the Blue Cross Blue Shield of Massachusetts global budget contract.
In interpreting lessons from these evaluations, several questions are worth keeping in mind. If a new payment system is correlated with changes in medical spending, is this explained by underlying changes in prices or in quantities? Since medical spending is the product of prices of services and quantities (volume) of services, an intervention that affects spending must affect either the prices or the volume of care. In the Medicare program, where prices are standardized, a global budget contract that works off of the underlying physician fee schedule would only affect spending through volume. In the private insurance sector, however, an ACO contract may affect spending through both volume and prices, since variations in prices across providers creates an opportunity for savings if care is obtained through a less expensive provider.
Separate from its relationship to medical spending, which is measured through the claims submitted by providers, what is the connection between a new payment system and total payouts from the insurer to the provider? An ACO contract contains a variety of incentives to providers that may generate additional payments from the insurer (most notably shared savings and quality bonuses). These non-claims payments may partially or entirely offset savings obtained through medical claims, making them an important dimension in the evaluation of the contract. Yet they are also different from medical claim dollars in a meaningful way. Changes in medical spending reflect underlying physician (or patient) behavior—what care is delivered and how much of it is delivered—whereas non-claims payments reflect the incentive structure of the contract.
On the quality dimension, it is worth noting whether a new payment system has similar effects on process and outcome measures. Process measures, which have been widely used by health plans, are operationally similar to additional items on a fee schedule, whereby the delivery of a service effectively generates a payment. Clinical outcome measures, such as blood pressure or cholesterol, and patient experience measures, on the other hand, cannot be fulfilled by simply checking off a box. Therefore, these measures may represent quality in a more meaningful way.
Early Results from Medicare ACOs
Thirty-two provider organizations entered the Pioneer ACO program in 2012, with about 669,000 Medicare beneficiaries attributed to these organizations. According to CMS, medical spending growth for ACO beneficiaries was 0.3% in the first year, compared to 0.8% for similar beneficiaries outside of these organizations [18].This generated a gross savings of $87.6 million in 2012, of which $33 million were returned to the Medicare trust fund. These savings were driven by 13 ACOs, with another 17 ACOs not reporting statistically significant changes in spending and 2 ACOs garnering losses with spending above the target of about $4 million total. Lower rates of admissions and readmissions largely explained the savings. A separate analysis comparing these ACOs to their local markets estimated a higher year 1 savings of $147 million dollars, driven by 8 ACOs whose savings ranged from $396 to $1224 per beneficiary per year [19].
Pioneer ACOs also earned over $76 million for quality. In the first year, quality bonuses were awarded for the reporting of quality measures rather than for performance, and all 32 ACOs successfully reported. According to CMS, Pioneer ACOs on average performed better than fee-for-service Medicare beneficiaries on 15 clinical quality measures for which comparison data were available, including blood pressure control and cholesterol control for diabetic patients. A complete analysis of quality performance is not yet available.
In the Medicare Shared Savings Program, interim results from CMS for the first 2 cohorts of ACOs showed that 29 of the 114 organizations lowered spending sufficiently enough to generate shared savings while 2 organizations had shared losses [20].This suggests that the great majority of ACOs spent close to their target. Final results on spending and quality are pending.
Results from the Medicare Physician Group Practice Demonstration
Ten provider organizations entered one-sided ACO-type contracts with Medicare in 2005 via the Physician Group Practice Demonstration. In this contract, organizations shared in savings provided that their spending was at least 2% below target and they achieved threshold performance on certain quality measures, most of which were process metrics.
In year 1, only one organization decreased spending enough to earn a shared savings, but after 3 years, five organizations had generated shared savings, although half of the savings were awarded to one organization [21].A recent analysis showed that 4 organizations sustained shared savings by the end of the program, with savings concentrated in acute care, readmissions, and beneficiaries who are dually eligible for Medicaid. Across the 10 organizations, financial performance ranged from average savings of $866 to increased spending of $749 per beneficiary per year [22].In total, about $78 million in savings were generated by this demonstration. Although a positive finding, this is a relatively small amount in the context of total Medicare expenditures [23,24].
On quality, all organizations met threshold performance on at least 29 of the 32 measures by the end of 5 years [21]. Most of these were process measures focused on coronary artery disease, diabetes, heart failure, hypertension, and preventive care [25].
Early Results from Commercial ACO Contracts
One of the early commercial ACO contracts to be evaluated was the Blue Cross Blue Shield of Massachusetts Alternative Quality Contract (AQC) [26].Initially implemented in 2009, the AQC is a multi-year contract that pays provider organizations a risk-adjusted global budget over the continuum of care. Seven organizations in Massachusetts entered the contract in the first year, and 4 more entered in 2010. Enrollees in HMO plans were prospectively attributed to their ACO by their designation of a primary care physician. The AQC is a two-sided contract that offered an additional 10% of an organization’s budget as a bonus for performance on 64 quality measures, half outpatient measures and half inpatient. Budget growth rates were tied to inflation and terms of its growth were negotiated with the organizations [27].
Over the first 2 years, the contract was associated with a decrease in medical spending of about $90 per enrollee per year, a –2.8% change (–1.9% in year 1 and –3.3% in year 2) [28].These savings were concentrated in procedures, imaging, and tests in the outpatient facility setting, and were largely explained by lower prices achieved by referring patients to less expensive providers. They were also concentrated in organizations that entered the AQC from fee-for-service, rather than prior risk contracts, and driven by enrollees with the highest expected spending. Over the second year, decreases in volume for certain services, such as percutaneous coronary interventions, began to contribute more to the savings [29].However, medical savings in the first 2 years were exceeded by non-claims payments, including shared savings and quality bonuses [27,28].The AQC was also associated with improvements in outpatient quality, including chronic care management measures (3.7 percentage points increase per year), adult preventive measures (0.4 percentage points per year), and pediatric quality measures (1.3 percentage points per year). Outcome measures such as hemoglobin A1c, LDL cholesterol, and blood pressure also showed an upward trend in the early years [28].Inpatient quality measures have yet to be examined.
Elsewhere in the country, Cigna’s Collaborative Accountable Care model was rolled out in 2009 with provider organizations in New Hampshire, Texas, and Arizona. A one-sided shared savings contract, it features a care coordination fee that is counted towards a practice’s medical spending, helping fund registered nurses who work as care coordinators. Interim results in 2012 suggested cost savings and quality improvements, but they were not statistically significant [30].A two-sided contract between Blue Shield of California and the California Public Employees’ Retirement System slowed medical costs by shortening admission and reducing readmissions [31].Most recently, an accountable care partnership between Anthem Blue Cross and HealthCare Partners physician group in California claimed $4.7 million in savings in the first half of 2013 for 55,000 patients in preferred provider organization (PPO) plans [32].These savings were driven by an 18% reduction in inpatient days, 4% reduction in overall admissions, and a 4% reduction in visits for radiology and lab tests, although specific price and volume contributions are yet unknown. Similar to the AQC, the Anthem contract is a 5-year agreement. Unlike the initial AQC contract, shared savings were tied to meeting a quality threshold and HealthCare Partners did not bear downside risk in year 1 [33].
Lessons Learned
Strengths of the ACO Model
Evidence to date points to both the potential of ACOs to slow spending and improve quality, but also the significant obstacles that they face. One of the encouraging lessons so far is that quality of care need not be threatened by a contract that rewards savings, provided that meaningful incentives for quality are in place. In both public and private two-sided contracts, process quality seemed to consistently improve. However, less is known about performance on outcome measures, which is ultimately a more meaningful metric for patients.
Broadly speaking, ACO contracts may be able to induce changes in physician behavior that could lead to medical savings. The low hanging fruit in Medicare seems to be admissions and readmissions, while that in commercial contracts may be lower prices obtained by changing referral patterns. While these medical savings reveal changes in clinical decision-making, it is still poorly understood whether clinical choices geared towards higher value can extend to areas of utilization where wasteful care may be concentrated. Little is also known about whether an ACO’s physicians and hospitals are in agreement over these changes in utilization or referral patterns, given their consequences for referral business and admissions. Moreover, there has yet to be evidence suggesting that medical savings can be larger than non-claims payments (rewards and bonuses to the ACOs) in a given year, generating net savings to the health care system. This may well take time to materialize given the initial investment costs and inducements for provider participation embedded in the early year incentives, but it is an important metric of success.
ACOs serve as a vehicle for payment reform and organizational reform among providers. They bring physicians across specialties and hospitals together under the same contractual roof, allowing the organization to determine how it allocates its resources under the spending target. Historically, policies aimed to slow health care spending have focused on either cutting prices (provider fees) or constraining volume (gatekeeping, prior authorization, and utilization review, etc.), but both types of strategies have been complicated by unintended consequences. Medicare fee cuts have traditionally been followed by compensatory increases in utilization or intensity of coding, offsetting the intended savings to a significant degree [34–37].Managed care techniques have met resistance from both physicians and patients [38,39].A spending target or budget takes an alternative approach; rather than controlling prices or quantities directly, it seeks to control total spending. Although the underlying fee schedule is retained for accounting, a spending target or especially a global budget pushes the organization to decide what care is high or low value.
A two-sided contract imposes stronger incentives on the ACO than a one-sided contract, which is both a strength and a weakness. While ACOs facing downside risk may respond earlier to the incentives, as some of the evidence thus far suggests, this risk may also propel ACOs to abandon this contracting model. In the Medicare Pioneer ACO program, for example, 9 of the 32 organizations exited the contract after year 1, which was allowed given the voluntary nature of participation. Seven organizations opted for the one-sided Medicare Shared Savings Program in year 2 and two left the ACO programs altogether. Downside risk was thought to be a principal concern for these organizations [40].Massachusetts providers in the AQC have thus far remained in the contract, but the AQC was a multi-year agreement to begin with.
Spillovers are another potential strength of the ACO model. Given that organizations care for patients across multiple payers, strong payment incentives in one payer population may affect care broadly. In the AQC, for example, recent evidence showed slowing of spending for Medicare beneficiaries associated with the contract in similar settings and categories of care as for the Blue Cross Blue Shield patients [41].
Weaknesses of the ACO Model
Still in its nascent stages, the ACO paradigm faces a number of challenges. Some relate to inherent weaknesses of the model, while others relate to the institutions and economics of the broader health care economy. At a contractual level, a key challenge is setting the target growth rate of the budget. If too low, providers may be overly constrained; if too high, providers may not have enough incentive to change practice. In an extreme case, if the target is set above what spending would have been under the old arrangement, an ACO contract can in fact be cost increasing on claims spending alone. Financial rewards such as shared savings and quality bonuses can help offset the risk, but they also make it more difficult for the ACO contract to generate net savings.
Achieving the right balance of risks and rewards is difficult. As noted above, a one-sided contract may not be strong enough to induce behavior change [42,43],but a two-sided contract may be too risky, driving providers who are unable to align incentives and coordinate care to exit the model [44].Although the percentage of shared risk borne by payer versus provider can be negotiated, putting financial risk on providers in a palatable way will be a key challenge. Financial risk can be more daunting if ACOs do not know in advance which patients they are responsible for, as in contracts with retrospective attribution rules and enrollees in unmanaged plans. A payer can help providers handle risk by sharing data on spending and identifying potential areas of overuse and low value care. Payers can help further by implementing risk corridors, providing reinsurance, or improving risk adjustment of the organization’s global budget. But with all that said, it remains to be seen whether providers around the country will be willing to bear substantive risk.
Within the ACO, a primary challenge is dividing up risks and rewards among constituent providers. How much shared savings are given to the hospital, to primary care physicians, or to specialists? What share should each specialty receive? What about shared losses, should spending exceed the target? In a two-sided ACO contract, these questions are particularly salient as global budgets change the business model for providers. Revenue centers under fee-for-service become cost centers. Organizations are confronted with difficult tradeoffs. The ability of providers across specialties to find common ground will be crucial, and leadership from providers will be key [45].Physicians have established themselves as leaders of the majority of ACOs today [46].It remains to be seen whether these organizations can keep providers together through the tradeoffs.
Patient trust in the ACO model has yet to be established. The managed care backlash of the 1990s suggests that patient buy-in will be crucial for the sustainability of ACOs. ACOs can have similarities to the HMO that traditionally produce negative associations, including downside risk, gatekeeping, or managed care techniques. To earn patients’ trust, ACOs will need to prove their value, such as through delivering better preventive care, less expensive care, more holistic care through stronger teams of providers, or smoother transitions of care across settings. The task of primary care medical homes to provide patient-centered care and coordinate across specialists effectively will be crucial. While today’s ACOs may be better positioned because of risk sharing, quality bonuses, risk adjustment, electronic medical records, or other innovations, the patient’s experience may ultimately be the arbiter.
Broader Challenges
While clinical integration is a central tenet of ACOs, consolidation between providers is simultaneously a chief concern for policymakers. Consolidation generally reduces competition and drives up prices, which is at odds with the goals of cost containment [47,48].Across the nation, physicians are consolidating with hospitals and health systems at an increasing rate, with recent surveys reporting that the proportion of independent physicians has steadily declined to below 50% [49–52].Increasing the number of covered lives is a dominant growth strategy under risk contracts, and more covered lives also increases an ACO’s bargaining power during acquisitions of specialist practices, whose referrals are better protected by inclusion in the provider network. As this trend continues, its effect on commercial prices will likely be scrutinized [53,54].
The ACO paradigm may also have significant effects on the physician labor market. Over the past 4 decades, the rate of physician specialization has grown dramatically [55].Fee-for-service incentives were aligned with specialization, but a rapid transition to alternative payment systems may disrupt the more gradually evolving physician labor market. Most medical school graduates today choose to specialize, as do most graduates of general medicine training programs [56,57],yet it is unclear to what degree the demand for specialists will continue to grow in the accountable care era. Specialty services tend to be of higher cost than generalist services. In some situations, high-cost services are more likely to be of lower value [58–60].Yet having specialists allows an organization to integrate services across the continuum of care, for which they are now financially responsible. As a new generation of specialists prepares to enter practice, whether the health care system will be able to support them and fulfill their expectations about their practice environment may be in question.
Looking into the Future
The landscape of payment and organization in health care will likely continue to migrate towards the ACO concept [61,62]. As the federal government, states, and individual payers move in similar directions, physicians and hospitals will face increasing pressures to change and adapt to new incentives surrounding cost and quality. Whether ACOs succeed in slowing spending while improving quality may have important ramifications for future stages of health care reform. For example, the growing debate in Washington, DC, over the future of Medicare financing may be informed, in part, by whether ACOs succeed within the traditional Medicare program. Market-based reforms, such as converting Medicare into a premium support program whereby private insurers compete to insure Medicare beneficiaries for a pre-defined contribution from the federal government, have been gaining momentum in recent years. Although not without concerns, such proposals would expect to gain consideration if the ACO model does not succeed.
Perhaps the most meaningful contribution of the ACO model is that it gives providers a reason to change the culture of medicine. It asks providers across specialties to work together and coordinate care in a way that was not rewarded under fee-for-service. It asks organizations to stitch the separate pieces of the patient’s care trajectory together through teamwork. In the long run, this may be the most intangible but substantive legacy that the ACO model provides. Under a single, collective contract at the organizational level, providers are quite literally in it together. If providers can break down silos, improve care coordination, and manage population health with a collective vision towards keeping patients healthy, the ACO paradigm would be able to claim a profound achievement. Such changes, however, will take time and they are not guaranteed.
Corresponding author: Zirui Song, MD, PhD, Department of Medicine, Massachusetts General Hospital, 55 Fruit St., Boston, MA 02114, zirui_song@post.harvard.edu.
Funding/support: Supported by a grant from the National Institute on Aging F30 AG039175.
Financial disclosures: None.
1. Orszag PR, Ellis P. The challenge of rising health care costs—a view from the Congressional Budget Office. N Engl J Med 2007;357:1793–5.
2. Chernew ME, Hirth RA, Cutler DM. Increased spending on health care: long- term implications for the nation. Health Aff (Millwood) 2009;28:1253–5.
3. Congressional Budget Office. Financing projected spending in the long run. Washington, DC: Congressional Budget Office; 2007 Jul 9.
4. Financing projected spending in the long run: letter from Peter R. Orszag, director, Congressional Budget Office, to Senator Judd Gregg, 9 Jul 2007.
5. Baicker K, Chernew ME. The economics of financing Medicare. N Engl J Med 2011;28;365:e7.
6. Chernew ME, Baicker K, Hsu J. The specter of financial armageddon—health care and federal debt in the United States. N Engl J Med 2010;362:1166–8.
7. Newhouse JP. Assessing health reform’s impact on four key groups of Americans. Health Aff (Millwood). 2010;29:1714–24.
8. Emanuel E, Tanden N, Altman S, et al. A systemic approach to containing health care spending. N Engl J Med 2012;367:949–54.
9. Antos JR, Pauly MV, Wilensky GR. Bending the cost curve through market-based incentives. N Engl J Med 2012;367:954–8.
10. Centers for Medicare and Medicaid Services. More partnerships between doctors and hospitals strengthen coordinated care for Medicare beneficiaries. 2013 Dec 23.
11. Fisher ES, McClellan MB, Safran DG. Building the path to accountable care. N Engl J Med 2011;365:2445–7.
12. Muhlestein D. Accountable care growth in 2014: a look ahead. Health Affairs Blog. 2014 Jan 29. Available at http://healthaffairs.org/blog/2014/01/29/accountable-care-growth-in-2014-a-look-ahead/.
13. Fisher ES, Shortell SM. Accountable care organizations: accountable for what, to whom, and how. JAMA 2010;304:1715–6.
14. Fisher ES, Staiger DO, Bynum JP, Gottlieb DJ. Creating accountable care organizations: the extended hospital medical staff. Health Aff (Millwood) 2007;26:w44–w57.
15. Rittenhouse DR, Shortell SM. The patient-centered medical home: will it stand the test of health reform? JAMA 2009;301:2038–40.
16. Bodenheimer T, Grumbach K, Berenson RA. A lifeline for primary care. N Engl J Med 2009;360:2693–6.
17. Centers for Medicare and Medicaid Services. Improving quality of care for Medicare patients: accountable care organizations. 2011 Oct 20.
18. Centers for Medicare and Medicaid Services. Press release: Pioneer accountable care organizations succeed in improving care, lowering costs. 2013 Jul 16. Available at www.cms.gov/Newsroom/MediaReleaseDatabase/Press-Releases/2013-Press-Releases-Items/2013-07-16.html.
19. L&M Policy Research. Effect of Pioneer ACOs on Medicare spending in the first year. 2013 Nov 3. Available at http://innovation.cms.gov/Files/reports/PioneerACOEvalReport1.pdf.
20. Centers for Medicare and Medicaid Services. Performance year 1 interim results for ACOs that started in April and July 2012. 2014 Jan 30. Available at www.cms.gov/Medicare/Medicare-Fee-for-Service-Payment/sharedsavingsprogram/Downloads/PY1-InterimResultsTable.pdf.
21. Wilensky GR. Lessons from the Physician Group Practice Demonstration — a sobering reflection. N Engl J Med 2011;365:1659–61.
22. Colla CH, Wennberg DE, Meara E, et al. Spending differences associated with the Medicare Physician Group Practice Demonstration. JAMA 2012;308:1015–23.
23. Berwick DM. Launching accountable care organizations—the proposed rule for the Medicare Shared Savings Program N Engl J Med 2011;364:e32.
24. Haywood TT, Kosel KC. The ACO model—a three-year financial loss? N Engl J Med 2011;364.
25. Iglehart JK. Assessing an ACO prototype—Medicare’s Physician Group Practice Demonstration. N Engl J Med 2011;364:198–200.
26. Chernew ME, Mechanic RE, Landon BE, Safran DG. Private-payer innovation in Massachusetts: the “Alternative Quality Contract.” Health Aff (Millwood). 2011;30:51–61.
27. Song Z, Safran DG, Landon BE, et al. Health care spending and quality in year 1 of the alternative quality contract. N Engl J Med 2011;365:909–18.
28. Song Z, Safran DG, Landon BE, et al. The ‘Alternative Quality Contract,’ based on a global budget, lowered medical spending and improved quality. Health Aff (Millwood). 2012;31:1885–94.
29. Song Z, Fendrick AM, Safran DG, et al. Global budgets and technology-intensive medical services. Healthcare (Amst) 2013;1:15–21.
30. Salmon RB, Sanderson MI, Walters BA, et al. A collaborative accountable care model in three practices showed promising early results on costs and quality of care. Health Aff (Millwood). 2012;31:2379–87.
31. Markovich P. A global budget pilot project among provider partners and Blue Shield of California led to savings in first two years. Health Aff (Millwood) 2012;31:1969–76.
32. Terhune C. Anthem, HealthCare Partners save $4.7 million by coordinating care. Los Angeles Times. 2014 Jun 6. Available at www.latimes.com/business/money/la-fi-anthem-healthcare-partners-20140605-story.html.
33. Gbemudu JN, Larson BK, Van Citters AD, et al. HealthCare Partners: building on a foundation of global risk management to achieve accountable care. Commonwealth Fund Pub. 1572, Vol 2. 2012 Jan.
34. Rice TH. The impact of changing Medicare reimbursement rates on physician- induced demand. Med Care 1983;21:803–15.
35. Nguyen NX, Derrick FW. Physician behavioral response to a Medicare price reduction. Health Serv Res 1997;32:283–98.
36. Yip WC. Physician response to Medicare fee reductions:changes in the volume of coronary artery bypass graft (CABG) surgeries in the Medicare and private sectors. J Health Econ 1998;17:675–99.
37. Song Z, Ayanian JZ, Wallace J, et al. Unintended consequences of eliminating medicare payments for consultations. JAMA Intern Med 2013;173:15–21.
38. Marquis MS, Rogowski JA, Escarce JJ. The managed care backlash: did consumers vote with their feet? Inquiry 2004-2005 Winter;41:376–90.
39. Cooper PF, Simon KI, Vistnes J. A closer look at the managed care backlash. Med Care 2006 May;44(5 Suppl):I4–11.
40. Song Z. Pioneer accountable care organizations: lessons from year 1. In: Curfman G, Morrissey S, Morse G, Prokesch S, editors. Insight Center: leading health care innovation. N Engl J Med/Harv Bus Rev. 2013 Oct 8. Available at http://images.nejm.org/editorial/supplementary/2013/hbr06-song.pdf.
41. McWilliams JM, Landon BE, Chernew ME. Changes in health care spending and quality for Medicare beneficiaries associated with a commercial ACO contract. JAMA 2013;310:829–36.
42. Berenson RA. Shared savings program for accountable care organizations: a bridge to nowhere? Am J Manag Care 2010;16:721–6.
43. Meyer H. Accountable care organization prototypes: winners and losers? Health Aff (Millwood) 2011;30:1227–31.
44. Burns LR, Pauly MV. Accountable care organizations may have difficulty avoiding the failures of integrated delivery networks of the 1990s. Health Aff (Millwood) 2012;31:2407–16.
45. Song Z, Lee TH. The era of delivery system reform begins. JAMA 2013;309:35–6.
46. Colla CH, Lewis VA, Shortell SM, Fisher ES. First national survey of ACOs finds that physicians are playing strong leadership and ownership roles. Health Aff (Millwood) 2014;33:964–71.
47. Baicker K, Levy H. Coordination versus competition in health care reform. N Engl J Med 2013;369:789–91.
48. Baker LC, Bundorf MK, Kessler DP. Vertical integration: hospital ownership of physician practices is associated with higher prices and spending. Health Aff (Millwood). 2014;33:756–63.
49. Isaacs SL, Jellinek PS, Ray WL. The independent physician--going, going.... N Engl J Med 2009;360:655–7.
50. Kocher R, Sahni NR. Hospitals’ race to employ physicians--the logic behind a money-losing proposition. N Engl J Med 2011;364:1790–3.
51. Gold J. Hospitals lure doctors away from private practice. Kaiser Health News, October 12, 2010.
52. Accenture. Clinical transformation: new business models for a new era in healthcare. 2012. Available at www.accenture.com/SiteCollectionDocuments/PDF/Accenture-Clinical-Transformation-New-Business-Models-for-a-New-Era-in-Healthcare.pdf.
53. Fraud and abuse: Leibenluft RF. ACOs and the enforcement of fraud, abuse, and antitrust laws. N Engl J Med 2011;364:99–101.
54. Kreindler SA, Larson BK, Wu FM, et al. Interpretations of integration in early accountable care organizations. Milbank Q 2012;90:457–83.
55. Cassel CK, Reuben DB. Specialization, subspecialization, and subsubspecialization in internal medicine. N Engl J Med 2011;364:1169–73.
56. West CP, Dupras DM. General medicine vs subspecialty career plans among internal medicine residents. JAMA 2012;308:2241–7.
57. Schwartz MD, Durning S, Linzer M, Hauer KE. Changes in medical students’ views of internal medicine careers from 1990 to 2007. Arch Intern Med 2011;171:744-749.
58. Schwartz AL, Landon BE, Elshaug AG, et al. Measuring low-value care in Medicare. JAMA Intern Med 2014 May 12. [Epub ahead of print]
59. American Board of Internal Medicine Foundation. Choosing wisely: lists of five things physicians and patients should question. Accessed 26 May 2013 at www.choosingwisely.org/doctor-patient-lists/.
60. Cassel CK, Guest JA. Choosing Wisely: helping physicians and patients make smart decisions about their care. JAMA 2012;307:1801–2.
61. Lewis VA, Colla CH, Carluzzo KL, et al. Accountable care organizations in the United States: market and demographic factors associated with formation. Health Serv Res 2013;48(6 Pt 1):1840–58.
62. Conrad D, Grembowski D, Gibbons C, et al. A report on eight early-stage state and regional projects testing value-based payment. Health Aff (Millwood) 2013;32:998–1006.
Improving Care of Patients with Sickle Cell Disease and Sickle Cell Trait: The Hemoglobinopathy Learning Collaborative Series
From the National Initiative for Children’s Healthcare Quality, Boston, MA.
This month JCOM launches a series calling attention to 5 teams working to improve care for individuals with sickle cell disease and sickle cell trait in the Hemoglobinopathy Learning Collaborative (—Ed.)
Sickle cell disease affects close to 100,000 people in United States [1]. This condition is characterized by chronic anemia and unpredictable pain episodes beginning in early childhood and leading to changes in functioning, diminished health-related quality of life, end-organ damage, increased health care use, and in some cases early mortality [2–5]. Sickle cell disease is identified through universal newborn screening [6] and is found in one in 2474 newborn Americans [7], with Americans of African ancestry most frequently affected. It is estimated that over 2 million Americans are genetic carriers of the sickle cell gene.
Although there have been major advancements in sickle cell care within the past several decades, there still exist significant variations in care and mortality [8–14]. Ongoing strategies to improve patient access to efficacious treatments are essential to improve outcomes for individuals with sickle cell disease.
Recognizing the compelling need for a focused national effort to improve care for this population and the relative lack of private resources committed to it [15], Congress established 2 federal programs to enhance newborn screening and improve follow-up and care and outcomes for this population: the Sickle Cell Disease Newborn Screening Program in 2002 [16] and the Sickle Cell Disease Treatment Demonstration Program in 2004 [17]. The programs are funded by the Health Resources and Services Administration and administered by the National Initiative for Children’s Healthcare Quality (NICHQ)’s Working to Improve Sickle Cell Healthcare (WISCH) program [2]. NICHQ became the coordinating center for the programs in 2011 and 2010, respectively. Diverse grantees are now working together in a Hemoglobinopathy Learning Collaborative, coordinated and facilitated by NICHQ and its partners Boston Medical Center and the Sickle Cell Disease Association of America. The current rounds of funding continue through 2014 for the Sickle Cell Disease Treatment Demonstration Program and 2015 for the Sickle Cell Disease Newborn Screening Program.
The Hemoglobinopathy Learning Collaborative grantees are developing strategies that will result in more coordinated and appropriate care in order that individuals with sickle cell disease experience fewer complications, acute care visits, and hospitalizations; enhanced quality of life; and more compassionate and respectful treatment from the health care system. Processes are also being developed to ensure that individuals screened for sickle cell disease and sickle cell trait receive genetic counseling, education and appropriate follow-up care for their condition. The aims of the collaborative are aligned with the national quality strategy of the Triple Aim—better care, better health, and lower overall health care costs [18]. The strategies and approaches developed and tested by the teams will be disseminated to the broader sickle cell community for use in the treatment and management of individuals with sickle cell disease.
The Hemoglobinopathy Learning Collaborative’s approach is based on the structure of the Breakthrough Series Learning Collaborative [19–21], a model championed by the Institute for Healthcare Improvement that brings together health care organizations that share a commitment to making major, rapid changes in order to produce breakthrough improvements in quality. Using a process known as the Model for Improvement [22], the teams develop ideas for changes, test small-scale changes using Plan-Do-Study-Act (PDSA) cycles, and measure to determine if the changes are leading to improvement. This method can quickly identify promising ideas and adapt and develop them to into robust, reliable standard processes [2].
There are 15 improvement teams working on quality improvement projects focused on improving acute care management, provision of recommended care, transition, self-management, provider education, and screening, counseling, and education for individuals with SCD and SCT. The 5 articles in this special series span these major content areas, from improving outcomes in the emergency department using standardized order sets to assessing the readiness of adolescents to transition to adult care, to using health information technology to improve care coordination, to developing a home pain management plan, and to using patient navigators to help coordinate care and resources. The series begins with the article by Treadwell et al in this issue and will continue for the next several months. The WISCH teams will serve as leaders for sustainable and positive change for treatment of individuals with sickle cell disease and sickle cell trait in the United States. Their work is an important step towards transforming care for people with sickle cell disease, so that each person with sickle cell disease will receive the highest quality of care throughout their lifespan.
Corresponding author: Suzette Oyeku, MD, MPH, Children’s Hospital at Montefiore/Albert Einstein College of Medicine, 3444 Kossuth Ave, 1st Fl, Bronx, NY 10467, soyeku@nichq.org.
1. Brousseau DC, Panepinto JA, Nimmer M, et al. The number of people with sickle cell disease in the United States: national and state estimates. Am J Hematol 2010;85:77–8.
2. Oyeku SO, Wang CJ, Scoville R, et al. Hemoglobinopathy Learning Collaborative: using quality improvement (QI) to achieve equity in health care quality, coordination, and outcomes for sickle cell disease. J Health Care Poor Underserved 2012;23(3 Suppl):34-48.
3. Davis H, Moore RM Jr, Gergen PJ. Cost of hospitalizations associated with sickle cell disease in the United States. Public Health Rep 1997;112:40–3.
4. Panepinto JA. Health-related quality of life in sickle cell disease. Pediatr Blood Cancer 2008;51:5–9.
5. Steiner CA, Miller JL. Sickle cell disease patients in U.S. hospitals, 2004. In: Healthcare cost and utilization project statistical briefs. Rockville, MD: Agency for Healthcare Research and Quality; 2006.
6. National Newborn Screening & Global Resource Center. National newborn screening status report, 6 Jan 2013. Available at http://genes-r-us.uthscsa.edu/sites/genes-r-us/files/nbsdisorders.pdf.
7. Therrell BL, Hannon WH. National evaluation of US newborn screening system components. Mental Retard Dev Disabil Res Rev 2006;12:236–45.
8. Davis H, Schoendorf KC, Gergen PJ, et al. National trends in the mortality of children with sickle cell disease, 1968 through 1992. Am J Public Health 1997;87:1317–22.
9. Davis H, Gergen PJ, Moore RM Jr. Geographic differences in mortality of young children with sickle cell disease in the United States. Public Health Rep 1997;112:52–8.
10. Hamideh D, Alvarez O. Sickle cell disease related mortality in the United States (1999-2009). Pediatr Blood Cancer 2013;60:1482–6.
11. Brawley OW, Cornelius LJ, Edwards LR, et al. National Institutes of Health Consensus Development Conference statement: hydroxyurea treatment for sickle cell disease. Ann Intern Med 2008;148:932–8.
12. Raphael JL, Rattler TL, Kowalkowski MA, et al. The medical home experience among children with sickle cell disease. Pediatr Blood Cancer 2013;60:275–80.
13. Todd KH, Green C, Bonham VL, et al. Sickle cell disease related pain: crisis conflict. J Pain 2006;7:453–8.
14. Glassberg JA, Tanabe P, Chow A, et al. Emergency provider analgesic practices and attitudes toward patients with sickle cell disease. Ann Emerg Med 2013;62:293–302.
15. Smith LA, Oyeku SO, Homer C, Zuckerman B. Sickle cell disease: a question of equity and quality. Pediatrics 2006;117:1763–70.
16. 107th Congress of the United States. Departments of Labor, Health and Human Services, and Education and Related Agencies Appropriation Act, 2002 (H.R. 3061.RH). Available at www.gpo.gov/fdsys/pkg/BILLS-107hr3061rh/pdf/BILLS-107hr3061rh.pdf.
17. 108th Congress of the United States. American Jobs Creation Act of 2004 (H.R. 4520). Available at http://thomas.loc.gov/cgi-bin/bdquery/z?d108:H.R.4520.
18. U.S. Department of Health and Human Services. Report to Congress: national strategy for quality improvement in health care. Washington, DC: U.S. Department of Health and Human Services; 2011. Available at www.healthcare.gov/law/resources /reports/quality03212011a.html.
19. Kilo CM. Improving care through collaboration. Pediatrics 1999;103(1 Suppl E):384–93.
20. Institute for Healthcare Improvement. The breakthrough series: IHI’s collaborative model for achieving breakthrough improvement. Boston: Institute for Healthcare Improvement; 2003.
21. Wagner EH, Glasgow RE, Davis C, et al. Quality improvement in chronic illness care: a collaborative approach. Jt Comm J Qual Improv 2001;27:63–80.
22. Langley GJ, Nolan KM, Norman CL, et al. The improvement guide: a practical approach to enhancing organizational performance. San Francisco: Jossey-Bass; 1996.
From the National Initiative for Children’s Healthcare Quality, Boston, MA.
This month JCOM launches a series calling attention to 5 teams working to improve care for individuals with sickle cell disease and sickle cell trait in the Hemoglobinopathy Learning Collaborative (—Ed.)
Sickle cell disease affects close to 100,000 people in United States [1]. This condition is characterized by chronic anemia and unpredictable pain episodes beginning in early childhood and leading to changes in functioning, diminished health-related quality of life, end-organ damage, increased health care use, and in some cases early mortality [2–5]. Sickle cell disease is identified through universal newborn screening [6] and is found in one in 2474 newborn Americans [7], with Americans of African ancestry most frequently affected. It is estimated that over 2 million Americans are genetic carriers of the sickle cell gene.
Although there have been major advancements in sickle cell care within the past several decades, there still exist significant variations in care and mortality [8–14]. Ongoing strategies to improve patient access to efficacious treatments are essential to improve outcomes for individuals with sickle cell disease.
Recognizing the compelling need for a focused national effort to improve care for this population and the relative lack of private resources committed to it [15], Congress established 2 federal programs to enhance newborn screening and improve follow-up and care and outcomes for this population: the Sickle Cell Disease Newborn Screening Program in 2002 [16] and the Sickle Cell Disease Treatment Demonstration Program in 2004 [17]. The programs are funded by the Health Resources and Services Administration and administered by the National Initiative for Children’s Healthcare Quality (NICHQ)’s Working to Improve Sickle Cell Healthcare (WISCH) program [2]. NICHQ became the coordinating center for the programs in 2011 and 2010, respectively. Diverse grantees are now working together in a Hemoglobinopathy Learning Collaborative, coordinated and facilitated by NICHQ and its partners Boston Medical Center and the Sickle Cell Disease Association of America. The current rounds of funding continue through 2014 for the Sickle Cell Disease Treatment Demonstration Program and 2015 for the Sickle Cell Disease Newborn Screening Program.
The Hemoglobinopathy Learning Collaborative grantees are developing strategies that will result in more coordinated and appropriate care in order that individuals with sickle cell disease experience fewer complications, acute care visits, and hospitalizations; enhanced quality of life; and more compassionate and respectful treatment from the health care system. Processes are also being developed to ensure that individuals screened for sickle cell disease and sickle cell trait receive genetic counseling, education and appropriate follow-up care for their condition. The aims of the collaborative are aligned with the national quality strategy of the Triple Aim—better care, better health, and lower overall health care costs [18]. The strategies and approaches developed and tested by the teams will be disseminated to the broader sickle cell community for use in the treatment and management of individuals with sickle cell disease.
The Hemoglobinopathy Learning Collaborative’s approach is based on the structure of the Breakthrough Series Learning Collaborative [19–21], a model championed by the Institute for Healthcare Improvement that brings together health care organizations that share a commitment to making major, rapid changes in order to produce breakthrough improvements in quality. Using a process known as the Model for Improvement [22], the teams develop ideas for changes, test small-scale changes using Plan-Do-Study-Act (PDSA) cycles, and measure to determine if the changes are leading to improvement. This method can quickly identify promising ideas and adapt and develop them to into robust, reliable standard processes [2].
There are 15 improvement teams working on quality improvement projects focused on improving acute care management, provision of recommended care, transition, self-management, provider education, and screening, counseling, and education for individuals with SCD and SCT. The 5 articles in this special series span these major content areas, from improving outcomes in the emergency department using standardized order sets to assessing the readiness of adolescents to transition to adult care, to using health information technology to improve care coordination, to developing a home pain management plan, and to using patient navigators to help coordinate care and resources. The series begins with the article by Treadwell et al in this issue and will continue for the next several months. The WISCH teams will serve as leaders for sustainable and positive change for treatment of individuals with sickle cell disease and sickle cell trait in the United States. Their work is an important step towards transforming care for people with sickle cell disease, so that each person with sickle cell disease will receive the highest quality of care throughout their lifespan.
Corresponding author: Suzette Oyeku, MD, MPH, Children’s Hospital at Montefiore/Albert Einstein College of Medicine, 3444 Kossuth Ave, 1st Fl, Bronx, NY 10467, soyeku@nichq.org.
1. Brousseau DC, Panepinto JA, Nimmer M, et al. The number of people with sickle cell disease in the United States: national and state estimates. Am J Hematol 2010;85:77–8.
2. Oyeku SO, Wang CJ, Scoville R, et al. Hemoglobinopathy Learning Collaborative: using quality improvement (QI) to achieve equity in health care quality, coordination, and outcomes for sickle cell disease. J Health Care Poor Underserved 2012;23(3 Suppl):34-48.
3. Davis H, Moore RM Jr, Gergen PJ. Cost of hospitalizations associated with sickle cell disease in the United States. Public Health Rep 1997;112:40–3.
4. Panepinto JA. Health-related quality of life in sickle cell disease. Pediatr Blood Cancer 2008;51:5–9.
5. Steiner CA, Miller JL. Sickle cell disease patients in U.S. hospitals, 2004. In: Healthcare cost and utilization project statistical briefs. Rockville, MD: Agency for Healthcare Research and Quality; 2006.
6. National Newborn Screening & Global Resource Center. National newborn screening status report, 6 Jan 2013. Available at http://genes-r-us.uthscsa.edu/sites/genes-r-us/files/nbsdisorders.pdf.
7. Therrell BL, Hannon WH. National evaluation of US newborn screening system components. Mental Retard Dev Disabil Res Rev 2006;12:236–45.
8. Davis H, Schoendorf KC, Gergen PJ, et al. National trends in the mortality of children with sickle cell disease, 1968 through 1992. Am J Public Health 1997;87:1317–22.
9. Davis H, Gergen PJ, Moore RM Jr. Geographic differences in mortality of young children with sickle cell disease in the United States. Public Health Rep 1997;112:52–8.
10. Hamideh D, Alvarez O. Sickle cell disease related mortality in the United States (1999-2009). Pediatr Blood Cancer 2013;60:1482–6.
11. Brawley OW, Cornelius LJ, Edwards LR, et al. National Institutes of Health Consensus Development Conference statement: hydroxyurea treatment for sickle cell disease. Ann Intern Med 2008;148:932–8.
12. Raphael JL, Rattler TL, Kowalkowski MA, et al. The medical home experience among children with sickle cell disease. Pediatr Blood Cancer 2013;60:275–80.
13. Todd KH, Green C, Bonham VL, et al. Sickle cell disease related pain: crisis conflict. J Pain 2006;7:453–8.
14. Glassberg JA, Tanabe P, Chow A, et al. Emergency provider analgesic practices and attitudes toward patients with sickle cell disease. Ann Emerg Med 2013;62:293–302.
15. Smith LA, Oyeku SO, Homer C, Zuckerman B. Sickle cell disease: a question of equity and quality. Pediatrics 2006;117:1763–70.
16. 107th Congress of the United States. Departments of Labor, Health and Human Services, and Education and Related Agencies Appropriation Act, 2002 (H.R. 3061.RH). Available at www.gpo.gov/fdsys/pkg/BILLS-107hr3061rh/pdf/BILLS-107hr3061rh.pdf.
17. 108th Congress of the United States. American Jobs Creation Act of 2004 (H.R. 4520). Available at http://thomas.loc.gov/cgi-bin/bdquery/z?d108:H.R.4520.
18. U.S. Department of Health and Human Services. Report to Congress: national strategy for quality improvement in health care. Washington, DC: U.S. Department of Health and Human Services; 2011. Available at www.healthcare.gov/law/resources /reports/quality03212011a.html.
19. Kilo CM. Improving care through collaboration. Pediatrics 1999;103(1 Suppl E):384–93.
20. Institute for Healthcare Improvement. The breakthrough series: IHI’s collaborative model for achieving breakthrough improvement. Boston: Institute for Healthcare Improvement; 2003.
21. Wagner EH, Glasgow RE, Davis C, et al. Quality improvement in chronic illness care: a collaborative approach. Jt Comm J Qual Improv 2001;27:63–80.
22. Langley GJ, Nolan KM, Norman CL, et al. The improvement guide: a practical approach to enhancing organizational performance. San Francisco: Jossey-Bass; 1996.
Putting Psoriatic Arthritis First
We are all aware of the burden of psoriatic arthritis (PsA). Although psoriasis is more common, the arthritic component is a major factor in the morbidity of psoriatic disease. Accordingly, the National Psoriasis Foundation (NPF) is taking steps to expand the focus on PsA.
Last month, the NPF launched the largest realignment and expansion of its PsA program since the organization began its services almost 20 years ago. The NPF’s PsA Project will focus on 4 major areas: (1) Decrease the time to diagnosis. (2) Help those with PsA better manage their disease. (3) Reduce barriers to health care and treatments. (4) Improve understanding of PsA symptoms, disease management, and impact on patient quality of life among health care providers.
Through the PsA Project, the NPF has the following specific goals: (1) Reduce the average time of diagnosis of PsA from 4 years to 1 year. (2) Increase by 50% the number of people with PsA who are receiving the right treatment to 62% total. (3) Reduce from 50% to 30% the number of people who report PsA is a problem in their everyday lives. (4) Double the number of health resources available to people diagnosed with PsA. (5) Increase by 50% the number of National Institutes of Health–funded scientists studying psoriatic disease to 42 scientists to boost care, improve treatment, and find a cure for PsA.
What’s the issue?
Our patients with PsA deserve more resources. The earlier we diagnose this condition the less likely an individual is to suffer pain and possible joint destruction. A project such as the one created by the NPF can only help to raise awareness among both patients and physicians. How will you contribute to expanding awareness of psoriatic arthritis in your community?