User login
Most Kids With COVID-Linked MIS-C Recover by 6 Months
Children who were severely ill with multisystem inflammatory syndrome in children (MIS-C) related to COVID-19 infection appear to show excellent cardiovascular and noncardiovascular outcomes by 6 months, according to data published in JAMA Pediatrics.
MIS-C is a life-threatening complication of COVID-19 infection and data on outcomes are limited, wrote the authors, led by Dongngan T. Truong, MD, MSSI, with Children’s Healthcare of Atlanta Cardiology, Emory University School of Medicine in Atlanta, Georgia. These 6-month results are from the Long-Term Outcomes After the Multisystem Inflammatory Syndrome in Children (MUSIC) study, sponsored by the National Heart, Lung, and Blood Institute.
Researchers found in this cohort study of 1204 participants that by 6 months after hospital discharge, 99% had normalization of left ventricular systolic function, and 92.3% had normalized coronary artery dimensions. More than 95% reported being more than 90% back to baseline health.
Patient-Reported Outcomes Measurement Information Systems (PROMIS) Global Health scores were at least equivalent to prepandemic population normative values. PROMIS Global Health parent/guardian proxy median T scores for fatigue, global health, and pain interference improved significantly from 2 weeks to 6 months: fatigue, 56.1 vs 48.9; global health, 48.8 vs 51.3; pain interference, 53.0 vs 43.3 (P < .001).
The most common symptoms reported at 2 weeks were fatigue (15.9%) and low stamina/energy (9.2%); both decreased to 3.4% and 3.3%, respectively, by 6 months. The most common cardiovascular symptom at 2 weeks was palpitations (1.5%), which decreased to 0.6%.
Chest Pain Increased Over Time
Reports of chest pain, however, reportedly increased over time, with 1.3% reporting chest pain at rest at 2 weeks and 2.2% at 6 months. Although gastrointestinal symptoms were common during the acute MIS-C, only 5.3% of respondents reported those symptoms at 2 weeks.
Children in the cohort had a median age of 9 years, and 60% were men. They self-identified with the following races and ethnicities: American Indian or Alaska Native (0.1%), Asian (3.3%), Black (27.0%), Hawaiian Native or Other Pacific Islander (0.2%), Hispanic or Latino (26.9%), multiracial (2.7%), White (31.2%), other (1.0%), and unknown or refused to specify (7.6%). Authors wrote that the cohort was followed-up to 2 years after illness onset and long-term results are not yet known.
Time to Exhale
David J. Goldberg, MD, with the Cardiac Center, Children’s Hospital of Philadelphia, Pennsylvania, and colleagues, wrote in an accompanying editorial that “the decreased frequency of the disease along (with) the reassuring reports on midterm outcomes can allow the pediatric community a moment of collective exhale.”
The editorialists note that of those who initially presented with myocardial dysfunction, all but one patient evaluated had a normal ejection fraction at follow-up. Energy, sleep, appetite, cognition, and mood also normalized by midterm.
“The results of the MUSIC study add to the emerging midterm outcomes data suggesting a near-complete cardiovascular recovery in the overwhelming majority of patients who develop MIS-C,” Goldberg and colleagues wrote. “Despite initial concerns, driven by the severity of acute presentation at diagnosis and longer-term questions that remain (for example, does coronary microvascular dysfunction persist even after normalization of coronary artery z score?), these data suggest an encouraging outlook for the long-term health of affected children.”
The Centers for Disease Control and Prevention and other agencies have reported a declining overall incidence of MIS-C and highlighted the protective value of vaccination.
The editorialists add, however, that while the drop in MIS-C cases is encouraging, cases are still reported, especially amid high viral activity periods, “and nearly half of affected children continue to require intensive care in the acute phase of illness.”
Truong reported grants from the National Institutes of Health and serving as coprincipal investigator for Pfizer for research on COVID-19 vaccine-associated myocarditis funded by Pfizer and occurring through the framework of the National Heart, Lung, and Blood Institute’s Pediatric Heart Network outside the submitted work. One coauthor reported grants from Pfizer and Boston Scientific outside the submitted work. One coauthor reported receiving grants from Additional Ventures Foundation outside the submitted work. One coauthor reported receiving consultant fees from Amryt Pharma, Chiesi, Esperion, and Ultragenyx outside the submitted work. A coauthor reported receiving consultant fees from Larimar Therapeutics for mitochondrial therapies outside the submitted work. One coauthor reported being an employee of Takeda Pharmaceuticals since July 2023. One editorialist reported grants from Childhood Arthritis and Rheumatology Research Alliance and the Arthritis Foundation, Academy Health, and the Gordon and Betty Moore Foundation during the conduct of the study.
A version of this article first appeared on Medscape.com.
FROM JAMA PEDIATRICS
Both High and Low HDL Levels Linked to Increased Risk for Age-Related Macular Degeneration
TOPLINE:
This study also identified a potential novel single-nucleotide polymorphism linked to an elevated risk for the retina condition.
METHODOLOGY:
- Researchers conducted a cross-sectional retrospective analysis using data from the All of Us research program to assess the association between lipoprotein and the risk for AMD.
- They analyzed data from 2328 patients with AMD (mean age, 75.5 years; 46.7% women; 84.2% White individuals) and 5028 matched controls (mean age, 75.6 years; 52.5% women; 82.9% White individuals).
- Data were extracted for smoking status, history of hyperlipidemia, use of statins (categorized as hepatically and non-hepatically metabolized), and laboratory values for total triglyceride, low-density lipoprotein (LDL), and HDL levels.
- Data for single-nucleotide polymorphisms associated with the dysregulation of LDL and HDL metabolism were extracted using the PLINK toolkit.
TAKEAWAY:
- Both high and low HDL levels were associated with an increased risk for AMD (adjusted odds ratio [aOR], 1.28 for both; both P < .001), whereas low and high levels of triglyceride and LDL did not demonstrate a statistically significant association with the risk for AMD.
- A history of smoking and statin use showed significant associations with an increased risk for AMD (aOR, 1.30 and 1.36, respectively; both P < .001).
- Single-nucleotide polymorphisms in the genes associated with HDL metabolism, ABCA1 and LIPC, were negatively associated with the risk for AMD (aOR, 0.88; P = .04 and aOR, 0.86; P = .001, respectively).
- Lipoprotein(a) or Lp(a) was identified as a novel single nucleotide polymorphism linked to an increased risk for AMD (aOR, 1.37; P = .007).
IN PRACTICE:
“Despite conflicting evidence regarding the relationship with elevated HDL and AMD risk, this is to our knowledge the first time a U-shaped relationship with low and high HDL and AMD has been described. In fact, the presence of a U-shaped relationship may explain inconsistency in prior analyses comparing mean HDL levels in AMD and control populations,” the study authors wrote.
SOURCE:
The study was led by Jimmy S. Chen, MD, of the Viterbi Family Department of Ophthalmology and Shiley Eye Institute at the University of California, San Diego. It was published online on January 3, 2025, in Ophthalmology.
LIMITATIONS:
The study was limited by the retrospective collection and analysis of data. The use of billing codes for diagnosis extraction may have introduced documentation inaccuracies. The subgroup analysis by severity of AMD was not performed.
DISCLOSURES:
One of the authors was funded by grants from the National Eye Institute (NEI), Research to Prevent Blindness Career Development Award, Robert Machemer MD and International Retinal Research Foundation, and the UC San Diego Academic Senate. Another author reported receiving a grant from the National Heart, Lung, and Blood Institute, while a third author received funding from the National Institutes of Health (NIH), NEI, and Research to Prevent Blindness. The All of Us Research Program was supported by grants from the NIH and other sources. The authors reported no conflicts of interest.
This article was created using several editorial tools, including AI, as part of the process. Human editors reviewed this content before publication. A version of this article appeared on Medscape.com.
Red Wine May Not Be a Health Tonic, But Is It a Cancer Risk?
Earlier this month, US surgeon general Vivek Murthy, MD, issued an advisory, calling for alcoholic beverages to carry a warning label about cancer risk. The advisory flagged alcohol as the third leading preventable cause of cancer in the United States, after tobacco and obesity, and highlighted people’s limited awareness about the relationship between alcohol and cancer risk.
But, when it comes to cancer risk, are all types of alcohol created equal?
For many years, red wine seemed to be an outlier, with studies indicating that, in moderation, it might even be good for you. Red wine has anti-inflammatory and antioxidant properties — most notably, it contains the antioxidant resveratrol. Starting in the 1990s, research began to hint that the compound might protect against heart disease, aging, and cancer, though much of this work was done in animals or test tubes.
The idea that red wine carries health benefits, however, has been called into question more recently. A recent meta-analysis, for instance, suggests that many previous studies touting the health benefits of more moderate drinking were likely biased, potentially leading to “misleading positive health associations.” And one recent study found that alcohol consumption, largely red wine and beer, at all levels was linked to an increased risk for cardiovascular disease.
Although wine’s health halo is dwindling, there might be an exception: Cancer risk.
Overall, research shows that even light to moderate drinking increases the risk for at least seven types of cancer, but when focusing on red wine, in particular, that risk calculus can look different.
“It’s very complicated and nuanced,” said Timothy Rebbeck, PhD, professor of cancer prevention, Harvard T.H. Chan School of Public Health, Boston. “And ‘complicated and nuanced’ doesn’t work very well in public health messages.”
The Knowns About Alcohol and Cancer Risk
Some things about the relationship between alcohol and cancer risk are crystal clear. “There’s no question that alcohol is a group 1 carcinogen,” Rebbeck said. “Alcohol can cause cancer.”
Groups including the International Agency for Research on Cancer (IARC) and American Cancer Society agree that alcohol use is an established cause of seven types of cancer: Those of the oral cavity, larynx, pharynx, esophagus (squamous cell carcinoma), liver (hepatocellular carcinoma), breast, and colon/rectum. Heavy drinking — at least 8 standard drinks a week for women and 15 for men — and binge drinking — 4 or more drinks in 2 hours for women and 5 or more for men — only amplify that risk. (A “standard” drink has 14 g of alcohol, which translates to a 5-oz glass of wine.)
“We’re most concerned about high-risk drinking — more than 2 drinks a day — and/or binge drinking,” said Noelle LoConte, MD, of the Division of Hematology, Medical Oncology and Palliative Care, University of Wisconsin School of Medicine and Public Health, Madison, who authored a 2018 statement on alcohol and cancer risk from the American Society of Clinical Oncology (ASCO).
Compared with not drinking, heavy drinking is linked with a roughly fivefold increase in the risk for oral cavity, pharyngeal, and esophageal cancers, and a 61% increase in the risk for breast cancer, according to LoConte and colleagues.
Things get murkier when it comes to moderate drinking — defined as up to 1 standard drink per day for women and 2 per day for men. There is evidence, LoConte said, that moderate drinking is associated with increased cancer risks, though the magnitude is generally much less than heavier drinking.
Cancer type also matters. One analysis found that the risk for breast cancer increased with even light to moderate alcohol consumption. Compared with no drinking, light to moderate drinking has also been linked to increased risks for oral cavity, pharynx, larynx, and esophageal cancers.
As for whether the type of alcoholic beverage matters, LoConte said, there’s no clear physiological reason that wine would be less risky than beer or liquor. Research indicates that ethanol is the problematic ingredient: Once ingested, it’s metabolized into acetaldehyde, a DNA-damaging substance that’s considered a probable human carcinogen. Ethanol can also alter circulating levels of estrogens and androgens, LoConte said, which is thought to drive its association with breast cancer risk.
“It likely doesn’t matter how you choose to get your ethanol,” she said. “It’s a question of volume.”
Hints That Wine Is an Outlier
Still, some studies suggest that how people ingest ethanol could make a difference.
A study published in August in JAMA Network Open is a case in point. The study found that, among older adults, light to heavy drinkers had an increased risk of dying from cancer, compared with occasional drinkers (though the increased risk among light to moderate drinkers occurred only among people who also had chronic health conditions, such as diabetes or high blood pressure, or were of lower socioeconomic status).
Wine drinkers fared differently. Most notably, drinkers who “preferred” wine — consuming over 80% of total ethanol from wine — or those who drank only with meals showed a small reduction in their risk for cancer mortality and all-cause mortality (hazard ratio [HR], 0.94 for both). The small protective association was somewhat stronger among people who reported both patterns (HR, 0.88), especially if they were of lower socioeconomic status (HR, 0.79).
The findings are in line with other research suggesting that wine drinkers may be outliers when it comes to cancer risk. A 2023 meta-analysis of 26 observational studies, for instance, found no association between wine consumption and any cancer type, with the caveat that there was «substantial» heterogeneity among the studies.
This heterogeneity caveat speaks to the inherent limitations of observational research, said Tim Stockwell, PhD, of the Canadian Institute for Substance Use Research, University of Victoria in British Columbia, Canada.
“Individual studies of alcohol and cancer risk do find differences by type of drink, or patterns of drinking,” Stockwell said. “But it’s so hard to unpack the confounding that goes along with the type of person who’s a wine drinker or a beer drinker or a spirit drinker. The beverage of choice seems to come with a lot of baggage.”
Compared with people who favor beer or liquor, he noted, wine aficionados are typically higher-income, exercise more often, smoke less, and have different diets, for example. The “best” studies, Rebbeck said, try to adjust for those differences, but it’s challenging.
The authors of the 2023 meta-analysis noted that “many components in wine could have anticarcinogenic effects” that theoretically could counter the ill effects of ethanol. Besides resveratrol, which is mainly found in red wine, the list includes anthocyanins, quercetin, and tannins. However, the authors also acknowledged that they couldn’t account for whether other lifestyle habits might explain why wine drinkers, overall, showed no increased cancer risks and sometimes lower risks.
Still, groups such as the IARC and ASCO hold that there is no known “safe” level, or type, of alcohol when it comes to cancer.
In the latest Canadian guidelines on alcohol use, the scientific panel calculated that people who have 6 drinks a week throughout adulthood (whatever the source of the alcohol) could shave 11 weeks from their life expectancy, on average, said Stockwell, who was on the guideline panel. Compare that with heavy drinking, where 4 drinks a day could rob the average person of 2 or 3 years. “If you’re drinking a lot, you could get huge benefits from cutting down,” Stockwell explained. “If you’re a moderate drinker, the benefits would obviously be less.”
Stockwell said that choices around drinking and breast cancer risk, specifically, can be “tough.” Unlike many of the other alcohol-associated cancers, he noted, breast cancer is common — so even small relative risk increases may be concerning. Based on a 2020 meta-analysis of 22 cohort studies, the risk for breast cancer rises by about 10%, on average, for every 10 g of alcohol a woman drinks per day. This study also found no evidence that wine is any different from other types of alcohol.
In real life, the calculus around wine consumption and cancer risk will probably vary widely from person to person, Rebbeck said. One woman with a family history of breast cancer might decide that having wine with dinner isn’t worth it. Another with the same family history might see that glass of wine as a stress reliever and opt to focus on other ways to reduce her breast cancer risk — by exercising and maintaining a healthy weight, for example.
“The bottom line is, in human studies, the data on light to moderate drinking and cancer are limited and messy, and you can’t draw firm conclusions from them,” Rebbeck said. “It probably raises risk in some people, but we don’t know who those people are. And the risk increases are relatively small.”
A Conversation Few Are Having
Even with many studies highlighting the connection between alcohol consumption and cancer risk, most people remain unaware about this risk.
A 2023 study by the National Cancer Institute found that only a minority of US adults knew that drinking alcohol is linked to increased cancer risk, and they were much less likely to say that was true of wine: Only 20% did, vs 31% who said that liquor can boost cancer risk. Meanwhile, 10% believed that wine helps prevent cancer. Other studies show that even among cancer survivors and patients undergoing active cancer treatment, many drink — often heavily.
“What we know right now is, physicians almost never talk about this,” LoConte said.
That could be due to time constraints, according to Rebbeck, or clinicians’ perceptions that the subject is too complicated and/or their own confusion about the data. There could also be some “cognitive dissonance” at play, LoConte noted, because many doctors drink alcohol.
It’s critical, she said, that conversations about drinking habits become “normalized,” and that should include informing patients that alcohol use is associated with certain cancers. Again, LoConte said, it’s high-risk drinking that’s most concerning and where reducing intake could have the biggest impact on cancer risk and other health outcomes.
“From a cancer prevention standpoint, it’s probably best not to drink,” she said. “But people don’t make choices based solely on cancer risk. We don’t want to come out with recommendations saying no one should drink. I don’t think the data support that, and people would buck against that advice.”
Rebbeck made a similar point. Even if there’s uncertainty about the risks for a daily glass of wine, he said, people can use that information to make decisions. “Everybody’s preferences and choices are going to be different,” Rebbeck said. “And that’s all we can really do.”
A version of this article appeared on Medscape.com.
Nutrition, Drugs, or Bariatric Surgery: What’s the Best Approach for Sustained Weight Loss?
Given that more than 100 million US adults have obesity, including 22 million with severe obesity, physicians regularly see patients with the condition in their practices.
Fortunately, doctors have more tools than ever to help their patients. But the question remains: Which method is the safest and most effective? Is it diet and lifestyle changes, one of the recently approved anti-obesity medications (AOMs), bariatric surgery, or a combination approach?
There are no head-to-head trials comparing these three approaches, said Vanita Rahman, MD, clinic director of the Barnard Medical Center, Washington, DC, at the International Conference on Nutrition in Medicine, sponsored by the Physicians Committee for Responsible Medicine.
Instead, doctors must evaluate the merits and drawbacks of each intervention and decide with their patients which treatment is best for them, she told Medscape Medical News. When she sees patients, Rahman shares the pertinent research with them, so they are able to make an informed choice.
Looking at the Options
In her presentation at the conference, Rahman summarized the guidelines issued by the American Heart Association/American College of Cardiology/The Obesity Society for Management of Overweight and Obesity in Adults and the American Association of Clinical Endocrinologists and American College of Endocrinology Comprehensive Clinical Practice Guidelines For Medical Care of Patients with Obesity, including lifestyle changes, AOMs, and bariatric surgery (Table 1).
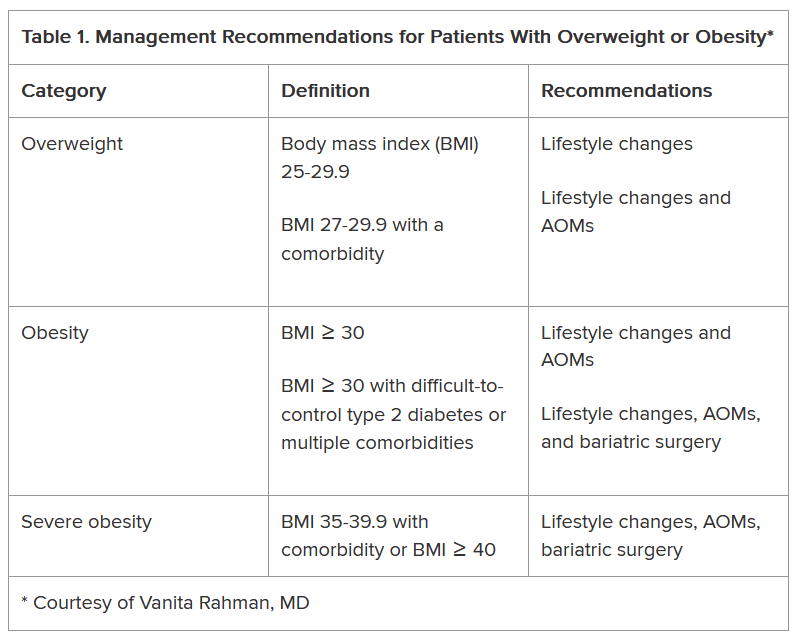
As shown, the current clinical guidelines offer recommendations that consider such factors as the patient’s BMI and presence of one or more comorbidities. Generally, they begin with lifestyle changes for people with overweight, the possibility of an AOM for those with obesity, and bariatric surgery as an option for those with severe obesity-related complications.
“In obesity, we traditionally thought the process was ‘either-or’ — either lifestyle or surgery or medication — and somehow lifestyle is better,” Sheethal Reddy, PhD, a psychologist at the Bariatric Center at Emory University Hospital Midtown, Atlanta, told Medscape Medical News.
Now physicians often use a combination of methods, but lifestyle is foundational to all of them, she said.
“If you don’t make lifestyle changes, none of the approaches will ultimately be effective,” said Reddy, who also is an assistant professor in the Division of General and GI Surgery at Emory School of Medicine, Atlanta.
Lifestyle changes don’t just involve diet and nutrition but include physical exercise.
“Being sedentary affects everything — sleep quality, appetite regulation, and metabolism. Without sufficient exercise, the body isn’t functioning well enough to have a healthy metabolism,” Reddy said.
How Durable Are the Interventions?
Although bariatric surgery has demonstrated effectiveness in helping patients lose weight, many of them regain some or most of it, Rahman said.
A systematic review and meta-analysis found weight regain in 49% of patients who underwent bariatric surgery patients, with the highest prevalence after Roux-en-Y gastric bypass.
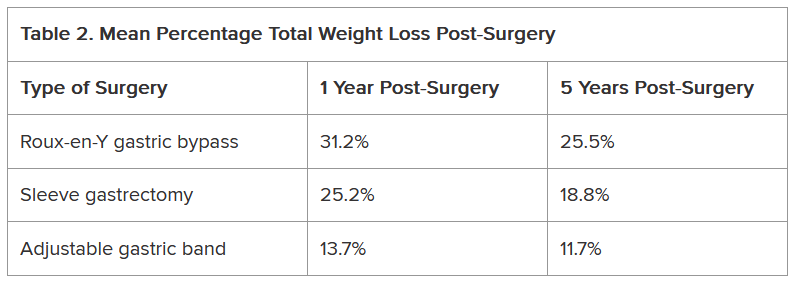
Another study of approximately 45,000 patients who underwent bariatric surgery found differences not only in the percentage of total weight loss among Roux-en-Y gastric bypass, sleeve gastrectomy, and adjustable gastric band procedures but also in how much of that weight stayed off between 1 and 5 years following the procedure (Table 2).
Weight regain also is a risk with AOMs, if they’re discontinued.
The STEP 1 trial tested the effectiveness of semaglutide — a glucagon-like peptide 1 (GLP-1) receptor agonist — as an adjunct to lifestyle intervention for weight loss in patients with obesity or with overweight and at least one comorbidity but not diabetes. Mean weight loss with semaglutide was 17.3% but that figure dropped 11.6 percentage points after treatment was discontinued.
Other studies also have found that patients regain weight after GLP-1 discontinuation.
Tirzepatide, a GLP-1 and glucose-dependent insulinotropic polypeptide (GIP) combination, has shown efficacy with weight reduction, but patients experienced some weight regain upon discontinuation. In one study, patients experienced a mean weight loss of 20.9% after 36 weeks of tirzepatide. In the study’s subsequent 52-week double-blind, placebo-controlled period, patients who stopped taking the medication experienced a weight regain of 14%, whereas those who remained on the medication lost an additional 5.5% of weight.
GLP-1 and GLP-1/GIP medications do not address the factors that contribute to overweight and obesity, Rahman said. “They simply suppress the appetite; therefore, weight gain occurs after stopping them.”
Patients may stop taking anti-obesity drugs for a variety of reasons, including side effects. Rahman noted that the common side effects include nausea, vomiting, and constipation, whereas rare side effects include gastroparesis, gallbladder and biliary disease, thyroid cancer, and suicidal thoughts. GLP-1 and GLP-1/GIP medications also carry a risk for non-arteritic anterior ischemic optic neuropathy, she said.
Moreover, health insurance does not always cover these medications, which likely affects patient access to the drugs and compliance rates.
“Given the side effects and frequent lack of insurance coverage, significant questions remain about long-term safety and feasibility of these agents,” Rahman said.
What About Nutritional Approaches?
The lifestyle interventions in the semaglutide and tirzepatide studies included 500 kcal/d deficit diets, which is difficult for people to maintain, noted Rahman, who is the author of the book Simply Plant Based: Fabulous Food for a Healthy Life.
Additionally, bariatric surgery has been associated with long-term micronutrient deficiencies, including deficiencies in vitamins A, D, E, K, B1, and B12, as well as folate, iron, zinc, copper, selenium, and calcium, she said.
The best approach to food from a patient compliance standpoint and to avoid nutrient deficiencies is a whole-food, plant-based diet, Rahman said. She advocates this nutritional approach, along with physical activity, for patients regardless of whether they’ve selected lifestyle intervention alone or combined with an AOM or bariatric surgery to address obesity.
Rahman cited a 5-year heart disease study comparing an intensive lifestyle program involving a vegetarian diet, aerobic exercise, stress management training, smoking cessation, and group psychosocial support to treatment as usual. Patients in the lifestyle group lost 10.9 kg at 1 year and sustained weight loss of 5.8 kg at 5 years, whereas weight in the control group remained relatively unchanged from baseline.
She also pointed to the findings of a study of patients with obesity or with overweight and at least one comorbidity that compared standard care with a low-fat, whole-food, plant-based diet with vitamin B12 supplementation. At 6 months, mean BMI reduction was greater in the intervention group than the standard care group (−4.4 vs −0.4).
In her practice, Rahman has seen the benefits of a whole-food, plant-based diet for patients with obesity.
If people are committed to this type of dietary approach and are given the tools and resources to do it effectively, “their thinking changes, their taste buds change, and they grow to enjoy this new way of eating,” she said. “They see results, and it’s a lifestyle that can be sustained long-term.”
Addressing Drivers of Weight Gain
Patients also need help addressing the various factors that may contribute to overweight and obesity, including overconsumption of ultra-processed foods, substandard nutritional quality of restaurant foods, increasing portion sizes, distraction during eating, emotional eating, late-night eating, and cultural/traditional values surrounding food, Rahman noted.
Supatra Tovar, PsyD, RD, a clinical psychologist with a practice in Pasadena, California, agreed that identifying the reasons for weight gain is critical for treatment.
“If you’re not addressing underlying issues, such as a person’s relationship with food, behaviors around food, the tendency to mindlessly eat or emotionally eat or eat to seek comfort, the person’s weight problems won’t ultimately be fully solved by any of the three approaches — dieting, medications, or bariatric surgery,” she said.
Some of her patients “engage in extreme dieting and deprivation, and many who use medications or have had bariatric surgery hardly eat and often develop nutritional deficiencies,” said Tovar, author of the book Deprogram Diet Culture: Rethink Your Relationship with Food, Heal Your Mind, and Live a Diet-Free Life.
The key to healthy and sustained weight loss is to “become attuned to the body’s signals, learn how to honor hunger, stop eating when satisfied, and eat more healthful foods, such as fruits and vegetables, whole grains, lean proteins — especially plant-based proteins — and the body gives signals that this is what it wants,” she said.
Tovar doesn’t give her clients a specific diet or set of portions.
“I teach them to listen to their bodies,” she said. “They’ve lost significant amounts of weight and continued to keep it off because they’ve done this kind of work.”
When Lifestyle Changes Aren’t Enough
For many patients, lifestyle interventions are insufficient to address the degree of overweight and obesity and common comorbidities, said W. Timothy Garvey, MD, associate director and professor, Department of Nutrition Sciences, School of Health Professions, University of Alabama at Birmingham.
“Of course, nutritional approaches are very important, not only for weight but also for general health-related reasons,” said Garvey, lead author of the 2016 American Association of Clinical Endocrinologists obesity guidelines. “We’ve seen that the Mediterranean and some plant-based diets can prevent progression from prediabetes to diabetes and improve other parameters that reflect metabolic health.”
However, it’s “not common that patients can follow these diets, lose weight, and keep it off,” Garvey cautioned. Up to 50% of weight that’s lost through lifestyle changes is typically regained by 1-year follow-up, with almost all remaining lost weight subsequently regained in the majority of individuals because the person “has to fight against pathophysiological process that drive weight regain,” he noted.
Weight-loss medications can address these pathophysiologic processes by “addressing interactions of satiety hormones with feeding centers in the brain, suppressing the appetite, and making it easier for patients to adhere to a reduced-calorie diet.”
Garvey views the weight-loss medications in the same light as drugs for diabetes and hypertension, in that people need to keep taking them to sustain the benefit.
There’s still a role for bariatric surgery because not everyone can tolerate the AOMs or achieve sufficient weight loss.
“Patients with very high BMI who have trouble ambulating might benefit from a combination of bariatric surgery and medication,” Garvey said.
While some side effects are associated with AOMs, being an “alarmist” about them can be detrimental to patients, he warned.
Rahman and Tovar are authors of books about weight loss. Reddy reported no relevant financial relationships. Garvey is a consultant on advisory boards for Boehringer Ingelheim, Eli Lilly, Novo Nordisk, Pfizer, Fractyl Health, Alnylam Pharmaceuticals, Inogen, Zealand, Allurion, Carmot/Roche, Terns Pharmaceuticals, Neurocrine, Keros Therapeutics, and Regeneron. He is the site principal investigator for multi-centered clinical trials sponsored by his university and funded by Novo Nordisk, Eli Lilly, Epitomee, Neurovalens, and Pfizer. He serves as a consultant on the advisory board for the nonprofit Milken Foundation and is a member of the Data Monitoring Committee for phase 3 clinical trials conducted by Boehringer-Ingelheim and Eli Lilly.
A version of this article first appeared on Medscape.com.
Given that more than 100 million US adults have obesity, including 22 million with severe obesity, physicians regularly see patients with the condition in their practices.
Fortunately, doctors have more tools than ever to help their patients. But the question remains: Which method is the safest and most effective? Is it diet and lifestyle changes, one of the recently approved anti-obesity medications (AOMs), bariatric surgery, or a combination approach?
There are no head-to-head trials comparing these three approaches, said Vanita Rahman, MD, clinic director of the Barnard Medical Center, Washington, DC, at the International Conference on Nutrition in Medicine, sponsored by the Physicians Committee for Responsible Medicine.
Instead, doctors must evaluate the merits and drawbacks of each intervention and decide with their patients which treatment is best for them, she told Medscape Medical News. When she sees patients, Rahman shares the pertinent research with them, so they are able to make an informed choice.
Looking at the Options
In her presentation at the conference, Rahman summarized the guidelines issued by the American Heart Association/American College of Cardiology/The Obesity Society for Management of Overweight and Obesity in Adults and the American Association of Clinical Endocrinologists and American College of Endocrinology Comprehensive Clinical Practice Guidelines For Medical Care of Patients with Obesity, including lifestyle changes, AOMs, and bariatric surgery (Table 1).
As shown, the current clinical guidelines offer recommendations that consider such factors as the patient’s BMI and presence of one or more comorbidities. Generally, they begin with lifestyle changes for people with overweight, the possibility of an AOM for those with obesity, and bariatric surgery as an option for those with severe obesity-related complications.
“In obesity, we traditionally thought the process was ‘either-or’ — either lifestyle or surgery or medication — and somehow lifestyle is better,” Sheethal Reddy, PhD, a psychologist at the Bariatric Center at Emory University Hospital Midtown, Atlanta, told Medscape Medical News.
Now physicians often use a combination of methods, but lifestyle is foundational to all of them, she said.
“If you don’t make lifestyle changes, none of the approaches will ultimately be effective,” said Reddy, who also is an assistant professor in the Division of General and GI Surgery at Emory School of Medicine, Atlanta.
Lifestyle changes don’t just involve diet and nutrition but include physical exercise.
“Being sedentary affects everything — sleep quality, appetite regulation, and metabolism. Without sufficient exercise, the body isn’t functioning well enough to have a healthy metabolism,” Reddy said.
How Durable Are the Interventions?
Although bariatric surgery has demonstrated effectiveness in helping patients lose weight, many of them regain some or most of it, Rahman said.
A systematic review and meta-analysis found weight regain in 49% of patients who underwent bariatric surgery patients, with the highest prevalence after Roux-en-Y gastric bypass.
Another study of approximately 45,000 patients who underwent bariatric surgery found differences not only in the percentage of total weight loss among Roux-en-Y gastric bypass, sleeve gastrectomy, and adjustable gastric band procedures but also in how much of that weight stayed off between 1 and 5 years following the procedure (Table 2).
Weight regain also is a risk with AOMs, if they’re discontinued.
The STEP 1 trial tested the effectiveness of semaglutide — a glucagon-like peptide 1 (GLP-1) receptor agonist — as an adjunct to lifestyle intervention for weight loss in patients with obesity or with overweight and at least one comorbidity but not diabetes. Mean weight loss with semaglutide was 17.3% but that figure dropped 11.6 percentage points after treatment was discontinued.
Other studies also have found that patients regain weight after GLP-1 discontinuation.
Tirzepatide, a GLP-1 and glucose-dependent insulinotropic polypeptide (GIP) combination, has shown efficacy with weight reduction, but patients experienced some weight regain upon discontinuation. In one study, patients experienced a mean weight loss of 20.9% after 36 weeks of tirzepatide. In the study’s subsequent 52-week double-blind, placebo-controlled period, patients who stopped taking the medication experienced a weight regain of 14%, whereas those who remained on the medication lost an additional 5.5% of weight.
GLP-1 and GLP-1/GIP medications do not address the factors that contribute to overweight and obesity, Rahman said. “They simply suppress the appetite; therefore, weight gain occurs after stopping them.”
Patients may stop taking anti-obesity drugs for a variety of reasons, including side effects. Rahman noted that the common side effects include nausea, vomiting, and constipation, whereas rare side effects include gastroparesis, gallbladder and biliary disease, thyroid cancer, and suicidal thoughts. GLP-1 and GLP-1/GIP medications also carry a risk for non-arteritic anterior ischemic optic neuropathy, she said.
Moreover, health insurance does not always cover these medications, which likely affects patient access to the drugs and compliance rates.
“Given the side effects and frequent lack of insurance coverage, significant questions remain about long-term safety and feasibility of these agents,” Rahman said.
What About Nutritional Approaches?
The lifestyle interventions in the semaglutide and tirzepatide studies included 500 kcal/d deficit diets, which is difficult for people to maintain, noted Rahman, who is the author of the book Simply Plant Based: Fabulous Food for a Healthy Life.
Additionally, bariatric surgery has been associated with long-term micronutrient deficiencies, including deficiencies in vitamins A, D, E, K, B1, and B12, as well as folate, iron, zinc, copper, selenium, and calcium, she said.
The best approach to food from a patient compliance standpoint and to avoid nutrient deficiencies is a whole-food, plant-based diet, Rahman said. She advocates this nutritional approach, along with physical activity, for patients regardless of whether they’ve selected lifestyle intervention alone or combined with an AOM or bariatric surgery to address obesity.
Rahman cited a 5-year heart disease study comparing an intensive lifestyle program involving a vegetarian diet, aerobic exercise, stress management training, smoking cessation, and group psychosocial support to treatment as usual. Patients in the lifestyle group lost 10.9 kg at 1 year and sustained weight loss of 5.8 kg at 5 years, whereas weight in the control group remained relatively unchanged from baseline.
She also pointed to the findings of a study of patients with obesity or with overweight and at least one comorbidity that compared standard care with a low-fat, whole-food, plant-based diet with vitamin B12 supplementation. At 6 months, mean BMI reduction was greater in the intervention group than the standard care group (−4.4 vs −0.4).
In her practice, Rahman has seen the benefits of a whole-food, plant-based diet for patients with obesity.
If people are committed to this type of dietary approach and are given the tools and resources to do it effectively, “their thinking changes, their taste buds change, and they grow to enjoy this new way of eating,” she said. “They see results, and it’s a lifestyle that can be sustained long-term.”
Addressing Drivers of Weight Gain
Patients also need help addressing the various factors that may contribute to overweight and obesity, including overconsumption of ultra-processed foods, substandard nutritional quality of restaurant foods, increasing portion sizes, distraction during eating, emotional eating, late-night eating, and cultural/traditional values surrounding food, Rahman noted.
Supatra Tovar, PsyD, RD, a clinical psychologist with a practice in Pasadena, California, agreed that identifying the reasons for weight gain is critical for treatment.
“If you’re not addressing underlying issues, such as a person’s relationship with food, behaviors around food, the tendency to mindlessly eat or emotionally eat or eat to seek comfort, the person’s weight problems won’t ultimately be fully solved by any of the three approaches — dieting, medications, or bariatric surgery,” she said.
Some of her patients “engage in extreme dieting and deprivation, and many who use medications or have had bariatric surgery hardly eat and often develop nutritional deficiencies,” said Tovar, author of the book Deprogram Diet Culture: Rethink Your Relationship with Food, Heal Your Mind, and Live a Diet-Free Life.
The key to healthy and sustained weight loss is to “become attuned to the body’s signals, learn how to honor hunger, stop eating when satisfied, and eat more healthful foods, such as fruits and vegetables, whole grains, lean proteins — especially plant-based proteins — and the body gives signals that this is what it wants,” she said.
Tovar doesn’t give her clients a specific diet or set of portions.
“I teach them to listen to their bodies,” she said. “They’ve lost significant amounts of weight and continued to keep it off because they’ve done this kind of work.”
When Lifestyle Changes Aren’t Enough
For many patients, lifestyle interventions are insufficient to address the degree of overweight and obesity and common comorbidities, said W. Timothy Garvey, MD, associate director and professor, Department of Nutrition Sciences, School of Health Professions, University of Alabama at Birmingham.
“Of course, nutritional approaches are very important, not only for weight but also for general health-related reasons,” said Garvey, lead author of the 2016 American Association of Clinical Endocrinologists obesity guidelines. “We’ve seen that the Mediterranean and some plant-based diets can prevent progression from prediabetes to diabetes and improve other parameters that reflect metabolic health.”
However, it’s “not common that patients can follow these diets, lose weight, and keep it off,” Garvey cautioned. Up to 50% of weight that’s lost through lifestyle changes is typically regained by 1-year follow-up, with almost all remaining lost weight subsequently regained in the majority of individuals because the person “has to fight against pathophysiological process that drive weight regain,” he noted.
Weight-loss medications can address these pathophysiologic processes by “addressing interactions of satiety hormones with feeding centers in the brain, suppressing the appetite, and making it easier for patients to adhere to a reduced-calorie diet.”
Garvey views the weight-loss medications in the same light as drugs for diabetes and hypertension, in that people need to keep taking them to sustain the benefit.
There’s still a role for bariatric surgery because not everyone can tolerate the AOMs or achieve sufficient weight loss.
“Patients with very high BMI who have trouble ambulating might benefit from a combination of bariatric surgery and medication,” Garvey said.
While some side effects are associated with AOMs, being an “alarmist” about them can be detrimental to patients, he warned.
Rahman and Tovar are authors of books about weight loss. Reddy reported no relevant financial relationships. Garvey is a consultant on advisory boards for Boehringer Ingelheim, Eli Lilly, Novo Nordisk, Pfizer, Fractyl Health, Alnylam Pharmaceuticals, Inogen, Zealand, Allurion, Carmot/Roche, Terns Pharmaceuticals, Neurocrine, Keros Therapeutics, and Regeneron. He is the site principal investigator for multi-centered clinical trials sponsored by his university and funded by Novo Nordisk, Eli Lilly, Epitomee, Neurovalens, and Pfizer. He serves as a consultant on the advisory board for the nonprofit Milken Foundation and is a member of the Data Monitoring Committee for phase 3 clinical trials conducted by Boehringer-Ingelheim and Eli Lilly.
A version of this article first appeared on Medscape.com.
How Does End of Life Impact Diabetes Care?
TOPLINE:
Among older adults with type 2 diabetes (T2D), the use of antidiabetes medications declined in the last year before death, with notable shifts from metformin and sulfonylureas toward insulin therapy.
METHODOLOGY:
Current recommendations emphasize a more liberal approach to glycemic control in people with a high burden of comorbidities and shorter life expectancy, but little is known about the changes and discontinuation patterns of diabetes medications among older adults near the end of life.
.
All medication classes available during the study period were considered, including short-acting and long-acting insulins, metformin, sulfonylureas, dipeptidyl peptidase-4 inhibitors, glucagon-like peptide 1 (GLP-1) receptor agonists, sodium-glucose cotransporter-2 (SGLT2) inhibitors, and other medications.
Analysis included temporal trends in prescribing antidiabetes medications, stratified by frailty using a validated claims-based frailty index, with scores ≥ 0.30 indicating higher frailty.
Antidiabetes medication fills were assessed within 1 year before death, examining changes across three time periods: 12 to 8 months, 8 to 4 months, and 4 to 0 months before death.
TAKEAWAY:
The proportion of older patients receiving antidiabetes medications increased slightly from 71.4% in 2015 to 72.9% in 2019, with metformin showing the largest increase from 40.7% to 46.5% (standardized mean difference [SMD], −0.12) and sulfonylureas showing the largest decrease from 37.0% to 31.8% (SMD, 0.11).
The use of newer diabetes medications with cardiovascular benefits, such as GLP-1 receptor agonists and SGLT2 inhibitors, remained less common but showed increasing trends over time.
The use of any antidiabetes medication decreased from 66.1% in the 9 to 12 months before death to 60.8% in the last 4 months of life (P < .01), primarily due to the reduced use of metformin and sulfonylureas.
The use of both short-acting and long-acting insulin agents increased toward the end of life (from 28.0% to 32.9% and from 41.2% to 43.9%, respectively; both P < .001) , particularly among frailer individuals.
IN PRACTICE:
“[The study] findings underscore important implications for diabetes management in patients nearing the end of life. With ~70% of patients with T2D using at least one antidiabetes medication, there is a need to consider further de-escalation or deprescribing in this vulnerable population,” the authors wrote.
SOURCE:
The study was led by Alexander Kutz, MD, MPH, MSc, Division of Pharmacoepidemiology and Pharmacoeconomics, Department of Medicine, Brigham and Women’s Hospital and Harvard Medical School, Boston, and was published online in Diabetes Care.
LIMITATIONS:
The study lacked details on the reasons for changes in medication patterns, making it unclear whether these changes were due to clinical guidelines or to reduce adverse events. Moreover, the study could not capture transitions or substitutions between medications, information on the dosage data, and causes of death.
DISCLOSURES:
This study was supported by the Division of Pharmacoepidemiology and Pharmacoeconomics, Department of Medicine, Brigham and Women’s Hospital, Harvard Medical School. Some authors reported receiving personal fees or research grants from the National Institutes of Health and other institutions and a few pharmaceutical companies. One author reported acting as a principal investigator and receiving a research grant from Boehringer-Ingelheim, unrelated to the work.
This article was created using several editorial tools, including AI, as part of the process. Human editors reviewed this content before publication. A version of this article appeared on Medscape.com.
AI-Enhanced ECG Used to Predict Hypertension and Associated Risks
TOPLINE:
in addition to traditional markers.
METHODOLOGY:
- Researchers conducted a development and external validation prognostic cohort study in a secondary care setting to identify individuals at risk for incident hypertension.
- They developed AIRE-HTN, which was trained on a derivation cohort from the Beth Israel Deaconess Medical Center in Boston, involving 1,163,401 ECGs from 189,539 patients (mean age, 57.7 years; 52.1% women; 64.5% White individuals).
- External validation was conducted on 65,610 ECGs from a UK-based volunteer cohort, drawn from an equal number of patients (mean age, 65.4 years; 51.5% women; 96.3% White individuals).
- Incident hypertension was evaluated in 19,423 individuals without hypertension from the medical center cohort and in 35,806 individuals without hypertension from the UK cohort.
TAKEAWAY:
- AIRE-HTN predicted incident hypertension with a C-index of 0.70 (95% CI, 0.69-0.71) in both the cohorts. Those in the quartile with the highest AIRE-HTN scores had a fourfold increased risk for incident hypertension (P < .001).
- The model’s predictive accuracy was maintained in individuals without left ventricular hypertrophy and those with normal ECGs and baseline blood pressure, indicating its robustness.
- The model was significantly additive to traditional clinical markers, with a continuous net reclassification index of 0.44 for the medical center cohort and 0.32 for the UK cohort.
- AIRE-HTN was an independent predictor of cardiovascular death (hazard ratio per 1-SD increase in score [HR], 2.24), heart failure (HR, 2.60), myocardial infarction (HR, 3.13), ischemic stroke (HR, 1.23), and chronic kidney disease (HR, 1.89) in outpatients from the medical center cohort (all P < .001), with largely consistent findings in the UK cohort.
IN PRACTICE:
“Results of exploratory and phenotypic analyses suggest the biological plausibility of these findings. Enhanced predictability could influence surveillance programs and primordial prevention,” the authors wrote.
SOURCE:
The study was led by Arunashis Sau, PhD, and Joseph Barker, MRes, National Heart and Lung Institute, Imperial College London, England. It was published online on January 2, 2025, in JAMA Cardiology.
LIMITATIONS:
In one cohort, hypertension was defined using International Classification of Diseases codes, which may lack granularity and not align with contemporary guidelines. The findings were not validated against ambulatory monitoring standards. The performance of the model in different populations and clinical settings remains to be explored.
DISCLOSURES:
The authors acknowledged receiving support from Imperial’s British Heart Foundation Centre for Excellence Award and disclosed receiving support from the British Heart Foundation, the National Institute for Health Research Imperial College Biomedical Research Centre, the EJP RD Research Mobility Fellowship, the Medical Research Council, and the Sir Jules Thorn Charitable Trust. Some authors reported receiving grants, personal fees, advisory fees, or laboratory work fees outside the submitted work.
This article was created using several editorial tools, including AI, as part of the process. Human editors reviewed this content before publication. A version of this article first appeared on Medscape.com.
Intensive BP Control May Benefit CKD Patients in Real World
TOPLINE:
The cardiovascular benefits observed with intensive blood pressure (BP) control in patients with hypertension and elevated cardiovascular risk from the Systolic Blood Pressure Intervention Trial (SPRINT) can be largely replicated in real-world settings among patients with chronic kidney disease (CKD), highlighting the advantages of adopting intensive BP targets.
METHODOLOGY:
- Researchers conducted a comparative effectiveness study to determine if the beneficial and adverse effects of intensive vs standard BP control observed in SPRINT were replicable in patients with CKD and hypertension in clinical practice.
- They identified 85,938 patients (mean age, 75.7 years; 95.0% men) and 13,983 patients (mean age, 77.4 years; 38.4% men) from the Veterans Health Administration (VHA) and Kaiser Permanente of Southern California (KPSC) databases, respectively.
- The treatment effect was estimated by combining baseline covariate, treatment, and outcome data of participants from the SPRINT with covariate data from the VHA and KPSC databases.
- The primary outcomes included major cardiovascular events, all-cause death, cognitive impairment, CKD progression, and adverse events at 4 years.
TAKEAWAY:
- Compared with SPRINT participants, those in the VHA and KPSC databases were older, had less prevalent cardiovascular disease, higher albuminuria, and used more statins.
- The benefits of intensive vs standard BP control on major cardiovascular events, all-cause mortality, and certain adverse events (hypotension, syncope, bradycardia, acute kidney injury, and electrolyte abnormality) were transferable from the trial to the VHA and KPSC populations.
- The treatment effect of intensive BP management on CKD progression was transportable to the KPSC population but not to the VHA population. However, the trial’s impact on cognitive outcomes, such as dementia, was not transportable to either the VHA or KPSC populations.
- On the absolute scale, intensive vs standard BP treatment showed greater cardiovascular benefits and fewer safety concerns in the VHA and KPSC populations than in the SPRINT.
IN PRACTICE:
“This example highlights the potential for transportability methods to provide insights that can bridge evidence gaps and inform the application of novel therapies to patients with CKD who are treated in everyday practice,” the authors wrote.
SOURCE:
This study was led by Manjula Kurella Tamura, MD, MPH, Division of Nephrology, Department of Medicine, Stanford University School of Medicine, Palo Alto, California. It was published online on January 7, 2025, in JAMA Network Open.
LIMITATIONS:
Transportability analyses could not account for characteristics that were not well-documented in electronic health records, such as limited life expectancy. The study was conducted before the widespread use of sodium-glucose cotransporter 2 inhibitors, glucagon-like peptide 1 receptor agonists, and nonsteroidal mineralocorticoid receptor antagonists, making it unclear whether intensive BP treatment would result in similar benefits with current pharmacotherapy regimens. Eligibility for this study was based on BP measurements in routine practice, which tend to be more variable than those collected in research settings.
DISCLOSURES:
This study was supported by grants from the National Institutes of Health. Some authors disclosed serving as a consultant and receiving grants, personal fees, and consulting fees from pharmaceutical companies and other sources.
This article was created using several editorial tools, including AI, as part of the process. Human editors reviewed this content before publication. A version of this article appeared on Medscape.com.
Pharmacist-Led Deprescribing of Aspirin for Primary Prevention of Cardiovascular Disease Among Geriatric Veterans
Pharmacist-Led Deprescribing of Aspirin for Primary Prevention of Cardiovascular Disease Among Geriatric Veterans
Low-dose aspirin commonly is used for the prevention of cardiovascular disease (CVD) but is associated with an increased risk of major bleeding.1 The use of aspirin for primary prevention is largely extrapolated from clinical trials showing benefit in the secondary prevention of myocardial infarction and ischemic stroke. However, results from the Aspirin in Reducing Events in the Elderly (ASPREE) trial challenged this practice.2 The ASPREE trial, conducted in the United States and Australia from 2010 to 2014, sought to determine whether daily 100 mg aspirin, was superior to placebo in promoting disability-free survival among older adults. Participants were aged ≥ 70 years (≥ 65 years for Hispanic and Black US participants), living in the community, and were free from preexisting CVD, cerebrovascular disease, or any chronic condition likely to limit survival to < 5 years. The study found no significant difference in the primary endpoints of death, dementia, or persistent physical disability, but there was a significantly higher risk of major hemorrhage in the aspirin group (3.8% vs 2.8%; hazard ratio, 1.38; 95% CI, 1.18-1.62; P < .001).
Several medical societies have updated their guideline recommendations for aspirin for primary prevention of CVD. The 2022 United States Public Service Task Force (USPSTF) provides a grade C recommendation (at least moderate certainty that the net benefit is small) to consider low-dose aspirin for the primary prevention of CVD on an individual patient basis for adults aged 40 to 59 years who have a ≥ 10% 10-year CVD risk. For adults aged ≥ 60 years, the USPSTF recommendation is grade D (moderate or high certainty that the practice has no net benefit or that harms outweigh the benefits) for low-dose aspirin use.1,3 The American College of Cardiology and American Heart Association (ACC/AHA) recommend considering low-dose aspirin for primary prevention of atherosclerotic cardiovascular disease (ASCVD) among select adults aged 40 to 70 years at higher CVD risk but not at increased risk of bleeding.4 The American Diabetes Association (ADA) recommends low-dose aspirin for primary prevention of CVD in patients with diabetes and additional risk factors such as family history of premature ASCVD, hypertension, dyslipidemia, smoking, or chronic kidney disease, and who are not at higher risk of bleeding.5 The ADA standards also caution against the use of aspirin as primary prevention in patients aged > 70 years. Low-dose aspirin use is not recommended for the primary prevention of CVD in older adults or adults of any age who are at increased risk of bleeding.
Recent literature using the US Department of Veterans Affairs (VA) Corporate Data Warehouse database confirms 86,555 of 1.8 million veterans aged > 70 years (5%) were taking low-dose aspirin for primary prevention of ASCVD despite guideline recommendations.6 Higher risk of gastrointestinal and other major bleeding from low-dose aspirin has been reported in the literature.1 Major bleeds represent a significant burden to the health care system with an estimated mean $13,093 cost for gastrointestinal bleed hospitalization.7
Considering the large scale aspirin use without appropriate indication within the veteran population, the risk of adverse effects, and the significant cost to patients and the health care system, it is imperative to determine the best approach to efficiently deprescribe aspirin for primary prevention among geriatric patients. Deprescribing refers to the systematic and supervised process of dose reduction or drug discontinuation with the goal of improving health and/or reducing the risk of adverse effects.8 During patient visits, primary care practitioners (PCPs) have opportunities to discontinue aspirin, but these encounters are time-limited and deprescribing might be secondary to more acute primary care needs. The shortage of PCPs is expected to worsen in coming years, which could further reduce their availability to assess inappropriate aspirin use.9
VA clinical pharmacist practitioners (CPPs) serve as medication experts and work autonomously under a broad scope of practice as part of the patient aligned care team.10-12 CPPs can free up time for PCPs and facilitate deprescribing efforts, especially for older adults. One retrospective cohort study conducted at a VA medical center found that CPPs deprescribed more potentially inappropriate medications among individuals aged ≥ 80 years compared with usual care with PCPs (26.8% vs 16.1%; P < .001).12,13 An aspirin deprescribing protocol conducted in 2022 resulted in nearly half of veterans aged ≥ 70 years contacted by phone agreeing to stop aspirin. Although this study supports the role pharmacists can play in reducing aspirin use in accordance with guidelines, the authors acknowledge that their interventions had a mean time of 12 minutes per patient and would require workflow changes.14 The purpose of this study is to evaluate the efficiency of aspirin deprescribing through 2 approaches: direct deprescribing by pharmacists using populationlevel review compared with clinicians following a pharmacist-led education.
Methods
This was a single-center quality improvement cohort study at the Durham VA Health Care System (DVAHCS) in North Carolina. Patients included were aged ≥ 70 years without known ASCVD who received care at any of 3 DVAHCS community-based outpatient clinics and prescribed aspirin. Patient data was obtained using the VIONE (Deprescribing Dashboard called Vital, Important, Optional, Not indicated, and Every medication has a specific indication or diagnosis) dashboard.15 VIONE was developed to identify potentially inappropriate medications (PIMs) that are eligible to deprescribe based on Beers Criteria, Screening Tool of Older Personsf Prescriptions criteria, and common clinical scenarios when clinicians determine the risk outweighs the benefit to continue a specific medication. 16,17 VIONE is used to reduce polypharmacy and improve patient safety, comfort, and medication adherence. Aspirin for patients aged ≥ 70 years without a history of ASCVD is a PIM identified by VIONE. Patients aged ≥ 70 years were chosen as an inclusion criteria in this study to match the ASPREE trial inclusion criteria and age inclusion criteria in the VIONE dashboard for aspirin deprescribing.2 Patient lists were generated for these potentially inappropriate aspirin prescriptions for 3 months before clinician staff education presentations, the day of the presentations, and 3 months after.
The primary endpoint was the number of veterans with aspirin deprescribed directly by 2 pharmacists over 12 weeks, divided by total patient care time spent, compared with the change in number of veterans with aspirin deprescribed by any DVAHCS physician, nurse practitioner, physician assistant, or CPP over 12 weeks, divided by the total pharmacist time spent on PCP education. Secondary endpoints were the number of aspirin orders discontinued by pharmacists and CPPs, the number of aspirin orders discontinued 12 weeks before pharmacist-led education compared with the number of aspirin orders discontinued 12 weeks after CPP-led education, average and median pharmacist time spent per patient encounter, and time of direct patient encounters vs time spent on PCP education.
Pharmacists reviewed each patient who met the inclusion criteria from the list generated by VIONE on December 1, 2022, for aspirin appropriateness according to the ACC/AHA and USPSTF guidelines, with the goal to discontinue aspirin for primary prevention of ASCVD and no other indications.1,4 Pharmacists documented their visits using VIONE methodology in the Computerized Patient Record System (CPRS) using a polypharmacy review note. CPPs contacted patients who were taking aspirin for primary prevention by unscheduled telephone call to assess for aspirin adherence, undocumented history of ASCVD, cardiovascular risk factors, and history of bleeding. Aspirin was discontinued if patients met guideline criteria recommendations and agreed to discontinuation. Risk-benefit discussions were completed when patients without known ASCVD were considered high risk because the ACC/AHA guidelines mention there is insufficient evidence of safety and efficacy of aspirin for primary prevention for patients with other known ASCVD risk factors (eg, strong family history of premature myocardial infarction, inability to achieve lipid, blood pressure, or glucose targets, or significant elevation in coronary artery calcium score).
High risk was defined as family history of premature ASCVD (in a male first-degree relative aged < 55 years or a female first-degree relative aged < 65 years), most recent blood pressure or 2 blood pressure results in the last 12 months > 160/100 mm Hg, recent hemoglobin A1c > 9%, and/or low-density lipoprotein > 190 mg/dL or not prescribed an indicated statin.3 Aspirin was continued or discontinued according to patient preference after the personalized risk-benefit discussion.
For patients with a clinical indication for aspirin use other than ASCVD (eg, atrial fibrillation not on anticoagulation, venous thromboembolism prophylaxis, carotid artery disease), CPPs documented their assessment and when appropriate deferred to the PCP for consideration of stopping aspirin. For patients with undocumented ASCVD, CPPs added their ASCVD history to their problem list and aspirin was continued. PCPs were notified by alert when aspirin was discontinued and when patients could not be reached by telephone.
presented a review of recent guideline updates and supporting literature at 2 online staff meetings. The education sessions lasted about 10 minutes and were presented to PCPs across 3 community-based outpatient clinics. An estimated 40 minutes were spent creating the PowerPoint education materials, seeking feedback, making edits, and answering questions or emails from PCPs after the presentation. During the presentation, pharmacists encouraged PCPs to discontinue aspirin (active VA prescriptions and reported over-the-counter use) for primary prevention of ASCVD in patients aged ≥ 70 years during their upcoming appointments and consider risk factors recommended by the ACC/AHA guidelines when applicable. PCPs were notified that CPPs planned to start a population review for discontinuing active VA aspirin prescriptions on December 1, 2022. The primary endpoint and secondary endpoints were analyzed using descriptive statistics. All data were analyzed using Microsoft Excel.
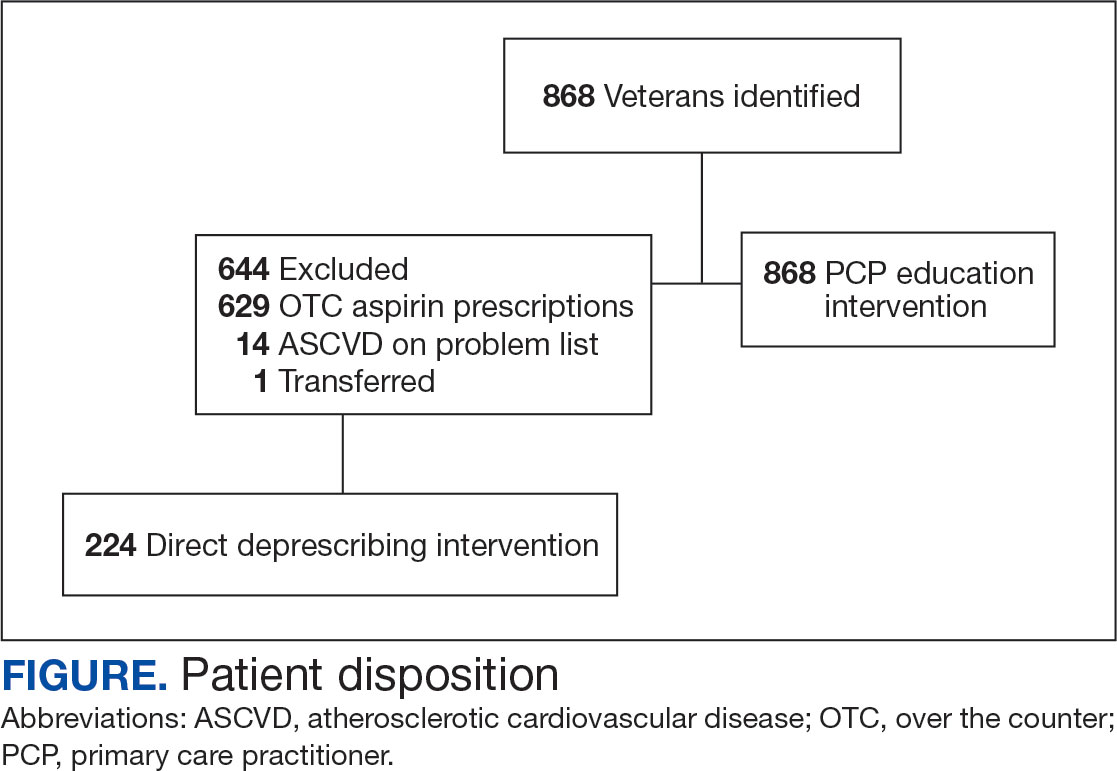
Results
A total of 868 patients aged ≥ 70 years with active prescriptions for aspirin were identified on December 1, 2022. After applying inclusion and exclusion criteria for the pharmacist population review, 224 patients were included for cohort final analysis (Figure). All 868 patients were eligible for the CPP intervention. Primary reasons for exclusion from the CPP population included over-thecounter aspirin and a history of ASCVD in the patient’s problem list. All patients were male, with a mean (SD) age of 75 (4.4) years (Table 1). Most patients were prescribed aspirin, 81 mg daily (n = 220; 98%).
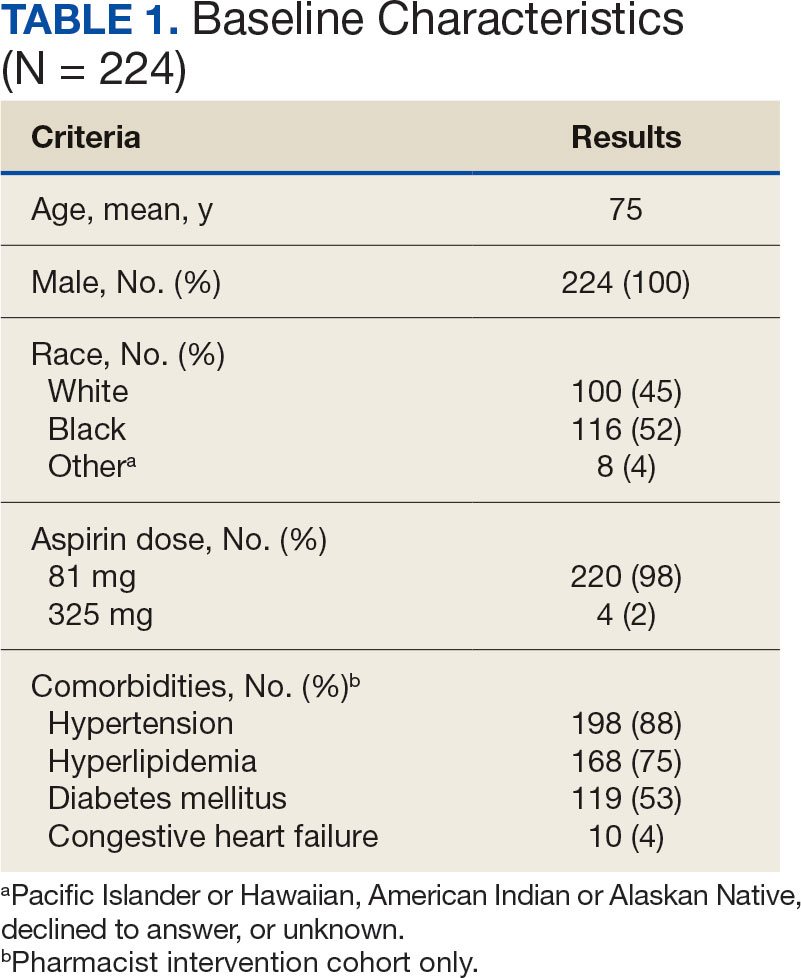
The direct CPP deprescribing intervention resulted in 2 aspirin prescriptions discontinued per hour of pharmacist time and 67 aspirin prescriptions discontinued per hour of pharmacist time via the PCP education intervention. CPPs discontinued 66 aspirin orders in the 12 weeks before the PCP education sessions. A total of 230 aspirin prescriptions were discontinued in the 12 weeks following the PCP education sessions, with 97 discontinued directly by CPPs and 133 discontinued by PCPs. The PCP education session yielded an additional 67 discontinued aspirin orders compared with the 12 weeks before the education sessions (Table 2).
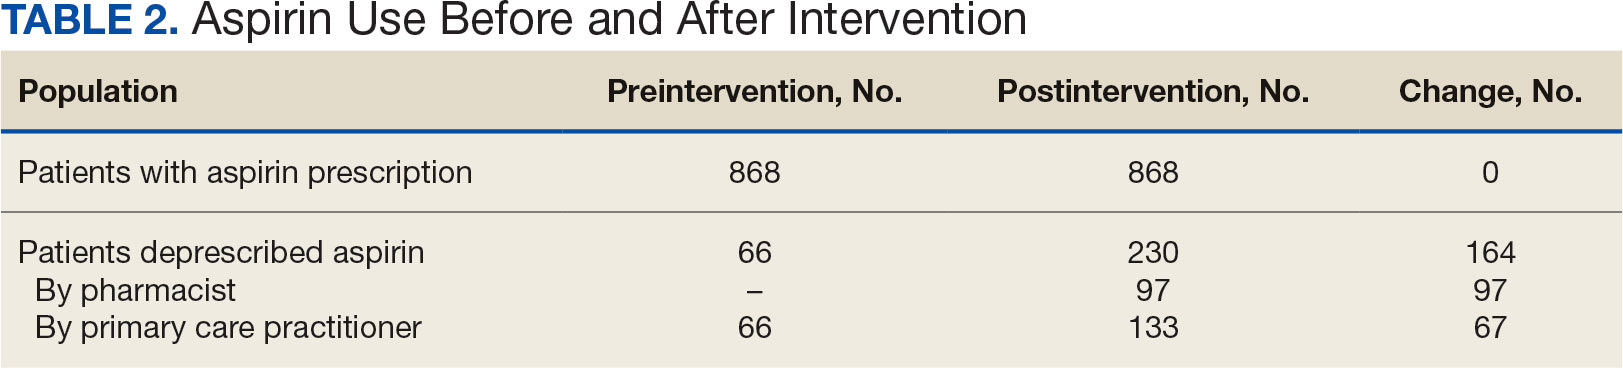
The CPP direct deprescribing intervention took about 48.3 hours, accounting for health record review and time interacting with patients. The PCP education intervention took about 60 minutes, which included time for preparing and delivering education materials (Table 3). CPP deprescribing encounter types, interventions, and related subcategories, and other identified indications to continue aspirin are listed in Table 4.
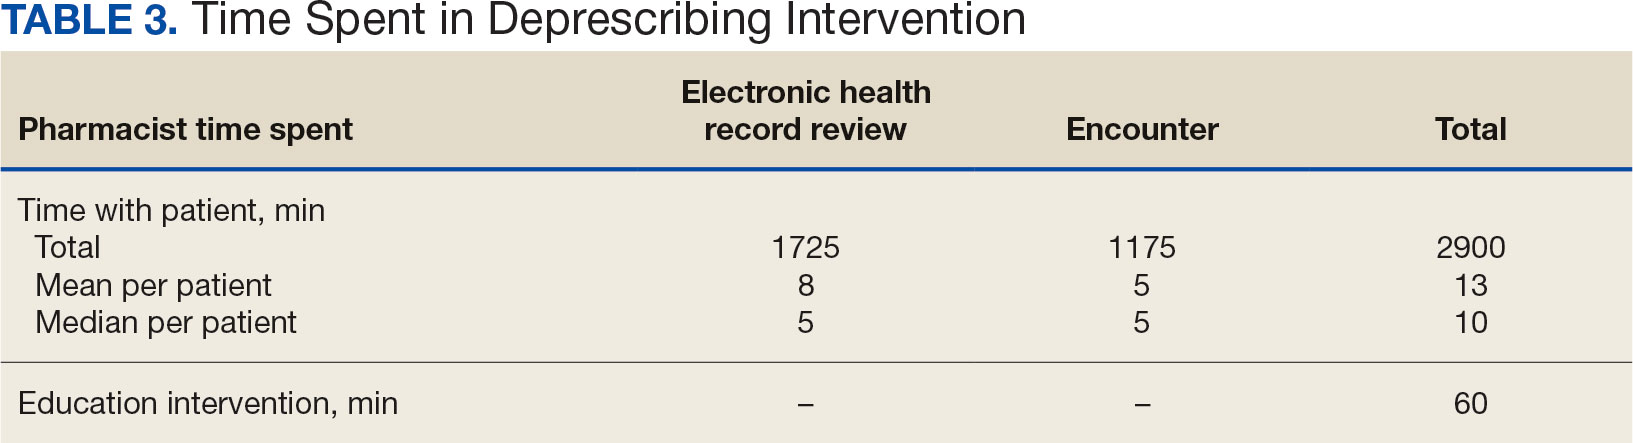
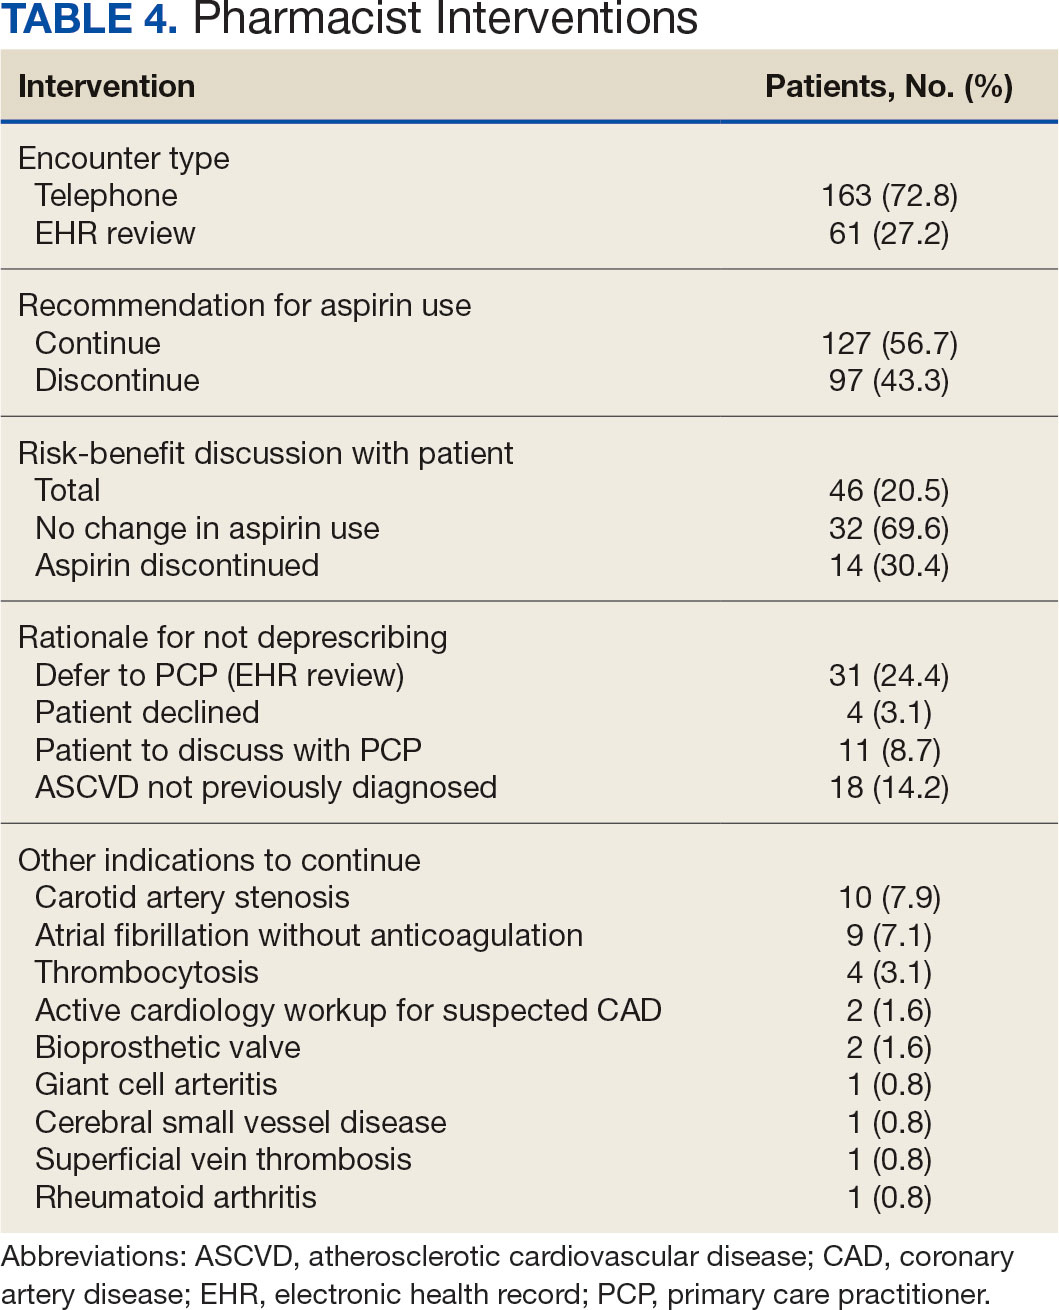
Discussion
Compared with direct deprescribing by pharmacists, the PCP education intervention was more efficient based on number of aspirin orders discontinued by pharmacist time. PCPs discontinued twice as many aspirin prescriptions in the 12 weeks after pharmacist-led education compared with the 12 weeks before.
Patients were primarily contacted by telephone (73%) for deprescribing. Among the 163 patients reached by phone and encouraged to discontinue aspirin, 97 patients (60%) accepted the recommendation, which was similar to the acceptance rates found in the literature (48% to 55%).14,18 Although many veterans continued taking aspirin (78%), most had indications for its continued use, such as a history of ASCVD, atrial fibrillation without anticoagulation, and carotid artery stenosis, and complex comorbidities that required further discussion with their PCP. Less common uses for aspirin were identified through CPRS review or patient reports included cerebral small vessel disease without history of ASCVD, subclavian artery stenosis, thrombocytosis, bioprosthetic valve replacement, giant cell arteritis, rheumatoid arthritis, and prevention of second eye involvement of ischemic optic neuropathy.
to describe the benefit of clinical pharmacy services for deprescribing aspirin for primary prevention of ASCVD through PCP education. Previously published literature has assessed alternative ways to identify or discontinue PIMs—including aspirin—among geriatric patients. One study evaluated the use of marking inappropriate aspirin prescriptions in the electronic health database, leading to a significant reduction in incidence of inappropriate aspirin prescribing; however, it did not assess changes in discontinuation rates of existing aspirin prescriptions.19 The previous VA pharmacist aspirin deprescribing protocol demonstrated pharmacists’ aptitude at discontinuing aspirin for primary prevention but only used direct patient contact and did not compare efficiency with other methods, including PCP education.14
This quality improvement project contributes new data to the existing literature to support the use of clinical pharmacists to discontinue aspirin for primary prevention and suggests a strong role for pharmacists as educators on clinical guidelines, in addition to their roles directly deprescribing PIMs in clinical practice. This study is further strengthened by its use of VIONE, which previously has demonstrated effectiveness in deprescribing a variety of PIMs in primary care settings.20
Despite using VIONE for generating a list of patients eligible for deprescription, our CPRS review found that this list was frequently inaccurate. For example, a small portion of patients were on the VIONE generated list indicating they had no ASCVD history, but had transient ischemic attack listed in their problem lists. Patient problem lists often were missing documented ASCVD history that was revealed by patient interview or CPRS review. It is possible that patients interviewed might have omitted relevant ASCVD history because of low health literacy, conditions affecting memory, or use of health care services outside the VA system.
There were several instances of aspirin used for other non-ASCVD indications, such as primary stroke prevention in atrial fibrillation. The ACC/AHA atrial fibrillation guidelines previously provided a Class IIb recommendation (benefit is greater than risk but additional studies are needed) for considering no antithrombic therapy or treatment with oral anticoagulant or aspirin for nonvalvular atrial fibrillation with CHA2DS2-VASc (Congestive heart failure, Hypertension, Age [> 65 y, 1 point; > 75 y, 2 points], Diabetes, previous Stroke/transient ischemic attack [2 points]) score of 1.21 The ACC/ AHA guidelines were updated in 2023 to recommend against antiplatelet therapy as an alternative to anticoagulation for reducing cardioembolic stroke risk among patients with atrial fibrillation with no indication for antiplatelet therapy because of risk of harm.22 If a patient has no risk factors for stroke, aspirin is not recommended to prevent thromboembolic events because of a lack of benefit. Interventions from this quality improvement study were completed before the 2023 atrial fibrillation guideline was published and therefore in this study aspirin was not discontinued when used for atrial fibrillation. Aspirin use for atrial fibrillation might benefit from similar discontinuation efforts analyzed within this study. Beyond atrial fibrillation, major guidelines do not comment on the use of aspirin for any other indications in the absence of clinical ASCVD.
Limitations
This study is limited by the lack of clinical consensus for complex patients and demonstrates the importance of individualized patient assessment when considering discontinuing aspirin. Because of the project’s relatively short intervention period, aspirin deprescribing rates could decrease over time and repeated education efforts might be necessary to see lasting impact. Health care professionals from services outside of primary care also might have discontinued aspirin during the study period unrelated to the education and these discontinued aspirin prescriptions could contribute to the higher rate observed among PCPs. This study included a specific population cohort of male, US veterans and might not reflect other populations where these interventions could be implemented.
The measurement of time spent by pharmacists and PCPs is an additional limitation. Although it is expected that PCPs attempt to discontinue aspirin during their existing patient care appointments, the time spent during visits was not measured or documented. Direct deprescribing by pharmacist CPRS review required a significant amount of time and could be a barrier to successful intervention by CPPs in patient aligned care teams.
To reduce the time pharmacists spent completing CPRS reviews, an aspirin deprescribing clinical reminder tool could be used to assess use and appropriate indication quickly during any primary care visit led by a PCP or CPP. In addition, it is recommended that pharmacists regularly educate health care professionals on guideline recommendations for aspirin use among geriatric patients. Future studies of the incidence of major cardiovascular events after aspirin deprescribing among geriatric patients and a longitudinal cost/benefit analysis could support these initiatives.
Conclusions
In this study, pharmacists successfully deprescribed inappropriate medications, such as aspirin. However, pharmacist-led PCP education is more efficient compared with direct deprescribing using a population-level review. PCP education requires less time and could allow ambulatory care pharmacists to spend more time on other direct patient care interventions to improve quality and access to care in primary care clinics. This study’s results further support the role of pharmacists in deprescribing PIMs for older adults and the use of a deprescribing tool, such as VIONE, in a primary care setting.
- US Preventive Services Task Force; Davidson KW, Barry MJ, et al. Aspirin use to prevent cardiovascular disease: US Preventive Services Task Force recommendation statement. JAMA. 2022;327(16):1577-1584. doi:10.1001/jama.2022.4983
- McNeil JJ, Nelson MR, Woods RL, et al. Effect of aspirin on all-cause mortality in the healthy elderly. N Engl J Med. 2018;379(16):1519-1528. doi:10.1056/NEJMoa1803955
- Barry MJ, Wolff TA, Pbert L, et al. Putting evidence into practice: an update on the US Preventive Services Task Force methods for developing recommendations for preventive services. Ann Fam Med. 2023;21(2):165-171. doi:10.1370/afm.2946
- Arnett DK, Blumenthal RS, Albert MA, et al. 2019 ACC/ AHA Guideline on the Primary Prevention of Cardiovascular Disease: A report of the American College of Cardiology/ American Heart Association Task Force on Clinical Practice Guidelines. Circulation. 2019;140(11):e596-e646. doi:10.1161/CIR.0000000000000678
- American Diabetes Association Professional Practice Committee. 10. Cardiovascular disease and risk management: Standards of care in diabetes-2024. Diabetes Care. 2024;47(Suppl 1):S179-S218. doi:10.2337/dc24-S010
- Ong SY, Chui P, Bhargava A, Justice A, Hauser RG. Estimating aspirin overuse for primary prevention of atherosclerotic cardiovascular disease (from a nationwide healthcare system). Am J Cardiol. 2020;137:25-30. doi:10.1016/j.amjcard.2020.09.042
- Weiss AJ, Jiang HJ. Overview of clinical conditions with frequent and costly hospital readmissions by payer, 2018. In: Healthcare Cost and Utilization Project (HCUP) Statistical Briefs. Agency for Healthcare Research and Quality (US); July 20, 2021.
- Krishnaswami A, Steinman MA, Goyal P, et al. Deprescribing in older adults with cardiovascular disease. J Am Coll Cardiol. 2019;73(20):2584-2595. doi:10.1016/j.jacc.2019.03.467
- Association of American Medical Colleges. The complexities of physician supply and demand: projections from 2019 to 2034. Accessed March 17, 2024. https://www.aamc.org/media/54681/download
- US Department of Veterans Affairs, Veterans Health Administration. VHA Directive 1108.07(1): General pharmacy service requirements. November 28, 2022. Accessed March 17, 2024. https://www.va.gov/vhapublications/ViewPublication.asp?pub_ID=10045
- US Department of Veterans Affairs, Veterans Health Administration. VHA Handbook 1108.11(3): Clinical pharmacy services. July 1, 2015. Accessed March 17, 2024. https://www.va.gov/vhapublications/ViewPublication.asp?pub_ID=3120
- US Department of Veterans Affairs. Clinical pharmacist practitioner (CPP) to improve access to and quality of care August 2021. August 2021. Accessed May 19, 2023. https://www.pbm.va.gov/PBM/CPPO/Documents/ExternalFactSheet_OptimizingtheCPPToImproveAccess_508.pdf
- Ammerman CA, Simpkins BA, Warman N, Downs TN. Potentially inappropriate medications in older adults: Deprescribing with a clinical pharmacist. J Am Geriatr Soc. 2019;67(1):115-118. doi:10.1111/jgs.15623
- Rothbauer K, Siodlak M, Dreischmeier E, Ranola TS, Welch L. Evaluation of a pharmacist-driven ambulatory aspirin deprescribing protocol. Fed Pract. 2022;39(suppl 5):S37- S41a. doi:10.12788/fp.0294
- US Department of Veterans Affairs. VIONE changes the way VA handles prescriptions. January 25, 2020. Accessed May 21, 2023. https://news.va.gov/70709/vione-changes-way-va-handles-prescriptions/
- 2023 American Geriatrics Society Beers Criteria Update Expert Panel. American Geriatrics Society 2023 updated AGS Beers Criteria for potentially inappropriate medication use in older adults. J Am Geriatr Soc. 2023;71(7):2052- 2081. doi:10.1111/jgs.18372
- O’Mahony D, Cherubini A, Guiteras AR, et al. STOPP/ START criteria for potentially inappropriate prescribing in older people: version 3. Eur Geriatr Med. 2023;14(4):625- 632. doi:10.1007/s41999-023-00777-y
- Draeger C, Lodhi F, Geissinger N, Larson T, Griesbach S. Interdisciplinary deprescribing of aspirin through prescriber education and provision of patient-specific recommendations. WMJ. 2022;121(3):220-225
- de Lusignan S, Hinton W, Seidu S, et al. Dashboards to reduce inappropriate prescribing of metformin and aspirin: A quality assurance programme in a primary care sentinel network. Prim Care Diabetes. 2021;15(6):1075-1079. doi:10.1016/j.pcd.2021.06.003
- Nelson MW, Downs TN, Puglisi GM, Simpkins BA, Collier AS. Use of a deprescribing tool in an interdisciplinary primary-care patient-aligned care team. Sr Care Pharm. 2022;37(1):34-43. doi:10.4140/TCP.n.2022.34
- January CT, Wann LS, Alpert JS, et al. 2014 AHA/ ACC/HRS guideline for the management of patients with atrial fibrillation: a report of the American College of Cardiology/American Heart Association Task Force on practice guidelines and the Heart Rhythm Society. Circulation. 2014;130(23):e199-e267. doi:10.1161/CIR.0000000000000041
- Joglar JA, Chung MK, Armbruster AL, et al. 2023 ACC/ AHA/ACCP/HRS Guideline for the Diagnosis and Management of Atrial Fibrillation: A Report of the American College of Cardiology/American Heart Association Joint Committee on Clinical Practice Guidelines Circulation. 2024;149(1):e1- e156. doi:10.1161/CIR.0000000000001193
Low-dose aspirin commonly is used for the prevention of cardiovascular disease (CVD) but is associated with an increased risk of major bleeding.1 The use of aspirin for primary prevention is largely extrapolated from clinical trials showing benefit in the secondary prevention of myocardial infarction and ischemic stroke. However, results from the Aspirin in Reducing Events in the Elderly (ASPREE) trial challenged this practice.2 The ASPREE trial, conducted in the United States and Australia from 2010 to 2014, sought to determine whether daily 100 mg aspirin, was superior to placebo in promoting disability-free survival among older adults. Participants were aged ≥ 70 years (≥ 65 years for Hispanic and Black US participants), living in the community, and were free from preexisting CVD, cerebrovascular disease, or any chronic condition likely to limit survival to < 5 years. The study found no significant difference in the primary endpoints of death, dementia, or persistent physical disability, but there was a significantly higher risk of major hemorrhage in the aspirin group (3.8% vs 2.8%; hazard ratio, 1.38; 95% CI, 1.18-1.62; P < .001).
Several medical societies have updated their guideline recommendations for aspirin for primary prevention of CVD. The 2022 United States Public Service Task Force (USPSTF) provides a grade C recommendation (at least moderate certainty that the net benefit is small) to consider low-dose aspirin for the primary prevention of CVD on an individual patient basis for adults aged 40 to 59 years who have a ≥ 10% 10-year CVD risk. For adults aged ≥ 60 years, the USPSTF recommendation is grade D (moderate or high certainty that the practice has no net benefit or that harms outweigh the benefits) for low-dose aspirin use.1,3 The American College of Cardiology and American Heart Association (ACC/AHA) recommend considering low-dose aspirin for primary prevention of atherosclerotic cardiovascular disease (ASCVD) among select adults aged 40 to 70 years at higher CVD risk but not at increased risk of bleeding.4 The American Diabetes Association (ADA) recommends low-dose aspirin for primary prevention of CVD in patients with diabetes and additional risk factors such as family history of premature ASCVD, hypertension, dyslipidemia, smoking, or chronic kidney disease, and who are not at higher risk of bleeding.5 The ADA standards also caution against the use of aspirin as primary prevention in patients aged > 70 years. Low-dose aspirin use is not recommended for the primary prevention of CVD in older adults or adults of any age who are at increased risk of bleeding.
Recent literature using the US Department of Veterans Affairs (VA) Corporate Data Warehouse database confirms 86,555 of 1.8 million veterans aged > 70 years (5%) were taking low-dose aspirin for primary prevention of ASCVD despite guideline recommendations.6 Higher risk of gastrointestinal and other major bleeding from low-dose aspirin has been reported in the literature.1 Major bleeds represent a significant burden to the health care system with an estimated mean $13,093 cost for gastrointestinal bleed hospitalization.7
Considering the large scale aspirin use without appropriate indication within the veteran population, the risk of adverse effects, and the significant cost to patients and the health care system, it is imperative to determine the best approach to efficiently deprescribe aspirin for primary prevention among geriatric patients. Deprescribing refers to the systematic and supervised process of dose reduction or drug discontinuation with the goal of improving health and/or reducing the risk of adverse effects.8 During patient visits, primary care practitioners (PCPs) have opportunities to discontinue aspirin, but these encounters are time-limited and deprescribing might be secondary to more acute primary care needs. The shortage of PCPs is expected to worsen in coming years, which could further reduce their availability to assess inappropriate aspirin use.9
VA clinical pharmacist practitioners (CPPs) serve as medication experts and work autonomously under a broad scope of practice as part of the patient aligned care team.10-12 CPPs can free up time for PCPs and facilitate deprescribing efforts, especially for older adults. One retrospective cohort study conducted at a VA medical center found that CPPs deprescribed more potentially inappropriate medications among individuals aged ≥ 80 years compared with usual care with PCPs (26.8% vs 16.1%; P < .001).12,13 An aspirin deprescribing protocol conducted in 2022 resulted in nearly half of veterans aged ≥ 70 years contacted by phone agreeing to stop aspirin. Although this study supports the role pharmacists can play in reducing aspirin use in accordance with guidelines, the authors acknowledge that their interventions had a mean time of 12 minutes per patient and would require workflow changes.14 The purpose of this study is to evaluate the efficiency of aspirin deprescribing through 2 approaches: direct deprescribing by pharmacists using populationlevel review compared with clinicians following a pharmacist-led education.
Methods
This was a single-center quality improvement cohort study at the Durham VA Health Care System (DVAHCS) in North Carolina. Patients included were aged ≥ 70 years without known ASCVD who received care at any of 3 DVAHCS community-based outpatient clinics and prescribed aspirin. Patient data was obtained using the VIONE (Deprescribing Dashboard called Vital, Important, Optional, Not indicated, and Every medication has a specific indication or diagnosis) dashboard.15 VIONE was developed to identify potentially inappropriate medications (PIMs) that are eligible to deprescribe based on Beers Criteria, Screening Tool of Older Personsf Prescriptions criteria, and common clinical scenarios when clinicians determine the risk outweighs the benefit to continue a specific medication. 16,17 VIONE is used to reduce polypharmacy and improve patient safety, comfort, and medication adherence. Aspirin for patients aged ≥ 70 years without a history of ASCVD is a PIM identified by VIONE. Patients aged ≥ 70 years were chosen as an inclusion criteria in this study to match the ASPREE trial inclusion criteria and age inclusion criteria in the VIONE dashboard for aspirin deprescribing.2 Patient lists were generated for these potentially inappropriate aspirin prescriptions for 3 months before clinician staff education presentations, the day of the presentations, and 3 months after.
The primary endpoint was the number of veterans with aspirin deprescribed directly by 2 pharmacists over 12 weeks, divided by total patient care time spent, compared with the change in number of veterans with aspirin deprescribed by any DVAHCS physician, nurse practitioner, physician assistant, or CPP over 12 weeks, divided by the total pharmacist time spent on PCP education. Secondary endpoints were the number of aspirin orders discontinued by pharmacists and CPPs, the number of aspirin orders discontinued 12 weeks before pharmacist-led education compared with the number of aspirin orders discontinued 12 weeks after CPP-led education, average and median pharmacist time spent per patient encounter, and time of direct patient encounters vs time spent on PCP education.
Pharmacists reviewed each patient who met the inclusion criteria from the list generated by VIONE on December 1, 2022, for aspirin appropriateness according to the ACC/AHA and USPSTF guidelines, with the goal to discontinue aspirin for primary prevention of ASCVD and no other indications.1,4 Pharmacists documented their visits using VIONE methodology in the Computerized Patient Record System (CPRS) using a polypharmacy review note. CPPs contacted patients who were taking aspirin for primary prevention by unscheduled telephone call to assess for aspirin adherence, undocumented history of ASCVD, cardiovascular risk factors, and history of bleeding. Aspirin was discontinued if patients met guideline criteria recommendations and agreed to discontinuation. Risk-benefit discussions were completed when patients without known ASCVD were considered high risk because the ACC/AHA guidelines mention there is insufficient evidence of safety and efficacy of aspirin for primary prevention for patients with other known ASCVD risk factors (eg, strong family history of premature myocardial infarction, inability to achieve lipid, blood pressure, or glucose targets, or significant elevation in coronary artery calcium score).
High risk was defined as family history of premature ASCVD (in a male first-degree relative aged < 55 years or a female first-degree relative aged < 65 years), most recent blood pressure or 2 blood pressure results in the last 12 months > 160/100 mm Hg, recent hemoglobin A1c > 9%, and/or low-density lipoprotein > 190 mg/dL or not prescribed an indicated statin.3 Aspirin was continued or discontinued according to patient preference after the personalized risk-benefit discussion.
For patients with a clinical indication for aspirin use other than ASCVD (eg, atrial fibrillation not on anticoagulation, venous thromboembolism prophylaxis, carotid artery disease), CPPs documented their assessment and when appropriate deferred to the PCP for consideration of stopping aspirin. For patients with undocumented ASCVD, CPPs added their ASCVD history to their problem list and aspirin was continued. PCPs were notified by alert when aspirin was discontinued and when patients could not be reached by telephone.
presented a review of recent guideline updates and supporting literature at 2 online staff meetings. The education sessions lasted about 10 minutes and were presented to PCPs across 3 community-based outpatient clinics. An estimated 40 minutes were spent creating the PowerPoint education materials, seeking feedback, making edits, and answering questions or emails from PCPs after the presentation. During the presentation, pharmacists encouraged PCPs to discontinue aspirin (active VA prescriptions and reported over-the-counter use) for primary prevention of ASCVD in patients aged ≥ 70 years during their upcoming appointments and consider risk factors recommended by the ACC/AHA guidelines when applicable. PCPs were notified that CPPs planned to start a population review for discontinuing active VA aspirin prescriptions on December 1, 2022. The primary endpoint and secondary endpoints were analyzed using descriptive statistics. All data were analyzed using Microsoft Excel.
Results
A total of 868 patients aged ≥ 70 years with active prescriptions for aspirin were identified on December 1, 2022. After applying inclusion and exclusion criteria for the pharmacist population review, 224 patients were included for cohort final analysis (Figure). All 868 patients were eligible for the CPP intervention. Primary reasons for exclusion from the CPP population included over-thecounter aspirin and a history of ASCVD in the patient’s problem list. All patients were male, with a mean (SD) age of 75 (4.4) years (Table 1). Most patients were prescribed aspirin, 81 mg daily (n = 220; 98%).
The direct CPP deprescribing intervention resulted in 2 aspirin prescriptions discontinued per hour of pharmacist time and 67 aspirin prescriptions discontinued per hour of pharmacist time via the PCP education intervention. CPPs discontinued 66 aspirin orders in the 12 weeks before the PCP education sessions. A total of 230 aspirin prescriptions were discontinued in the 12 weeks following the PCP education sessions, with 97 discontinued directly by CPPs and 133 discontinued by PCPs. The PCP education session yielded an additional 67 discontinued aspirin orders compared with the 12 weeks before the education sessions (Table 2).
The CPP direct deprescribing intervention took about 48.3 hours, accounting for health record review and time interacting with patients. The PCP education intervention took about 60 minutes, which included time for preparing and delivering education materials (Table 3). CPP deprescribing encounter types, interventions, and related subcategories, and other identified indications to continue aspirin are listed in Table 4.
Discussion
Compared with direct deprescribing by pharmacists, the PCP education intervention was more efficient based on number of aspirin orders discontinued by pharmacist time. PCPs discontinued twice as many aspirin prescriptions in the 12 weeks after pharmacist-led education compared with the 12 weeks before.
Patients were primarily contacted by telephone (73%) for deprescribing. Among the 163 patients reached by phone and encouraged to discontinue aspirin, 97 patients (60%) accepted the recommendation, which was similar to the acceptance rates found in the literature (48% to 55%).14,18 Although many veterans continued taking aspirin (78%), most had indications for its continued use, such as a history of ASCVD, atrial fibrillation without anticoagulation, and carotid artery stenosis, and complex comorbidities that required further discussion with their PCP. Less common uses for aspirin were identified through CPRS review or patient reports included cerebral small vessel disease without history of ASCVD, subclavian artery stenosis, thrombocytosis, bioprosthetic valve replacement, giant cell arteritis, rheumatoid arthritis, and prevention of second eye involvement of ischemic optic neuropathy.
to describe the benefit of clinical pharmacy services for deprescribing aspirin for primary prevention of ASCVD through PCP education. Previously published literature has assessed alternative ways to identify or discontinue PIMs—including aspirin—among geriatric patients. One study evaluated the use of marking inappropriate aspirin prescriptions in the electronic health database, leading to a significant reduction in incidence of inappropriate aspirin prescribing; however, it did not assess changes in discontinuation rates of existing aspirin prescriptions.19 The previous VA pharmacist aspirin deprescribing protocol demonstrated pharmacists’ aptitude at discontinuing aspirin for primary prevention but only used direct patient contact and did not compare efficiency with other methods, including PCP education.14
This quality improvement project contributes new data to the existing literature to support the use of clinical pharmacists to discontinue aspirin for primary prevention and suggests a strong role for pharmacists as educators on clinical guidelines, in addition to their roles directly deprescribing PIMs in clinical practice. This study is further strengthened by its use of VIONE, which previously has demonstrated effectiveness in deprescribing a variety of PIMs in primary care settings.20
Despite using VIONE for generating a list of patients eligible for deprescription, our CPRS review found that this list was frequently inaccurate. For example, a small portion of patients were on the VIONE generated list indicating they had no ASCVD history, but had transient ischemic attack listed in their problem lists. Patient problem lists often were missing documented ASCVD history that was revealed by patient interview or CPRS review. It is possible that patients interviewed might have omitted relevant ASCVD history because of low health literacy, conditions affecting memory, or use of health care services outside the VA system.
There were several instances of aspirin used for other non-ASCVD indications, such as primary stroke prevention in atrial fibrillation. The ACC/AHA atrial fibrillation guidelines previously provided a Class IIb recommendation (benefit is greater than risk but additional studies are needed) for considering no antithrombic therapy or treatment with oral anticoagulant or aspirin for nonvalvular atrial fibrillation with CHA2DS2-VASc (Congestive heart failure, Hypertension, Age [> 65 y, 1 point; > 75 y, 2 points], Diabetes, previous Stroke/transient ischemic attack [2 points]) score of 1.21 The ACC/ AHA guidelines were updated in 2023 to recommend against antiplatelet therapy as an alternative to anticoagulation for reducing cardioembolic stroke risk among patients with atrial fibrillation with no indication for antiplatelet therapy because of risk of harm.22 If a patient has no risk factors for stroke, aspirin is not recommended to prevent thromboembolic events because of a lack of benefit. Interventions from this quality improvement study were completed before the 2023 atrial fibrillation guideline was published and therefore in this study aspirin was not discontinued when used for atrial fibrillation. Aspirin use for atrial fibrillation might benefit from similar discontinuation efforts analyzed within this study. Beyond atrial fibrillation, major guidelines do not comment on the use of aspirin for any other indications in the absence of clinical ASCVD.
Limitations
This study is limited by the lack of clinical consensus for complex patients and demonstrates the importance of individualized patient assessment when considering discontinuing aspirin. Because of the project’s relatively short intervention period, aspirin deprescribing rates could decrease over time and repeated education efforts might be necessary to see lasting impact. Health care professionals from services outside of primary care also might have discontinued aspirin during the study period unrelated to the education and these discontinued aspirin prescriptions could contribute to the higher rate observed among PCPs. This study included a specific population cohort of male, US veterans and might not reflect other populations where these interventions could be implemented.
The measurement of time spent by pharmacists and PCPs is an additional limitation. Although it is expected that PCPs attempt to discontinue aspirin during their existing patient care appointments, the time spent during visits was not measured or documented. Direct deprescribing by pharmacist CPRS review required a significant amount of time and could be a barrier to successful intervention by CPPs in patient aligned care teams.
To reduce the time pharmacists spent completing CPRS reviews, an aspirin deprescribing clinical reminder tool could be used to assess use and appropriate indication quickly during any primary care visit led by a PCP or CPP. In addition, it is recommended that pharmacists regularly educate health care professionals on guideline recommendations for aspirin use among geriatric patients. Future studies of the incidence of major cardiovascular events after aspirin deprescribing among geriatric patients and a longitudinal cost/benefit analysis could support these initiatives.
Conclusions
In this study, pharmacists successfully deprescribed inappropriate medications, such as aspirin. However, pharmacist-led PCP education is more efficient compared with direct deprescribing using a population-level review. PCP education requires less time and could allow ambulatory care pharmacists to spend more time on other direct patient care interventions to improve quality and access to care in primary care clinics. This study’s results further support the role of pharmacists in deprescribing PIMs for older adults and the use of a deprescribing tool, such as VIONE, in a primary care setting.
- US Preventive Services Task Force; Davidson KW, Barry MJ, et al. Aspirin use to prevent cardiovascular disease: US Preventive Services Task Force recommendation statement. JAMA. 2022;327(16):1577-1584. doi:10.1001/jama.2022.4983
- McNeil JJ, Nelson MR, Woods RL, et al. Effect of aspirin on all-cause mortality in the healthy elderly. N Engl J Med. 2018;379(16):1519-1528. doi:10.1056/NEJMoa1803955
- Barry MJ, Wolff TA, Pbert L, et al. Putting evidence into practice: an update on the US Preventive Services Task Force methods for developing recommendations for preventive services. Ann Fam Med. 2023;21(2):165-171. doi:10.1370/afm.2946
- Arnett DK, Blumenthal RS, Albert MA, et al. 2019 ACC/ AHA Guideline on the Primary Prevention of Cardiovascular Disease: A report of the American College of Cardiology/ American Heart Association Task Force on Clinical Practice Guidelines. Circulation. 2019;140(11):e596-e646. doi:10.1161/CIR.0000000000000678
- American Diabetes Association Professional Practice Committee. 10. Cardiovascular disease and risk management: Standards of care in diabetes-2024. Diabetes Care. 2024;47(Suppl 1):S179-S218. doi:10.2337/dc24-S010
- Ong SY, Chui P, Bhargava A, Justice A, Hauser RG. Estimating aspirin overuse for primary prevention of atherosclerotic cardiovascular disease (from a nationwide healthcare system). Am J Cardiol. 2020;137:25-30. doi:10.1016/j.amjcard.2020.09.042
- Weiss AJ, Jiang HJ. Overview of clinical conditions with frequent and costly hospital readmissions by payer, 2018. In: Healthcare Cost and Utilization Project (HCUP) Statistical Briefs. Agency for Healthcare Research and Quality (US); July 20, 2021.
- Krishnaswami A, Steinman MA, Goyal P, et al. Deprescribing in older adults with cardiovascular disease. J Am Coll Cardiol. 2019;73(20):2584-2595. doi:10.1016/j.jacc.2019.03.467
- Association of American Medical Colleges. The complexities of physician supply and demand: projections from 2019 to 2034. Accessed March 17, 2024. https://www.aamc.org/media/54681/download
- US Department of Veterans Affairs, Veterans Health Administration. VHA Directive 1108.07(1): General pharmacy service requirements. November 28, 2022. Accessed March 17, 2024. https://www.va.gov/vhapublications/ViewPublication.asp?pub_ID=10045
- US Department of Veterans Affairs, Veterans Health Administration. VHA Handbook 1108.11(3): Clinical pharmacy services. July 1, 2015. Accessed March 17, 2024. https://www.va.gov/vhapublications/ViewPublication.asp?pub_ID=3120
- US Department of Veterans Affairs. Clinical pharmacist practitioner (CPP) to improve access to and quality of care August 2021. August 2021. Accessed May 19, 2023. https://www.pbm.va.gov/PBM/CPPO/Documents/ExternalFactSheet_OptimizingtheCPPToImproveAccess_508.pdf
- Ammerman CA, Simpkins BA, Warman N, Downs TN. Potentially inappropriate medications in older adults: Deprescribing with a clinical pharmacist. J Am Geriatr Soc. 2019;67(1):115-118. doi:10.1111/jgs.15623
- Rothbauer K, Siodlak M, Dreischmeier E, Ranola TS, Welch L. Evaluation of a pharmacist-driven ambulatory aspirin deprescribing protocol. Fed Pract. 2022;39(suppl 5):S37- S41a. doi:10.12788/fp.0294
- US Department of Veterans Affairs. VIONE changes the way VA handles prescriptions. January 25, 2020. Accessed May 21, 2023. https://news.va.gov/70709/vione-changes-way-va-handles-prescriptions/
- 2023 American Geriatrics Society Beers Criteria Update Expert Panel. American Geriatrics Society 2023 updated AGS Beers Criteria for potentially inappropriate medication use in older adults. J Am Geriatr Soc. 2023;71(7):2052- 2081. doi:10.1111/jgs.18372
- O’Mahony D, Cherubini A, Guiteras AR, et al. STOPP/ START criteria for potentially inappropriate prescribing in older people: version 3. Eur Geriatr Med. 2023;14(4):625- 632. doi:10.1007/s41999-023-00777-y
- Draeger C, Lodhi F, Geissinger N, Larson T, Griesbach S. Interdisciplinary deprescribing of aspirin through prescriber education and provision of patient-specific recommendations. WMJ. 2022;121(3):220-225
- de Lusignan S, Hinton W, Seidu S, et al. Dashboards to reduce inappropriate prescribing of metformin and aspirin: A quality assurance programme in a primary care sentinel network. Prim Care Diabetes. 2021;15(6):1075-1079. doi:10.1016/j.pcd.2021.06.003
- Nelson MW, Downs TN, Puglisi GM, Simpkins BA, Collier AS. Use of a deprescribing tool in an interdisciplinary primary-care patient-aligned care team. Sr Care Pharm. 2022;37(1):34-43. doi:10.4140/TCP.n.2022.34
- January CT, Wann LS, Alpert JS, et al. 2014 AHA/ ACC/HRS guideline for the management of patients with atrial fibrillation: a report of the American College of Cardiology/American Heart Association Task Force on practice guidelines and the Heart Rhythm Society. Circulation. 2014;130(23):e199-e267. doi:10.1161/CIR.0000000000000041
- Joglar JA, Chung MK, Armbruster AL, et al. 2023 ACC/ AHA/ACCP/HRS Guideline for the Diagnosis and Management of Atrial Fibrillation: A Report of the American College of Cardiology/American Heart Association Joint Committee on Clinical Practice Guidelines Circulation. 2024;149(1):e1- e156. doi:10.1161/CIR.0000000000001193
Pharmacist-Led Deprescribing of Aspirin for Primary Prevention of Cardiovascular Disease Among Geriatric Veterans
Pharmacist-Led Deprescribing of Aspirin for Primary Prevention of Cardiovascular Disease Among Geriatric Veterans
Cardiac Risks of Newer Psoriasis Biologics vs. TNF Inhibitors Compared
TOPLINE:
The newer biologics — .
METHODOLOGY:
- In a retrospective cohort study, researchers conducted an emulated target trial analysis using data of 32,098 biologic-naive patients with psoriasis or PsA who were treated with one of the newer biologics (infliximab, adalimumab, etanercept, certolizumab pegol, secukinumab, ixekizumab, brodalumab, ustekinumab, risankizumab, guselkumab, and tildrakizumab) from the TriNetX Research Network between 2014 and 2022.
- Patients received TNF inhibitors (n = 20,314), IL-17 inhibitors (n = 5073), IL-12/23 inhibitors (n = 3573), or IL-23 inhibitors (n = 3138).
- A propensity-matched analysis compared each class of newer biologics with TNF inhibitors, adjusting for demographics, comorbidities, and medication use.
- The primary outcomes were major adverse cardiovascular events (MACE; myocardial infarction and stroke) or venous thromboembolic events (VTE).
TAKEAWAY:
- Compared with patients who received TNF inhibitors, the risk for MACE was not significantly different between patients who received IL-17 inhibitors (incidence rate ratio [IRR], 1.14; 95% CI, 0.86-1.52), IL-12/23 inhibitors (IRR, 1.24; 95% CI, 0.84-1.78), or IL-23 inhibitors (IRR, 0.93; 95% CI, 0.61-1.38)
- The VTE risk was also not significantly different between patients who received IL-17 inhibitors (IRR, 1.12; 95% CI, 0.63-2.08), IL-12/23 inhibitors (IRR, 1.51; 95% CI, 0.73-3.19), or IL-23 inhibitors (IRR, 1.42; 95% CI, 0.64-3.25) compared with those who received TNF inhibitors.
- Subgroup analyses for psoriasis or psoriatic arthritis alone confirmed consistent findings.
- Patients with preexisting hyperlipidemia and diabetes mellitus showed lower risks for MACE and VTE with newer biologics compared with TNF inhibitors.
IN PRACTICE:
“No significant MACE and VTE risk differences were detected in patients with psoriasis or PsA between those receiving IL-17, IL-12/23, and IL-23 inhibitors and those with TNF inhibitors,” the authors concluded. These findings, they added “can be considered by physicians and patients when making treatment decisions” and also provide “evidence for future pharmacovigilance studies.”
SOURCE:
The study was led by Tai-Li Chen, MD, of the Department of Dermatology, Taipei Veterans General Hospital in Taipei, Taiwan. It was published online on December 27, 2024, in the Journal of the American Academy of Dermatology.
LIMITATIONS:
Study limitations included potential residual confounding factors, lack of information on disease severity, and inclusion of predominantly White individuals.
DISCLOSURES:
The study received support from Taipei Veterans General Hospital and Ministry of Science and Technology, Taiwan. The authors reported no conflicts of interest.
This article was created using several editorial tools, including AI, as part of the process. Human editors reviewed this content before publication. A version of this article first appeared on Medscape.com.
On Second Thought: Making Sense of Blood Pressure Guidelines — What Happened in the 1930s Should Stay There
This transcript has been edited for clarity.
Blood pressure. If you’re a primary care provider trying to do right by your patients, you might be understandably confused by the current mishmash of guidelines with different blood pressure targets. But as chaotic as things are, at least it’s not the 1930s, when you might hear John Hay give a lecture to the British Medical Association and say, “The greatest danger to a man with high blood pressure lies in its discovery, because then some fool is certain to try and reduce it.”
Yeah, he said that. But what happened in the 1930s stays in the 1930s. And now we can at least agree that we should be treating high blood pressure. But what’s the goal we should be aiming for? This is On Second Thought.
We’ve come a long way since FDR was recording blood pressures of 200 and his doctor prescribed him barbiturates and massage therapy.
That s#$# don’t fly no more. Over the past hundred years, we have become much more aggressive in treating blood pressure. Remember the Oslo study? It defined mild hypertension as a blood pressure between 150 and 180 mm Hg. Now, those numbers send people screaming to the emergency room. So, let’s acknowledge that things are substantially better than they once were. Let’s agree on that and we can start to heal this nation again.
Before we get into the numbers, when we’re treating blood pressure, let’s make a few points about measuring it. Obviously, to treat something, you have to measure it properly. Two recent trials have illustrated that these details matter a lot.
The Cuff(SZ) randomized crossover trial — and it took me a minute to realize that Cuff(SZ) meant cuff size, so bravo, Ishigami et al — showed that picking the wrong cuff size could affect BP measurements by 4.5 points if you were one size off. If you were two sizes too small, you overestimated BP by almost 20 points.
Add on here another recent study, the ARMS crossover randomized clinical trial, looking at how arm position affected BP measures. If the arm was resting on your lap or hanging by your side, that overestimated blood pressure by 4 and 6.5 points. So sometimes you have to remember the fundamentals: cuff size, arm position — it might make the difference between increasing or maintaining the patient’s meds.
But on to the main show. What numbers should we be aiming for? We no longer live in the “BP 200, the president’s going to have a stroke” world of the 1940s, and even a BP of 150 is considered quite high these days. Studies like the MRC trial, INVEST, and SPRINT have pushed BP targets ever lower. SPRINT, in particular, randomized patients to a blood pressure target under 120 systolic vs under 140 systolic, and the under-120 arm won out with fewer cardiovascular events and lower all-cause mortality.
Pretty definitive slam dunk. But the more intensive treatment came with more hypotension, syncope, and kidney injury, because there is no free lunch in medicine. And ditto with BPROAD, just published in The New England Journal of Medicine and presented at the American Heart Association annual meeting. A diabetic population randomized to 120 vs 140 as a BP target showed that more aggressive treatment was better.
Fewer cardiovascular events, like stroke, but no mortality difference, and more hypotension. So a cardiovascular benefit at the cost of more side effects. Now, like all cardiologists, my motto is “Save the heart and screw the kidney.” But if you do care about the other organs in this meat sack that we call a human body, the question you need to wrestle with is, how much do you value cardiovascular protection vs how willing are you to tolerate side effects?
Hypotension may not sound dangerous, but gravity is an unforgiving mistress. If you painstakingly compile the summary of the various BP guidelines for easy perusal, you would notice something critical: One, I have too much free time on my hands; two, the disagreements are not really all that profound.
Arguing about 120 vs 130 vs 140 is not the same as saying, “Drugs schmugs; a good massage will fix what ails you, and here are some addictive sleeping pills for good measure.” Physicians from the 1930s were a little sketchy. So much of this controversy is about how you define high-risk patients and what are the age cutoffs.
Basically, the cardiovascular guidelines say, “Treat them all and let God sort it out” because they care about cardiovascular events and are concerned about cardiovascular endpoints. Whereas general practice guidelines put more emphasis on potential side effects and admittedly tend to treat a not so high-risk population, so they have laxer targets.
A 2014 analysis from the Blood Pressure Lowering Treatment Trialists’ Collaboration [The Lancet] had a good mathematical way of explaining this problem. Now, lowering blood pressure is obviously a good thing. That prevents heart attacks, strokes, kidney failure, and all that. Please don’t let hypertension denialism become a thing.
Let’s start with the basics. Treating high blood pressure led to a 15% to 18% decrease in cardiovascular events, pretty consistently across all risk categories, and other analyses have found that every 5-point decrease in blood pressure gives you about a 10% decrease in major cardiovascular events on the relative-risk scale.
While the benefits are pretty consistent across all groups, that difference in baseline risk translates into different absolute benefits. In the Lancet paper, when the population was divided into four different groups based on their cardiovascular risk, the absolute risk reduction in the lowest-risk group was 14 fewer cardiovascular events if you treat 1000 patients for 5 years.
With each higher-risk group, it was 20 fewer, 24 fewer, and 38 fewer. At the lowest-risk group, the number needed to treat was 71, 50, 42, and 26 fewer cardiovascular events with 5 years of treatment.
And herein lies the secret to the disagreement: If you have a high-risk patient, there is a big benefit to bringing that blood pressure down from 135 to 130. Whereas for a low-risk patient, it probably doesn’t matter as much. And the cardiovascular benefits are going to be offset by the side effects and the risks for hypotension.
Of course, there’s a simple solution to this dilemma: Just speak to the patient in front of you. Treat high blood pressure, and if your patient’s blood pressure drops or they get dizzy or have fainting spells, then just ease up on the meds. It’s not rocket science; it’s just cardiology.
Arguing about five millimeters of mercury of blood pressure is probably less important from the public health perspective than the fact that tens of millions of people in the United States are unaware that they have hypertension, and even those diagnosed are being inadequately treated.
So, let’s all do better as a medical community. Nobody should have untreated hypertension in this day and age. It’s not the 1930s.
Dr Labos, Cardiologist, Kirkland Medical Center, Montreal, Quebec, Canada, has disclosed no relevant financial relationships.
A version of this article appeared on Medscape.com.