User login
Streamlining Health Care: Inpatient Dashboard as a User-Centric Solution in EHR Enhancement
Streamlining Health Care: Inpatient Dashboard as a User-Centric Solution in EHR Enhancement
Electronic health records (EHRs) are an integral part of modern health care. The 2009, Health Information Technology for Economic and Clinical Health Act established financial incentives for US hospitals to adopt EHRs. In 2009 only 12% of nonfederal acute care hospitals had adopted a certified EHR system, which increased to 96% by 2021.1
EHRs have transformed the way patient data are stored and accessed, streamlining the process of providing quality patient care with improvements in efficiency, effectiveness, patient satisfaction, and safety.2 Despite their widespread adoption and benefits, EHRs have generally been met with mixed physician satisfaction.3 Interactions with EHRs are linked to disproportionate time at the computer and physician burnout.4-6
The US Department of Veterans Affairs (VA) was at the forefront of EHR development, establishing the Veterans Health Information Systems and Technology Architecture (VistA) in the 1970s. The VA released the Computerized Patient Record System (CPRS) in 1997, the first clinical user interface for VistA. In May 2018, the VA signed a $10 billion contract with Cerner (now Oracle Health) to modernize its EHR.7 This was later revised to $16.1 billion, and the Institute for Defense Analyses estimates it will cost $49.8 billion.8 The transition to Oracle Health has been faced with significant challenges, including patient safety risks and workflow inefficiencies, leading to a pause in rollout.9
Due to the known challenges with EHRs and the aging CPRS system (without a scheduled replacement date), innovations that facilitate the synthesis and display of clinical information are needed. To address this gap, the VA Ann Arbor Healthcare System (VAAAHS) developed the Inpatient Dashboard, an online EHR companion tool. The Inpatient Dashboard was designed to draw data from VistA to reduce time spent at the computer by streamlining clinical information presentation, standardizing inpatient notes, improving safety measures, and enhancing overall clinician satisfaction. This study evaluated the adoption and user experience with the Inpatient Dashboard.
INPATIENT DASHBOARD
The Inpatient Dashboard consists of several modules created by a contractor for the VAAAHS that is housed on VA servers with access restricted to individuals with patient health data privileges. As the Inpatient Dashboard draws data from VistA, it can display laboratory information, studies, and notes from all VA sites.
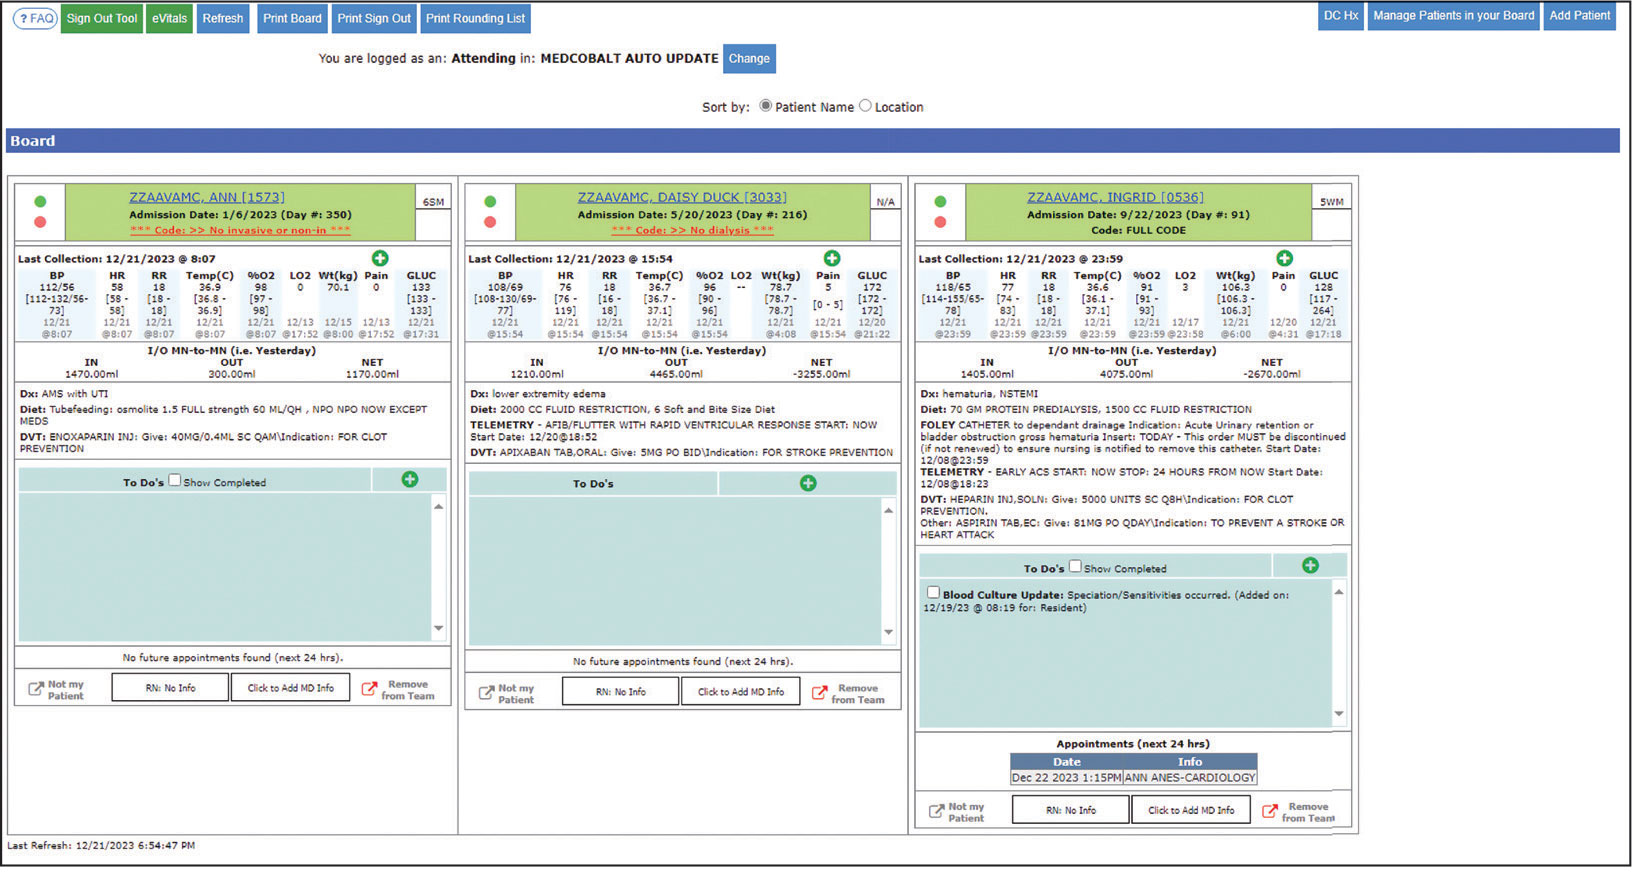
The main dashboard is a snapshot summary of patient information, including patient location, code status, last vital sign readings, vital sign ranges over the previous 24 hours, intake/output, deep vein thrombosis (DVT) prophylaxis, the presence of telemetry orders, or use of Foley or central catheters (Figure). It also includes a customizable to-do list and contact information for the patient’s clinician and nurse. Significant events, such as abnormal vital signs or speciation/sensitivities for blood cultures, are automatically populated on the to-do list. From this main dashboard overview, clinicians can customize which patients are displayed, create and print a rounding list, print a sign-out sheet, or select individual patients to open a progress note module.
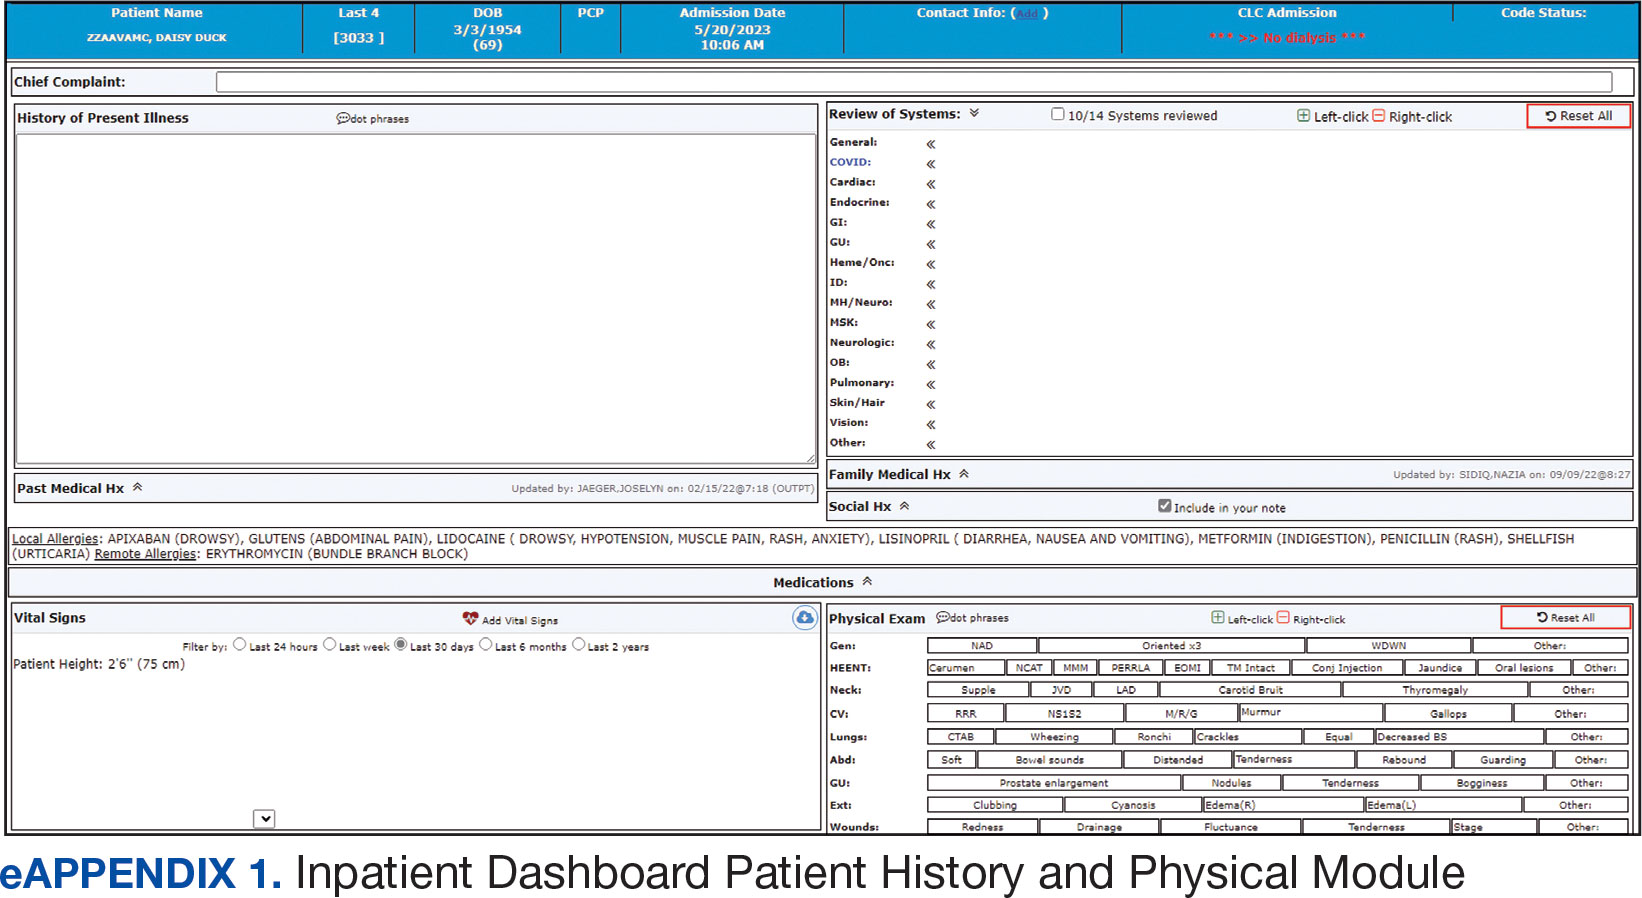
Notes can be written in the patient history and physical module, progress note module, and discharge summary module. The patient history and physical module has text blocks allocated to the traditional components of a history and physical note (ie, chief complaint, history of present illness, review of systems, past medical history, family history, social history, allergies, medications, physical examination, assessment, and plan) (eAppendix 1). Some elements, such as past medical history, family history, and social history are prepopulated if the patient was previously admitted. Vital signs, laboratory results, studies, microbiology/ pathology reports, and other CPRS notes are displayed in this module.
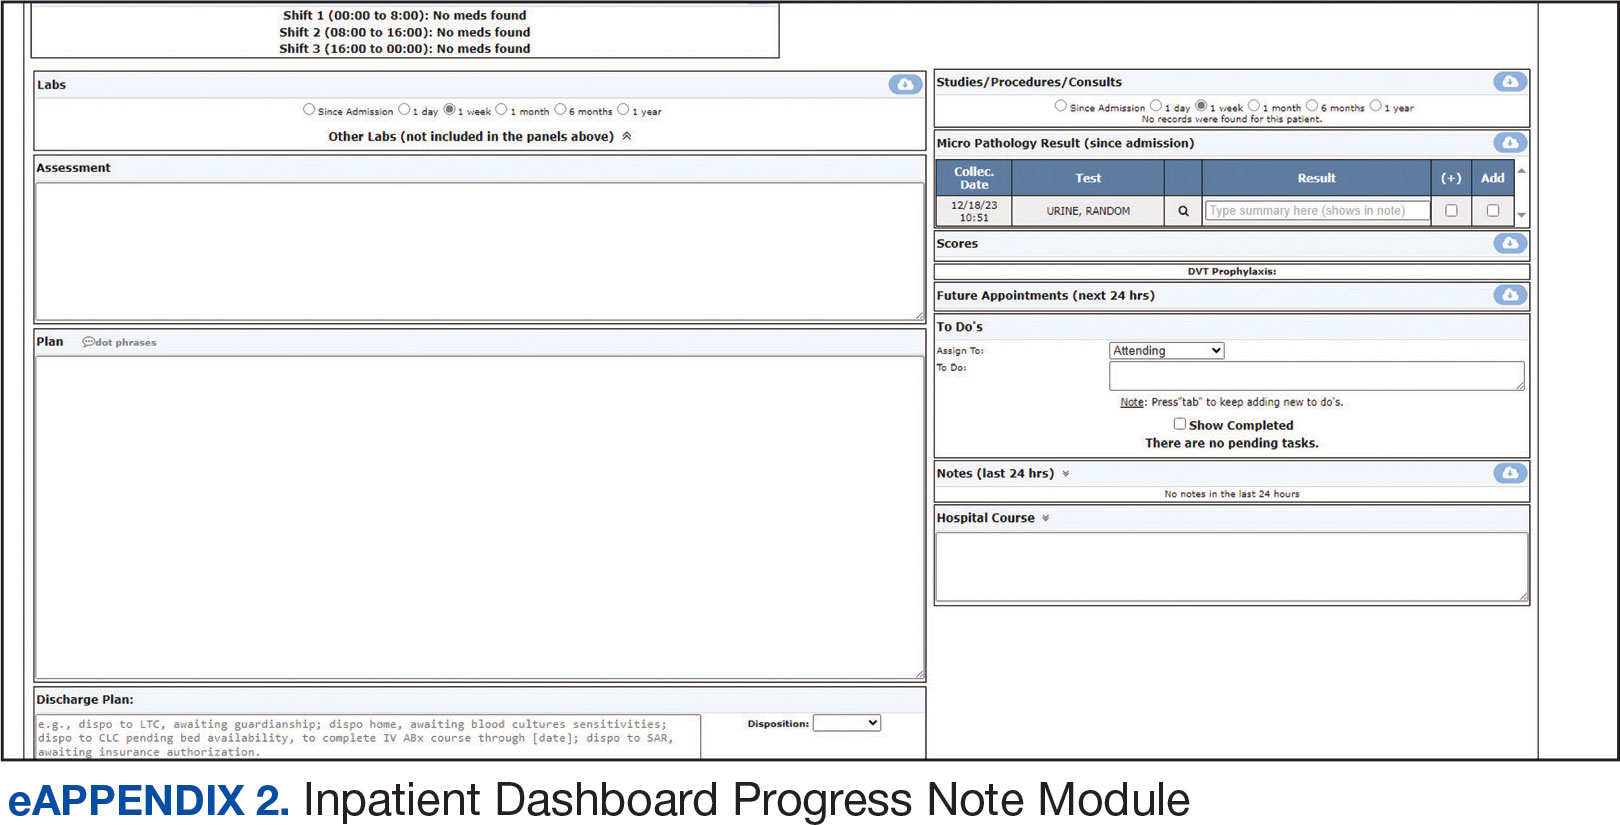
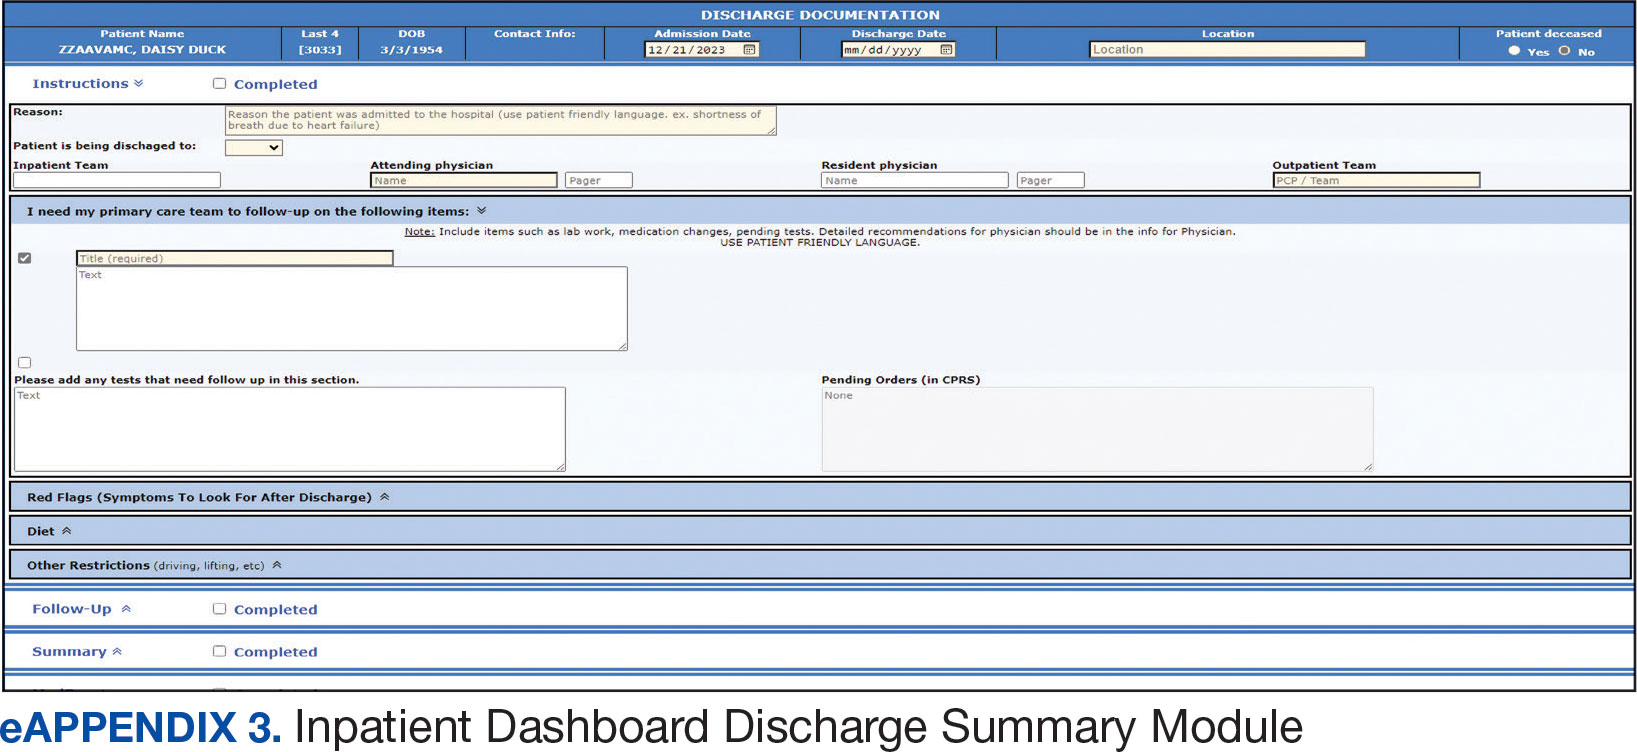
The progress note module contains text blocks allocated to the traditional components of a progress note, such as subjective/interval events, physical examination, assessment, and plan (eAppendix 2). Vital signs, laboratory results, studies, microbiology/ pathology reports, other CPRS notes, and the patient’s medication administration record are also displayed in this module. Lastly, the discharge summary module includes patient follow-up, patient instructions, hospitalization summary, medication reconciliation, laboratory results, and studies/procedures, ensuring a comprehensive discharge summary for patients and clinicians (eAppendix 3).
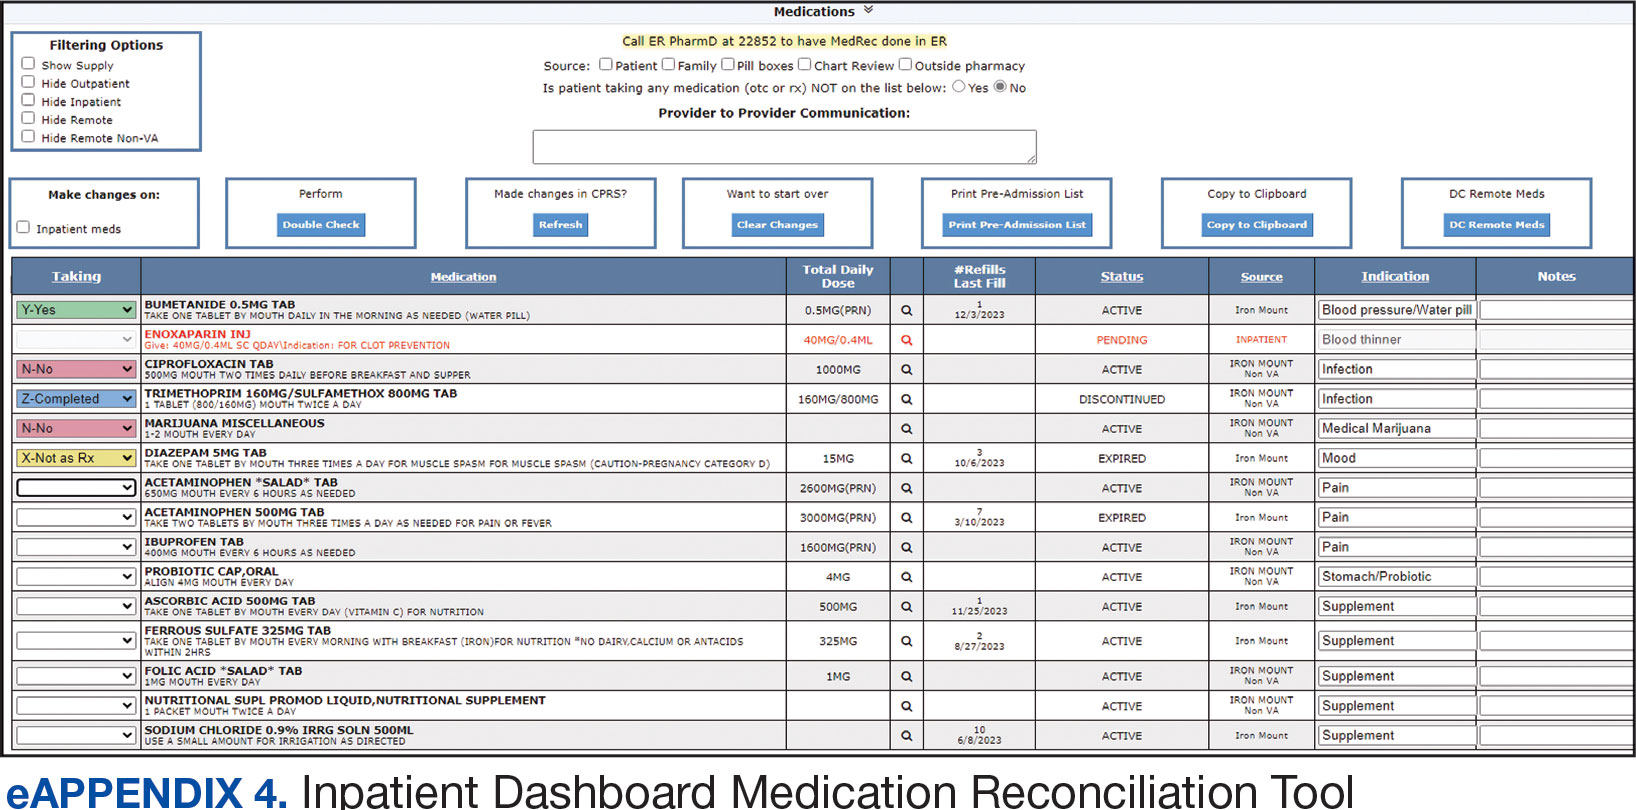
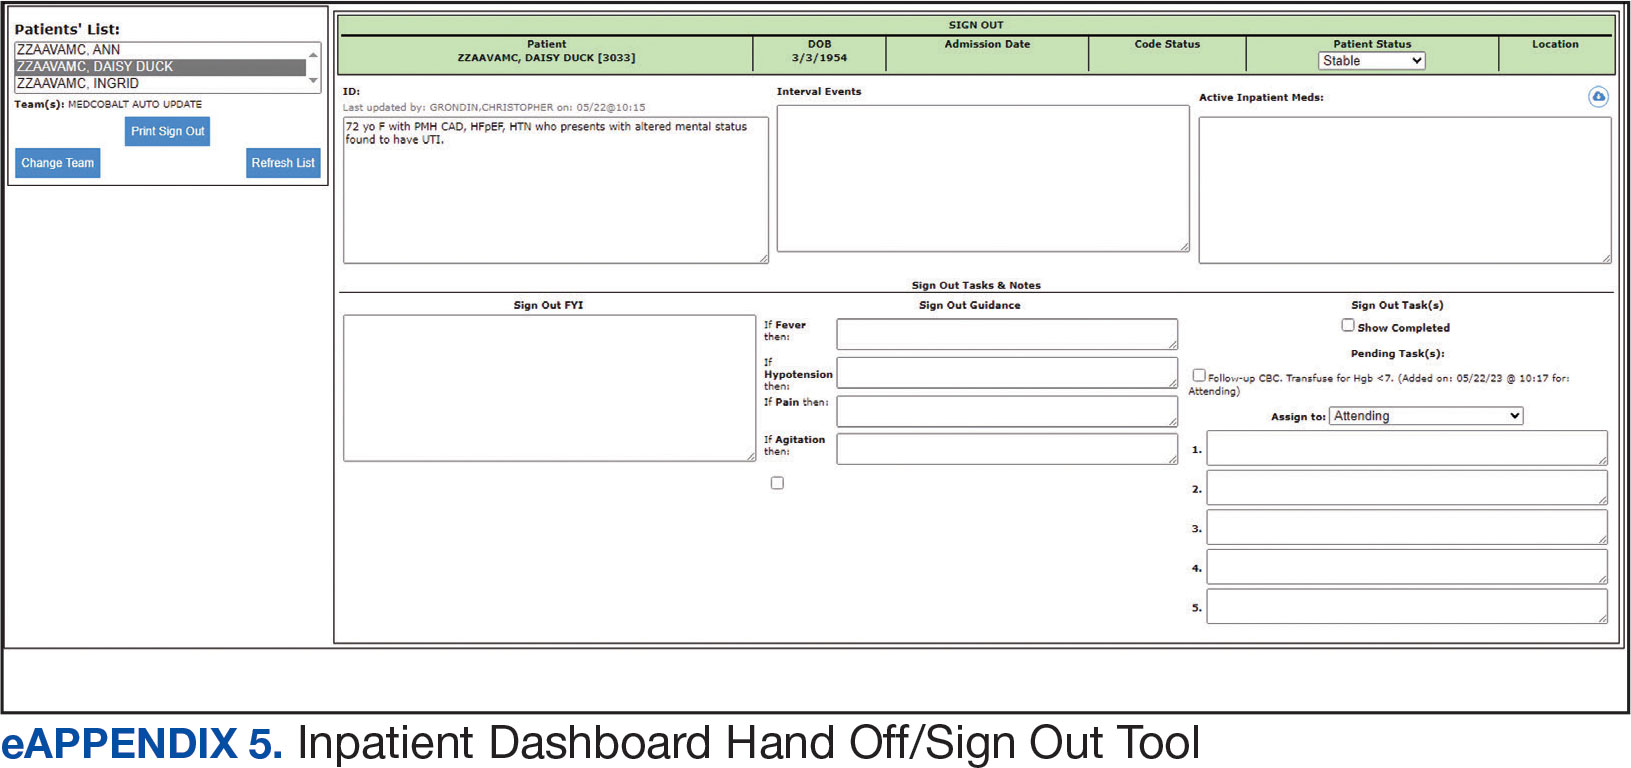
A medication reconciliation tool was embedded within the history and physical and discharge summary modules. This tool has been shown to reduce medication errors in patients admitted from the emergency department to the hospital (eAppendix 4).10 The handoff/sign-out tool (eAppendix 5) accessible through the main dashboard page is modeled on the I-PASS handoff framework.11,12 This includes the patient identifier, interval events, inpatient medications, specific sign-out guidance, sign-out tasks/to-dos, and any other pertinent information.
The Inpatient Dashboard is a team-based construct shared by the attending physicians, residents, and medical students. Each team (eg, general medicine, general surgery) is its own entity; only team members can change the content or add to the documentation. Each facility can have multiple teams caring for the same patient (eg, primary and consulting teams). Additional care members can also be incorporated (eg, pharmacists assist with medication reconciliation for admission and discharge at VAAAHS). The Inpatient Dashboard can export information directly to CPRS for clinicians to review and sign. It can also generate a note that can be pasted into CPRS.
Clinician Feedback and Satisfaction
A survey was developed to evaluate clinician experiences with using the Inpatient Dashboard as an adjunct to the CPRS. The Inpatient Dashboard was made available to general medicine teams in November 2018. The survey was conducted from December 2018 to September 2019. The study was conducted at the VAAAHS and included 4 general medicine teams. Each team included an attending physician, a senior resident, 2 to 3 interns, and 3 to 4 medical students. Eligibility was extended to any team member who used both the CPRS and Inpatient Dashboard. Participation in the survey was voluntary. All respondents were informed of the study’s purpose and encouraged to provide candid feedback to ensure the reliability and validity of the findings.
Data were collected through a semistructured survey administered via the Qualtrics platform. The questionnaire was designed to capture multidimensional insights into clinician experience, with particular focus on satisfaction, efficiency, and perceived safety when using the tool as an adjunct to CPRS compared to using CPRS alone. The questionnaire primarily used a Likert scale for responses. Surveys were emailed at the completion of a team’s 1-month inpatient block. An answer was not required for every question, resulting in slightly different response numbers for some questions.
A question regarding the tool’s impact on workload stress was added halfway through the study period, which resulted in fewer responses. Adoption was assessed by counting the Inpatient Dashboard unique users. Descriptive statistics were used within individual survey responses to report the distribution of responses. Differences in response between levels of training were assessed using a X2 test of independence.
Survey Results
From September 2023 through November 2023, there were 1549 rounding printouts across 144 unique users (5 nurses, 40 medical students, 87 residents, and 12 attending physicians) and 1468 handoff printouts across 148 unique users (5 nurses, 10 medical students, 111 residents, and 22 attending physicians). The clinician survey received 68 responses from users at various levels of medical training: 23 medical students, 31 interns, 12 senior residents, and 2 attending physicians. All 68 participants confirmed they had used the Inpatient Dashboard.
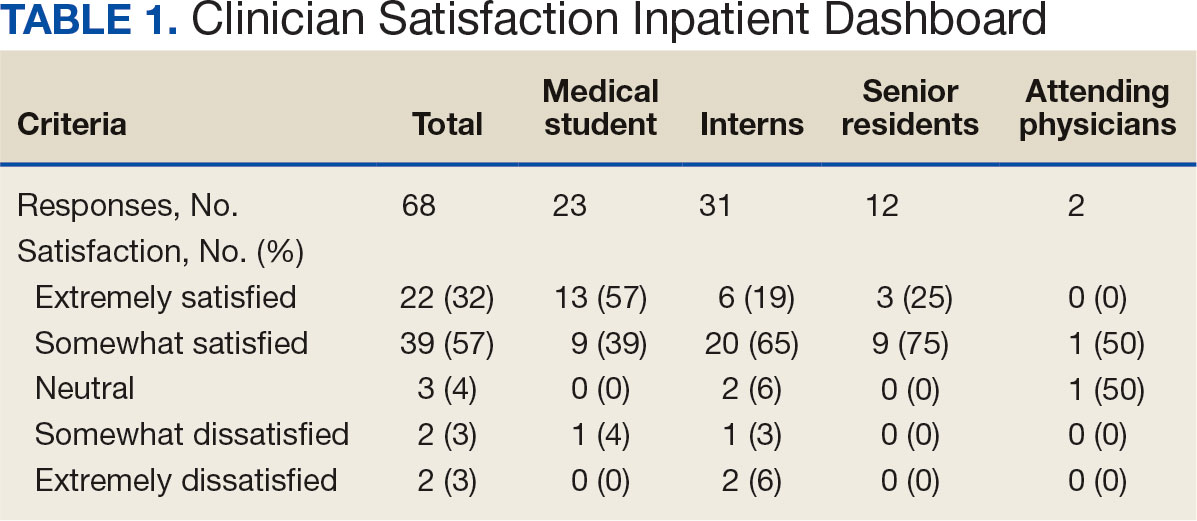
User satisfaction and preference for the Inpatient Dashboard vs CPRS were assessed. Sixty-one respondents (90%) expressed overall satisfaction with the Inpatient Dashboard; 22 (32%) were extremely satisfied, and 39 (57%) were somewhat satisfied (Table 1). Three respondents (4%) were neutral, 2 (3%) were somewhat dissatisfied, and 2 (3%) were extremely dissatisfied with the Inpatient Dashboard. Responses differed by level of training (P = .03), with medical students trending towards higher satisfaction.
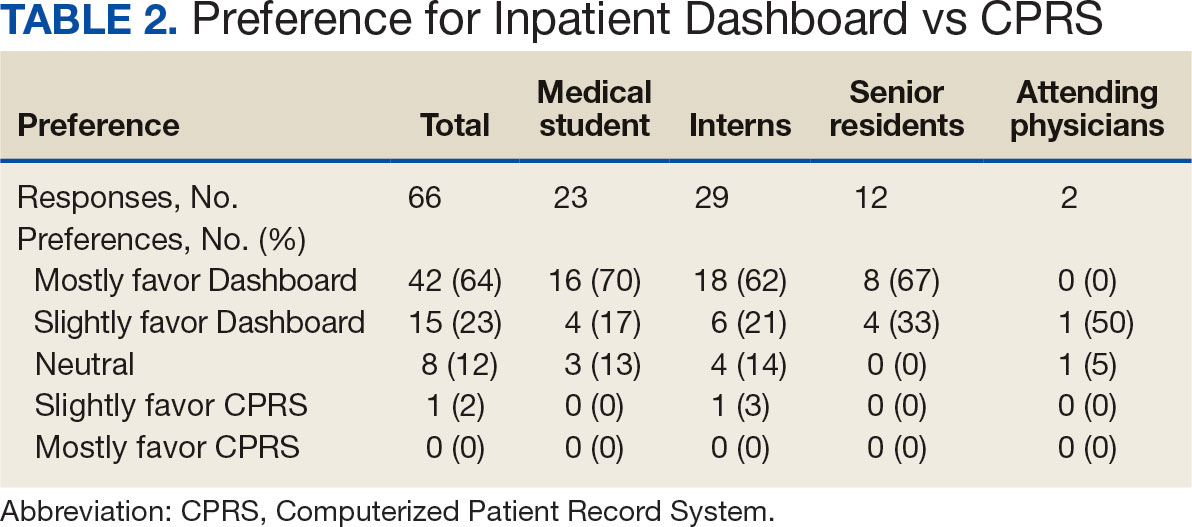
Respondents preferred the Inpatient Dashboard over CPRS for gathering information and writing progress notes; 42 (64%) respondents mostly favored the Inpatient Dashboard, 15 (23%) slightly favored the Inpatient Dashboard over CPRS, and 8 (12%) were neutral. One respondent (2%) slightly favored CPRS to the Inpatient Dashboard (Table 2).
Sixty-five respondents (100%) found the Inpatient Dashboard’s ability to summarize patient information in a central place helpful (Table 3). Among them, 53 (82%) respondents reported it was very or extremely helpful, 10 (15%) respondents reported it was moderately helpful, and 2 (3%) respondents reported it was slightly helpful. This feature positively impacted users’ awareness of patients with DVT prophylaxis or a Foley catheter. Ten (15%) respondents reported being much more aware, and 29 (45%) respondents reporting they were slightly more aware. The remaining 26 (40%) respondents reported no change in awareness.
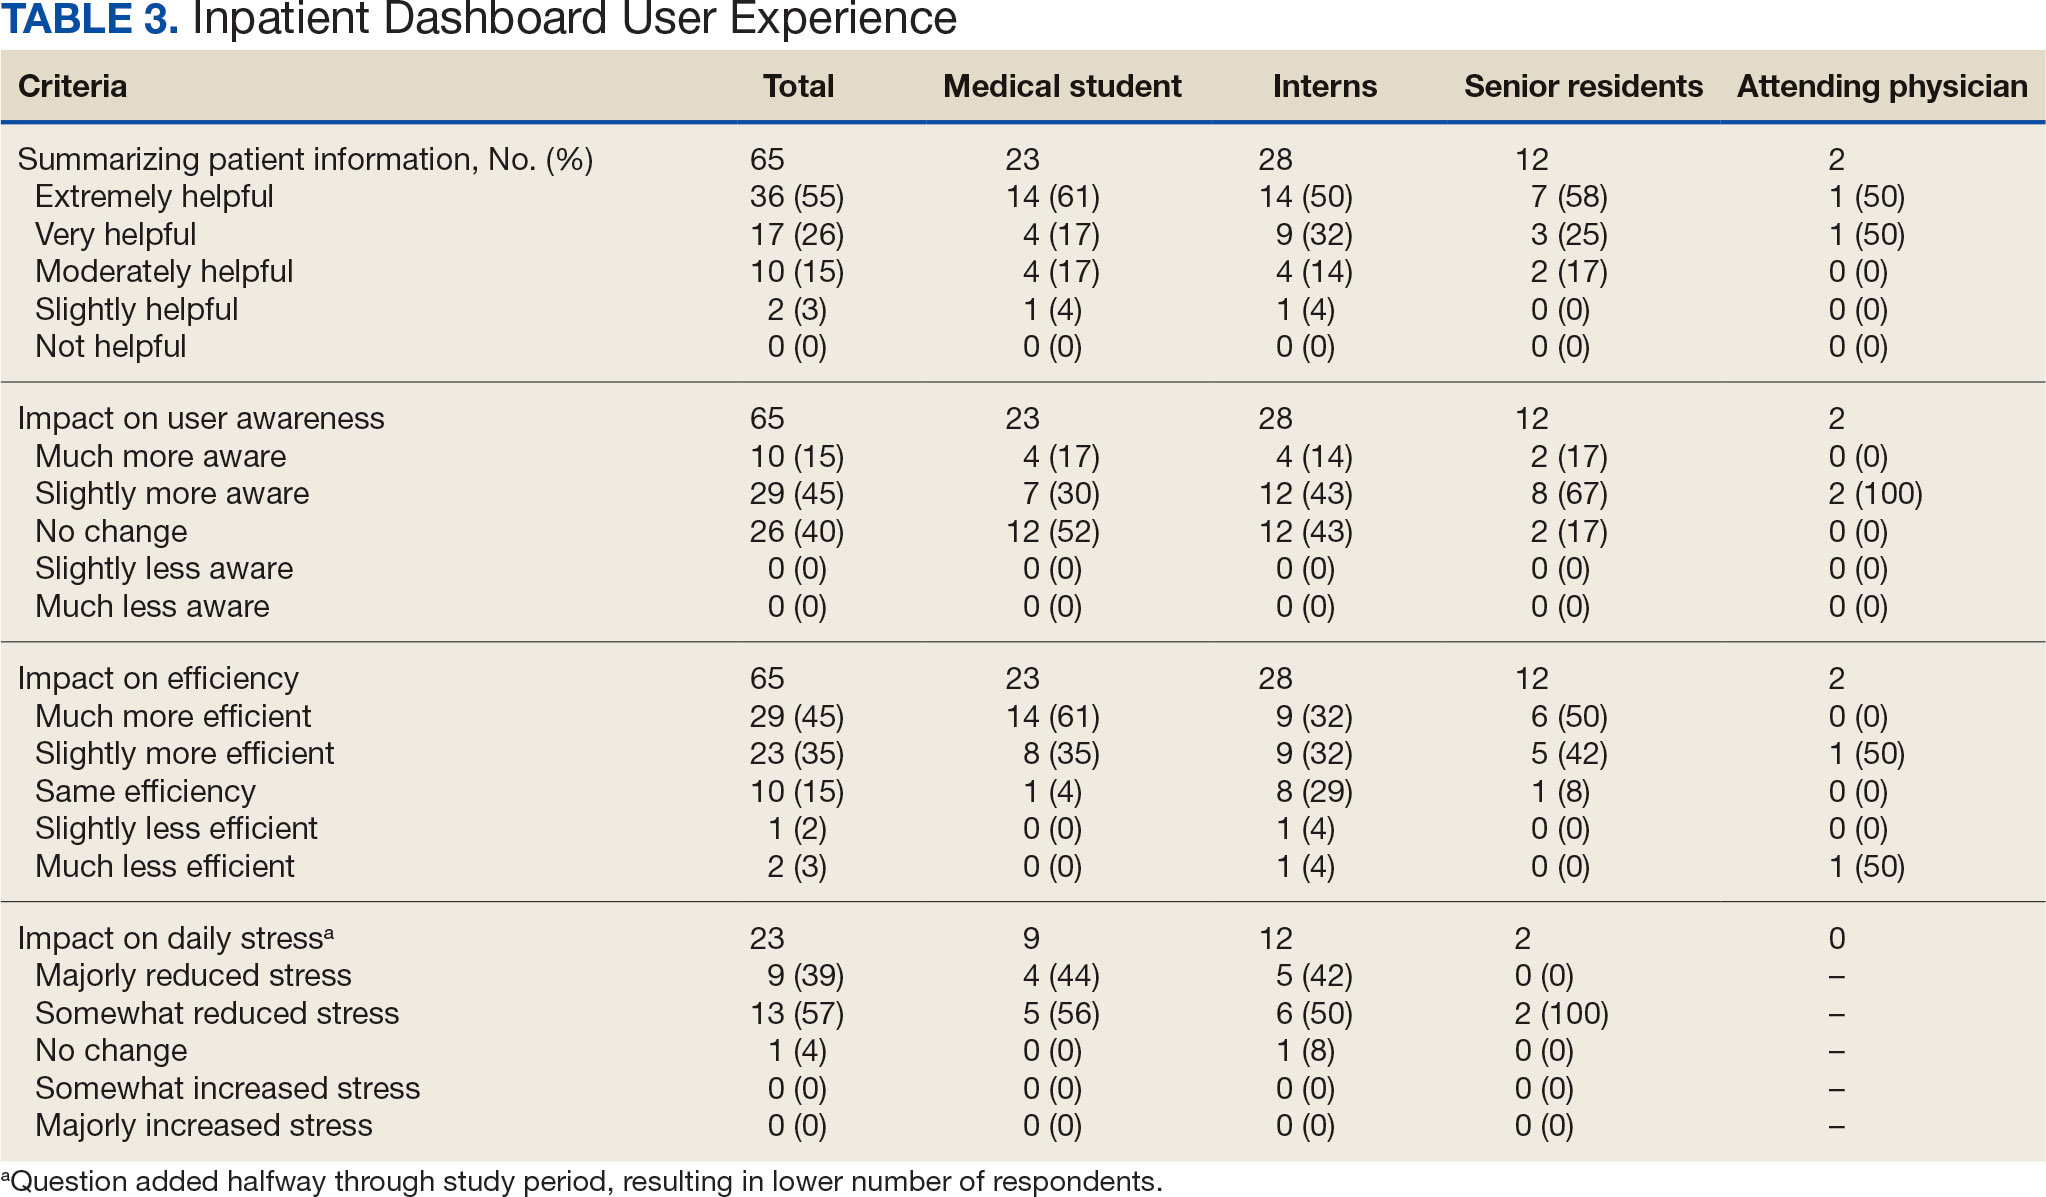
The Inpatient Dashboard was reported to save time preparing for physician rounds by 52 (80%) respondents, contributing to much greater efficiency for 29 (45%) respondents and slightly more efficiency for 23 (35%) respondents. However, 10 (15%) respondents reported no change in efficiency, and 3 (5%) respondents reduced efficiency, with 1 (2%) respondent reporting it slightly less efficient and 2 (3%) respondents reporting it much less efficient. Responses differed by level of training (P = .01), with medical students trending towards higher efficiency. Of the 23 respondents who reported on the Inpatient Dashboard’s impact on daily workload stress level, 22 (96%) indicated the tool had a stress-reducing effect, with 9 (39%) experiencing a major reduction in stress level, and 13 (57%) experiencing somewhat reduced stress level. Only 1 participant (4%) reported no change in stress. No participants reported an increase in stress.
DISCUSSION
The adoption of EHRs has transformed operational modalities in contemporary health care systems, heralding advancements in patient satisfaction, safety, and overall quality and efficiency of care.1,2 However, EHRs still present challenges, predominantly around clinician satisfaction, marked by instances of burnout and increased time spent on computers.2-6 In this context, the Inpatient Dashboard, an online companion to the CPRS, exemplifies how user-centered innovations in EHRs can address and mitigate associated challenges.
The Inpatient Dashboard has been well received with most respondents of the survey conducted in this study indicating they were both satisfied with the instrument and preferring it to CPRS. This high approval aligns with existing literature on the potential advantages of user-centered design in health care technology.13 The tool has gained widespread acceptance at the VAAAHS even in the absence of obligatory usage or institutional incentives. The appeal of the Inpatient Dashboard may stem from its increased efficiency, with most users affirming its timesaving nature. While CPRS can only display local notes, laboratory results, and studies, the Inpatient Dashboard can display data from across all VA sites. The VA Joint Longitudinal Viewer can similarly display data from across all sites, but the display is not streamlined as it is in the Inpatient Dashboard. The Inpatient Dashboard incorporates this clinical information into a single page to facilitate day-to-day workflow and dynamic documentation (ie, reviewing laboratory results, medications, writing notes, and signing out patients). This increased efficiency allows clinicians to counter 2 common barriers to EHR implementation: productivity loss and insufficient time.14
The association between EHRs and improved quality and safety in health care is well-documented.3 The Inpatient Dashboard fortifies this association by enhancing awareness around patient status, evidenced by a majority of respondents, and by integrating a medication reconciliation tool to decrease medication errors on transition from the emergency department to inpatient hospitalization.10
The Inpatient Dashboard’s impact on alleviating daily workload stress is noteworthy, with almost all respondents experiencing reduced stress levels and physician burnout, which has been linked to deteriorating well-being, compromised patient safety, and escalated health care costs.15,16 The heightened susceptibility of physicians to burnout compared to other professionals underscores the imperative for incorporating stress-mitigating interventions in the EHR.17,18
While responses to most questions did not significantly differ by training levels, overall satisfaction with the Inpatient Dashboard and its ability to save time preparing for rounds were rated higher by medical students. This may be attributable to a greater derived benefit from collating and presenting data to learners with less familiarity with the native EHR. It is also notable that the Inpatient Dashboard allows medical students to directly contribute to a patient’s note, which could be another driver in satisfaction. While most interns still felt the Inpatient Dashboard enabled them to save time preparing for rounds, there were a considerable number of ‘no change’ responses, which suggests some interns may not have modified their existing prerounding strategies. These associations are limited by the relatively small number of respondents by learner category, with senior medical residents and attending physicians being underrepresented.
While there are a multitude of dashboards available at the VA, most are made to track certain quality metrics and are used more by administrative and leadership staff. The Inpatient Dashboard was created specifically for frontline clinicians to facilitate their day-to-day workflow and dynamic documentation. This tool can additionally help with quality metrics, though its main purpose was and is to make clinician workflow easier and more efficient.
These results are especially timely because the VA is modernizing its EHR by transitioning to Oracle Health.7 Due to the numerous reports both from veterans and VA clinicians that the Oracle Health EHR is not meeting expectations, deployment at further sites has been halted while improving the experience of the 5 institutions using Oracle Health is prioritized.9 The Inpatient Dashboard, instead of being merely an enhancement to CPRS, could emerge as a potential bridge to Oracle Health if adapted to display data from Oracle Health as it does VistA. This would facilitate a smoother, more integrated transition for those health care institutions employing the Inpatient Dashboard.
Limitations
The reliance on self-reported data inherently carries the risk of bias, and the absence of objective measures, like time-tracking studies, limits the quantifiable assessment of the Inpatient Dashboard efficacy. The single-center nature of the study also may restrict the generalizability of the results.
CONCLUSIONS
Optimal integration of EHRs into health care delivery is critical to high-quality patient care and operational efficiency. The Inpatient Dashboard is an example of an innovative, user-centric solution that integrated and presented clinical information in a way that produced high satisfaction and adoption by users at a VA hospital.
- Office of the National Coordinator for Health Information Technology. National Trends in Hospital and Physician Adoption of Electronic Health Records. HealthIT.gov. Accessed February 5, 2025. https://www.healthit.gov/data/quickstats/national-trends-hospital-and-physician-adoption-electronic-health-records
- Buntin MB, Burke MF, Hoaglin MC, Blumenthal D. The benefits of health information technology: a review of the recent literature shows predominantly positive results. Health Aff (Millwood). 2011;30(3):464-471. doi:10.1377/hlthaff.2011.0178
- Nguyen L, Bellucci E, Nguyen LT. Electronic health records implementation: an evaluation of information system impact and contingency factors. Int J Med Inf. 2014;83(11):779-796. doi:10.1016/j.ijmedinf.2014.06.011
- Alexander AG, Ballou KA. Work-life balance, burnout, and the electronic health record. Am J Med. 2018;131(8):857- 858. doi:10.1016/j.amjmed.2018.02.033
- Sinsky C, Colligan L, Li L, et al. Allocation of physician time in ambulatory practice: a time and motion study in 4 specialties. Ann Intern Med. 2016;165(11):753-760. doi:10.7326/M16-0961
- Chaiyachati KH, Shea JA, Asch DA, et al. Assessment of inpatient time allocation among first-year internal medicine residents using time-motion observations. JAMA Intern Med. 2019;179(6):760-767. doi:10.1001/jamainternmed.2019.0095
- US Department of Veterans Affairs. Statement by Acting Secretary Robert Wilkie - VA signs contract with Cerner for an electronic health record system. New release. May 17, 2018. Accessed February 5, 2025. https://news.va.gov/press-room/statement-by-acting-secretary-robert-wilkie-va-signs-contract-with-cerner-for-an-electronic-health-record-system/
- US Government Publishing Office. VA’s Electronic health record modernization: an update on rollout, cost, and schedule. Subcommittee on Military Construction, Veterans Affairs, and Related Agencies, Committee on Appropriations, United States Senate. 117th Congress, 2nd Session. September 21, 2022. Accessed February 5, 2025. https://www.govinfo.gov/content/pkg/CHRG-117shrg52328/html/CHRG-117shrg52328.htm
- US Department of Veterans Affairs. VA announces reset of electronic health record project. Accessed December 21, 2023. https://news.va.gov/press-room/va-announces-reset-of-electronic-health-record-project/
- Grondin C, Gupta A, Houchens N, et al. Medication reconciliation tool reduces errors in patients admitted from the ED to hospital. Am J Med Qual. 2021;36(2):129. doi:10.1097/01.JMQ.0000741500.33781.eb
- Starmer AJ, Spector ND, Srivastava R, et al. Changes in medical errors after implementation of a handoff program. N Engl J Med. 2014;371(19):1803-1812. doi:10.1056/NEJMsa1405556
- Starmer AJ, O’Toole JK, Rosenbluth G, et al. Development, implementation, and dissemination of the I-PASS handoff curriculum: a multisite educational intervention to improve patient handoffs. Acad Med. 2014;89(6):876-884. doi:10.1097/ACM.0000000000000264
- Ratwani RM, Fairbanks RJ, Hettinger AZ, Benda NC. Electronic health record usability: analysis of the user-centered design processes of eleven electronic health record vendors. J Am Med Inform Assoc. 2015;22(6):1179-1182. doi:10.1093/jamia/ocv050
- Kruse CS, Kristof C, Jones B, Mitchell E, Martinez A. Barriers to electronic health record adoption: a systematic literature review. J Med Syst. 2016;40(12):252. doi:10.1007/s10916-016-0628-9
- West CP, Dyrbye LN, Shanafelt TD. Physician burnout: contributors, consequences and solutions. J Intern Med. 2018;283(6):516-529. doi:10.1111/joim.12752
- Smeds MR, Janko MR, Allen S, et al. Burnout and its relationship with perceived stress, self-efficacy, depression, social support, and programmatic factors in general surgery residents. Am J Surg. 2020;219(6):907- 912. doi:10.1016/j.amjsurg.2019.07.004
- Shanafelt TD, Boone S, Tan L, et al. Burnout and satisfaction with work-life balance among US physicians relative to the general US population. Arch Intern Med. 2012;172(18):1377-1385. doi:10.1001/archinternmed.2012.3199
- Budd J. Burnout related to electronic health record use in primary care. J Prim Care Community Health. 2023;14:21501319231166921. doi:10.1177/21501319231166921
Electronic health records (EHRs) are an integral part of modern health care. The 2009, Health Information Technology for Economic and Clinical Health Act established financial incentives for US hospitals to adopt EHRs. In 2009 only 12% of nonfederal acute care hospitals had adopted a certified EHR system, which increased to 96% by 2021.1
EHRs have transformed the way patient data are stored and accessed, streamlining the process of providing quality patient care with improvements in efficiency, effectiveness, patient satisfaction, and safety.2 Despite their widespread adoption and benefits, EHRs have generally been met with mixed physician satisfaction.3 Interactions with EHRs are linked to disproportionate time at the computer and physician burnout.4-6
The US Department of Veterans Affairs (VA) was at the forefront of EHR development, establishing the Veterans Health Information Systems and Technology Architecture (VistA) in the 1970s. The VA released the Computerized Patient Record System (CPRS) in 1997, the first clinical user interface for VistA. In May 2018, the VA signed a $10 billion contract with Cerner (now Oracle Health) to modernize its EHR.7 This was later revised to $16.1 billion, and the Institute for Defense Analyses estimates it will cost $49.8 billion.8 The transition to Oracle Health has been faced with significant challenges, including patient safety risks and workflow inefficiencies, leading to a pause in rollout.9
Due to the known challenges with EHRs and the aging CPRS system (without a scheduled replacement date), innovations that facilitate the synthesis and display of clinical information are needed. To address this gap, the VA Ann Arbor Healthcare System (VAAAHS) developed the Inpatient Dashboard, an online EHR companion tool. The Inpatient Dashboard was designed to draw data from VistA to reduce time spent at the computer by streamlining clinical information presentation, standardizing inpatient notes, improving safety measures, and enhancing overall clinician satisfaction. This study evaluated the adoption and user experience with the Inpatient Dashboard.
INPATIENT DASHBOARD
The Inpatient Dashboard consists of several modules created by a contractor for the VAAAHS that is housed on VA servers with access restricted to individuals with patient health data privileges. As the Inpatient Dashboard draws data from VistA, it can display laboratory information, studies, and notes from all VA sites.
The main dashboard is a snapshot summary of patient information, including patient location, code status, last vital sign readings, vital sign ranges over the previous 24 hours, intake/output, deep vein thrombosis (DVT) prophylaxis, the presence of telemetry orders, or use of Foley or central catheters (Figure). It also includes a customizable to-do list and contact information for the patient’s clinician and nurse. Significant events, such as abnormal vital signs or speciation/sensitivities for blood cultures, are automatically populated on the to-do list. From this main dashboard overview, clinicians can customize which patients are displayed, create and print a rounding list, print a sign-out sheet, or select individual patients to open a progress note module.
Notes can be written in the patient history and physical module, progress note module, and discharge summary module. The patient history and physical module has text blocks allocated to the traditional components of a history and physical note (ie, chief complaint, history of present illness, review of systems, past medical history, family history, social history, allergies, medications, physical examination, assessment, and plan) (eAppendix 1). Some elements, such as past medical history, family history, and social history are prepopulated if the patient was previously admitted. Vital signs, laboratory results, studies, microbiology/ pathology reports, and other CPRS notes are displayed in this module.
The progress note module contains text blocks allocated to the traditional components of a progress note, such as subjective/interval events, physical examination, assessment, and plan (eAppendix 2). Vital signs, laboratory results, studies, microbiology/ pathology reports, other CPRS notes, and the patient’s medication administration record are also displayed in this module. Lastly, the discharge summary module includes patient follow-up, patient instructions, hospitalization summary, medication reconciliation, laboratory results, and studies/procedures, ensuring a comprehensive discharge summary for patients and clinicians (eAppendix 3).
A medication reconciliation tool was embedded within the history and physical and discharge summary modules. This tool has been shown to reduce medication errors in patients admitted from the emergency department to the hospital (eAppendix 4).10 The handoff/sign-out tool (eAppendix 5) accessible through the main dashboard page is modeled on the I-PASS handoff framework.11,12 This includes the patient identifier, interval events, inpatient medications, specific sign-out guidance, sign-out tasks/to-dos, and any other pertinent information.
The Inpatient Dashboard is a team-based construct shared by the attending physicians, residents, and medical students. Each team (eg, general medicine, general surgery) is its own entity; only team members can change the content or add to the documentation. Each facility can have multiple teams caring for the same patient (eg, primary and consulting teams). Additional care members can also be incorporated (eg, pharmacists assist with medication reconciliation for admission and discharge at VAAAHS). The Inpatient Dashboard can export information directly to CPRS for clinicians to review and sign. It can also generate a note that can be pasted into CPRS.
Clinician Feedback and Satisfaction
A survey was developed to evaluate clinician experiences with using the Inpatient Dashboard as an adjunct to the CPRS. The Inpatient Dashboard was made available to general medicine teams in November 2018. The survey was conducted from December 2018 to September 2019. The study was conducted at the VAAAHS and included 4 general medicine teams. Each team included an attending physician, a senior resident, 2 to 3 interns, and 3 to 4 medical students. Eligibility was extended to any team member who used both the CPRS and Inpatient Dashboard. Participation in the survey was voluntary. All respondents were informed of the study’s purpose and encouraged to provide candid feedback to ensure the reliability and validity of the findings.
Data were collected through a semistructured survey administered via the Qualtrics platform. The questionnaire was designed to capture multidimensional insights into clinician experience, with particular focus on satisfaction, efficiency, and perceived safety when using the tool as an adjunct to CPRS compared to using CPRS alone. The questionnaire primarily used a Likert scale for responses. Surveys were emailed at the completion of a team’s 1-month inpatient block. An answer was not required for every question, resulting in slightly different response numbers for some questions.
A question regarding the tool’s impact on workload stress was added halfway through the study period, which resulted in fewer responses. Adoption was assessed by counting the Inpatient Dashboard unique users. Descriptive statistics were used within individual survey responses to report the distribution of responses. Differences in response between levels of training were assessed using a X2 test of independence.
Survey Results
From September 2023 through November 2023, there were 1549 rounding printouts across 144 unique users (5 nurses, 40 medical students, 87 residents, and 12 attending physicians) and 1468 handoff printouts across 148 unique users (5 nurses, 10 medical students, 111 residents, and 22 attending physicians). The clinician survey received 68 responses from users at various levels of medical training: 23 medical students, 31 interns, 12 senior residents, and 2 attending physicians. All 68 participants confirmed they had used the Inpatient Dashboard.
User satisfaction and preference for the Inpatient Dashboard vs CPRS were assessed. Sixty-one respondents (90%) expressed overall satisfaction with the Inpatient Dashboard; 22 (32%) were extremely satisfied, and 39 (57%) were somewhat satisfied (Table 1). Three respondents (4%) were neutral, 2 (3%) were somewhat dissatisfied, and 2 (3%) were extremely dissatisfied with the Inpatient Dashboard. Responses differed by level of training (P = .03), with medical students trending towards higher satisfaction.
Respondents preferred the Inpatient Dashboard over CPRS for gathering information and writing progress notes; 42 (64%) respondents mostly favored the Inpatient Dashboard, 15 (23%) slightly favored the Inpatient Dashboard over CPRS, and 8 (12%) were neutral. One respondent (2%) slightly favored CPRS to the Inpatient Dashboard (Table 2).
Sixty-five respondents (100%) found the Inpatient Dashboard’s ability to summarize patient information in a central place helpful (Table 3). Among them, 53 (82%) respondents reported it was very or extremely helpful, 10 (15%) respondents reported it was moderately helpful, and 2 (3%) respondents reported it was slightly helpful. This feature positively impacted users’ awareness of patients with DVT prophylaxis or a Foley catheter. Ten (15%) respondents reported being much more aware, and 29 (45%) respondents reporting they were slightly more aware. The remaining 26 (40%) respondents reported no change in awareness.
The Inpatient Dashboard was reported to save time preparing for physician rounds by 52 (80%) respondents, contributing to much greater efficiency for 29 (45%) respondents and slightly more efficiency for 23 (35%) respondents. However, 10 (15%) respondents reported no change in efficiency, and 3 (5%) respondents reduced efficiency, with 1 (2%) respondent reporting it slightly less efficient and 2 (3%) respondents reporting it much less efficient. Responses differed by level of training (P = .01), with medical students trending towards higher efficiency. Of the 23 respondents who reported on the Inpatient Dashboard’s impact on daily workload stress level, 22 (96%) indicated the tool had a stress-reducing effect, with 9 (39%) experiencing a major reduction in stress level, and 13 (57%) experiencing somewhat reduced stress level. Only 1 participant (4%) reported no change in stress. No participants reported an increase in stress.
DISCUSSION
The adoption of EHRs has transformed operational modalities in contemporary health care systems, heralding advancements in patient satisfaction, safety, and overall quality and efficiency of care.1,2 However, EHRs still present challenges, predominantly around clinician satisfaction, marked by instances of burnout and increased time spent on computers.2-6 In this context, the Inpatient Dashboard, an online companion to the CPRS, exemplifies how user-centered innovations in EHRs can address and mitigate associated challenges.
The Inpatient Dashboard has been well received with most respondents of the survey conducted in this study indicating they were both satisfied with the instrument and preferring it to CPRS. This high approval aligns with existing literature on the potential advantages of user-centered design in health care technology.13 The tool has gained widespread acceptance at the VAAAHS even in the absence of obligatory usage or institutional incentives. The appeal of the Inpatient Dashboard may stem from its increased efficiency, with most users affirming its timesaving nature. While CPRS can only display local notes, laboratory results, and studies, the Inpatient Dashboard can display data from across all VA sites. The VA Joint Longitudinal Viewer can similarly display data from across all sites, but the display is not streamlined as it is in the Inpatient Dashboard. The Inpatient Dashboard incorporates this clinical information into a single page to facilitate day-to-day workflow and dynamic documentation (ie, reviewing laboratory results, medications, writing notes, and signing out patients). This increased efficiency allows clinicians to counter 2 common barriers to EHR implementation: productivity loss and insufficient time.14
The association between EHRs and improved quality and safety in health care is well-documented.3 The Inpatient Dashboard fortifies this association by enhancing awareness around patient status, evidenced by a majority of respondents, and by integrating a medication reconciliation tool to decrease medication errors on transition from the emergency department to inpatient hospitalization.10
The Inpatient Dashboard’s impact on alleviating daily workload stress is noteworthy, with almost all respondents experiencing reduced stress levels and physician burnout, which has been linked to deteriorating well-being, compromised patient safety, and escalated health care costs.15,16 The heightened susceptibility of physicians to burnout compared to other professionals underscores the imperative for incorporating stress-mitigating interventions in the EHR.17,18
While responses to most questions did not significantly differ by training levels, overall satisfaction with the Inpatient Dashboard and its ability to save time preparing for rounds were rated higher by medical students. This may be attributable to a greater derived benefit from collating and presenting data to learners with less familiarity with the native EHR. It is also notable that the Inpatient Dashboard allows medical students to directly contribute to a patient’s note, which could be another driver in satisfaction. While most interns still felt the Inpatient Dashboard enabled them to save time preparing for rounds, there were a considerable number of ‘no change’ responses, which suggests some interns may not have modified their existing prerounding strategies. These associations are limited by the relatively small number of respondents by learner category, with senior medical residents and attending physicians being underrepresented.
While there are a multitude of dashboards available at the VA, most are made to track certain quality metrics and are used more by administrative and leadership staff. The Inpatient Dashboard was created specifically for frontline clinicians to facilitate their day-to-day workflow and dynamic documentation. This tool can additionally help with quality metrics, though its main purpose was and is to make clinician workflow easier and more efficient.
These results are especially timely because the VA is modernizing its EHR by transitioning to Oracle Health.7 Due to the numerous reports both from veterans and VA clinicians that the Oracle Health EHR is not meeting expectations, deployment at further sites has been halted while improving the experience of the 5 institutions using Oracle Health is prioritized.9 The Inpatient Dashboard, instead of being merely an enhancement to CPRS, could emerge as a potential bridge to Oracle Health if adapted to display data from Oracle Health as it does VistA. This would facilitate a smoother, more integrated transition for those health care institutions employing the Inpatient Dashboard.
Limitations
The reliance on self-reported data inherently carries the risk of bias, and the absence of objective measures, like time-tracking studies, limits the quantifiable assessment of the Inpatient Dashboard efficacy. The single-center nature of the study also may restrict the generalizability of the results.
CONCLUSIONS
Optimal integration of EHRs into health care delivery is critical to high-quality patient care and operational efficiency. The Inpatient Dashboard is an example of an innovative, user-centric solution that integrated and presented clinical information in a way that produced high satisfaction and adoption by users at a VA hospital.
- Office of the National Coordinator for Health Information Technology. National Trends in Hospital and Physician Adoption of Electronic Health Records. HealthIT.gov. Accessed February 5, 2025. https://www.healthit.gov/data/quickstats/national-trends-hospital-and-physician-adoption-electronic-health-records
- Buntin MB, Burke MF, Hoaglin MC, Blumenthal D. The benefits of health information technology: a review of the recent literature shows predominantly positive results. Health Aff (Millwood). 2011;30(3):464-471. doi:10.1377/hlthaff.2011.0178
- Nguyen L, Bellucci E, Nguyen LT. Electronic health records implementation: an evaluation of information system impact and contingency factors. Int J Med Inf. 2014;83(11):779-796. doi:10.1016/j.ijmedinf.2014.06.011
- Alexander AG, Ballou KA. Work-life balance, burnout, and the electronic health record. Am J Med. 2018;131(8):857- 858. doi:10.1016/j.amjmed.2018.02.033
- Sinsky C, Colligan L, Li L, et al. Allocation of physician time in ambulatory practice: a time and motion study in 4 specialties. Ann Intern Med. 2016;165(11):753-760. doi:10.7326/M16-0961
- Chaiyachati KH, Shea JA, Asch DA, et al. Assessment of inpatient time allocation among first-year internal medicine residents using time-motion observations. JAMA Intern Med. 2019;179(6):760-767. doi:10.1001/jamainternmed.2019.0095
- US Department of Veterans Affairs. Statement by Acting Secretary Robert Wilkie - VA signs contract with Cerner for an electronic health record system. New release. May 17, 2018. Accessed February 5, 2025. https://news.va.gov/press-room/statement-by-acting-secretary-robert-wilkie-va-signs-contract-with-cerner-for-an-electronic-health-record-system/
- US Government Publishing Office. VA’s Electronic health record modernization: an update on rollout, cost, and schedule. Subcommittee on Military Construction, Veterans Affairs, and Related Agencies, Committee on Appropriations, United States Senate. 117th Congress, 2nd Session. September 21, 2022. Accessed February 5, 2025. https://www.govinfo.gov/content/pkg/CHRG-117shrg52328/html/CHRG-117shrg52328.htm
- US Department of Veterans Affairs. VA announces reset of electronic health record project. Accessed December 21, 2023. https://news.va.gov/press-room/va-announces-reset-of-electronic-health-record-project/
- Grondin C, Gupta A, Houchens N, et al. Medication reconciliation tool reduces errors in patients admitted from the ED to hospital. Am J Med Qual. 2021;36(2):129. doi:10.1097/01.JMQ.0000741500.33781.eb
- Starmer AJ, Spector ND, Srivastava R, et al. Changes in medical errors after implementation of a handoff program. N Engl J Med. 2014;371(19):1803-1812. doi:10.1056/NEJMsa1405556
- Starmer AJ, O’Toole JK, Rosenbluth G, et al. Development, implementation, and dissemination of the I-PASS handoff curriculum: a multisite educational intervention to improve patient handoffs. Acad Med. 2014;89(6):876-884. doi:10.1097/ACM.0000000000000264
- Ratwani RM, Fairbanks RJ, Hettinger AZ, Benda NC. Electronic health record usability: analysis of the user-centered design processes of eleven electronic health record vendors. J Am Med Inform Assoc. 2015;22(6):1179-1182. doi:10.1093/jamia/ocv050
- Kruse CS, Kristof C, Jones B, Mitchell E, Martinez A. Barriers to electronic health record adoption: a systematic literature review. J Med Syst. 2016;40(12):252. doi:10.1007/s10916-016-0628-9
- West CP, Dyrbye LN, Shanafelt TD. Physician burnout: contributors, consequences and solutions. J Intern Med. 2018;283(6):516-529. doi:10.1111/joim.12752
- Smeds MR, Janko MR, Allen S, et al. Burnout and its relationship with perceived stress, self-efficacy, depression, social support, and programmatic factors in general surgery residents. Am J Surg. 2020;219(6):907- 912. doi:10.1016/j.amjsurg.2019.07.004
- Shanafelt TD, Boone S, Tan L, et al. Burnout and satisfaction with work-life balance among US physicians relative to the general US population. Arch Intern Med. 2012;172(18):1377-1385. doi:10.1001/archinternmed.2012.3199
- Budd J. Burnout related to electronic health record use in primary care. J Prim Care Community Health. 2023;14:21501319231166921. doi:10.1177/21501319231166921
Streamlining Health Care: Inpatient Dashboard as a User-Centric Solution in EHR Enhancement
Streamlining Health Care: Inpatient Dashboard as a User-Centric Solution in EHR Enhancement