User login
Impact of Hospitalists on Care Outcomes in a Large Integrated Health System in British Columbia
From the Fraser Health Authority, Surrey, British Columbia, Canada.
Abstract
- Objective: To study care outcomes associated with a network of hospitalist services compared to traditional providers.
- Design: Retrospective review of administrative data.
- Setting and participants: Patients from a large integrated health care system in British Columbia in western Canada admitted and cared for by 3 provider groups between April 1, 2012, and March 31, 2018: hospitalists, family physicians (FP), and internal medicine (IM) physicians:
- Measurements: Average total length of stay (LOS), 30-day readmission, in-hospital mortality, and hospital standardized mortality ratio (HSMR) were the study outcome measures. Multiple logistic regression or generalized regression were completed to determine the relationship between provider groups and outcomes.
- Results: A total of 248,412 hospitalizations were included. Compared to patients admitted to hospitalists, patients admitted to other providers had higher odds of mortality (odds ratio [OR] for FP, 1.29; 95% confidence interval [CI], 1.21-1.37; OR for IM, 1.24; 95% CI, 1.15-1.33). Compared to hospitalist care, FP care was associated with higher readmission (OR, 1.27; 95% CI, 1.22-1.33), while IM care showed lower odds of readmission (OR, 0.83; 95% CI, 0.79-0.87). Patients admitted to the IM group had significantly lower total LOS (mean, 5.13 days; 95% CI, 5.04-5.21) compared to patients admitted to hospitalists (mean, 7.37 days; CI, 7.26-7.49) and FPs (mean, 7.30 days; 95% CI, 7.19-7.41). In a subgroup analysis of patients presenting with congestive heart failure, chronic obstructive pulmonary disease, and pneumonia, these general tendencies broadly persisted for mortality and LOS comparisons between FPs and hospitalists, but results were mixed for hospital readmissions.
- Conclusion: Care provided by hospitalists was associated with lower mortality and readmission rates compared with care provided by FPs, despite similar LOS. These findings may reflect differences in volume of services delivered by individual physicians, on-site availability to address urgent medical issues, and evolving specialization of clinical and nonclinical care processes in the acute care setting.
Keywords: hospital medicine; length of stay; readmission; mortality.
The hospitalist model of care has undergone rapid growth globally in recent years.1 The first hospitalist programs in Canada began around the same time as those in the United States and share many similarities in design and operations with their counterparts.2-4 However, unlike in the United States, where the hospitalist model has successfully established itself as an emerging specialty, debates about the merits of the model and its value proposition continue among Canadian observers.5-9
Historically, the type of physicians who acted as the most responsible provider (MRP) in Canadian hospitals depended on setting and geography.10 In large urban areas, groups of general internists or specialists have historically looked after general medicine patients as part of university-affiliated teaching services.11,12 Patients admitted to community hospitals have traditionally been cared for by their own primary care providers, typically general practitioners or family physicians (FPs). In the mid-1990s, many primary care providers in urban centers began to withdraw from inpatient care and primarily focused their practices in the outpatient setting.13-15 Hospitalist programs emerged as health care administrators sought to fill the resulting gap in MRP coverage.2,10
To date, attempts to understand the impact of hospitalist programs in Canada have been limited. A number of early studies aimed to describe16 the role of hospitalists in Canada and suggested improvements in length of stay (LOS) and staff satisfaction.17 However, these studies relied on unadjusted before-after comparisons and lacked methodological rigor to draw robust conclusions. More recently, a few studies have evaluated care outcomes associated with hospitalists using administrative databases, which attempted to control for potential confounding factors.18-21
While these studies are beginning to shed some light on the impact of hospital medicine programs in Canada, there are a number of issues that limit their generalizability. For example, the majority of studies to date focus on hospital medicine programs in Canada’s largest province (Ontario), and most describe experiences from single institutions. Since each of the 13 provincial and territorial governments organizes its health care system differently,22 results from 1 province may not be generalizable to other parts of the country. Moreover, hospitalists in Ontario are more diverse in their training backgrounds, with a larger percentage having trained in general internal medicine (IM), as compared to other parts of Canada, where the majority of hospitalists are overwhelmingly trained as FPs.3
We aimed to study care outcomes associated with a network of hospitalist services compared to “traditional” providers (community-based FPs and IM specialists) in a large integrated health care system in the province of British Columbia in western Canada. The hospital medicine services in this network span a range of community and academic hospitals, and collectively constitute 1 of the largest regional programs in the country. This provides a unique opportunity to understand the impact of hospitalists on outcome measures across a range of acute care institutions.
Methods
Setting and Population
Fraser Health Authority is 1 of 5 regional health authorities in British Columbia that emerged in 2001.23,24 It operates a network of hospitalist programs in 10 of its 12 acute care hospitals. In addition to hospitalists, there are a variable number of “traditional” physician providers who continue to act as MRPs. These include community-based FPs who continue to see their own patients in the hospital, either as part of a solo-practice model or a clinic-based call group. There are also a number of general internists and other subspecialists who accept MRP roles for general medicine patients who may present with higher-acuity conditions. As a result, patients requiring hospitalization due to nonsurgical or noncritical care conditions at each Fraser Health hospital may be cared for by a physician belonging to 1 of 3 groups, depending on local circumstances: an FP, a hospitalist, or an internist.
Inclusion and Exclusion Criteria
In order to evaluate comparative outcomes associated with hospitalist care, we included all patients admitted to a physician in each of the 3 provider groups between April 1, 2012, and March 31, 2018. We chose this time period for 2 reasons: first, we wanted to ensure comparability over an extended period of time, given the methodological changes implemented in 2009 by the Canadian Institute for Health Information (CIHI), the federal organization in the country responsible for setting standards for health care measures.25 Second, previous internal reviews had suggested that data quality prior to this year was inconsistent. We only considered hospitalizations where patients were admitted to and discharged by the same service, and excluded 2 acute care facilities and 1 free-standing rehabilitation facility without a hospitalist service during this period. We also excluded patients who resided in a location beyond the geographic catchment area of Fraser Health. Further details about data collection are outlined in the Appendix.
Measures
We used the framework developed by White and Glazier26 to inform the selection of our outcome measures, as well as relevant variables that may impact them. This framework proposes that the design of the inpatient care model (structures and processes of care) directly affects care outcomes. The model also proposes that patient and provider attributes can modulate this relationship, and suggests that a comprehensive evaluation of hospitalist performance needs to take these factors into account. We identified average total LOS, 30-day readmission rate, in-hospital mortality, and hospital standardized mortality ratio (HSMR)27 as primary outcome measures. HSMR is defined as actual over expected mortality and is measured by CIHI through a formula that takes into account patient illness attributes (eg, the most responsible diagnosis, comorbidity levels) and baseline population mortality rates.27 We chose these measures because they are clinically relevant and easy to obtain and have been utilized in previous similar studies in Canada and the United States.18-21,26
Statistical Analysis
Baseline demographic and clinical differences in patient outcomes were examined using independent t-tests or chi-square tests. Furthermore, baseline differences based on provider groups were explored using analysis of variance or chi-square tests. Multiple logistic regression analyses were completed to determine the relationship between provider groups and readmission and mortality, while the relationship between provider groups and hospital LOS was determined with generalized linear regression (using gamma distribution and a log link). Gamma distribution with a log link analysis is appropriate with outcome measures that are positively skewed (eg, hospital LOS). It assumes that data are sampled from an exponential family of distributions, thus mimicking a log-normal distribution, and minimizes estimation bias and standard errors. These analyses were completed while controlling for the effects of age, gender, and other potential confounding factors.
We initially attempted to control for case mix by incorporating case-mix groups (CMGs) in our multivariate analysis. However, we identified 475 CMGs with at least 1 patient in our study population. We then explored the inclusion of major clinical categories (MCCs) that broadly group CMGs into various higher order/organ-system level categories (eg, diseases of the respiratory system); however, we could not aggregate them into sufficiently homogenous groups to be entered into regression models. Instead, we conducted subgroup analyses on patients in our study population who were hospitalized with 1 of the following 3 CMGs: chronic obstructive pulmonary disease (COPD, n = 11,404 patients), congestive heart failure without coronary angiography (CHF, n = 7680), and pneumonia (itself an aggregate of 3 separate CMGs: aspiration pneumonia, bacterial pneumonia, viral/unspecified pneumonia, n = 11,155). We chose these CMGs as they are among the top 8 presentations for all 3 provider groups.
For all outcome measures, we excluded atypical patients (defined by CIHI as those with atypically long stays) and patients who had been transferred between facilities. For the readmission analysis, we also excluded patients who died in the hospital (Appendix A). Data analyses were completed in IBM SPSS, version 21. For all analyses, significance was determined using 2-tailed test and alpha < 0.05.
Ethics
The Fraser Health Department of Research and Evaluation reviewed this project to determine need for formal Ethics Review Board review, and granted an exemption based on institutional guidelines for program evaluations.
Results
A total of 132,178 patients were admitted to and discharged by 1 of the 3 study provider groups during the study period, accounting for a total of 248,412 hospitalizations. After excluding patients cared for in Fraser Health facilities without a hospitalist service and those who resided in a geographic area beyond Fraser Health, a total of 224,214 admissions were included in the final analysis.
Patient Characteristics
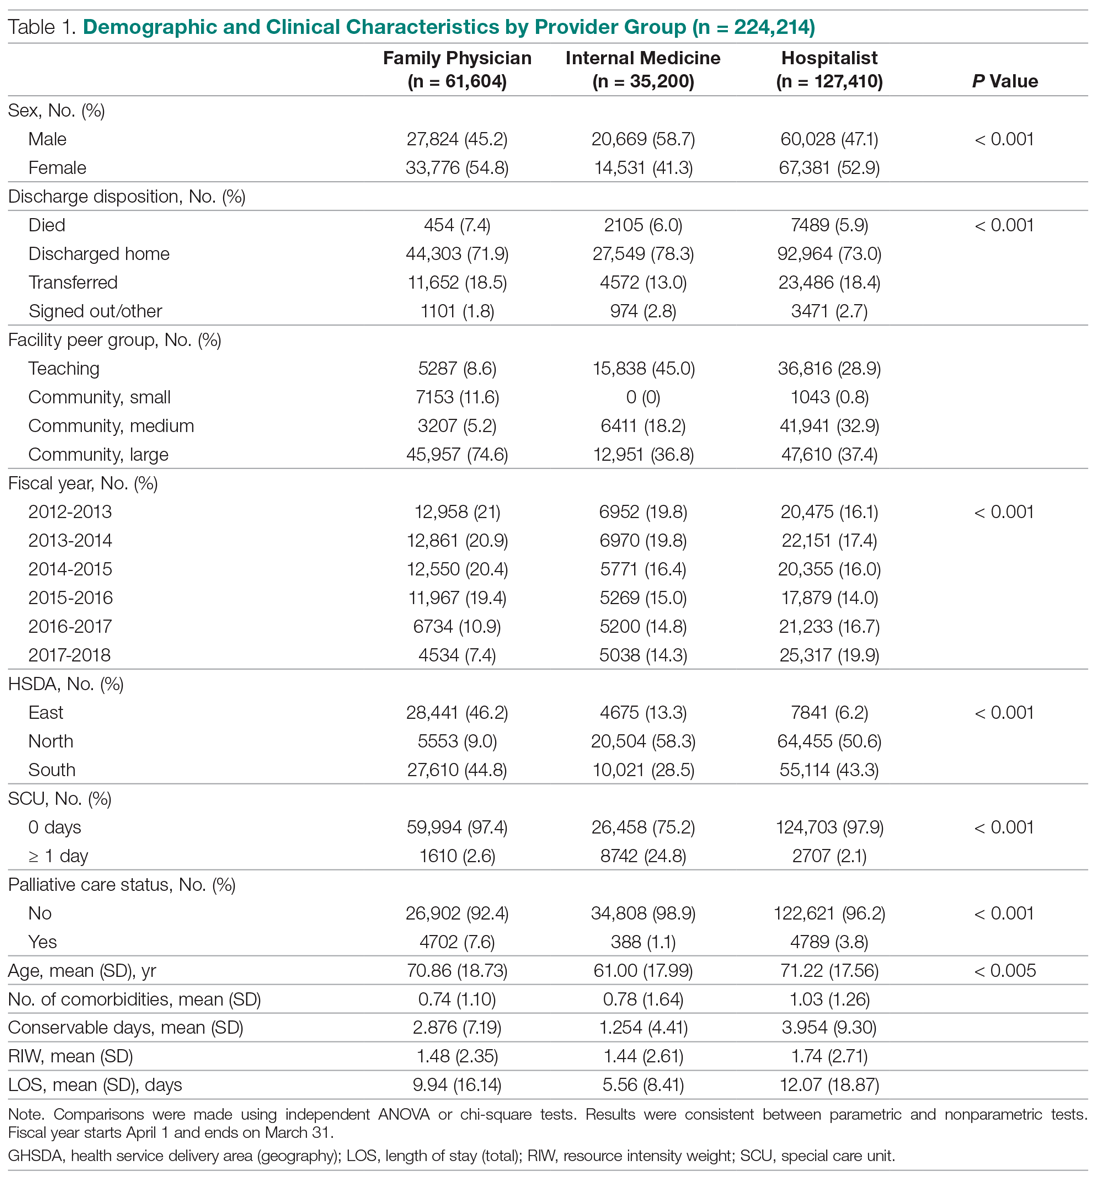
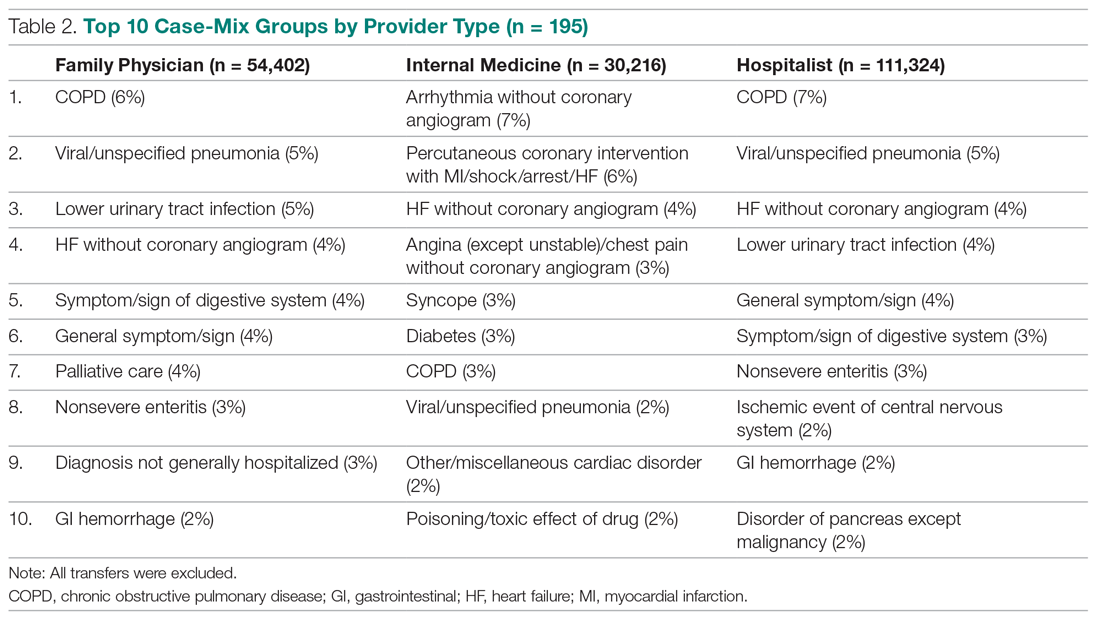
The demographic and clinical characteristics of patients by provider group are summarized in Table 1. Patients admitted to IM providers were substantially younger than those admitted to either FPs or hospitalists (61.00 vs 70.86 and 71.22 years, respectively; P < 0.005). However, patients admitted to hospitalists had higher degrees of complexity (as measured by higher comorbidity levels, number of secondary diagnoses, and higher resource intensity weights [RIWs]; P < 000.1 for all comparisons). Overall, the most common CMGs seen by FPs and hospitalists were similar, while IM providers primarily saw patients with cardiac conditions (Table 2).
Trends Over Time
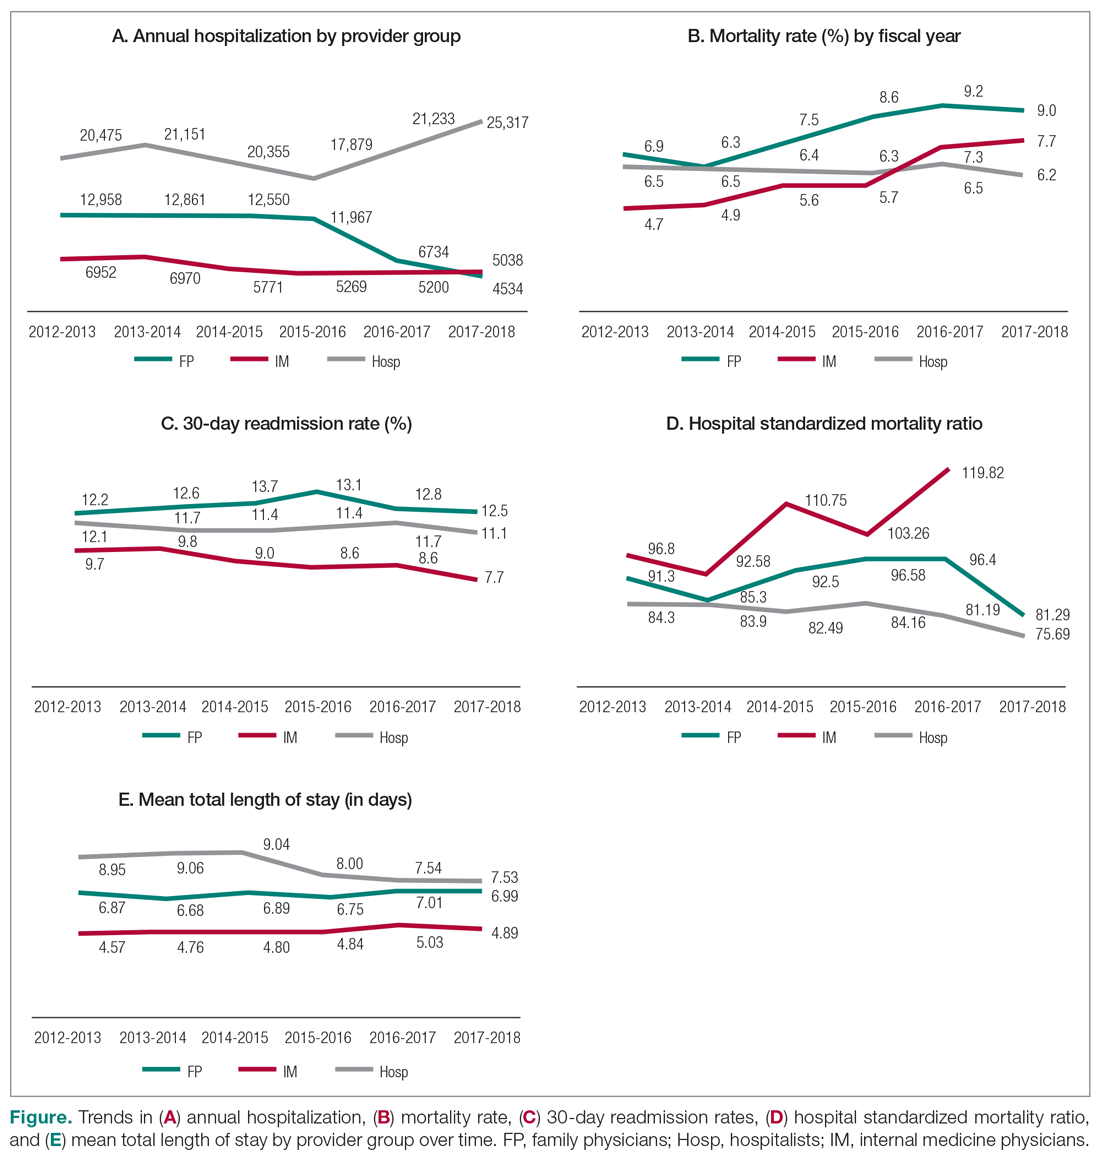
During the study period, the number of patients admitted to the hospitalist services increased by 24%, while admissions to FPs and IM providers declined steadily (Figure). During this time, LOS for hospitalists progressively declined, while LOS for FPs and IM providers increased. Similar trends were observed for measures of mortality, while readmission rates remained constant for FPs, despite a decline observed for other providers.
Mortality
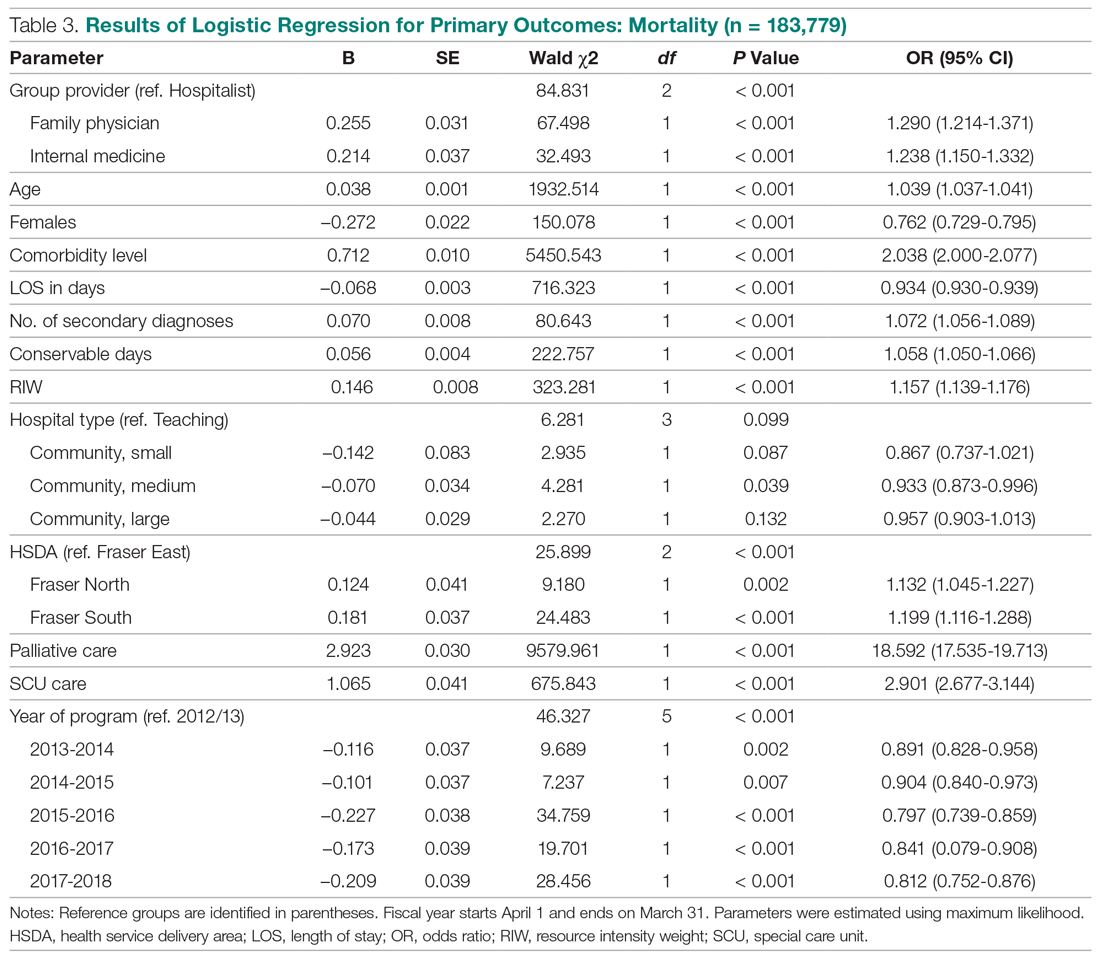
Table 3 summarizes the relationship between provider groups and in-hospital mortality (n = 183,779). Controlling for other variables, patients admitted to FP and IM providers had higher odds of mortality when compared to hospitalists (odds ratio [OR] for FPs, 1.29; 95% confidence interval [CI], 1.21-1.37; OR for IM, 1.24; 95% CI, 1.15-1.33). Older age, higher comorbidity level, higher number of secondary diagnoses, higher use of hospital resources (as measured by RIWs), longer than expected hospital stay (as measured by conservable days), and male gender were also associated with higher mortality. Similarly, patients receiving palliative care and those who spent at least 1 day in a special care unit (critical care, observation, and monitored care units) also had higher odds of mortality. On the other hand, admission to nonteaching medium facilities and longer hospital stay were associated with lower mortality. Compared to the first year of this analysis, lower mortality rates were observed in subsequent fiscal years. Finally, there appear to be geographic variations in mortality within Fraser Health.
Our analysis of patients with COPD, CHF, and pneumonia showed mixed results (Table 4). Patients admitted to the FP provider group with CHF and pneumonia had higher mortality compared to hospitalists (OR for CHF, 1.77; 95% CI, 1.38-2.27; OR for pneumonia, 1.53; 95% CI, 1.25-1.88), with a similar but nonstatistically significant trend observed for patients with COPD (OR, 1.29; 95% CI, 0.99-1.70). On the other hand, the higher observed mortality associated with the IM provider group in the overall study population only persisted for patients with COPD (OR, 2.71; 95% CI, 1.94-3.80), with no statistically significant differences for patients with CHF (OR, 1.18; 95% CI, 0.84-1.65) and pneumonia (OR, 0.93; 95% CI, 0.69-1.25).
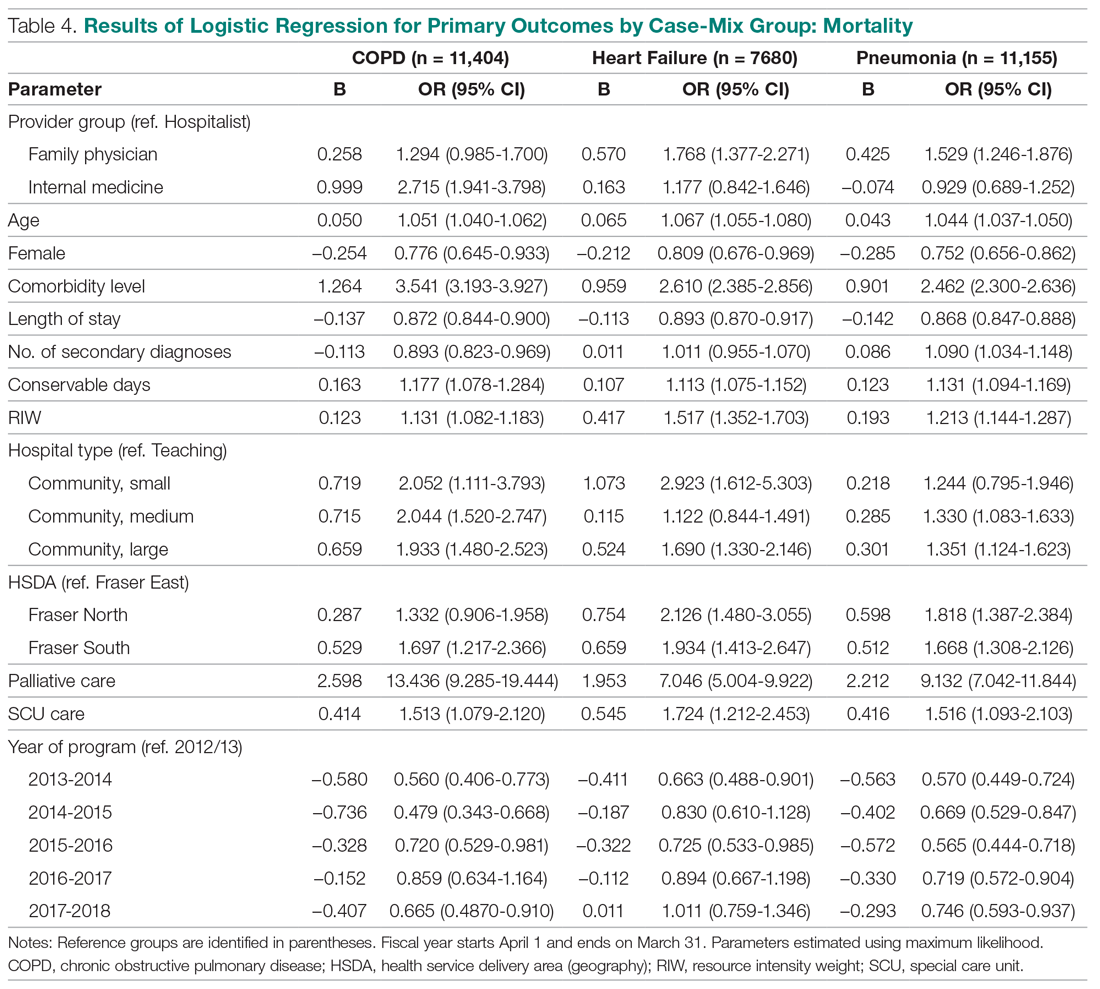
We also studied adjusted mortality as measured by HSMRs. Currently, our Health Information Management system calculates an HSMR value for each patient admitted to our acute care facilities using the methodology developed by CIHI. Prior internal audits demonstrated that our internal calculations closely approximate those reported nationally. Our analysis suggests that over time, HSMR rates for the 3 provider groups have diverged, with patients admitted to IM providers having a higher mortality rate than what would be expected based on the presenting clinical conditions and comorbidity levels (Figure, part D).
Readmission
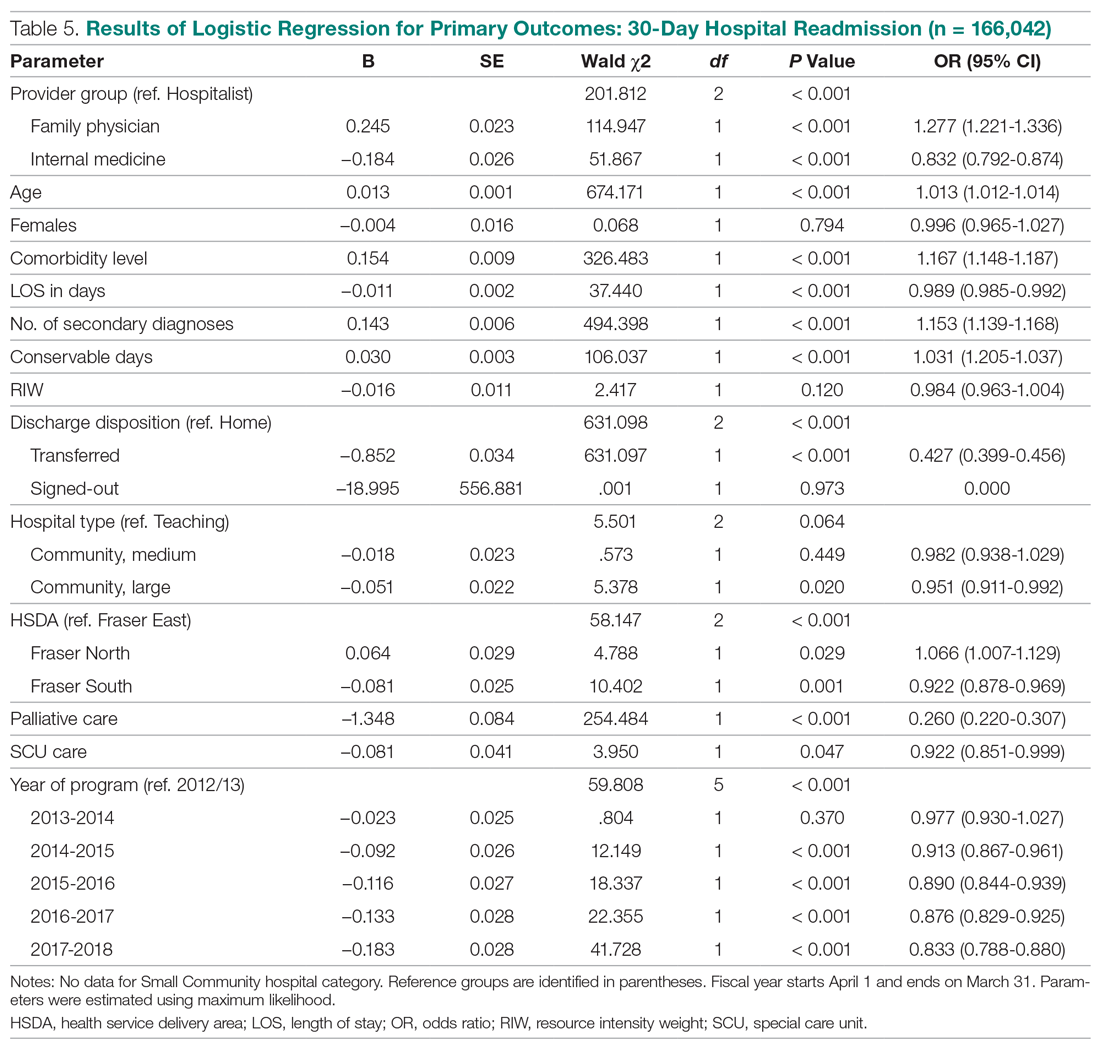
The results of our multiple logistic regression for readmission are summarized in Table 5 (n = 166,042). The impact of provider group on 30-day readmission is mixed, with higher odds associated with FPs compared to hospitalists (OR, 1.27; 95% CI, 1.22-1.34) and lower odds associated with IM physicians (OR, 0.83; 95% CI, 0.79-0.87). Gender and RIW did not show any significant associations, but increasing age, higher number of secondary diagnoses, higher comorbidity levels, and longer than expected LOS (as measure by conservable days) were associated with higher odds of readmission. Conversely, longer hospitalization, admission to a large community hospital, palliative status, admission to a special care unit, geography, and fiscal year were associated with lower odds of readmission.
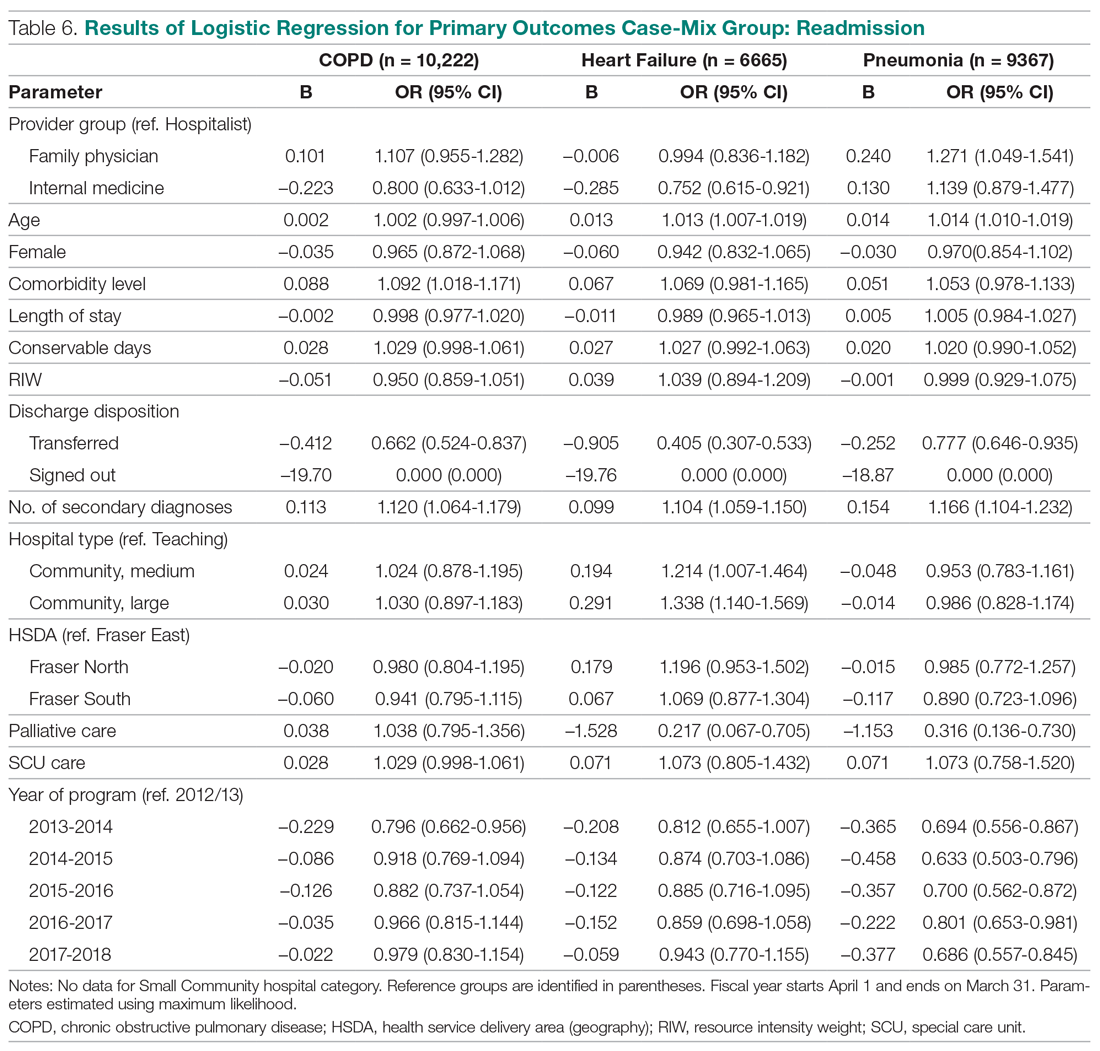
The above differences between provider groups were no longer consistently present when we analyzed patients presenting with COPD, CHF, and pneumonias (Table 6). Only patients admitted to the FP provider group with pneumonia had higher odds of readmission compared to hospitalists (OR, 1.27; 95% CI, 1.05-1.54). Conversely, only patients admitted to the IM provider group with CHF showed lower readmission (OR, 0.75; 95% CI, 0.62-0.92).
Total LOS
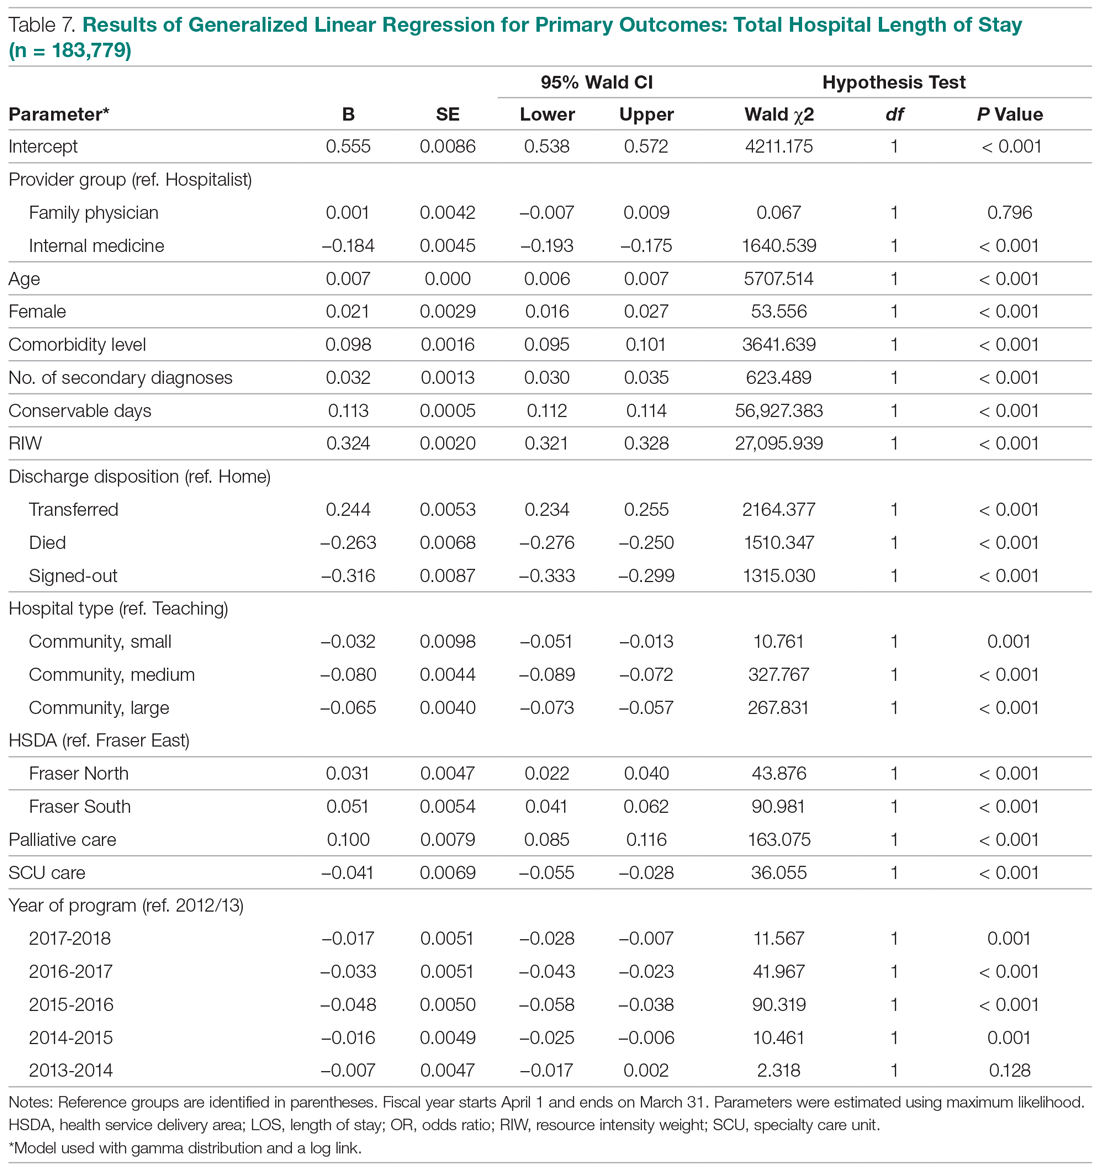
Results using generalized linear regressions for total LOS are presented in Table 7 (n = 183,779). Patients admitted to the IM provider group had significantly lower total LOS (mean, 5.13 days; 95% CI, 5.04-5.21) compared to the hospitalist (mean, 7.37 days; 95% CI, 7.26-7.49) and FP (mean, 7.30 days; 95% CI, 7.19-7.41) groups, with no significant differences between the latter 2 groups. Older patients, females, patients with higher comorbidity levels or number of secondary diagnoses, higher RIW, palliative patients, and discharge to a facility other than the patient’s home were associated with a significantly longer LOS. On the other hand, admission to nonteaching hospitals and admission to a special care unit was associated with lower LOS.
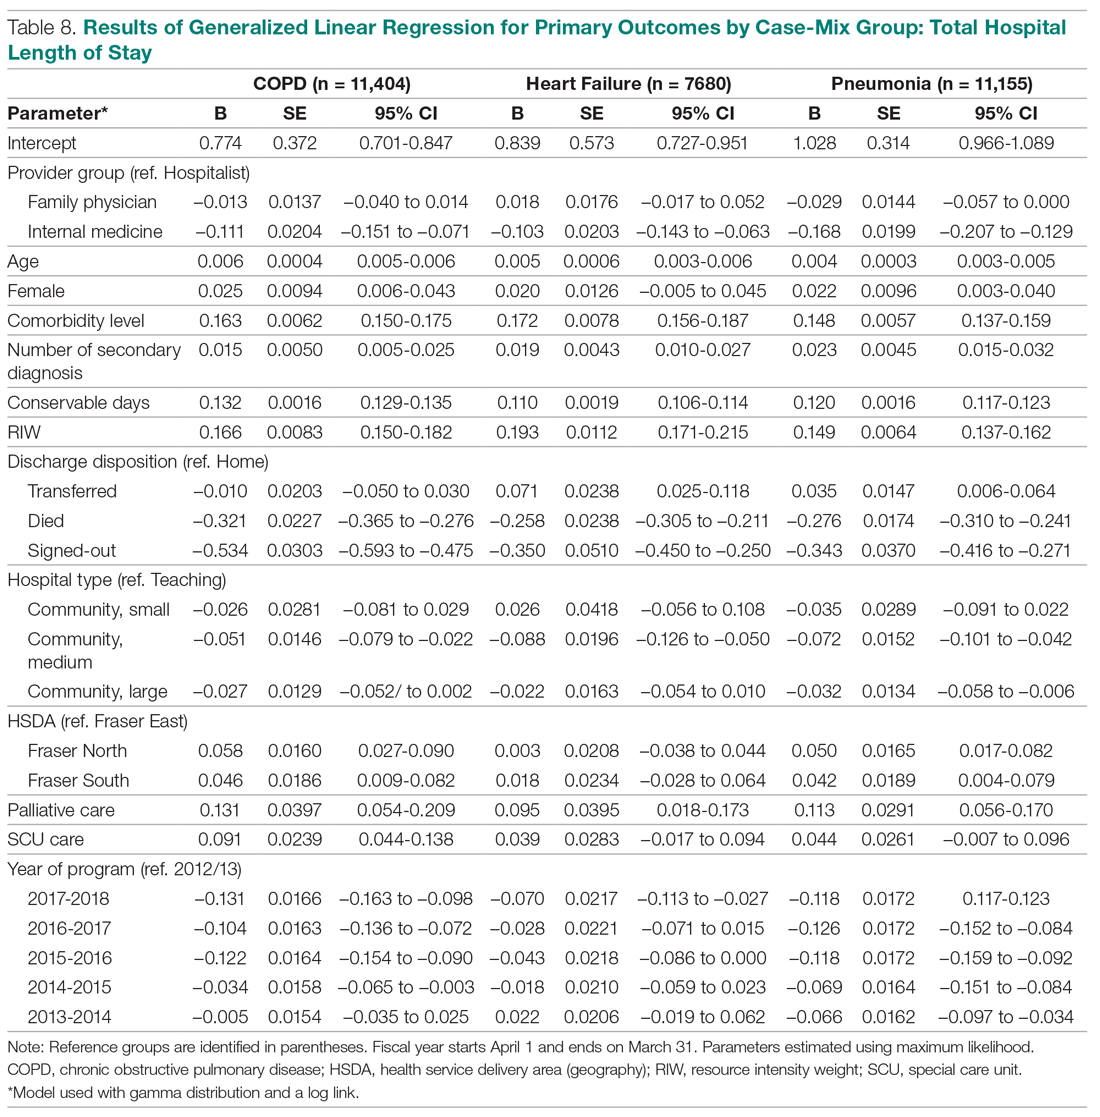
When we compared total LOS for patients admitted with COPD, CHF, and pneumonias, the same differences observed for the broader comparisons persisted: IM patients consistently showed shorter LOS compared to hospitalist patients, while LOS associated with FP patients was similar (Table 8).
Discussion
To our knowledge, our evaluation is the largest study to date designed to understand outcomes associated with hospitalist care in Canada. Our analyses suggest that patients admitted to our large network of hospitalist services present with clinical conditions that are very similar to those of general medicine patients in other Canadian provinces.28,29 They also show that patients cared for by hospitalists experience lower mortality rates compared to those cared for by FPs. Our findings are similar to previous studies, which have suggested a 12% to 75% reduction in odds of mortality associated with hospitalist care.18,19 These differences persisted even when we focused on patients presenting with specific clinical conditions (CHF, COPD, and pneumonias).
White and colleagues have previously demonstrated that generalist physicians who had higher volumes of inpatient care activity also had lower mortality rates compared to those who cared for hospitalized patients less frequently.19 An association between higher physician caseloads and better outcomes has been established for many surgical and medical conditions.30-32 Given that 85% of hospitalists in our program have post-graduate medical training in family medicine (internal department surveys, data not shown), it is less likely that training background can explain differences in outcomes. Instead, differences in patient volumes and the dedicated focus of hospitalists on acute care are likely more important contributors to lower mortality. In our program, a full-time hospitalist spends an average of 2000 hours annually providing services in the hospital setting. The continuous on-site presence of hospitalists enhances their clinical experience with regards to the management of common medical conditions, and increases their exposure to less common presentations of illnesses. The ability to respond to deteriorating patients in a timely manner may be another factor in explaining the differences in mortality rates between dedicated hospital-based generalist providers and similarly trained physicians with a primarily community-based focus.
In our study, hospitalist care was also broadly associated with lower mortality compared to the IM providers, although these differences were not consistently present when patients with specific diagnoses were compared. This may be partly explained by the relationship between caseload and outcomes, but other factors may also be important. For example, patients admitted by IM providers spend significantly more time in specialized units. They also predominantly present with cardiac conditions, and as such may have higher acuity levels and require more invasive interventions. While this may explain the higher observed mortality, a within-group comparison still suggests higher than expected mortality for IM patients. The HSMR methodology measures actual mortality rates compared to what would be expected based on clinical presentation and baseline population characteristics. Calculating HSMR is highly dependent on proper documentation and chart abstraction,33,34 and it is possible that some of the differences observed are due to incomplete physician documentation. However, a more in-depth analysis of care processes will be required to clarify the observed trends.
Compared to hospitalists, patients cared for by FPs also had higher odds of readmission within 30 days, which is consistent with prior studies.18,19 One of the criticisms of the hospitalist model has been the inherent discontinuity of care that is built into the model, which can contribute to suboptimal transitions of care between the acute and community settings.35 The expectation is that FPs who admit their own patients do not face this challenge, and as a result their patients should be readmitted less frequently after discharge. Our data and those from previous studies do not support this hypothesis. At the same time, when we studied patients with specific clinical diagnoses, only those hospitalized for pneumonias continued to demonstrate higher readmission odds. This suggests that hospital readmission rate is a complex measure that may be influenced by a multitude of hospital and community factors, and may be different for patients who present with different clinical diagnoses. Further research is required to better understand the relationship between provider type and experience with hospital readmission for patients with various clinical presentations.
Unlike the United States, where hospitalist care has been associated with reductions in LOS,26,36 studies in the Canadian health care setting have shown mixed results.17-21 In our evaluation, hospitalist care is not associated with reductions in total LOS compared to care provided by FPs or IM physicians. This could be due to a number of factors. First, unlike FPs, who know their patients, hospitalists may have a more conservative risk tolerance in discharging patients with whom they are not familiar. Similarly, physicians who have trained in IM may have a lower threshold for discharging patients than hospitalists, whose training background is mainly rooted in family medicine.3 Second, discontinuity of care has been associated with longer LOS for hospitalized patients.37,38 Hospitalists generally work for 7- to 10-day rotations. As a result, a patient may see a number of different hospitalists during the same hospital stay, which could nullify any gains in LOS that may be expected from better familiarity with hospital processes. Third, whereas a FP or an internist may only have a few inpatients under their care at any given time, each hospitalist typically cares for 17 to 22 patients every day. Increasing hospitalist workload has been shown to negatively impact LOS and may result in lower efficiency.39 Finally, many patients in our health system who require more time to recuperate or need complex discharge planning are usually transferred to the care of the hospitalist service from other services, or are preferentially admitted to hospitalists from the emergency department. As a result, hospitalists may look after a disproportionately higher number of long-stay patients. Despite all this, hospitalists in our population perform similarly to FPs, regardless of the clinical diagnoses of hospitalized patients.
Our study has a number of notable limitations. First, we used administrative data to conduct our evaluation and could only control for factors that are available in our data systems. As a result, some potential confounders may not have been taken into consideration. For example, our databases do not contain provider characteristics (eg, age, years of clinical experience) that have been deemed to be relevant by White and Glazier.26 Similarly, we did not have all the necessary information about the characteristics of the various MRP programs (eg, number of physicians involved in group practices, the schedule model of community FP call groups) and were not able to account for the potential impact of these on observed outcomes. Second, although our findings mirror prior studies from other parts of Canada, they may not be applicable to hospitalist programs in other jurisdictions or in health systems that are not regionalized or integrated. Third, our IM provider group is heterogeneous, with a number of different IM subspecialties (cardiologists, gastroenterologists, general internists) grouped under the IM category in our database. As a result, comparisons between the IM provider group and the other 2 provider groups, which are more homogenous, should be interpreted with caution.
Finally, we included only patients admitted to facilities in which a hospitalist service existed during the study period. As a result, a medium-size community hospital without a hospitalist service where patients are cared for exclusively by FPs and IM physicians was not included in the comparisons, and in 4 of the 10 facilities included, the number of FP patients was less than 10% of total hospitalized patients at the site (Appendix A). This may have resulted in an under-representation of FP patients.
Conclusion
Debates about the merits of the hospitalist model in Canada continue, and are in part fueled by a paucity of robust evidence about its impact on care outcomes compared to more traditional ways of providing inpatient care. In our evaluation, care provided by hospitalists is associated with lower mortality and readmission rates, despite similar LOS compared with FPs. Hospitalist care is also associated with lower mortality compared to IM providers. Hospitalists also demonstrated progressive improvement over time, with decreasing LOS and mortality rates and a stable readmission rate. Our results suggest that physicians with a focus on inpatient care can have positive contributions to quality and efficiency of care in Canada.
Corresponding author: Vandad Yousefi MD, CCFP, FHM, Fraser Health Authority, 400, 13450–102 Avenue, Surrey BC V3T 0H1, Canada.
Financial disclosures: None.
1. Kisuule F, Howell E. Hospital medicine beyond the United States. Int J Gen Med. 2018;11:65-71.
2. Yousefi V, Wilton D. Dedesigning hospital care: learning from the experience of hospital medicine in Canada. J Global Health Care Syst. 2011;1(3).
3. Soong C, Fan E, Howell E, et al. Characteristics of hospitalists and hospitalist programs in the United States and Canada. J Clin Outcomes Manag. 2009;16:69-76.
4. Yousefi V. How Canadian hospitalists spend their time - A work-sampling study within a hospital medicine program in Ontario. J Clin Outcomes Manag. 2011;18:159-166.
5. Wilson G. Are inpatients’ needs better served by hospitalists than by their family doctors? No. Can Fam Physician. 2008;54:1101-1103.
6. Samoil D. Are inpatients’ needs better served by hospitalists than by their family doctors: Yes? Can Fam Physician. 2008;54:1100-1101.
7. Nicolson B. Where’s Marcus Welby when you need him? BC Medical J. 2016;58:63-64.
8. Lemire F. Enhanced skills in family medicine: Update. Can Fam Physician. 2018;64:160.
9. Lerner J. Wanting family medicine without primary care. Can Fam Physician. 2018; 64:155.
10. Canadian Society of Hospital Medicine. Core Competencies in Hospital Medicine - Care of the Medical Inpatient. 2015.
11. Redelmeier DA. A Canadian perspective on the American hospitalist movement. Arch Intern Med. 1999;159:1665-1668.
12. Ghali WA, Greenberg PB, Mejia R, et al. International perspectives on general internal medicine and the case for “globalization” of a discipline. J Gen Intern Med. 2006;21:197-200.
13. Day A, MacMillan L. Neglect of the inpatient: The hospitalist movement in Canada responds. Hosp Q. 2001;4:36.
14. Sullivan P. Enter the hospitalist: New type of patient creating a new type of specialist. CMAJ. 2000;162:1345-1346.
15. Chan BTB. The declining comprehensiveness of primary care. CMAJ. 2002;166:429-434.
16. Abenhaim HA, Kahn SR, Raffoul J, Becker MR. Program description: A hospitalist-run, medical short-stay unit in a teaching hospital. CMAJ. 2000;163:1477-1480.
17. McGowan B, Nightingale M. The hospitalist program a new specialty on the horizon in acute care medicine a hospital case study. BC Med J. 2003;45:391-394.
18. Yousefi V, Chong C. Does implementation of a hospitalist program in a Canadian community hospital improve measures of quality of care and utilization? An observational comparative analysis of hospitalists vs. traditional care providers. BMC Health Serv Res. 2013;13:204.
19. White HL. Assessing the prevalence, penetration and performance of hospital physicians in Ontario: Implications for the quality and efficiency of inpatient care. ProQuest Dissertations Publishing; 2016.
20. Gutierrez CA, Norris M, Chail M. Impact of a newly established hospitalist training program on patient LOS and RIW. Poster presented at the 9th Annual Canadian Society of Hospital Medicine Conference, September 23-25, 2011; Banff, Alberta.
21. Seth P, Nicholson K, Habbous S, Menard J. Implementation of a hospitalist medicine model in a full-service community hospital: Examining impact two years post-implementation on health resource use andpatient satisfaction. Poster presented at the 13th Annual Canadian Society of Hospital Medicine Conference. 2015; Niagara Falls, Ontario.
22. Lewis S. A system in name only--access, variation, and reform in Canada’s provinces. N Engl J Med. 2015;372:497-500.
23. Lewis S, Kouri D. Regionalization: Making sense of the Canadian experience. Healthcare Papers. 2004;5:12-31.
24. Fraser Health Authority. About Fraser health. www.fraserhealth.ca/about-us/about-fraser-health#.XFJrl9JKiUk. Updated 2018. Accessed January 30, 2019.
25. Canadian Institute for Health Information. CMG+. https://www.cihi.ca/en/cmg. Accessed January 30, 2019.
26. White HL, Glazier RH. Do hospitalist physicians improve the quality of inpatient care delivery? A systematic review of process, efficiency and outcome measures. BMC Med. 2011;9:58.
27. Canadian Institute for Health Information. Hospital standardized mortality ratio technical notes. 2008. www.cihi.ca/sites/default/files/document/hsmr-tech-notes_en_0.pdf.
28. McAlister FA, Youngson E, Bakal JA, et al. Physician experience and outcomes among patients admitted to general internal medicine teaching wards. CMAJ. 2015;187:1041-1048.
29. Verma AA, Guo Y, Kwan JL, et al. Patient characteristics, resource use and outcomes associated with general internal medicine hospital care: The general medicine inpatient initiative (GEMINI) retrospective cohort study. CMAJ Open. 2017;5:E849.
30. Morche J, Mathes T, Pieper D. Relationship between surgeon volume and outcomes: A systematic review of systematic reviews. Syst Rev. 2016;5:204.
31. Halm EA, Lee C, Chassin MR. Is volume related to outcome in health care? A systematic review and methodologic critique of the literature. Ann Intern Med. 2002;137:511-520.
32. Chen CH, Chen YH, Lin HC, Lin HC. Association between physician caseload and patient outcome for sepsis treatment. Infect Control Hosp Epidemiol. 2009;30:556-562.
33. van Gestel YR, Lemmens VE, Lingsma HF, et al. The hospital standardized mortality ratio fallacy: A narrative review. Med Care. 2012;50:662-667.
34. Scott IA, Brand CA, Phelps GE, et al. Using hospital standardised mortality ratios to assess quality of care—proceed with extreme caution. Med J Aust. 2011; 194:645-648.
35. Wachter RM. Hospitalists in the United States -- mission accomplished or work in progress? N Engl J Med. 2004;350:1935-1936.
36. Peterson MC. A systematic review of outcomes and quality measures in adult patients cared for by hospitalists vs nonhospitalists. Mayo Clin Proc. 2009;84:248-254.
37. Chandra S, Wright SM, Howell EE. The creating incentives and continuity leading to efficiency staffing model: A quality improvement initiative in hospital medicine. Mayo Clin Proc. 2012;87:364-371.
38. Epstein K, Juarez E, Epstein A, et al. The impact of fragmentation of hospitalist care on length of stay. J Hosp Med. 2010;5:335-338.
39. Elliott DJ, Young RS, Brice J, et al. Effect of hospitalist workload on the quality and efficiency of care. JAMA Intern Med. 2014;174:786-793.
From the Fraser Health Authority, Surrey, British Columbia, Canada.
Abstract
- Objective: To study care outcomes associated with a network of hospitalist services compared to traditional providers.
- Design: Retrospective review of administrative data.
- Setting and participants: Patients from a large integrated health care system in British Columbia in western Canada admitted and cared for by 3 provider groups between April 1, 2012, and March 31, 2018: hospitalists, family physicians (FP), and internal medicine (IM) physicians:
- Measurements: Average total length of stay (LOS), 30-day readmission, in-hospital mortality, and hospital standardized mortality ratio (HSMR) were the study outcome measures. Multiple logistic regression or generalized regression were completed to determine the relationship between provider groups and outcomes.
- Results: A total of 248,412 hospitalizations were included. Compared to patients admitted to hospitalists, patients admitted to other providers had higher odds of mortality (odds ratio [OR] for FP, 1.29; 95% confidence interval [CI], 1.21-1.37; OR for IM, 1.24; 95% CI, 1.15-1.33). Compared to hospitalist care, FP care was associated with higher readmission (OR, 1.27; 95% CI, 1.22-1.33), while IM care showed lower odds of readmission (OR, 0.83; 95% CI, 0.79-0.87). Patients admitted to the IM group had significantly lower total LOS (mean, 5.13 days; 95% CI, 5.04-5.21) compared to patients admitted to hospitalists (mean, 7.37 days; CI, 7.26-7.49) and FPs (mean, 7.30 days; 95% CI, 7.19-7.41). In a subgroup analysis of patients presenting with congestive heart failure, chronic obstructive pulmonary disease, and pneumonia, these general tendencies broadly persisted for mortality and LOS comparisons between FPs and hospitalists, but results were mixed for hospital readmissions.
- Conclusion: Care provided by hospitalists was associated with lower mortality and readmission rates compared with care provided by FPs, despite similar LOS. These findings may reflect differences in volume of services delivered by individual physicians, on-site availability to address urgent medical issues, and evolving specialization of clinical and nonclinical care processes in the acute care setting.
Keywords: hospital medicine; length of stay; readmission; mortality.
The hospitalist model of care has undergone rapid growth globally in recent years.1 The first hospitalist programs in Canada began around the same time as those in the United States and share many similarities in design and operations with their counterparts.2-4 However, unlike in the United States, where the hospitalist model has successfully established itself as an emerging specialty, debates about the merits of the model and its value proposition continue among Canadian observers.5-9
Historically, the type of physicians who acted as the most responsible provider (MRP) in Canadian hospitals depended on setting and geography.10 In large urban areas, groups of general internists or specialists have historically looked after general medicine patients as part of university-affiliated teaching services.11,12 Patients admitted to community hospitals have traditionally been cared for by their own primary care providers, typically general practitioners or family physicians (FPs). In the mid-1990s, many primary care providers in urban centers began to withdraw from inpatient care and primarily focused their practices in the outpatient setting.13-15 Hospitalist programs emerged as health care administrators sought to fill the resulting gap in MRP coverage.2,10
To date, attempts to understand the impact of hospitalist programs in Canada have been limited. A number of early studies aimed to describe16 the role of hospitalists in Canada and suggested improvements in length of stay (LOS) and staff satisfaction.17 However, these studies relied on unadjusted before-after comparisons and lacked methodological rigor to draw robust conclusions. More recently, a few studies have evaluated care outcomes associated with hospitalists using administrative databases, which attempted to control for potential confounding factors.18-21
While these studies are beginning to shed some light on the impact of hospital medicine programs in Canada, there are a number of issues that limit their generalizability. For example, the majority of studies to date focus on hospital medicine programs in Canada’s largest province (Ontario), and most describe experiences from single institutions. Since each of the 13 provincial and territorial governments organizes its health care system differently,22 results from 1 province may not be generalizable to other parts of the country. Moreover, hospitalists in Ontario are more diverse in their training backgrounds, with a larger percentage having trained in general internal medicine (IM), as compared to other parts of Canada, where the majority of hospitalists are overwhelmingly trained as FPs.3
We aimed to study care outcomes associated with a network of hospitalist services compared to “traditional” providers (community-based FPs and IM specialists) in a large integrated health care system in the province of British Columbia in western Canada. The hospital medicine services in this network span a range of community and academic hospitals, and collectively constitute 1 of the largest regional programs in the country. This provides a unique opportunity to understand the impact of hospitalists on outcome measures across a range of acute care institutions.
Methods
Setting and Population
Fraser Health Authority is 1 of 5 regional health authorities in British Columbia that emerged in 2001.23,24 It operates a network of hospitalist programs in 10 of its 12 acute care hospitals. In addition to hospitalists, there are a variable number of “traditional” physician providers who continue to act as MRPs. These include community-based FPs who continue to see their own patients in the hospital, either as part of a solo-practice model or a clinic-based call group. There are also a number of general internists and other subspecialists who accept MRP roles for general medicine patients who may present with higher-acuity conditions. As a result, patients requiring hospitalization due to nonsurgical or noncritical care conditions at each Fraser Health hospital may be cared for by a physician belonging to 1 of 3 groups, depending on local circumstances: an FP, a hospitalist, or an internist.
Inclusion and Exclusion Criteria
In order to evaluate comparative outcomes associated with hospitalist care, we included all patients admitted to a physician in each of the 3 provider groups between April 1, 2012, and March 31, 2018. We chose this time period for 2 reasons: first, we wanted to ensure comparability over an extended period of time, given the methodological changes implemented in 2009 by the Canadian Institute for Health Information (CIHI), the federal organization in the country responsible for setting standards for health care measures.25 Second, previous internal reviews had suggested that data quality prior to this year was inconsistent. We only considered hospitalizations where patients were admitted to and discharged by the same service, and excluded 2 acute care facilities and 1 free-standing rehabilitation facility without a hospitalist service during this period. We also excluded patients who resided in a location beyond the geographic catchment area of Fraser Health. Further details about data collection are outlined in the Appendix.
Measures
We used the framework developed by White and Glazier26 to inform the selection of our outcome measures, as well as relevant variables that may impact them. This framework proposes that the design of the inpatient care model (structures and processes of care) directly affects care outcomes. The model also proposes that patient and provider attributes can modulate this relationship, and suggests that a comprehensive evaluation of hospitalist performance needs to take these factors into account. We identified average total LOS, 30-day readmission rate, in-hospital mortality, and hospital standardized mortality ratio (HSMR)27 as primary outcome measures. HSMR is defined as actual over expected mortality and is measured by CIHI through a formula that takes into account patient illness attributes (eg, the most responsible diagnosis, comorbidity levels) and baseline population mortality rates.27 We chose these measures because they are clinically relevant and easy to obtain and have been utilized in previous similar studies in Canada and the United States.18-21,26
Statistical Analysis
Baseline demographic and clinical differences in patient outcomes were examined using independent t-tests or chi-square tests. Furthermore, baseline differences based on provider groups were explored using analysis of variance or chi-square tests. Multiple logistic regression analyses were completed to determine the relationship between provider groups and readmission and mortality, while the relationship between provider groups and hospital LOS was determined with generalized linear regression (using gamma distribution and a log link). Gamma distribution with a log link analysis is appropriate with outcome measures that are positively skewed (eg, hospital LOS). It assumes that data are sampled from an exponential family of distributions, thus mimicking a log-normal distribution, and minimizes estimation bias and standard errors. These analyses were completed while controlling for the effects of age, gender, and other potential confounding factors.
We initially attempted to control for case mix by incorporating case-mix groups (CMGs) in our multivariate analysis. However, we identified 475 CMGs with at least 1 patient in our study population. We then explored the inclusion of major clinical categories (MCCs) that broadly group CMGs into various higher order/organ-system level categories (eg, diseases of the respiratory system); however, we could not aggregate them into sufficiently homogenous groups to be entered into regression models. Instead, we conducted subgroup analyses on patients in our study population who were hospitalized with 1 of the following 3 CMGs: chronic obstructive pulmonary disease (COPD, n = 11,404 patients), congestive heart failure without coronary angiography (CHF, n = 7680), and pneumonia (itself an aggregate of 3 separate CMGs: aspiration pneumonia, bacterial pneumonia, viral/unspecified pneumonia, n = 11,155). We chose these CMGs as they are among the top 8 presentations for all 3 provider groups.
For all outcome measures, we excluded atypical patients (defined by CIHI as those with atypically long stays) and patients who had been transferred between facilities. For the readmission analysis, we also excluded patients who died in the hospital (Appendix A). Data analyses were completed in IBM SPSS, version 21. For all analyses, significance was determined using 2-tailed test and alpha < 0.05.
Ethics
The Fraser Health Department of Research and Evaluation reviewed this project to determine need for formal Ethics Review Board review, and granted an exemption based on institutional guidelines for program evaluations.
Results
A total of 132,178 patients were admitted to and discharged by 1 of the 3 study provider groups during the study period, accounting for a total of 248,412 hospitalizations. After excluding patients cared for in Fraser Health facilities without a hospitalist service and those who resided in a geographic area beyond Fraser Health, a total of 224,214 admissions were included in the final analysis.
Patient Characteristics
The demographic and clinical characteristics of patients by provider group are summarized in Table 1. Patients admitted to IM providers were substantially younger than those admitted to either FPs or hospitalists (61.00 vs 70.86 and 71.22 years, respectively; P < 0.005). However, patients admitted to hospitalists had higher degrees of complexity (as measured by higher comorbidity levels, number of secondary diagnoses, and higher resource intensity weights [RIWs]; P < 000.1 for all comparisons). Overall, the most common CMGs seen by FPs and hospitalists were similar, while IM providers primarily saw patients with cardiac conditions (Table 2).
Trends Over Time
During the study period, the number of patients admitted to the hospitalist services increased by 24%, while admissions to FPs and IM providers declined steadily (Figure). During this time, LOS for hospitalists progressively declined, while LOS for FPs and IM providers increased. Similar trends were observed for measures of mortality, while readmission rates remained constant for FPs, despite a decline observed for other providers.
Mortality
Table 3 summarizes the relationship between provider groups and in-hospital mortality (n = 183,779). Controlling for other variables, patients admitted to FP and IM providers had higher odds of mortality when compared to hospitalists (odds ratio [OR] for FPs, 1.29; 95% confidence interval [CI], 1.21-1.37; OR for IM, 1.24; 95% CI, 1.15-1.33). Older age, higher comorbidity level, higher number of secondary diagnoses, higher use of hospital resources (as measured by RIWs), longer than expected hospital stay (as measured by conservable days), and male gender were also associated with higher mortality. Similarly, patients receiving palliative care and those who spent at least 1 day in a special care unit (critical care, observation, and monitored care units) also had higher odds of mortality. On the other hand, admission to nonteaching medium facilities and longer hospital stay were associated with lower mortality. Compared to the first year of this analysis, lower mortality rates were observed in subsequent fiscal years. Finally, there appear to be geographic variations in mortality within Fraser Health.
Our analysis of patients with COPD, CHF, and pneumonia showed mixed results (Table 4). Patients admitted to the FP provider group with CHF and pneumonia had higher mortality compared to hospitalists (OR for CHF, 1.77; 95% CI, 1.38-2.27; OR for pneumonia, 1.53; 95% CI, 1.25-1.88), with a similar but nonstatistically significant trend observed for patients with COPD (OR, 1.29; 95% CI, 0.99-1.70). On the other hand, the higher observed mortality associated with the IM provider group in the overall study population only persisted for patients with COPD (OR, 2.71; 95% CI, 1.94-3.80), with no statistically significant differences for patients with CHF (OR, 1.18; 95% CI, 0.84-1.65) and pneumonia (OR, 0.93; 95% CI, 0.69-1.25).
We also studied adjusted mortality as measured by HSMRs. Currently, our Health Information Management system calculates an HSMR value for each patient admitted to our acute care facilities using the methodology developed by CIHI. Prior internal audits demonstrated that our internal calculations closely approximate those reported nationally. Our analysis suggests that over time, HSMR rates for the 3 provider groups have diverged, with patients admitted to IM providers having a higher mortality rate than what would be expected based on the presenting clinical conditions and comorbidity levels (Figure, part D).
Readmission
The results of our multiple logistic regression for readmission are summarized in Table 5 (n = 166,042). The impact of provider group on 30-day readmission is mixed, with higher odds associated with FPs compared to hospitalists (OR, 1.27; 95% CI, 1.22-1.34) and lower odds associated with IM physicians (OR, 0.83; 95% CI, 0.79-0.87). Gender and RIW did not show any significant associations, but increasing age, higher number of secondary diagnoses, higher comorbidity levels, and longer than expected LOS (as measure by conservable days) were associated with higher odds of readmission. Conversely, longer hospitalization, admission to a large community hospital, palliative status, admission to a special care unit, geography, and fiscal year were associated with lower odds of readmission.
The above differences between provider groups were no longer consistently present when we analyzed patients presenting with COPD, CHF, and pneumonias (Table 6). Only patients admitted to the FP provider group with pneumonia had higher odds of readmission compared to hospitalists (OR, 1.27; 95% CI, 1.05-1.54). Conversely, only patients admitted to the IM provider group with CHF showed lower readmission (OR, 0.75; 95% CI, 0.62-0.92).
Total LOS
Results using generalized linear regressions for total LOS are presented in Table 7 (n = 183,779). Patients admitted to the IM provider group had significantly lower total LOS (mean, 5.13 days; 95% CI, 5.04-5.21) compared to the hospitalist (mean, 7.37 days; 95% CI, 7.26-7.49) and FP (mean, 7.30 days; 95% CI, 7.19-7.41) groups, with no significant differences between the latter 2 groups. Older patients, females, patients with higher comorbidity levels or number of secondary diagnoses, higher RIW, palliative patients, and discharge to a facility other than the patient’s home were associated with a significantly longer LOS. On the other hand, admission to nonteaching hospitals and admission to a special care unit was associated with lower LOS.
When we compared total LOS for patients admitted with COPD, CHF, and pneumonias, the same differences observed for the broader comparisons persisted: IM patients consistently showed shorter LOS compared to hospitalist patients, while LOS associated with FP patients was similar (Table 8).
Discussion
To our knowledge, our evaluation is the largest study to date designed to understand outcomes associated with hospitalist care in Canada. Our analyses suggest that patients admitted to our large network of hospitalist services present with clinical conditions that are very similar to those of general medicine patients in other Canadian provinces.28,29 They also show that patients cared for by hospitalists experience lower mortality rates compared to those cared for by FPs. Our findings are similar to previous studies, which have suggested a 12% to 75% reduction in odds of mortality associated with hospitalist care.18,19 These differences persisted even when we focused on patients presenting with specific clinical conditions (CHF, COPD, and pneumonias).
White and colleagues have previously demonstrated that generalist physicians who had higher volumes of inpatient care activity also had lower mortality rates compared to those who cared for hospitalized patients less frequently.19 An association between higher physician caseloads and better outcomes has been established for many surgical and medical conditions.30-32 Given that 85% of hospitalists in our program have post-graduate medical training in family medicine (internal department surveys, data not shown), it is less likely that training background can explain differences in outcomes. Instead, differences in patient volumes and the dedicated focus of hospitalists on acute care are likely more important contributors to lower mortality. In our program, a full-time hospitalist spends an average of 2000 hours annually providing services in the hospital setting. The continuous on-site presence of hospitalists enhances their clinical experience with regards to the management of common medical conditions, and increases their exposure to less common presentations of illnesses. The ability to respond to deteriorating patients in a timely manner may be another factor in explaining the differences in mortality rates between dedicated hospital-based generalist providers and similarly trained physicians with a primarily community-based focus.
In our study, hospitalist care was also broadly associated with lower mortality compared to the IM providers, although these differences were not consistently present when patients with specific diagnoses were compared. This may be partly explained by the relationship between caseload and outcomes, but other factors may also be important. For example, patients admitted by IM providers spend significantly more time in specialized units. They also predominantly present with cardiac conditions, and as such may have higher acuity levels and require more invasive interventions. While this may explain the higher observed mortality, a within-group comparison still suggests higher than expected mortality for IM patients. The HSMR methodology measures actual mortality rates compared to what would be expected based on clinical presentation and baseline population characteristics. Calculating HSMR is highly dependent on proper documentation and chart abstraction,33,34 and it is possible that some of the differences observed are due to incomplete physician documentation. However, a more in-depth analysis of care processes will be required to clarify the observed trends.
Compared to hospitalists, patients cared for by FPs also had higher odds of readmission within 30 days, which is consistent with prior studies.18,19 One of the criticisms of the hospitalist model has been the inherent discontinuity of care that is built into the model, which can contribute to suboptimal transitions of care between the acute and community settings.35 The expectation is that FPs who admit their own patients do not face this challenge, and as a result their patients should be readmitted less frequently after discharge. Our data and those from previous studies do not support this hypothesis. At the same time, when we studied patients with specific clinical diagnoses, only those hospitalized for pneumonias continued to demonstrate higher readmission odds. This suggests that hospital readmission rate is a complex measure that may be influenced by a multitude of hospital and community factors, and may be different for patients who present with different clinical diagnoses. Further research is required to better understand the relationship between provider type and experience with hospital readmission for patients with various clinical presentations.
Unlike the United States, where hospitalist care has been associated with reductions in LOS,26,36 studies in the Canadian health care setting have shown mixed results.17-21 In our evaluation, hospitalist care is not associated with reductions in total LOS compared to care provided by FPs or IM physicians. This could be due to a number of factors. First, unlike FPs, who know their patients, hospitalists may have a more conservative risk tolerance in discharging patients with whom they are not familiar. Similarly, physicians who have trained in IM may have a lower threshold for discharging patients than hospitalists, whose training background is mainly rooted in family medicine.3 Second, discontinuity of care has been associated with longer LOS for hospitalized patients.37,38 Hospitalists generally work for 7- to 10-day rotations. As a result, a patient may see a number of different hospitalists during the same hospital stay, which could nullify any gains in LOS that may be expected from better familiarity with hospital processes. Third, whereas a FP or an internist may only have a few inpatients under their care at any given time, each hospitalist typically cares for 17 to 22 patients every day. Increasing hospitalist workload has been shown to negatively impact LOS and may result in lower efficiency.39 Finally, many patients in our health system who require more time to recuperate or need complex discharge planning are usually transferred to the care of the hospitalist service from other services, or are preferentially admitted to hospitalists from the emergency department. As a result, hospitalists may look after a disproportionately higher number of long-stay patients. Despite all this, hospitalists in our population perform similarly to FPs, regardless of the clinical diagnoses of hospitalized patients.
Our study has a number of notable limitations. First, we used administrative data to conduct our evaluation and could only control for factors that are available in our data systems. As a result, some potential confounders may not have been taken into consideration. For example, our databases do not contain provider characteristics (eg, age, years of clinical experience) that have been deemed to be relevant by White and Glazier.26 Similarly, we did not have all the necessary information about the characteristics of the various MRP programs (eg, number of physicians involved in group practices, the schedule model of community FP call groups) and were not able to account for the potential impact of these on observed outcomes. Second, although our findings mirror prior studies from other parts of Canada, they may not be applicable to hospitalist programs in other jurisdictions or in health systems that are not regionalized or integrated. Third, our IM provider group is heterogeneous, with a number of different IM subspecialties (cardiologists, gastroenterologists, general internists) grouped under the IM category in our database. As a result, comparisons between the IM provider group and the other 2 provider groups, which are more homogenous, should be interpreted with caution.
Finally, we included only patients admitted to facilities in which a hospitalist service existed during the study period. As a result, a medium-size community hospital without a hospitalist service where patients are cared for exclusively by FPs and IM physicians was not included in the comparisons, and in 4 of the 10 facilities included, the number of FP patients was less than 10% of total hospitalized patients at the site (Appendix A). This may have resulted in an under-representation of FP patients.
Conclusion
Debates about the merits of the hospitalist model in Canada continue, and are in part fueled by a paucity of robust evidence about its impact on care outcomes compared to more traditional ways of providing inpatient care. In our evaluation, care provided by hospitalists is associated with lower mortality and readmission rates, despite similar LOS compared with FPs. Hospitalist care is also associated with lower mortality compared to IM providers. Hospitalists also demonstrated progressive improvement over time, with decreasing LOS and mortality rates and a stable readmission rate. Our results suggest that physicians with a focus on inpatient care can have positive contributions to quality and efficiency of care in Canada.
Corresponding author: Vandad Yousefi MD, CCFP, FHM, Fraser Health Authority, 400, 13450–102 Avenue, Surrey BC V3T 0H1, Canada.
Financial disclosures: None.
From the Fraser Health Authority, Surrey, British Columbia, Canada.
Abstract
- Objective: To study care outcomes associated with a network of hospitalist services compared to traditional providers.
- Design: Retrospective review of administrative data.
- Setting and participants: Patients from a large integrated health care system in British Columbia in western Canada admitted and cared for by 3 provider groups between April 1, 2012, and March 31, 2018: hospitalists, family physicians (FP), and internal medicine (IM) physicians:
- Measurements: Average total length of stay (LOS), 30-day readmission, in-hospital mortality, and hospital standardized mortality ratio (HSMR) were the study outcome measures. Multiple logistic regression or generalized regression were completed to determine the relationship between provider groups and outcomes.
- Results: A total of 248,412 hospitalizations were included. Compared to patients admitted to hospitalists, patients admitted to other providers had higher odds of mortality (odds ratio [OR] for FP, 1.29; 95% confidence interval [CI], 1.21-1.37; OR for IM, 1.24; 95% CI, 1.15-1.33). Compared to hospitalist care, FP care was associated with higher readmission (OR, 1.27; 95% CI, 1.22-1.33), while IM care showed lower odds of readmission (OR, 0.83; 95% CI, 0.79-0.87). Patients admitted to the IM group had significantly lower total LOS (mean, 5.13 days; 95% CI, 5.04-5.21) compared to patients admitted to hospitalists (mean, 7.37 days; CI, 7.26-7.49) and FPs (mean, 7.30 days; 95% CI, 7.19-7.41). In a subgroup analysis of patients presenting with congestive heart failure, chronic obstructive pulmonary disease, and pneumonia, these general tendencies broadly persisted for mortality and LOS comparisons between FPs and hospitalists, but results were mixed for hospital readmissions.
- Conclusion: Care provided by hospitalists was associated with lower mortality and readmission rates compared with care provided by FPs, despite similar LOS. These findings may reflect differences in volume of services delivered by individual physicians, on-site availability to address urgent medical issues, and evolving specialization of clinical and nonclinical care processes in the acute care setting.
Keywords: hospital medicine; length of stay; readmission; mortality.
The hospitalist model of care has undergone rapid growth globally in recent years.1 The first hospitalist programs in Canada began around the same time as those in the United States and share many similarities in design and operations with their counterparts.2-4 However, unlike in the United States, where the hospitalist model has successfully established itself as an emerging specialty, debates about the merits of the model and its value proposition continue among Canadian observers.5-9
Historically, the type of physicians who acted as the most responsible provider (MRP) in Canadian hospitals depended on setting and geography.10 In large urban areas, groups of general internists or specialists have historically looked after general medicine patients as part of university-affiliated teaching services.11,12 Patients admitted to community hospitals have traditionally been cared for by their own primary care providers, typically general practitioners or family physicians (FPs). In the mid-1990s, many primary care providers in urban centers began to withdraw from inpatient care and primarily focused their practices in the outpatient setting.13-15 Hospitalist programs emerged as health care administrators sought to fill the resulting gap in MRP coverage.2,10
To date, attempts to understand the impact of hospitalist programs in Canada have been limited. A number of early studies aimed to describe16 the role of hospitalists in Canada and suggested improvements in length of stay (LOS) and staff satisfaction.17 However, these studies relied on unadjusted before-after comparisons and lacked methodological rigor to draw robust conclusions. More recently, a few studies have evaluated care outcomes associated with hospitalists using administrative databases, which attempted to control for potential confounding factors.18-21
While these studies are beginning to shed some light on the impact of hospital medicine programs in Canada, there are a number of issues that limit their generalizability. For example, the majority of studies to date focus on hospital medicine programs in Canada’s largest province (Ontario), and most describe experiences from single institutions. Since each of the 13 provincial and territorial governments organizes its health care system differently,22 results from 1 province may not be generalizable to other parts of the country. Moreover, hospitalists in Ontario are more diverse in their training backgrounds, with a larger percentage having trained in general internal medicine (IM), as compared to other parts of Canada, where the majority of hospitalists are overwhelmingly trained as FPs.3
We aimed to study care outcomes associated with a network of hospitalist services compared to “traditional” providers (community-based FPs and IM specialists) in a large integrated health care system in the province of British Columbia in western Canada. The hospital medicine services in this network span a range of community and academic hospitals, and collectively constitute 1 of the largest regional programs in the country. This provides a unique opportunity to understand the impact of hospitalists on outcome measures across a range of acute care institutions.
Methods
Setting and Population
Fraser Health Authority is 1 of 5 regional health authorities in British Columbia that emerged in 2001.23,24 It operates a network of hospitalist programs in 10 of its 12 acute care hospitals. In addition to hospitalists, there are a variable number of “traditional” physician providers who continue to act as MRPs. These include community-based FPs who continue to see their own patients in the hospital, either as part of a solo-practice model or a clinic-based call group. There are also a number of general internists and other subspecialists who accept MRP roles for general medicine patients who may present with higher-acuity conditions. As a result, patients requiring hospitalization due to nonsurgical or noncritical care conditions at each Fraser Health hospital may be cared for by a physician belonging to 1 of 3 groups, depending on local circumstances: an FP, a hospitalist, or an internist.
Inclusion and Exclusion Criteria
In order to evaluate comparative outcomes associated with hospitalist care, we included all patients admitted to a physician in each of the 3 provider groups between April 1, 2012, and March 31, 2018. We chose this time period for 2 reasons: first, we wanted to ensure comparability over an extended period of time, given the methodological changes implemented in 2009 by the Canadian Institute for Health Information (CIHI), the federal organization in the country responsible for setting standards for health care measures.25 Second, previous internal reviews had suggested that data quality prior to this year was inconsistent. We only considered hospitalizations where patients were admitted to and discharged by the same service, and excluded 2 acute care facilities and 1 free-standing rehabilitation facility without a hospitalist service during this period. We also excluded patients who resided in a location beyond the geographic catchment area of Fraser Health. Further details about data collection are outlined in the Appendix.
Measures
We used the framework developed by White and Glazier26 to inform the selection of our outcome measures, as well as relevant variables that may impact them. This framework proposes that the design of the inpatient care model (structures and processes of care) directly affects care outcomes. The model also proposes that patient and provider attributes can modulate this relationship, and suggests that a comprehensive evaluation of hospitalist performance needs to take these factors into account. We identified average total LOS, 30-day readmission rate, in-hospital mortality, and hospital standardized mortality ratio (HSMR)27 as primary outcome measures. HSMR is defined as actual over expected mortality and is measured by CIHI through a formula that takes into account patient illness attributes (eg, the most responsible diagnosis, comorbidity levels) and baseline population mortality rates.27 We chose these measures because they are clinically relevant and easy to obtain and have been utilized in previous similar studies in Canada and the United States.18-21,26
Statistical Analysis
Baseline demographic and clinical differences in patient outcomes were examined using independent t-tests or chi-square tests. Furthermore, baseline differences based on provider groups were explored using analysis of variance or chi-square tests. Multiple logistic regression analyses were completed to determine the relationship between provider groups and readmission and mortality, while the relationship between provider groups and hospital LOS was determined with generalized linear regression (using gamma distribution and a log link). Gamma distribution with a log link analysis is appropriate with outcome measures that are positively skewed (eg, hospital LOS). It assumes that data are sampled from an exponential family of distributions, thus mimicking a log-normal distribution, and minimizes estimation bias and standard errors. These analyses were completed while controlling for the effects of age, gender, and other potential confounding factors.
We initially attempted to control for case mix by incorporating case-mix groups (CMGs) in our multivariate analysis. However, we identified 475 CMGs with at least 1 patient in our study population. We then explored the inclusion of major clinical categories (MCCs) that broadly group CMGs into various higher order/organ-system level categories (eg, diseases of the respiratory system); however, we could not aggregate them into sufficiently homogenous groups to be entered into regression models. Instead, we conducted subgroup analyses on patients in our study population who were hospitalized with 1 of the following 3 CMGs: chronic obstructive pulmonary disease (COPD, n = 11,404 patients), congestive heart failure without coronary angiography (CHF, n = 7680), and pneumonia (itself an aggregate of 3 separate CMGs: aspiration pneumonia, bacterial pneumonia, viral/unspecified pneumonia, n = 11,155). We chose these CMGs as they are among the top 8 presentations for all 3 provider groups.
For all outcome measures, we excluded atypical patients (defined by CIHI as those with atypically long stays) and patients who had been transferred between facilities. For the readmission analysis, we also excluded patients who died in the hospital (Appendix A). Data analyses were completed in IBM SPSS, version 21. For all analyses, significance was determined using 2-tailed test and alpha < 0.05.
Ethics
The Fraser Health Department of Research and Evaluation reviewed this project to determine need for formal Ethics Review Board review, and granted an exemption based on institutional guidelines for program evaluations.
Results
A total of 132,178 patients were admitted to and discharged by 1 of the 3 study provider groups during the study period, accounting for a total of 248,412 hospitalizations. After excluding patients cared for in Fraser Health facilities without a hospitalist service and those who resided in a geographic area beyond Fraser Health, a total of 224,214 admissions were included in the final analysis.
Patient Characteristics
The demographic and clinical characteristics of patients by provider group are summarized in Table 1. Patients admitted to IM providers were substantially younger than those admitted to either FPs or hospitalists (61.00 vs 70.86 and 71.22 years, respectively; P < 0.005). However, patients admitted to hospitalists had higher degrees of complexity (as measured by higher comorbidity levels, number of secondary diagnoses, and higher resource intensity weights [RIWs]; P < 000.1 for all comparisons). Overall, the most common CMGs seen by FPs and hospitalists were similar, while IM providers primarily saw patients with cardiac conditions (Table 2).
Trends Over Time
During the study period, the number of patients admitted to the hospitalist services increased by 24%, while admissions to FPs and IM providers declined steadily (Figure). During this time, LOS for hospitalists progressively declined, while LOS for FPs and IM providers increased. Similar trends were observed for measures of mortality, while readmission rates remained constant for FPs, despite a decline observed for other providers.
Mortality
Table 3 summarizes the relationship between provider groups and in-hospital mortality (n = 183,779). Controlling for other variables, patients admitted to FP and IM providers had higher odds of mortality when compared to hospitalists (odds ratio [OR] for FPs, 1.29; 95% confidence interval [CI], 1.21-1.37; OR for IM, 1.24; 95% CI, 1.15-1.33). Older age, higher comorbidity level, higher number of secondary diagnoses, higher use of hospital resources (as measured by RIWs), longer than expected hospital stay (as measured by conservable days), and male gender were also associated with higher mortality. Similarly, patients receiving palliative care and those who spent at least 1 day in a special care unit (critical care, observation, and monitored care units) also had higher odds of mortality. On the other hand, admission to nonteaching medium facilities and longer hospital stay were associated with lower mortality. Compared to the first year of this analysis, lower mortality rates were observed in subsequent fiscal years. Finally, there appear to be geographic variations in mortality within Fraser Health.
Our analysis of patients with COPD, CHF, and pneumonia showed mixed results (Table 4). Patients admitted to the FP provider group with CHF and pneumonia had higher mortality compared to hospitalists (OR for CHF, 1.77; 95% CI, 1.38-2.27; OR for pneumonia, 1.53; 95% CI, 1.25-1.88), with a similar but nonstatistically significant trend observed for patients with COPD (OR, 1.29; 95% CI, 0.99-1.70). On the other hand, the higher observed mortality associated with the IM provider group in the overall study population only persisted for patients with COPD (OR, 2.71; 95% CI, 1.94-3.80), with no statistically significant differences for patients with CHF (OR, 1.18; 95% CI, 0.84-1.65) and pneumonia (OR, 0.93; 95% CI, 0.69-1.25).
We also studied adjusted mortality as measured by HSMRs. Currently, our Health Information Management system calculates an HSMR value for each patient admitted to our acute care facilities using the methodology developed by CIHI. Prior internal audits demonstrated that our internal calculations closely approximate those reported nationally. Our analysis suggests that over time, HSMR rates for the 3 provider groups have diverged, with patients admitted to IM providers having a higher mortality rate than what would be expected based on the presenting clinical conditions and comorbidity levels (Figure, part D).
Readmission
The results of our multiple logistic regression for readmission are summarized in Table 5 (n = 166,042). The impact of provider group on 30-day readmission is mixed, with higher odds associated with FPs compared to hospitalists (OR, 1.27; 95% CI, 1.22-1.34) and lower odds associated with IM physicians (OR, 0.83; 95% CI, 0.79-0.87). Gender and RIW did not show any significant associations, but increasing age, higher number of secondary diagnoses, higher comorbidity levels, and longer than expected LOS (as measure by conservable days) were associated with higher odds of readmission. Conversely, longer hospitalization, admission to a large community hospital, palliative status, admission to a special care unit, geography, and fiscal year were associated with lower odds of readmission.
The above differences between provider groups were no longer consistently present when we analyzed patients presenting with COPD, CHF, and pneumonias (Table 6). Only patients admitted to the FP provider group with pneumonia had higher odds of readmission compared to hospitalists (OR, 1.27; 95% CI, 1.05-1.54). Conversely, only patients admitted to the IM provider group with CHF showed lower readmission (OR, 0.75; 95% CI, 0.62-0.92).
Total LOS
Results using generalized linear regressions for total LOS are presented in Table 7 (n = 183,779). Patients admitted to the IM provider group had significantly lower total LOS (mean, 5.13 days; 95% CI, 5.04-5.21) compared to the hospitalist (mean, 7.37 days; 95% CI, 7.26-7.49) and FP (mean, 7.30 days; 95% CI, 7.19-7.41) groups, with no significant differences between the latter 2 groups. Older patients, females, patients with higher comorbidity levels or number of secondary diagnoses, higher RIW, palliative patients, and discharge to a facility other than the patient’s home were associated with a significantly longer LOS. On the other hand, admission to nonteaching hospitals and admission to a special care unit was associated with lower LOS.
When we compared total LOS for patients admitted with COPD, CHF, and pneumonias, the same differences observed for the broader comparisons persisted: IM patients consistently showed shorter LOS compared to hospitalist patients, while LOS associated with FP patients was similar (Table 8).
Discussion
To our knowledge, our evaluation is the largest study to date designed to understand outcomes associated with hospitalist care in Canada. Our analyses suggest that patients admitted to our large network of hospitalist services present with clinical conditions that are very similar to those of general medicine patients in other Canadian provinces.28,29 They also show that patients cared for by hospitalists experience lower mortality rates compared to those cared for by FPs. Our findings are similar to previous studies, which have suggested a 12% to 75% reduction in odds of mortality associated with hospitalist care.18,19 These differences persisted even when we focused on patients presenting with specific clinical conditions (CHF, COPD, and pneumonias).
White and colleagues have previously demonstrated that generalist physicians who had higher volumes of inpatient care activity also had lower mortality rates compared to those who cared for hospitalized patients less frequently.19 An association between higher physician caseloads and better outcomes has been established for many surgical and medical conditions.30-32 Given that 85% of hospitalists in our program have post-graduate medical training in family medicine (internal department surveys, data not shown), it is less likely that training background can explain differences in outcomes. Instead, differences in patient volumes and the dedicated focus of hospitalists on acute care are likely more important contributors to lower mortality. In our program, a full-time hospitalist spends an average of 2000 hours annually providing services in the hospital setting. The continuous on-site presence of hospitalists enhances their clinical experience with regards to the management of common medical conditions, and increases their exposure to less common presentations of illnesses. The ability to respond to deteriorating patients in a timely manner may be another factor in explaining the differences in mortality rates between dedicated hospital-based generalist providers and similarly trained physicians with a primarily community-based focus.
In our study, hospitalist care was also broadly associated with lower mortality compared to the IM providers, although these differences were not consistently present when patients with specific diagnoses were compared. This may be partly explained by the relationship between caseload and outcomes, but other factors may also be important. For example, patients admitted by IM providers spend significantly more time in specialized units. They also predominantly present with cardiac conditions, and as such may have higher acuity levels and require more invasive interventions. While this may explain the higher observed mortality, a within-group comparison still suggests higher than expected mortality for IM patients. The HSMR methodology measures actual mortality rates compared to what would be expected based on clinical presentation and baseline population characteristics. Calculating HSMR is highly dependent on proper documentation and chart abstraction,33,34 and it is possible that some of the differences observed are due to incomplete physician documentation. However, a more in-depth analysis of care processes will be required to clarify the observed trends.
Compared to hospitalists, patients cared for by FPs also had higher odds of readmission within 30 days, which is consistent with prior studies.18,19 One of the criticisms of the hospitalist model has been the inherent discontinuity of care that is built into the model, which can contribute to suboptimal transitions of care between the acute and community settings.35 The expectation is that FPs who admit their own patients do not face this challenge, and as a result their patients should be readmitted less frequently after discharge. Our data and those from previous studies do not support this hypothesis. At the same time, when we studied patients with specific clinical diagnoses, only those hospitalized for pneumonias continued to demonstrate higher readmission odds. This suggests that hospital readmission rate is a complex measure that may be influenced by a multitude of hospital and community factors, and may be different for patients who present with different clinical diagnoses. Further research is required to better understand the relationship between provider type and experience with hospital readmission for patients with various clinical presentations.
Unlike the United States, where hospitalist care has been associated with reductions in LOS,26,36 studies in the Canadian health care setting have shown mixed results.17-21 In our evaluation, hospitalist care is not associated with reductions in total LOS compared to care provided by FPs or IM physicians. This could be due to a number of factors. First, unlike FPs, who know their patients, hospitalists may have a more conservative risk tolerance in discharging patients with whom they are not familiar. Similarly, physicians who have trained in IM may have a lower threshold for discharging patients than hospitalists, whose training background is mainly rooted in family medicine.3 Second, discontinuity of care has been associated with longer LOS for hospitalized patients.37,38 Hospitalists generally work for 7- to 10-day rotations. As a result, a patient may see a number of different hospitalists during the same hospital stay, which could nullify any gains in LOS that may be expected from better familiarity with hospital processes. Third, whereas a FP or an internist may only have a few inpatients under their care at any given time, each hospitalist typically cares for 17 to 22 patients every day. Increasing hospitalist workload has been shown to negatively impact LOS and may result in lower efficiency.39 Finally, many patients in our health system who require more time to recuperate or need complex discharge planning are usually transferred to the care of the hospitalist service from other services, or are preferentially admitted to hospitalists from the emergency department. As a result, hospitalists may look after a disproportionately higher number of long-stay patients. Despite all this, hospitalists in our population perform similarly to FPs, regardless of the clinical diagnoses of hospitalized patients.
Our study has a number of notable limitations. First, we used administrative data to conduct our evaluation and could only control for factors that are available in our data systems. As a result, some potential confounders may not have been taken into consideration. For example, our databases do not contain provider characteristics (eg, age, years of clinical experience) that have been deemed to be relevant by White and Glazier.26 Similarly, we did not have all the necessary information about the characteristics of the various MRP programs (eg, number of physicians involved in group practices, the schedule model of community FP call groups) and were not able to account for the potential impact of these on observed outcomes. Second, although our findings mirror prior studies from other parts of Canada, they may not be applicable to hospitalist programs in other jurisdictions or in health systems that are not regionalized or integrated. Third, our IM provider group is heterogeneous, with a number of different IM subspecialties (cardiologists, gastroenterologists, general internists) grouped under the IM category in our database. As a result, comparisons between the IM provider group and the other 2 provider groups, which are more homogenous, should be interpreted with caution.
Finally, we included only patients admitted to facilities in which a hospitalist service existed during the study period. As a result, a medium-size community hospital without a hospitalist service where patients are cared for exclusively by FPs and IM physicians was not included in the comparisons, and in 4 of the 10 facilities included, the number of FP patients was less than 10% of total hospitalized patients at the site (Appendix A). This may have resulted in an under-representation of FP patients.
Conclusion
Debates about the merits of the hospitalist model in Canada continue, and are in part fueled by a paucity of robust evidence about its impact on care outcomes compared to more traditional ways of providing inpatient care. In our evaluation, care provided by hospitalists is associated with lower mortality and readmission rates, despite similar LOS compared with FPs. Hospitalist care is also associated with lower mortality compared to IM providers. Hospitalists also demonstrated progressive improvement over time, with decreasing LOS and mortality rates and a stable readmission rate. Our results suggest that physicians with a focus on inpatient care can have positive contributions to quality and efficiency of care in Canada.
Corresponding author: Vandad Yousefi MD, CCFP, FHM, Fraser Health Authority, 400, 13450–102 Avenue, Surrey BC V3T 0H1, Canada.
Financial disclosures: None.
1. Kisuule F, Howell E. Hospital medicine beyond the United States. Int J Gen Med. 2018;11:65-71.
2. Yousefi V, Wilton D. Dedesigning hospital care: learning from the experience of hospital medicine in Canada. J Global Health Care Syst. 2011;1(3).
3. Soong C, Fan E, Howell E, et al. Characteristics of hospitalists and hospitalist programs in the United States and Canada. J Clin Outcomes Manag. 2009;16:69-76.
4. Yousefi V. How Canadian hospitalists spend their time - A work-sampling study within a hospital medicine program in Ontario. J Clin Outcomes Manag. 2011;18:159-166.
5. Wilson G. Are inpatients’ needs better served by hospitalists than by their family doctors? No. Can Fam Physician. 2008;54:1101-1103.
6. Samoil D. Are inpatients’ needs better served by hospitalists than by their family doctors: Yes? Can Fam Physician. 2008;54:1100-1101.
7. Nicolson B. Where’s Marcus Welby when you need him? BC Medical J. 2016;58:63-64.
8. Lemire F. Enhanced skills in family medicine: Update. Can Fam Physician. 2018;64:160.
9. Lerner J. Wanting family medicine without primary care. Can Fam Physician. 2018; 64:155.
10. Canadian Society of Hospital Medicine. Core Competencies in Hospital Medicine - Care of the Medical Inpatient. 2015.
11. Redelmeier DA. A Canadian perspective on the American hospitalist movement. Arch Intern Med. 1999;159:1665-1668.
12. Ghali WA, Greenberg PB, Mejia R, et al. International perspectives on general internal medicine and the case for “globalization” of a discipline. J Gen Intern Med. 2006;21:197-200.
13. Day A, MacMillan L. Neglect of the inpatient: The hospitalist movement in Canada responds. Hosp Q. 2001;4:36.
14. Sullivan P. Enter the hospitalist: New type of patient creating a new type of specialist. CMAJ. 2000;162:1345-1346.
15. Chan BTB. The declining comprehensiveness of primary care. CMAJ. 2002;166:429-434.
16. Abenhaim HA, Kahn SR, Raffoul J, Becker MR. Program description: A hospitalist-run, medical short-stay unit in a teaching hospital. CMAJ. 2000;163:1477-1480.
17. McGowan B, Nightingale M. The hospitalist program a new specialty on the horizon in acute care medicine a hospital case study. BC Med J. 2003;45:391-394.
18. Yousefi V, Chong C. Does implementation of a hospitalist program in a Canadian community hospital improve measures of quality of care and utilization? An observational comparative analysis of hospitalists vs. traditional care providers. BMC Health Serv Res. 2013;13:204.
19. White HL. Assessing the prevalence, penetration and performance of hospital physicians in Ontario: Implications for the quality and efficiency of inpatient care. ProQuest Dissertations Publishing; 2016.
20. Gutierrez CA, Norris M, Chail M. Impact of a newly established hospitalist training program on patient LOS and RIW. Poster presented at the 9th Annual Canadian Society of Hospital Medicine Conference, September 23-25, 2011; Banff, Alberta.
21. Seth P, Nicholson K, Habbous S, Menard J. Implementation of a hospitalist medicine model in a full-service community hospital: Examining impact two years post-implementation on health resource use andpatient satisfaction. Poster presented at the 13th Annual Canadian Society of Hospital Medicine Conference. 2015; Niagara Falls, Ontario.
22. Lewis S. A system in name only--access, variation, and reform in Canada’s provinces. N Engl J Med. 2015;372:497-500.
23. Lewis S, Kouri D. Regionalization: Making sense of the Canadian experience. Healthcare Papers. 2004;5:12-31.
24. Fraser Health Authority. About Fraser health. www.fraserhealth.ca/about-us/about-fraser-health#.XFJrl9JKiUk. Updated 2018. Accessed January 30, 2019.
25. Canadian Institute for Health Information. CMG+. https://www.cihi.ca/en/cmg. Accessed January 30, 2019.
26. White HL, Glazier RH. Do hospitalist physicians improve the quality of inpatient care delivery? A systematic review of process, efficiency and outcome measures. BMC Med. 2011;9:58.
27. Canadian Institute for Health Information. Hospital standardized mortality ratio technical notes. 2008. www.cihi.ca/sites/default/files/document/hsmr-tech-notes_en_0.pdf.
28. McAlister FA, Youngson E, Bakal JA, et al. Physician experience and outcomes among patients admitted to general internal medicine teaching wards. CMAJ. 2015;187:1041-1048.
29. Verma AA, Guo Y, Kwan JL, et al. Patient characteristics, resource use and outcomes associated with general internal medicine hospital care: The general medicine inpatient initiative (GEMINI) retrospective cohort study. CMAJ Open. 2017;5:E849.
30. Morche J, Mathes T, Pieper D. Relationship between surgeon volume and outcomes: A systematic review of systematic reviews. Syst Rev. 2016;5:204.
31. Halm EA, Lee C, Chassin MR. Is volume related to outcome in health care? A systematic review and methodologic critique of the literature. Ann Intern Med. 2002;137:511-520.
32. Chen CH, Chen YH, Lin HC, Lin HC. Association between physician caseload and patient outcome for sepsis treatment. Infect Control Hosp Epidemiol. 2009;30:556-562.
33. van Gestel YR, Lemmens VE, Lingsma HF, et al. The hospital standardized mortality ratio fallacy: A narrative review. Med Care. 2012;50:662-667.
34. Scott IA, Brand CA, Phelps GE, et al. Using hospital standardised mortality ratios to assess quality of care—proceed with extreme caution. Med J Aust. 2011; 194:645-648.
35. Wachter RM. Hospitalists in the United States -- mission accomplished or work in progress? N Engl J Med. 2004;350:1935-1936.
36. Peterson MC. A systematic review of outcomes and quality measures in adult patients cared for by hospitalists vs nonhospitalists. Mayo Clin Proc. 2009;84:248-254.
37. Chandra S, Wright SM, Howell EE. The creating incentives and continuity leading to efficiency staffing model: A quality improvement initiative in hospital medicine. Mayo Clin Proc. 2012;87:364-371.
38. Epstein K, Juarez E, Epstein A, et al. The impact of fragmentation of hospitalist care on length of stay. J Hosp Med. 2010;5:335-338.
39. Elliott DJ, Young RS, Brice J, et al. Effect of hospitalist workload on the quality and efficiency of care. JAMA Intern Med. 2014;174:786-793.
1. Kisuule F, Howell E. Hospital medicine beyond the United States. Int J Gen Med. 2018;11:65-71.
2. Yousefi V, Wilton D. Dedesigning hospital care: learning from the experience of hospital medicine in Canada. J Global Health Care Syst. 2011;1(3).
3. Soong C, Fan E, Howell E, et al. Characteristics of hospitalists and hospitalist programs in the United States and Canada. J Clin Outcomes Manag. 2009;16:69-76.
4. Yousefi V. How Canadian hospitalists spend their time - A work-sampling study within a hospital medicine program in Ontario. J Clin Outcomes Manag. 2011;18:159-166.
5. Wilson G. Are inpatients’ needs better served by hospitalists than by their family doctors? No. Can Fam Physician. 2008;54:1101-1103.
6. Samoil D. Are inpatients’ needs better served by hospitalists than by their family doctors: Yes? Can Fam Physician. 2008;54:1100-1101.
7. Nicolson B. Where’s Marcus Welby when you need him? BC Medical J. 2016;58:63-64.
8. Lemire F. Enhanced skills in family medicine: Update. Can Fam Physician. 2018;64:160.
9. Lerner J. Wanting family medicine without primary care. Can Fam Physician. 2018; 64:155.
10. Canadian Society of Hospital Medicine. Core Competencies in Hospital Medicine - Care of the Medical Inpatient. 2015.
11. Redelmeier DA. A Canadian perspective on the American hospitalist movement. Arch Intern Med. 1999;159:1665-1668.
12. Ghali WA, Greenberg PB, Mejia R, et al. International perspectives on general internal medicine and the case for “globalization” of a discipline. J Gen Intern Med. 2006;21:197-200.
13. Day A, MacMillan L. Neglect of the inpatient: The hospitalist movement in Canada responds. Hosp Q. 2001;4:36.
14. Sullivan P. Enter the hospitalist: New type of patient creating a new type of specialist. CMAJ. 2000;162:1345-1346.
15. Chan BTB. The declining comprehensiveness of primary care. CMAJ. 2002;166:429-434.
16. Abenhaim HA, Kahn SR, Raffoul J, Becker MR. Program description: A hospitalist-run, medical short-stay unit in a teaching hospital. CMAJ. 2000;163:1477-1480.
17. McGowan B, Nightingale M. The hospitalist program a new specialty on the horizon in acute care medicine a hospital case study. BC Med J. 2003;45:391-394.
18. Yousefi V, Chong C. Does implementation of a hospitalist program in a Canadian community hospital improve measures of quality of care and utilization? An observational comparative analysis of hospitalists vs. traditional care providers. BMC Health Serv Res. 2013;13:204.
19. White HL. Assessing the prevalence, penetration and performance of hospital physicians in Ontario: Implications for the quality and efficiency of inpatient care. ProQuest Dissertations Publishing; 2016.
20. Gutierrez CA, Norris M, Chail M. Impact of a newly established hospitalist training program on patient LOS and RIW. Poster presented at the 9th Annual Canadian Society of Hospital Medicine Conference, September 23-25, 2011; Banff, Alberta.
21. Seth P, Nicholson K, Habbous S, Menard J. Implementation of a hospitalist medicine model in a full-service community hospital: Examining impact two years post-implementation on health resource use andpatient satisfaction. Poster presented at the 13th Annual Canadian Society of Hospital Medicine Conference. 2015; Niagara Falls, Ontario.
22. Lewis S. A system in name only--access, variation, and reform in Canada’s provinces. N Engl J Med. 2015;372:497-500.
23. Lewis S, Kouri D. Regionalization: Making sense of the Canadian experience. Healthcare Papers. 2004;5:12-31.
24. Fraser Health Authority. About Fraser health. www.fraserhealth.ca/about-us/about-fraser-health#.XFJrl9JKiUk. Updated 2018. Accessed January 30, 2019.
25. Canadian Institute for Health Information. CMG+. https://www.cihi.ca/en/cmg. Accessed January 30, 2019.
26. White HL, Glazier RH. Do hospitalist physicians improve the quality of inpatient care delivery? A systematic review of process, efficiency and outcome measures. BMC Med. 2011;9:58.
27. Canadian Institute for Health Information. Hospital standardized mortality ratio technical notes. 2008. www.cihi.ca/sites/default/files/document/hsmr-tech-notes_en_0.pdf.
28. McAlister FA, Youngson E, Bakal JA, et al. Physician experience and outcomes among patients admitted to general internal medicine teaching wards. CMAJ. 2015;187:1041-1048.
29. Verma AA, Guo Y, Kwan JL, et al. Patient characteristics, resource use and outcomes associated with general internal medicine hospital care: The general medicine inpatient initiative (GEMINI) retrospective cohort study. CMAJ Open. 2017;5:E849.
30. Morche J, Mathes T, Pieper D. Relationship between surgeon volume and outcomes: A systematic review of systematic reviews. Syst Rev. 2016;5:204.
31. Halm EA, Lee C, Chassin MR. Is volume related to outcome in health care? A systematic review and methodologic critique of the literature. Ann Intern Med. 2002;137:511-520.
32. Chen CH, Chen YH, Lin HC, Lin HC. Association between physician caseload and patient outcome for sepsis treatment. Infect Control Hosp Epidemiol. 2009;30:556-562.
33. van Gestel YR, Lemmens VE, Lingsma HF, et al. The hospital standardized mortality ratio fallacy: A narrative review. Med Care. 2012;50:662-667.
34. Scott IA, Brand CA, Phelps GE, et al. Using hospital standardised mortality ratios to assess quality of care—proceed with extreme caution. Med J Aust. 2011; 194:645-648.
35. Wachter RM. Hospitalists in the United States -- mission accomplished or work in progress? N Engl J Med. 2004;350:1935-1936.
36. Peterson MC. A systematic review of outcomes and quality measures in adult patients cared for by hospitalists vs nonhospitalists. Mayo Clin Proc. 2009;84:248-254.
37. Chandra S, Wright SM, Howell EE. The creating incentives and continuity leading to efficiency staffing model: A quality improvement initiative in hospital medicine. Mayo Clin Proc. 2012;87:364-371.
38. Epstein K, Juarez E, Epstein A, et al. The impact of fragmentation of hospitalist care on length of stay. J Hosp Med. 2010;5:335-338.
39. Elliott DJ, Young RS, Brice J, et al. Effect of hospitalist workload on the quality and efficiency of care. JAMA Intern Med. 2014;174:786-793.
Geriatric Assessment and Collaborative Medication Review for Older Adults With Polypharmacy
Study Overview
Objective. To examine the effect of clinical geriatric assessments and collaborative medication review by geriatricians and family physicians on quality of life and other patient outcomes in home-dwelling older adults with polypharmacy.
Design. The study was a single-blind, cluster randomized clinical trial enrolling home-dwelling adults aged 70 years and older who were taking 7 or more medications. Family physicians in Norway were recruited to participate in the trial with their patients. Randomization was at the family physician level to avoid contamination between intervention and control groups.
Setting and participants. The study was conducted in Akershus and Oslo, Norway. Family physicians were recruited to participate in the trial with their patients. A total of 84 family physicians were recruited, of which 70 were included in the trial and randomized to intervention versus control; 14 were excluded because they had no eligible patients. The cluster size of each family physician was limited to 5 patients per physician to avoid large variation in cluster sizes. Patients were eligible for enrollment if they were home-dwelling, aged 70 years or older, and were taking 7 or more systemic medications regularly and had medications administered by the home nursing service. Patients were excluded if they were expected to die or be institutionalized within 6 months, or if they were discouraged from participation by their family physician. A total of 174 patients were recruited, with 87 patients in each group (34 family physicians were in the control group and 36 in the intervention group).
Intervention. The intervention included a geriatric assessment performed by a physician trained in geriatric medicine and supervised by a senior consultant. The geriatric assessment consisted of review of medical history; systematic screening for current problems; clinical examination; supplementary tests, if indicated; and review of each medication being used. The review of medication included the indication for each medication, dosage, adverse effects, and interactions. The geriatric assessment consultation took 1 hour to complete, on average. After the geriatric assessment, the family physician and the geriatrician met to discuss each medication and to establish a collaborative plan for adjustments and follow-up; this meeting was approximately 15 minutes in duration. Lastly, clinical follow-up with the older adult was conducted by the geriatrician or the family physician, as agreed upon in the plan, with most follow-up conducted by the family physician. Participants randomized to the control group received usual care without any intervention.
Main outcome measures. Outcomes were assessed at 16-week and 24-week follow-up. The main study outcome measure was health-related quality of life (HRQoL), as measured by the 15D instrument, at 16 weeks. The quality-of-life measure included the following aspects, each rated on an ordinal scale of 5 levels: mobility, vision, hearing, breathing, sleeping, eating, speech, elimination, usual activities, mental function, discomfort or symptoms, depression, distress, vitality, and sexual activity. The index scale including all aspects is in the range of 0 to 1, with a higher score indicating better quality of life. A predetermined change of 0.015 or more is considered clinically important, and a positive change of 0.035 indicates much better HRQoL. Other outcomes included: appropriateness of medications measured by the Medication Appropriateness Index and the Assessment of Underutilization; physical function (short Physical Performance battery); gait speed; grip strength; cognitive functioning; physical and cognitive disability (Functional Independence Measure); caregiver burden (Relative Stress Scale); physical measures, including orthostatic blood pressure, falls, and weight; hospital admissions; use of home nursing service; incidence of institutionalization; and mortality.
Main results. The study included 174 patients with an average age of 83.3 years (SD, 7.3); 67.8% were women. Of those who were randomized to the intervention and control groups, 158 (90.8%) completed the trial. The average number of regularly used medications was 10.1 (SD, 2.7) in the intervention group and 9.5 (SD, 2.6) in the control group. At week 16 of follow-up, patients in the intervention group had an improved HRQoL score measured by the 15D instrument; the difference between the intervention group and control groups was 0.045 (95% confidence interval [CI], 0.004 -0.086; P = 0.03). Medication appropriateness was better in the intervention group, as compared with the control group at both 16 weeks and 24 weeks. Nearly all (99%) patients in the intervention group experienced medication changes, which included withdrawal of medications, dosage adjustment, or new drug regimens. There was a trend towards a higher rate of hospitalization during follow-up in the intervention group (adjusted risk ratio, 2.03; 95% CI, 0.98-4.24; P = 0.06). Other secondary outcomes were not substantially different between the intervention and control groups.
Conclusion. The study demonstrated that a clinical geriatric assessment and collaborative medication review by geriatrician and family physician led to improved HRQoL and improved medication use.
Commentary
The use of multiple medications in older adults is common, with almost 20% of older adults over age 65 taking 10 or more medications.1 Polypharmacy in older adults is associated with lower adherence rates and increases the potential for interactions between medications.2 Age-related changes, such as changes in absorption, metabolism, and excretion, affect pharmacokinetics of medications and potentiate adverse drug reactions, requiring adjustments in use and dosing to optimize safety and outcomes. Recognizing the potential effects of medications in older adults, evidence-based guidelines, such as the Beers criteria3 and START/STOPP criteria,4 have been developed to identify potentially inappropriate medications in older adults and to improve prescribing. Randomized trials using the START/STOPP criteria have demonstrated improved medication appropriateness, reduced polypharmacy, and reduced adverse drug reactions.5 Although this study did not use a criteria-based approach for improving medication use, it demonstrated that in a population of older adults with polypharmacy, medication review with geriatricians can lead to improved HRQoL while improving medication appropriateness. The collaborative approach between the family physician and geriatrician, rather than a consultative approach with recommendations from a geriatrician, may have contributed to increased uptake of medication changes. Such an approach may be a reasonable strategy to improve medication use in older adults.
A limitation of the study is that the improvement in HRQoL could have been the result of medication changes, but could also have been due to other changes in the plan of care that resulted from the geriatric assessment. As noted by the authors, the increase in hospital admissions, though not statistically significant, could have resulted from the medication modifications; however, it was also noted that the geriatric assessments could have identified severe illnesses that required hospitalization, as the timeline from geriatric assessment to hospitalization suggested was the case. Thus, the increase in hospitalization resulting from timely identification of severe illness was more likely a benefit than an adverse effect; however, further studies should be done to elucidate this.
Applications for Clinical Practice
Older adults with multiple chronic conditions and complex medication regimens are at risk for poor health outcomes, and a purposeful medication review to improve medication use, leading to the removal of unnecessary and potentially harmful medications, adjustment of dosages, and initiation of appropriate medications, may yield health benefits, such as improved HRQoL. The present study utilized an approach that could be scalable, which is important given the limited number of clinicians with geriatrics expertise. For health systems with geriatrics clinical expertise, it may be reasonable to consider adopting a similar collaborative approach in order to improve care for older adults most at risk. Further reports on how patients and family physicians perceive this intervention will enhance our understanding of whether it could be implemented widely.
–William W. Hung, MD, MPH
1. Steinman MA, Hanlon JT. Managing medications in clinically complex elders: “There’s got to be a happy medium”. JAMA. 2010;304:1592-1601.
2. Vik SA, Maxwell CJ, Hogan DB. Measurement, correlates, and health outcomes of medication adherence among seniors. Ann Pharmacother. 2004;38:303-312.
3. American Geriatrics Society 2015 Updated Beers criteria for potentially inappropriate medication use in older Adults. J Am Geriatr Soc. 2015;63:2227-2246.
4. Hill-Taylor B, Sketris I, Hayden J, et al. Application of the STOPP/START criteria: a systematic review of the prevalence of potentially inappropriate prescribing in older adults, and evidence of clinical, humanistic and economic impact. J Clin Pharm Ther. 2013;38:360-372.
5. O’Mahony D. STOPP/START criteria for potentially inappropriate medications/ potential prescribing omissions in older people: origin and progress. Expert Rev Clin Pharmacol. 2020;13:15-22.
Study Overview
Objective. To examine the effect of clinical geriatric assessments and collaborative medication review by geriatricians and family physicians on quality of life and other patient outcomes in home-dwelling older adults with polypharmacy.
Design. The study was a single-blind, cluster randomized clinical trial enrolling home-dwelling adults aged 70 years and older who were taking 7 or more medications. Family physicians in Norway were recruited to participate in the trial with their patients. Randomization was at the family physician level to avoid contamination between intervention and control groups.
Setting and participants. The study was conducted in Akershus and Oslo, Norway. Family physicians were recruited to participate in the trial with their patients. A total of 84 family physicians were recruited, of which 70 were included in the trial and randomized to intervention versus control; 14 were excluded because they had no eligible patients. The cluster size of each family physician was limited to 5 patients per physician to avoid large variation in cluster sizes. Patients were eligible for enrollment if they were home-dwelling, aged 70 years or older, and were taking 7 or more systemic medications regularly and had medications administered by the home nursing service. Patients were excluded if they were expected to die or be institutionalized within 6 months, or if they were discouraged from participation by their family physician. A total of 174 patients were recruited, with 87 patients in each group (34 family physicians were in the control group and 36 in the intervention group).
Intervention. The intervention included a geriatric assessment performed by a physician trained in geriatric medicine and supervised by a senior consultant. The geriatric assessment consisted of review of medical history; systematic screening for current problems; clinical examination; supplementary tests, if indicated; and review of each medication being used. The review of medication included the indication for each medication, dosage, adverse effects, and interactions. The geriatric assessment consultation took 1 hour to complete, on average. After the geriatric assessment, the family physician and the geriatrician met to discuss each medication and to establish a collaborative plan for adjustments and follow-up; this meeting was approximately 15 minutes in duration. Lastly, clinical follow-up with the older adult was conducted by the geriatrician or the family physician, as agreed upon in the plan, with most follow-up conducted by the family physician. Participants randomized to the control group received usual care without any intervention.
Main outcome measures. Outcomes were assessed at 16-week and 24-week follow-up. The main study outcome measure was health-related quality of life (HRQoL), as measured by the 15D instrument, at 16 weeks. The quality-of-life measure included the following aspects, each rated on an ordinal scale of 5 levels: mobility, vision, hearing, breathing, sleeping, eating, speech, elimination, usual activities, mental function, discomfort or symptoms, depression, distress, vitality, and sexual activity. The index scale including all aspects is in the range of 0 to 1, with a higher score indicating better quality of life. A predetermined change of 0.015 or more is considered clinically important, and a positive change of 0.035 indicates much better HRQoL. Other outcomes included: appropriateness of medications measured by the Medication Appropriateness Index and the Assessment of Underutilization; physical function (short Physical Performance battery); gait speed; grip strength; cognitive functioning; physical and cognitive disability (Functional Independence Measure); caregiver burden (Relative Stress Scale); physical measures, including orthostatic blood pressure, falls, and weight; hospital admissions; use of home nursing service; incidence of institutionalization; and mortality.
Main results. The study included 174 patients with an average age of 83.3 years (SD, 7.3); 67.8% were women. Of those who were randomized to the intervention and control groups, 158 (90.8%) completed the trial. The average number of regularly used medications was 10.1 (SD, 2.7) in the intervention group and 9.5 (SD, 2.6) in the control group. At week 16 of follow-up, patients in the intervention group had an improved HRQoL score measured by the 15D instrument; the difference between the intervention group and control groups was 0.045 (95% confidence interval [CI], 0.004 -0.086; P = 0.03). Medication appropriateness was better in the intervention group, as compared with the control group at both 16 weeks and 24 weeks. Nearly all (99%) patients in the intervention group experienced medication changes, which included withdrawal of medications, dosage adjustment, or new drug regimens. There was a trend towards a higher rate of hospitalization during follow-up in the intervention group (adjusted risk ratio, 2.03; 95% CI, 0.98-4.24; P = 0.06). Other secondary outcomes were not substantially different between the intervention and control groups.
Conclusion. The study demonstrated that a clinical geriatric assessment and collaborative medication review by geriatrician and family physician led to improved HRQoL and improved medication use.
Commentary
The use of multiple medications in older adults is common, with almost 20% of older adults over age 65 taking 10 or more medications.1 Polypharmacy in older adults is associated with lower adherence rates and increases the potential for interactions between medications.2 Age-related changes, such as changes in absorption, metabolism, and excretion, affect pharmacokinetics of medications and potentiate adverse drug reactions, requiring adjustments in use and dosing to optimize safety and outcomes. Recognizing the potential effects of medications in older adults, evidence-based guidelines, such as the Beers criteria3 and START/STOPP criteria,4 have been developed to identify potentially inappropriate medications in older adults and to improve prescribing. Randomized trials using the START/STOPP criteria have demonstrated improved medication appropriateness, reduced polypharmacy, and reduced adverse drug reactions.5 Although this study did not use a criteria-based approach for improving medication use, it demonstrated that in a population of older adults with polypharmacy, medication review with geriatricians can lead to improved HRQoL while improving medication appropriateness. The collaborative approach between the family physician and geriatrician, rather than a consultative approach with recommendations from a geriatrician, may have contributed to increased uptake of medication changes. Such an approach may be a reasonable strategy to improve medication use in older adults.
A limitation of the study is that the improvement in HRQoL could have been the result of medication changes, but could also have been due to other changes in the plan of care that resulted from the geriatric assessment. As noted by the authors, the increase in hospital admissions, though not statistically significant, could have resulted from the medication modifications; however, it was also noted that the geriatric assessments could have identified severe illnesses that required hospitalization, as the timeline from geriatric assessment to hospitalization suggested was the case. Thus, the increase in hospitalization resulting from timely identification of severe illness was more likely a benefit than an adverse effect; however, further studies should be done to elucidate this.
Applications for Clinical Practice
Older adults with multiple chronic conditions and complex medication regimens are at risk for poor health outcomes, and a purposeful medication review to improve medication use, leading to the removal of unnecessary and potentially harmful medications, adjustment of dosages, and initiation of appropriate medications, may yield health benefits, such as improved HRQoL. The present study utilized an approach that could be scalable, which is important given the limited number of clinicians with geriatrics expertise. For health systems with geriatrics clinical expertise, it may be reasonable to consider adopting a similar collaborative approach in order to improve care for older adults most at risk. Further reports on how patients and family physicians perceive this intervention will enhance our understanding of whether it could be implemented widely.
–William W. Hung, MD, MPH
Study Overview
Objective. To examine the effect of clinical geriatric assessments and collaborative medication review by geriatricians and family physicians on quality of life and other patient outcomes in home-dwelling older adults with polypharmacy.
Design. The study was a single-blind, cluster randomized clinical trial enrolling home-dwelling adults aged 70 years and older who were taking 7 or more medications. Family physicians in Norway were recruited to participate in the trial with their patients. Randomization was at the family physician level to avoid contamination between intervention and control groups.
Setting and participants. The study was conducted in Akershus and Oslo, Norway. Family physicians were recruited to participate in the trial with their patients. A total of 84 family physicians were recruited, of which 70 were included in the trial and randomized to intervention versus control; 14 were excluded because they had no eligible patients. The cluster size of each family physician was limited to 5 patients per physician to avoid large variation in cluster sizes. Patients were eligible for enrollment if they were home-dwelling, aged 70 years or older, and were taking 7 or more systemic medications regularly and had medications administered by the home nursing service. Patients were excluded if they were expected to die or be institutionalized within 6 months, or if they were discouraged from participation by their family physician. A total of 174 patients were recruited, with 87 patients in each group (34 family physicians were in the control group and 36 in the intervention group).
Intervention. The intervention included a geriatric assessment performed by a physician trained in geriatric medicine and supervised by a senior consultant. The geriatric assessment consisted of review of medical history; systematic screening for current problems; clinical examination; supplementary tests, if indicated; and review of each medication being used. The review of medication included the indication for each medication, dosage, adverse effects, and interactions. The geriatric assessment consultation took 1 hour to complete, on average. After the geriatric assessment, the family physician and the geriatrician met to discuss each medication and to establish a collaborative plan for adjustments and follow-up; this meeting was approximately 15 minutes in duration. Lastly, clinical follow-up with the older adult was conducted by the geriatrician or the family physician, as agreed upon in the plan, with most follow-up conducted by the family physician. Participants randomized to the control group received usual care without any intervention.
Main outcome measures. Outcomes were assessed at 16-week and 24-week follow-up. The main study outcome measure was health-related quality of life (HRQoL), as measured by the 15D instrument, at 16 weeks. The quality-of-life measure included the following aspects, each rated on an ordinal scale of 5 levels: mobility, vision, hearing, breathing, sleeping, eating, speech, elimination, usual activities, mental function, discomfort or symptoms, depression, distress, vitality, and sexual activity. The index scale including all aspects is in the range of 0 to 1, with a higher score indicating better quality of life. A predetermined change of 0.015 or more is considered clinically important, and a positive change of 0.035 indicates much better HRQoL. Other outcomes included: appropriateness of medications measured by the Medication Appropriateness Index and the Assessment of Underutilization; physical function (short Physical Performance battery); gait speed; grip strength; cognitive functioning; physical and cognitive disability (Functional Independence Measure); caregiver burden (Relative Stress Scale); physical measures, including orthostatic blood pressure, falls, and weight; hospital admissions; use of home nursing service; incidence of institutionalization; and mortality.
Main results. The study included 174 patients with an average age of 83.3 years (SD, 7.3); 67.8% were women. Of those who were randomized to the intervention and control groups, 158 (90.8%) completed the trial. The average number of regularly used medications was 10.1 (SD, 2.7) in the intervention group and 9.5 (SD, 2.6) in the control group. At week 16 of follow-up, patients in the intervention group had an improved HRQoL score measured by the 15D instrument; the difference between the intervention group and control groups was 0.045 (95% confidence interval [CI], 0.004 -0.086; P = 0.03). Medication appropriateness was better in the intervention group, as compared with the control group at both 16 weeks and 24 weeks. Nearly all (99%) patients in the intervention group experienced medication changes, which included withdrawal of medications, dosage adjustment, or new drug regimens. There was a trend towards a higher rate of hospitalization during follow-up in the intervention group (adjusted risk ratio, 2.03; 95% CI, 0.98-4.24; P = 0.06). Other secondary outcomes were not substantially different between the intervention and control groups.
Conclusion. The study demonstrated that a clinical geriatric assessment and collaborative medication review by geriatrician and family physician led to improved HRQoL and improved medication use.
Commentary
The use of multiple medications in older adults is common, with almost 20% of older adults over age 65 taking 10 or more medications.1 Polypharmacy in older adults is associated with lower adherence rates and increases the potential for interactions between medications.2 Age-related changes, such as changes in absorption, metabolism, and excretion, affect pharmacokinetics of medications and potentiate adverse drug reactions, requiring adjustments in use and dosing to optimize safety and outcomes. Recognizing the potential effects of medications in older adults, evidence-based guidelines, such as the Beers criteria3 and START/STOPP criteria,4 have been developed to identify potentially inappropriate medications in older adults and to improve prescribing. Randomized trials using the START/STOPP criteria have demonstrated improved medication appropriateness, reduced polypharmacy, and reduced adverse drug reactions.5 Although this study did not use a criteria-based approach for improving medication use, it demonstrated that in a population of older adults with polypharmacy, medication review with geriatricians can lead to improved HRQoL while improving medication appropriateness. The collaborative approach between the family physician and geriatrician, rather than a consultative approach with recommendations from a geriatrician, may have contributed to increased uptake of medication changes. Such an approach may be a reasonable strategy to improve medication use in older adults.
A limitation of the study is that the improvement in HRQoL could have been the result of medication changes, but could also have been due to other changes in the plan of care that resulted from the geriatric assessment. As noted by the authors, the increase in hospital admissions, though not statistically significant, could have resulted from the medication modifications; however, it was also noted that the geriatric assessments could have identified severe illnesses that required hospitalization, as the timeline from geriatric assessment to hospitalization suggested was the case. Thus, the increase in hospitalization resulting from timely identification of severe illness was more likely a benefit than an adverse effect; however, further studies should be done to elucidate this.
Applications for Clinical Practice
Older adults with multiple chronic conditions and complex medication regimens are at risk for poor health outcomes, and a purposeful medication review to improve medication use, leading to the removal of unnecessary and potentially harmful medications, adjustment of dosages, and initiation of appropriate medications, may yield health benefits, such as improved HRQoL. The present study utilized an approach that could be scalable, which is important given the limited number of clinicians with geriatrics expertise. For health systems with geriatrics clinical expertise, it may be reasonable to consider adopting a similar collaborative approach in order to improve care for older adults most at risk. Further reports on how patients and family physicians perceive this intervention will enhance our understanding of whether it could be implemented widely.
–William W. Hung, MD, MPH
1. Steinman MA, Hanlon JT. Managing medications in clinically complex elders: “There’s got to be a happy medium”. JAMA. 2010;304:1592-1601.
2. Vik SA, Maxwell CJ, Hogan DB. Measurement, correlates, and health outcomes of medication adherence among seniors. Ann Pharmacother. 2004;38:303-312.
3. American Geriatrics Society 2015 Updated Beers criteria for potentially inappropriate medication use in older Adults. J Am Geriatr Soc. 2015;63:2227-2246.
4. Hill-Taylor B, Sketris I, Hayden J, et al. Application of the STOPP/START criteria: a systematic review of the prevalence of potentially inappropriate prescribing in older adults, and evidence of clinical, humanistic and economic impact. J Clin Pharm Ther. 2013;38:360-372.
5. O’Mahony D. STOPP/START criteria for potentially inappropriate medications/ potential prescribing omissions in older people: origin and progress. Expert Rev Clin Pharmacol. 2020;13:15-22.
1. Steinman MA, Hanlon JT. Managing medications in clinically complex elders: “There’s got to be a happy medium”. JAMA. 2010;304:1592-1601.
2. Vik SA, Maxwell CJ, Hogan DB. Measurement, correlates, and health outcomes of medication adherence among seniors. Ann Pharmacother. 2004;38:303-312.
3. American Geriatrics Society 2015 Updated Beers criteria for potentially inappropriate medication use in older Adults. J Am Geriatr Soc. 2015;63:2227-2246.
4. Hill-Taylor B, Sketris I, Hayden J, et al. Application of the STOPP/START criteria: a systematic review of the prevalence of potentially inappropriate prescribing in older adults, and evidence of clinical, humanistic and economic impact. J Clin Pharm Ther. 2013;38:360-372.
5. O’Mahony D. STOPP/START criteria for potentially inappropriate medications/ potential prescribing omissions in older people: origin and progress. Expert Rev Clin Pharmacol. 2020;13:15-22.
Pembrolizumab Plus Neoadjuvant Chemotherapy Improves Pathologic Complete Response Rates in Triple-Negative Breast Cancer
Study Overview
Objective. To evaluate the efficacy and safety of pembrolizumab in combination with neoadjuvant chemotherapy followed by adjuvant pembrolizumab in early-stage triple-negative breast cancer.
Design. International, multicenter, randomized, double-blind, phase 3 trial.
Intervention. Patients were randomly assigned in a 2:1 fashion to receive either pembrolizumab or placebo. Patients received 4 cycles of neoadjuvant pembrolizumab or placebo once every 3 weeks, in addition to weekly paclitaxel 80 mg/m2 plus carboplatin AUC5 once every 3 weeks. This was followed by 4 cycles of pembrolizumab or placebo plus doxorubicin 60 mg/m2 or epirubicin 90 mg/m2 plus cyclophosphamide 600 mg/m2 once every 3 weeks. Patients then underwent definitive surgery 3 to 6 weeks after completion of neoadjuvant therapy. In the adjuvant setting, patients received pembrolizumab or placebo once every 3 weeks for up to 9 cycles. Adjuvant capecitabine was not allowed.
Setting and participants. A total of 1174 patients underwent randomization: 784 patients in the pembrolizumab/chemotherapy group and 390 patients in the placebo/chemotherapy group. Eligible patients had newly diagnosed, centrally confirmed triple-negative breast cancer (nonmetastatic: T1c, N1-2 or T2-4, N0-2). Patients were eligible regardless of PD-L1 status, and those with inflammatory breast cancer and multifocal primaries were eligible.
Main outcome measures. The primary endpoints of this study were pathologic complete response (pCR) rate (defined as ypT0/ypTis, ypN0) at the time of surgery and event-free survival (EFS) in the intention-to-treat population. Secondary endpoints included pCR in all patients, pCR among patients with PD-L1–positive tumors, EFS among patients with PD-L1–positive tumors, and overall survival among all patients and those with PD-L1–positive tumors. PD-L1 expression was assessed using the PD-L1 IHC 22C3 pharmDx assay (Agilent, Santa Clara, CA). Expression was characterized according to the combined positive score, with a score of 1% or greater being considered positive.
Results. The baseline characteristics were well balanced between the treatment arms. At the time of the second interim analysis, the median duration of follow-up was 15.5 months. The pCR rate among the first 602 patients who were randomized was 64.8% in the pembrolizumab/chemotherapy group and 51.2% in the placebo group (P < 0.001; 95% confidence interval, 5.4-21.8). The pCR rate in the PD-L1–positive population was 68.9% in the pembrolizumab/chemotherapy group, as compared to 54.9% in the placebo group. In the PD-L1–negative population, the pCR rate was 45.3% in the pembrolizumab/chemotherapy group, as compared to 30.3% in the placebo group. At the time of analysis, 104 events had occurred, and the estimated percentage of patients at 18 months who were alive without disease progression was 91% in the pembrolizumab group and 85% in the placebo group. The median was not reached in either group.
Grade 3 or higher adverse events in the neoadjuvant phase were seen in 76.8% and 72.2% of patients in the pembrolizumab and placebo arms, respectively. Serious treatment-related adverse events occurred in 32% of patients in the pembrolizumab group compared to 19% in the placebo group. Febrile neutropenia and anemia were the most common. Discontinuation of the trial drug due to adverse events occurred in 23% of patients in the pembrolizumab arm and in 12% in the placebo arm. The majority of treatment-related adverse events occurred in the neoadjuvant phase. In the adjuvant phase, treatment-related adverse events occurred in 48% and 43% of patients in the pembrolizumab and placebo groups, respectively.
Conclusion. The combination of neoadjuvant chemotherapy and pembrolizumab in patients with newly diagnosed, early-stage, triple-negative breast cancer yielded a higher percentage of patients achieving a pCR as compared with chemotherapy plus placebo.
Commentary
The current study adds to the growing body of literature outlining the efficacy of immune checkpoint inhibition in triple-negative breast cancer. The previously published IMpassion130 trial showed that the addition of the PD-L1 antibody atezolizumab to nab-paclitaxel improved progression-free survival in patients with PD-L1–positive (1% or greater), metastatic triple-negative breast cancer.1 Similarly, in the phase 2 I-SPY2 trial, the addition of pembrolizumab to standard neoadjuvant chemotherapy led to a near tripling of the pCR rates in triple-negative breast cancer.2 While the current study demonstrated improved pCR rates with pembrolizumab, no difference in EFS has yet been demonstrated; however, longer-term follow-up will be required. There certainly are numerous studies documenting an association between pCR and improved disease-free survival and possibly overall survival. Cortazar and colleagues performed a pooled analysis of 12 international trials, which demonstrated an association between pCR and improved EFS (hazard ratio [HR], 0.24) and overall survival (HR, 0.16) in patients with triple-negative breast cancer.3 The results of the current study will require longer-term follow-up to confirm such an association.
The current study appears to have demonstrated a benefit with the addition of pembrolizumab across treatment subgroups, particularly in the PD-L1–positive and PD-L1–negative populations. While this differs from the findings of the IMpassion130 trial, it is quite difficult to draw definitive conclusions because the 2 trials studied different antibodies, and thus used a different assay to define PD-L1 positivity. Notable differences exist in determination of PD-L1 status across assays, and it is important for providers to use the appropriate assay for each antibody. These differences highlight the need for more informative biomarkers to predict a benefit from immune checkpoint inhibition.
It is also noteworthy that the control arm in the current trial was a platinum-based regimen. Platinum-based neoadjuvant regimens previously have been shown to induce higher pCR rates in triple-negative breast cancer; however, the incorporation of carboplatin as standard of care remains a topic of debate.4 Nevertheless, a similar trial evaluating the efficacy of atezolizumab combined with platinum-based neoadjuvant chemotherapy in triple-negative breast cancer, NSABP B-59 (NCT03281954), is underway, with the control arm also incorporating carboplatin. The results of this study will also help validate the role of checkpoint inhibitors in the neoadjuvant setting in triple-negative breast cancer. Of note, this trial did not allow for the use of adjuvant capecitabine, which has been previously shown in the CREATE-X trial to prolong survival in this population.5 How the use of adjuvant capecitabine would impact these results is completely unknown.6 The incidence of grade 3 or higher toxicities in the current trial appeared to be similar in both groups. There did appear to be a higher incidence of infusion reactions and skin reactions in the pembrolizumab groups. Immune-related adverse events were consistent with prior pembrolizumab data.
Applications for Clinical Practice
KEYNOTE-522 adds to the growing evidence suggesting that incorporation of immune checkpoint inhibitors into neoadjuvant therapy in patients with triple-negative breast cancer can improve pCR rates; however, its use as a standard of care will require longer-term follow-up to ensure the noted findings translate into improvement in EFS and, ultimately, overall survival.
– Daniel Isaac, DO, MS
1. Schmid P, Adams S, Rugo HS, et al. Atezolizumab and nab-paclitaxel in advanced triple-negative breast cancer. N Engl J Med. 2018;379:2108-2121.
2. Nanda R, Liu MC, Yau C, et al. Pembrolizumab plus standard neoadjuvant therapy for high-risk breast cancer (BC): results from I-SPY 2. J Clin Oncol. 2017;35: Suppl:506. Abstract 506.
3. Cortazar P, Zhang L, Untch M, et al. Pathological complete response and long-term clinical benefit in breast cancer: the CTNeoBC pooled analysis. Lancet. 2014;384:164-172.
4. Sikov WM, Berry DA, Perou CM, et al. Impact of the addition of carboplatin and/or bevacizumab to neoadjuvant one-per-week paclitaxel followed by dose-dense doxorubicin and cyclophosphamide on pathologic complete response in stage II to III triple-negative breast cancer: CALGB 40603 (Alliance). J Clin Oncol. 2015;33:13-21.
5. Masuda N, Lee S-J, Ohtani S, et al. Adjuvant capecitabine for breast cancer after preoperative chemotherapy. N Engl J Med. 2017;376:2147-2159.
6. von Minckwitz G, Schneeweiss A, Loibl S, et al. Neoadjuvant carboplatin in patients with triple-negative and HER2-positive early breast cancer (GeparSixto; GBG 66): a randomised phase 2 trial. Lancet Oncol. 2014;15:747-756.
Study Overview
Objective. To evaluate the efficacy and safety of pembrolizumab in combination with neoadjuvant chemotherapy followed by adjuvant pembrolizumab in early-stage triple-negative breast cancer.
Design. International, multicenter, randomized, double-blind, phase 3 trial.
Intervention. Patients were randomly assigned in a 2:1 fashion to receive either pembrolizumab or placebo. Patients received 4 cycles of neoadjuvant pembrolizumab or placebo once every 3 weeks, in addition to weekly paclitaxel 80 mg/m2 plus carboplatin AUC5 once every 3 weeks. This was followed by 4 cycles of pembrolizumab or placebo plus doxorubicin 60 mg/m2 or epirubicin 90 mg/m2 plus cyclophosphamide 600 mg/m2 once every 3 weeks. Patients then underwent definitive surgery 3 to 6 weeks after completion of neoadjuvant therapy. In the adjuvant setting, patients received pembrolizumab or placebo once every 3 weeks for up to 9 cycles. Adjuvant capecitabine was not allowed.
Setting and participants. A total of 1174 patients underwent randomization: 784 patients in the pembrolizumab/chemotherapy group and 390 patients in the placebo/chemotherapy group. Eligible patients had newly diagnosed, centrally confirmed triple-negative breast cancer (nonmetastatic: T1c, N1-2 or T2-4, N0-2). Patients were eligible regardless of PD-L1 status, and those with inflammatory breast cancer and multifocal primaries were eligible.
Main outcome measures. The primary endpoints of this study were pathologic complete response (pCR) rate (defined as ypT0/ypTis, ypN0) at the time of surgery and event-free survival (EFS) in the intention-to-treat population. Secondary endpoints included pCR in all patients, pCR among patients with PD-L1–positive tumors, EFS among patients with PD-L1–positive tumors, and overall survival among all patients and those with PD-L1–positive tumors. PD-L1 expression was assessed using the PD-L1 IHC 22C3 pharmDx assay (Agilent, Santa Clara, CA). Expression was characterized according to the combined positive score, with a score of 1% or greater being considered positive.
Results. The baseline characteristics were well balanced between the treatment arms. At the time of the second interim analysis, the median duration of follow-up was 15.5 months. The pCR rate among the first 602 patients who were randomized was 64.8% in the pembrolizumab/chemotherapy group and 51.2% in the placebo group (P < 0.001; 95% confidence interval, 5.4-21.8). The pCR rate in the PD-L1–positive population was 68.9% in the pembrolizumab/chemotherapy group, as compared to 54.9% in the placebo group. In the PD-L1–negative population, the pCR rate was 45.3% in the pembrolizumab/chemotherapy group, as compared to 30.3% in the placebo group. At the time of analysis, 104 events had occurred, and the estimated percentage of patients at 18 months who were alive without disease progression was 91% in the pembrolizumab group and 85% in the placebo group. The median was not reached in either group.
Grade 3 or higher adverse events in the neoadjuvant phase were seen in 76.8% and 72.2% of patients in the pembrolizumab and placebo arms, respectively. Serious treatment-related adverse events occurred in 32% of patients in the pembrolizumab group compared to 19% in the placebo group. Febrile neutropenia and anemia were the most common. Discontinuation of the trial drug due to adverse events occurred in 23% of patients in the pembrolizumab arm and in 12% in the placebo arm. The majority of treatment-related adverse events occurred in the neoadjuvant phase. In the adjuvant phase, treatment-related adverse events occurred in 48% and 43% of patients in the pembrolizumab and placebo groups, respectively.
Conclusion. The combination of neoadjuvant chemotherapy and pembrolizumab in patients with newly diagnosed, early-stage, triple-negative breast cancer yielded a higher percentage of patients achieving a pCR as compared with chemotherapy plus placebo.
Commentary
The current study adds to the growing body of literature outlining the efficacy of immune checkpoint inhibition in triple-negative breast cancer. The previously published IMpassion130 trial showed that the addition of the PD-L1 antibody atezolizumab to nab-paclitaxel improved progression-free survival in patients with PD-L1–positive (1% or greater), metastatic triple-negative breast cancer.1 Similarly, in the phase 2 I-SPY2 trial, the addition of pembrolizumab to standard neoadjuvant chemotherapy led to a near tripling of the pCR rates in triple-negative breast cancer.2 While the current study demonstrated improved pCR rates with pembrolizumab, no difference in EFS has yet been demonstrated; however, longer-term follow-up will be required. There certainly are numerous studies documenting an association between pCR and improved disease-free survival and possibly overall survival. Cortazar and colleagues performed a pooled analysis of 12 international trials, which demonstrated an association between pCR and improved EFS (hazard ratio [HR], 0.24) and overall survival (HR, 0.16) in patients with triple-negative breast cancer.3 The results of the current study will require longer-term follow-up to confirm such an association.
The current study appears to have demonstrated a benefit with the addition of pembrolizumab across treatment subgroups, particularly in the PD-L1–positive and PD-L1–negative populations. While this differs from the findings of the IMpassion130 trial, it is quite difficult to draw definitive conclusions because the 2 trials studied different antibodies, and thus used a different assay to define PD-L1 positivity. Notable differences exist in determination of PD-L1 status across assays, and it is important for providers to use the appropriate assay for each antibody. These differences highlight the need for more informative biomarkers to predict a benefit from immune checkpoint inhibition.
It is also noteworthy that the control arm in the current trial was a platinum-based regimen. Platinum-based neoadjuvant regimens previously have been shown to induce higher pCR rates in triple-negative breast cancer; however, the incorporation of carboplatin as standard of care remains a topic of debate.4 Nevertheless, a similar trial evaluating the efficacy of atezolizumab combined with platinum-based neoadjuvant chemotherapy in triple-negative breast cancer, NSABP B-59 (NCT03281954), is underway, with the control arm also incorporating carboplatin. The results of this study will also help validate the role of checkpoint inhibitors in the neoadjuvant setting in triple-negative breast cancer. Of note, this trial did not allow for the use of adjuvant capecitabine, which has been previously shown in the CREATE-X trial to prolong survival in this population.5 How the use of adjuvant capecitabine would impact these results is completely unknown.6 The incidence of grade 3 or higher toxicities in the current trial appeared to be similar in both groups. There did appear to be a higher incidence of infusion reactions and skin reactions in the pembrolizumab groups. Immune-related adverse events were consistent with prior pembrolizumab data.
Applications for Clinical Practice
KEYNOTE-522 adds to the growing evidence suggesting that incorporation of immune checkpoint inhibitors into neoadjuvant therapy in patients with triple-negative breast cancer can improve pCR rates; however, its use as a standard of care will require longer-term follow-up to ensure the noted findings translate into improvement in EFS and, ultimately, overall survival.
– Daniel Isaac, DO, MS
Study Overview
Objective. To evaluate the efficacy and safety of pembrolizumab in combination with neoadjuvant chemotherapy followed by adjuvant pembrolizumab in early-stage triple-negative breast cancer.
Design. International, multicenter, randomized, double-blind, phase 3 trial.
Intervention. Patients were randomly assigned in a 2:1 fashion to receive either pembrolizumab or placebo. Patients received 4 cycles of neoadjuvant pembrolizumab or placebo once every 3 weeks, in addition to weekly paclitaxel 80 mg/m2 plus carboplatin AUC5 once every 3 weeks. This was followed by 4 cycles of pembrolizumab or placebo plus doxorubicin 60 mg/m2 or epirubicin 90 mg/m2 plus cyclophosphamide 600 mg/m2 once every 3 weeks. Patients then underwent definitive surgery 3 to 6 weeks after completion of neoadjuvant therapy. In the adjuvant setting, patients received pembrolizumab or placebo once every 3 weeks for up to 9 cycles. Adjuvant capecitabine was not allowed.
Setting and participants. A total of 1174 patients underwent randomization: 784 patients in the pembrolizumab/chemotherapy group and 390 patients in the placebo/chemotherapy group. Eligible patients had newly diagnosed, centrally confirmed triple-negative breast cancer (nonmetastatic: T1c, N1-2 or T2-4, N0-2). Patients were eligible regardless of PD-L1 status, and those with inflammatory breast cancer and multifocal primaries were eligible.
Main outcome measures. The primary endpoints of this study were pathologic complete response (pCR) rate (defined as ypT0/ypTis, ypN0) at the time of surgery and event-free survival (EFS) in the intention-to-treat population. Secondary endpoints included pCR in all patients, pCR among patients with PD-L1–positive tumors, EFS among patients with PD-L1–positive tumors, and overall survival among all patients and those with PD-L1–positive tumors. PD-L1 expression was assessed using the PD-L1 IHC 22C3 pharmDx assay (Agilent, Santa Clara, CA). Expression was characterized according to the combined positive score, with a score of 1% or greater being considered positive.
Results. The baseline characteristics were well balanced between the treatment arms. At the time of the second interim analysis, the median duration of follow-up was 15.5 months. The pCR rate among the first 602 patients who were randomized was 64.8% in the pembrolizumab/chemotherapy group and 51.2% in the placebo group (P < 0.001; 95% confidence interval, 5.4-21.8). The pCR rate in the PD-L1–positive population was 68.9% in the pembrolizumab/chemotherapy group, as compared to 54.9% in the placebo group. In the PD-L1–negative population, the pCR rate was 45.3% in the pembrolizumab/chemotherapy group, as compared to 30.3% in the placebo group. At the time of analysis, 104 events had occurred, and the estimated percentage of patients at 18 months who were alive without disease progression was 91% in the pembrolizumab group and 85% in the placebo group. The median was not reached in either group.
Grade 3 or higher adverse events in the neoadjuvant phase were seen in 76.8% and 72.2% of patients in the pembrolizumab and placebo arms, respectively. Serious treatment-related adverse events occurred in 32% of patients in the pembrolizumab group compared to 19% in the placebo group. Febrile neutropenia and anemia were the most common. Discontinuation of the trial drug due to adverse events occurred in 23% of patients in the pembrolizumab arm and in 12% in the placebo arm. The majority of treatment-related adverse events occurred in the neoadjuvant phase. In the adjuvant phase, treatment-related adverse events occurred in 48% and 43% of patients in the pembrolizumab and placebo groups, respectively.
Conclusion. The combination of neoadjuvant chemotherapy and pembrolizumab in patients with newly diagnosed, early-stage, triple-negative breast cancer yielded a higher percentage of patients achieving a pCR as compared with chemotherapy plus placebo.
Commentary
The current study adds to the growing body of literature outlining the efficacy of immune checkpoint inhibition in triple-negative breast cancer. The previously published IMpassion130 trial showed that the addition of the PD-L1 antibody atezolizumab to nab-paclitaxel improved progression-free survival in patients with PD-L1–positive (1% or greater), metastatic triple-negative breast cancer.1 Similarly, in the phase 2 I-SPY2 trial, the addition of pembrolizumab to standard neoadjuvant chemotherapy led to a near tripling of the pCR rates in triple-negative breast cancer.2 While the current study demonstrated improved pCR rates with pembrolizumab, no difference in EFS has yet been demonstrated; however, longer-term follow-up will be required. There certainly are numerous studies documenting an association between pCR and improved disease-free survival and possibly overall survival. Cortazar and colleagues performed a pooled analysis of 12 international trials, which demonstrated an association between pCR and improved EFS (hazard ratio [HR], 0.24) and overall survival (HR, 0.16) in patients with triple-negative breast cancer.3 The results of the current study will require longer-term follow-up to confirm such an association.
The current study appears to have demonstrated a benefit with the addition of pembrolizumab across treatment subgroups, particularly in the PD-L1–positive and PD-L1–negative populations. While this differs from the findings of the IMpassion130 trial, it is quite difficult to draw definitive conclusions because the 2 trials studied different antibodies, and thus used a different assay to define PD-L1 positivity. Notable differences exist in determination of PD-L1 status across assays, and it is important for providers to use the appropriate assay for each antibody. These differences highlight the need for more informative biomarkers to predict a benefit from immune checkpoint inhibition.
It is also noteworthy that the control arm in the current trial was a platinum-based regimen. Platinum-based neoadjuvant regimens previously have been shown to induce higher pCR rates in triple-negative breast cancer; however, the incorporation of carboplatin as standard of care remains a topic of debate.4 Nevertheless, a similar trial evaluating the efficacy of atezolizumab combined with platinum-based neoadjuvant chemotherapy in triple-negative breast cancer, NSABP B-59 (NCT03281954), is underway, with the control arm also incorporating carboplatin. The results of this study will also help validate the role of checkpoint inhibitors in the neoadjuvant setting in triple-negative breast cancer. Of note, this trial did not allow for the use of adjuvant capecitabine, which has been previously shown in the CREATE-X trial to prolong survival in this population.5 How the use of adjuvant capecitabine would impact these results is completely unknown.6 The incidence of grade 3 or higher toxicities in the current trial appeared to be similar in both groups. There did appear to be a higher incidence of infusion reactions and skin reactions in the pembrolizumab groups. Immune-related adverse events were consistent with prior pembrolizumab data.
Applications for Clinical Practice
KEYNOTE-522 adds to the growing evidence suggesting that incorporation of immune checkpoint inhibitors into neoadjuvant therapy in patients with triple-negative breast cancer can improve pCR rates; however, its use as a standard of care will require longer-term follow-up to ensure the noted findings translate into improvement in EFS and, ultimately, overall survival.
– Daniel Isaac, DO, MS
1. Schmid P, Adams S, Rugo HS, et al. Atezolizumab and nab-paclitaxel in advanced triple-negative breast cancer. N Engl J Med. 2018;379:2108-2121.
2. Nanda R, Liu MC, Yau C, et al. Pembrolizumab plus standard neoadjuvant therapy for high-risk breast cancer (BC): results from I-SPY 2. J Clin Oncol. 2017;35: Suppl:506. Abstract 506.
3. Cortazar P, Zhang L, Untch M, et al. Pathological complete response and long-term clinical benefit in breast cancer: the CTNeoBC pooled analysis. Lancet. 2014;384:164-172.
4. Sikov WM, Berry DA, Perou CM, et al. Impact of the addition of carboplatin and/or bevacizumab to neoadjuvant one-per-week paclitaxel followed by dose-dense doxorubicin and cyclophosphamide on pathologic complete response in stage II to III triple-negative breast cancer: CALGB 40603 (Alliance). J Clin Oncol. 2015;33:13-21.
5. Masuda N, Lee S-J, Ohtani S, et al. Adjuvant capecitabine for breast cancer after preoperative chemotherapy. N Engl J Med. 2017;376:2147-2159.
6. von Minckwitz G, Schneeweiss A, Loibl S, et al. Neoadjuvant carboplatin in patients with triple-negative and HER2-positive early breast cancer (GeparSixto; GBG 66): a randomised phase 2 trial. Lancet Oncol. 2014;15:747-756.
1. Schmid P, Adams S, Rugo HS, et al. Atezolizumab and nab-paclitaxel in advanced triple-negative breast cancer. N Engl J Med. 2018;379:2108-2121.
2. Nanda R, Liu MC, Yau C, et al. Pembrolizumab plus standard neoadjuvant therapy for high-risk breast cancer (BC): results from I-SPY 2. J Clin Oncol. 2017;35: Suppl:506. Abstract 506.
3. Cortazar P, Zhang L, Untch M, et al. Pathological complete response and long-term clinical benefit in breast cancer: the CTNeoBC pooled analysis. Lancet. 2014;384:164-172.
4. Sikov WM, Berry DA, Perou CM, et al. Impact of the addition of carboplatin and/or bevacizumab to neoadjuvant one-per-week paclitaxel followed by dose-dense doxorubicin and cyclophosphamide on pathologic complete response in stage II to III triple-negative breast cancer: CALGB 40603 (Alliance). J Clin Oncol. 2015;33:13-21.
5. Masuda N, Lee S-J, Ohtani S, et al. Adjuvant capecitabine for breast cancer after preoperative chemotherapy. N Engl J Med. 2017;376:2147-2159.
6. von Minckwitz G, Schneeweiss A, Loibl S, et al. Neoadjuvant carboplatin in patients with triple-negative and HER2-positive early breast cancer (GeparSixto; GBG 66): a randomised phase 2 trial. Lancet Oncol. 2014;15:747-756.
Renal denervation shown safe and effective in pivotal trial
Catheter-based renal denervation took a step closer to attaining legitimacy as a nonpharmacologic treatment for hypertension with presentation of the primary results of the SPYRAL HTN-OFF MED pivotal trial at the joint scientific sessions of the American College of Cardiology and the World Heart Federation. The meeting was conducted online after its cancellation because of the COVID-19 pandemic.

“We saw clinically meaningful blood pressure reductions at 3 months,” reported Michael Boehm, MD, chief of cardiology at Saarland University Hospital in Homburg, Germany.
That’s encouraging news, as renal denervation (RDN) was nearly abandoned as a potential treatment for hypertension in the wake of the unexpectedly negative results of the SYMPLICITY HTN-3 trial (N Engl J Med. 2014;370:1393-401). However, post hoc analysis of the trial revealed significant shortcomings in design and execution, and a more rigorous development program for the percutaneous device-based therapy is well underway.
The SPYRAL HTN-OFF MED pivotal trial was designed under Food and Drug Administration guidance to show whether RDN reduces blood pressure in patients with untreated hypertension. The prospective study included 331 off-medication patients in nine countries who were randomized to RDN or a sham procedure, then followed in double-blind fashion for 3 months.
The primary outcome was change in 24-hour ambulatory systolic blood pressure from baseline to 3 months. From a mean baseline 24-hour ambulatory blood pressure of 151.4/98 mm Hg, patients in the RDN group averaged a 4.7 mm Hg decrease in 24-hour SBP, which was 4 mm Hg more than in sham-treated controls. Statistically, this translated to a greater than 99.9% probability that RDN was superior to sham therapy. The RDN group also experienced a mean 3.7–mm Hg reduction in 24-hour DBP, compared with a 0.8–mm Hg decrease in controls.
Office SBP – the secondary endpoint – decreased by a mean of 9.2 mm Hg with RDN, compared with 2.5 mm Hg in controls.

These results probably understate the true antihypertensive effect of RDN for two reasons, Dr. Boehm noted. For one, previous studies have shown that the magnitude of blood pressure lowering continues to increase for up to 1-2 years following the procedure, whereas the off-medication assessment in SPYRAL HTN-OFF MED ended at 3 months for ethical and safety reasons. Also, 17% of patients in the control arm were withdrawn from the study and placed on antihypertensive medication because their office SBP reached 180 mm Hg or more, as compared to 9.6% of the RDN group.
A key finding was that RDN lowered blood pressure around the clock, including nighttime and early morning, the hours of greatest cardiovascular risk and a time when some antihypertensive medications are less effective at blood pressure control, the cardiologist observed.
The RDN safety picture was reassuring, with no strokes, myocardial infarctions, major bleeding, or acute deterioration in kidney function.
A surprising finding was that, even though participants underwent blood and urine testing for the presence of antihypertensive drugs at baseline to ensure they were off medication, and were told they would be retested at 3 months, 5%-9% nonetheless tested positive at the second test.
That elicited a comment from session chair Richard A. Chazal, MD, of Fort Myers, Fla.: “I must say, as a clinician who sometimes has trouble getting his patients to take antihypertensives, it’s fascinating that some of the people that you asked not to take the medications were taking them.”
While the primary outcome in SPYRAL HTN-OFF MED was the 3-month reduction in blood pressure while off of antihypertensive medication, the ongoing second phase of the trial may have greater clinical relevance. At 3 months, participants are being placed on antihypertensive medication and uptitrated to target, with unblinding at 6 months. The purpose is to see how many RDN recipients don’t need antihypertensive drugs, as well as whether those that do require less medication than the patients who didn’t undergo RDN.
Dr. Boehm characterized RDN as a work in progress. Two major limitations that are the focus of intense research are the lack of a predictor as to which patients are most likely to respond to what is after all an invasive procedure, and the current inability intraprocedurally to tell if sufficient RDN has been achieved.
“Frankly speaking, there is no technology during the procedure to see how efficacious the procedure was,” he explained.

Discussant Dhanunaja Lakkireddy, MD, deemed the mean 4.7–mm Hg reduction in 24-hour SBP “reasonably impressive – that’s actually a pretty good number for an antihypertensive clinical trial.” He was also favorably impressed by RDN’s safety in a 44-site study.
“The drops in blood pressure are not enough to really make a case for renal denervation to be a standalone therapy. But adding it as an adjunct to standard medications may be a very reasonable strategy to adopt. This is a fantastic signal for something that can be brought along as a long-term add-on to antihypertensive medications,” commented Dr. Lakkireddy, chair of the ACC Electrophysiology Council and medical director of the Kansas City Heart Rhythm Institute.
Simultaneous with Dr. Boehm’s presentation, the SPYRAL HTN-OFF MED Pivotal Trial details were published online (Lancet 2020 Mar 29. doi: 10.1016/S0140-6736(20)30554-7).
The study was sponsored by Medtronic. Dr. Boehm reported serving as a consultant to that company and Abbott, Amgen, Astra, Boehringer-Ingelheim, Cytokinetics, Novartis, ReCor, Servier, and Vifor.
SOURCE: Boehm M. ACC 2020, Abstract 406-15.
Catheter-based renal denervation took a step closer to attaining legitimacy as a nonpharmacologic treatment for hypertension with presentation of the primary results of the SPYRAL HTN-OFF MED pivotal trial at the joint scientific sessions of the American College of Cardiology and the World Heart Federation. The meeting was conducted online after its cancellation because of the COVID-19 pandemic.
“We saw clinically meaningful blood pressure reductions at 3 months,” reported Michael Boehm, MD, chief of cardiology at Saarland University Hospital in Homburg, Germany.
That’s encouraging news, as renal denervation (RDN) was nearly abandoned as a potential treatment for hypertension in the wake of the unexpectedly negative results of the SYMPLICITY HTN-3 trial (N Engl J Med. 2014;370:1393-401). However, post hoc analysis of the trial revealed significant shortcomings in design and execution, and a more rigorous development program for the percutaneous device-based therapy is well underway.
The SPYRAL HTN-OFF MED pivotal trial was designed under Food and Drug Administration guidance to show whether RDN reduces blood pressure in patients with untreated hypertension. The prospective study included 331 off-medication patients in nine countries who were randomized to RDN or a sham procedure, then followed in double-blind fashion for 3 months.
The primary outcome was change in 24-hour ambulatory systolic blood pressure from baseline to 3 months. From a mean baseline 24-hour ambulatory blood pressure of 151.4/98 mm Hg, patients in the RDN group averaged a 4.7 mm Hg decrease in 24-hour SBP, which was 4 mm Hg more than in sham-treated controls. Statistically, this translated to a greater than 99.9% probability that RDN was superior to sham therapy. The RDN group also experienced a mean 3.7–mm Hg reduction in 24-hour DBP, compared with a 0.8–mm Hg decrease in controls.
Office SBP – the secondary endpoint – decreased by a mean of 9.2 mm Hg with RDN, compared with 2.5 mm Hg in controls.
These results probably understate the true antihypertensive effect of RDN for two reasons, Dr. Boehm noted. For one, previous studies have shown that the magnitude of blood pressure lowering continues to increase for up to 1-2 years following the procedure, whereas the off-medication assessment in SPYRAL HTN-OFF MED ended at 3 months for ethical and safety reasons. Also, 17% of patients in the control arm were withdrawn from the study and placed on antihypertensive medication because their office SBP reached 180 mm Hg or more, as compared to 9.6% of the RDN group.
A key finding was that RDN lowered blood pressure around the clock, including nighttime and early morning, the hours of greatest cardiovascular risk and a time when some antihypertensive medications are less effective at blood pressure control, the cardiologist observed.
The RDN safety picture was reassuring, with no strokes, myocardial infarctions, major bleeding, or acute deterioration in kidney function.
A surprising finding was that, even though participants underwent blood and urine testing for the presence of antihypertensive drugs at baseline to ensure they were off medication, and were told they would be retested at 3 months, 5%-9% nonetheless tested positive at the second test.
That elicited a comment from session chair Richard A. Chazal, MD, of Fort Myers, Fla.: “I must say, as a clinician who sometimes has trouble getting his patients to take antihypertensives, it’s fascinating that some of the people that you asked not to take the medications were taking them.”
While the primary outcome in SPYRAL HTN-OFF MED was the 3-month reduction in blood pressure while off of antihypertensive medication, the ongoing second phase of the trial may have greater clinical relevance. At 3 months, participants are being placed on antihypertensive medication and uptitrated to target, with unblinding at 6 months. The purpose is to see how many RDN recipients don’t need antihypertensive drugs, as well as whether those that do require less medication than the patients who didn’t undergo RDN.
Dr. Boehm characterized RDN as a work in progress. Two major limitations that are the focus of intense research are the lack of a predictor as to which patients are most likely to respond to what is after all an invasive procedure, and the current inability intraprocedurally to tell if sufficient RDN has been achieved.
“Frankly speaking, there is no technology during the procedure to see how efficacious the procedure was,” he explained.
Discussant Dhanunaja Lakkireddy, MD, deemed the mean 4.7–mm Hg reduction in 24-hour SBP “reasonably impressive – that’s actually a pretty good number for an antihypertensive clinical trial.” He was also favorably impressed by RDN’s safety in a 44-site study.
“The drops in blood pressure are not enough to really make a case for renal denervation to be a standalone therapy. But adding it as an adjunct to standard medications may be a very reasonable strategy to adopt. This is a fantastic signal for something that can be brought along as a long-term add-on to antihypertensive medications,” commented Dr. Lakkireddy, chair of the ACC Electrophysiology Council and medical director of the Kansas City Heart Rhythm Institute.
Simultaneous with Dr. Boehm’s presentation, the SPYRAL HTN-OFF MED Pivotal Trial details were published online (Lancet 2020 Mar 29. doi: 10.1016/S0140-6736(20)30554-7).
The study was sponsored by Medtronic. Dr. Boehm reported serving as a consultant to that company and Abbott, Amgen, Astra, Boehringer-Ingelheim, Cytokinetics, Novartis, ReCor, Servier, and Vifor.
SOURCE: Boehm M. ACC 2020, Abstract 406-15.
Catheter-based renal denervation took a step closer to attaining legitimacy as a nonpharmacologic treatment for hypertension with presentation of the primary results of the SPYRAL HTN-OFF MED pivotal trial at the joint scientific sessions of the American College of Cardiology and the World Heart Federation. The meeting was conducted online after its cancellation because of the COVID-19 pandemic.
“We saw clinically meaningful blood pressure reductions at 3 months,” reported Michael Boehm, MD, chief of cardiology at Saarland University Hospital in Homburg, Germany.
That’s encouraging news, as renal denervation (RDN) was nearly abandoned as a potential treatment for hypertension in the wake of the unexpectedly negative results of the SYMPLICITY HTN-3 trial (N Engl J Med. 2014;370:1393-401). However, post hoc analysis of the trial revealed significant shortcomings in design and execution, and a more rigorous development program for the percutaneous device-based therapy is well underway.
The SPYRAL HTN-OFF MED pivotal trial was designed under Food and Drug Administration guidance to show whether RDN reduces blood pressure in patients with untreated hypertension. The prospective study included 331 off-medication patients in nine countries who were randomized to RDN or a sham procedure, then followed in double-blind fashion for 3 months.
The primary outcome was change in 24-hour ambulatory systolic blood pressure from baseline to 3 months. From a mean baseline 24-hour ambulatory blood pressure of 151.4/98 mm Hg, patients in the RDN group averaged a 4.7 mm Hg decrease in 24-hour SBP, which was 4 mm Hg more than in sham-treated controls. Statistically, this translated to a greater than 99.9% probability that RDN was superior to sham therapy. The RDN group also experienced a mean 3.7–mm Hg reduction in 24-hour DBP, compared with a 0.8–mm Hg decrease in controls.
Office SBP – the secondary endpoint – decreased by a mean of 9.2 mm Hg with RDN, compared with 2.5 mm Hg in controls.
These results probably understate the true antihypertensive effect of RDN for two reasons, Dr. Boehm noted. For one, previous studies have shown that the magnitude of blood pressure lowering continues to increase for up to 1-2 years following the procedure, whereas the off-medication assessment in SPYRAL HTN-OFF MED ended at 3 months for ethical and safety reasons. Also, 17% of patients in the control arm were withdrawn from the study and placed on antihypertensive medication because their office SBP reached 180 mm Hg or more, as compared to 9.6% of the RDN group.
A key finding was that RDN lowered blood pressure around the clock, including nighttime and early morning, the hours of greatest cardiovascular risk and a time when some antihypertensive medications are less effective at blood pressure control, the cardiologist observed.
The RDN safety picture was reassuring, with no strokes, myocardial infarctions, major bleeding, or acute deterioration in kidney function.
A surprising finding was that, even though participants underwent blood and urine testing for the presence of antihypertensive drugs at baseline to ensure they were off medication, and were told they would be retested at 3 months, 5%-9% nonetheless tested positive at the second test.
That elicited a comment from session chair Richard A. Chazal, MD, of Fort Myers, Fla.: “I must say, as a clinician who sometimes has trouble getting his patients to take antihypertensives, it’s fascinating that some of the people that you asked not to take the medications were taking them.”
While the primary outcome in SPYRAL HTN-OFF MED was the 3-month reduction in blood pressure while off of antihypertensive medication, the ongoing second phase of the trial may have greater clinical relevance. At 3 months, participants are being placed on antihypertensive medication and uptitrated to target, with unblinding at 6 months. The purpose is to see how many RDN recipients don’t need antihypertensive drugs, as well as whether those that do require less medication than the patients who didn’t undergo RDN.
Dr. Boehm characterized RDN as a work in progress. Two major limitations that are the focus of intense research are the lack of a predictor as to which patients are most likely to respond to what is after all an invasive procedure, and the current inability intraprocedurally to tell if sufficient RDN has been achieved.
“Frankly speaking, there is no technology during the procedure to see how efficacious the procedure was,” he explained.
Discussant Dhanunaja Lakkireddy, MD, deemed the mean 4.7–mm Hg reduction in 24-hour SBP “reasonably impressive – that’s actually a pretty good number for an antihypertensive clinical trial.” He was also favorably impressed by RDN’s safety in a 44-site study.
“The drops in blood pressure are not enough to really make a case for renal denervation to be a standalone therapy. But adding it as an adjunct to standard medications may be a very reasonable strategy to adopt. This is a fantastic signal for something that can be brought along as a long-term add-on to antihypertensive medications,” commented Dr. Lakkireddy, chair of the ACC Electrophysiology Council and medical director of the Kansas City Heart Rhythm Institute.
Simultaneous with Dr. Boehm’s presentation, the SPYRAL HTN-OFF MED Pivotal Trial details were published online (Lancet 2020 Mar 29. doi: 10.1016/S0140-6736(20)30554-7).
The study was sponsored by Medtronic. Dr. Boehm reported serving as a consultant to that company and Abbott, Amgen, Astra, Boehringer-Ingelheim, Cytokinetics, Novartis, ReCor, Servier, and Vifor.
SOURCE: Boehm M. ACC 2020, Abstract 406-15.
REPORTING FROM ACC 20
Outcomes-based measurement of TAVR program quality goes live
The long-sought goal of measuring the quality of U.S. transcatheter aortic valve replacement (TAVR) programs by patient outcomes rather than by the surrogate measure of case volume is about to be realized.

Starting more or less immediately, the U.S. national register for all TAVR cases that’s mandated by Food and Drug Administration labeling of these devices and run through a collaboration of the American College of Cardiology and the Society of Thoracic Surgeons will start applying a newly developed and validated five-item metric for measuring 30-day patient outcomes and designed to gauge the quality of TAVR programs.
At first, the only recipients of the data will be the programs themselves, but starting in about a year, by sometime in 2021, the STS/ACC TVT (transcatheter valve therapy) Registry will start to make its star-based rating of TAVR programs available to the public, Nimesh D. Desai, MD, said on March 29 at the joint scientific sessions of the ACC and the World Heart Federation. The meeting was conducted online after its cancellation because of the COVID-19 pandemic. These societies already make star-based ratings of U.S. programs available to the public for several other types of cardiac interventions, including coronary artery bypass surgery and MI management.
The new, composite metric based on 30-day outcome data “is appropriate for high-stakes applications such as public reporting,” said Dr. Desai, a thoracic surgeon and director of thoracic aortic surgery research at the University of Pennsylvania in Philadelphia. “We’re confident this model can be used for public reporting. It’s undergone extensive testing of its validity.” The steering committee of the STS/ACC TVT Registry commissioned development of the metric, and it’s now “considered approved,” and ready for use, he explained.
To create the new metric, Dr. Desai and his associates used data from 52,561 patients who underwent transfemoral TAVR during 2015-2017 at any of 301 U.S. sites. These data came from a total pool of more than 114,000 patients at 556 sites, but data from many sites weren’t usable because they were not adequately complete. The researchers then identified the top four measures taken during the 30 days following intervention (hospitalization included) that best correlated with 1-year survival and patients’ quality-of-life scores on the Kansas City Cardiomyopathy Questionnaire: stroke; major, life-threatening, or disabling bleed; acute kidney injury (stage III); and moderate or severe paravalvular leak. These outcomes “matter most to patients,” Dr. Desai said.
They used these four outcomes plus 30-day mortality to calculate the programs’ ratings. Among the 52,561 patients, 14% had at least one of these adverse outcomes. The researchers then used a logistic regression model that adjusted for 46 measured variables to calculate how each program performed relative to the average performance of all the programs. Programs with outcomes that fell within the 95% confidence intervals of average performance were rated as performing as expected; those outside rated as performing either better or worse than expected. The results showed 34 centers (11%) had worse than expected outcomes and 25 (8%) had better than expected outcomes, Dr. Desai said.

“This is a major step forward in measuring TAVR quality,” commented Michael Mack, MD, a cardiac surgeon with Baylor Scott & White Health in Dallas who has been very active in studying TAVR. “Until now, we used volume as a surrogate for quality, but the precision was not great. This is an extremely welcome metric.” The next step is to eventually use 1-year follow-up data instead of 30-day outcomes, he added.
“With the rapid expansion of TAVR over the past 6-8 years, we’re now at the point to start to do this. It’s an ethical obligation This will be one of the most high-fidelity, valid models for public reporting” of clinical outcomes,” said Joseph Cleveland, MD, a professor of surgery at the University of Colorado at Denver in Aurora. “It’s reassuring that about 90% of the program performed as expected or better than expected,” he added.
“Transparency and outcomes should drive how TAVR is delivered,” commented Ashish Pershad, MD, an interventional cardiologist at Banner-University Medicine Heart Institute in Phoenix who estimated that he performs about 150 TAVR procedures annually. “This is a step forward. I’ve been waiting for this for a long time. Until now, volume has been used as a surrogate outcome, but we know it’s not accurate. I’m confident that this model is a good starting point.” But Dr. Pershad also had concern that this new approach “can lend itself to some degree of gaming,” like a bleeding event getting classified as minor when it was really major, or outlier patients getting dropped from reports.

The temptation to cut corners may be higher for TAVR than it’s been for the cardiac-disease metrics that already get publicly reported, like bypass surgery and myocardial infarction management, because of TAVR’s higher cost and higher profile, Dr. Pershad said. Existing measures “have not been as linked to financial disincentive as TAVR might be” because TAVR reimbursements can run as high as $50,000 per case. “The stakes with TAVR are higher,” he said.
Ultimately, the reliable examination of TAVR outcomes that this new metric allows may lead to a shake-up of TAVR programs, Dr. Pershad predicted. “This is clearly a step toward closing down some programs that [consistently] underperform.”
The STS/ACC TVT Registry receives no commercial funding. Dr. Desai has been a consultant to, speaker on behalf of, and received research funding from Gore, and he has also spoken on behalf of Cook, Medtronic, and Terumo Aortic. Dr. Cleveland, Dr. Mack, and Dr. Pershad had no disclosures.
The long-sought goal of measuring the quality of U.S. transcatheter aortic valve replacement (TAVR) programs by patient outcomes rather than by the surrogate measure of case volume is about to be realized.
Starting more or less immediately, the U.S. national register for all TAVR cases that’s mandated by Food and Drug Administration labeling of these devices and run through a collaboration of the American College of Cardiology and the Society of Thoracic Surgeons will start applying a newly developed and validated five-item metric for measuring 30-day patient outcomes and designed to gauge the quality of TAVR programs.
At first, the only recipients of the data will be the programs themselves, but starting in about a year, by sometime in 2021, the STS/ACC TVT (transcatheter valve therapy) Registry will start to make its star-based rating of TAVR programs available to the public, Nimesh D. Desai, MD, said on March 29 at the joint scientific sessions of the ACC and the World Heart Federation. The meeting was conducted online after its cancellation because of the COVID-19 pandemic. These societies already make star-based ratings of U.S. programs available to the public for several other types of cardiac interventions, including coronary artery bypass surgery and MI management.
The new, composite metric based on 30-day outcome data “is appropriate for high-stakes applications such as public reporting,” said Dr. Desai, a thoracic surgeon and director of thoracic aortic surgery research at the University of Pennsylvania in Philadelphia. “We’re confident this model can be used for public reporting. It’s undergone extensive testing of its validity.” The steering committee of the STS/ACC TVT Registry commissioned development of the metric, and it’s now “considered approved,” and ready for use, he explained.
To create the new metric, Dr. Desai and his associates used data from 52,561 patients who underwent transfemoral TAVR during 2015-2017 at any of 301 U.S. sites. These data came from a total pool of more than 114,000 patients at 556 sites, but data from many sites weren’t usable because they were not adequately complete. The researchers then identified the top four measures taken during the 30 days following intervention (hospitalization included) that best correlated with 1-year survival and patients’ quality-of-life scores on the Kansas City Cardiomyopathy Questionnaire: stroke; major, life-threatening, or disabling bleed; acute kidney injury (stage III); and moderate or severe paravalvular leak. These outcomes “matter most to patients,” Dr. Desai said.
They used these four outcomes plus 30-day mortality to calculate the programs’ ratings. Among the 52,561 patients, 14% had at least one of these adverse outcomes. The researchers then used a logistic regression model that adjusted for 46 measured variables to calculate how each program performed relative to the average performance of all the programs. Programs with outcomes that fell within the 95% confidence intervals of average performance were rated as performing as expected; those outside rated as performing either better or worse than expected. The results showed 34 centers (11%) had worse than expected outcomes and 25 (8%) had better than expected outcomes, Dr. Desai said.
“This is a major step forward in measuring TAVR quality,” commented Michael Mack, MD, a cardiac surgeon with Baylor Scott & White Health in Dallas who has been very active in studying TAVR. “Until now, we used volume as a surrogate for quality, but the precision was not great. This is an extremely welcome metric.” The next step is to eventually use 1-year follow-up data instead of 30-day outcomes, he added.
“With the rapid expansion of TAVR over the past 6-8 years, we’re now at the point to start to do this. It’s an ethical obligation This will be one of the most high-fidelity, valid models for public reporting” of clinical outcomes,” said Joseph Cleveland, MD, a professor of surgery at the University of Colorado at Denver in Aurora. “It’s reassuring that about 90% of the program performed as expected or better than expected,” he added.
“Transparency and outcomes should drive how TAVR is delivered,” commented Ashish Pershad, MD, an interventional cardiologist at Banner-University Medicine Heart Institute in Phoenix who estimated that he performs about 150 TAVR procedures annually. “This is a step forward. I’ve been waiting for this for a long time. Until now, volume has been used as a surrogate outcome, but we know it’s not accurate. I’m confident that this model is a good starting point.” But Dr. Pershad also had concern that this new approach “can lend itself to some degree of gaming,” like a bleeding event getting classified as minor when it was really major, or outlier patients getting dropped from reports.
The temptation to cut corners may be higher for TAVR than it’s been for the cardiac-disease metrics that already get publicly reported, like bypass surgery and myocardial infarction management, because of TAVR’s higher cost and higher profile, Dr. Pershad said. Existing measures “have not been as linked to financial disincentive as TAVR might be” because TAVR reimbursements can run as high as $50,000 per case. “The stakes with TAVR are higher,” he said.
Ultimately, the reliable examination of TAVR outcomes that this new metric allows may lead to a shake-up of TAVR programs, Dr. Pershad predicted. “This is clearly a step toward closing down some programs that [consistently] underperform.”
The STS/ACC TVT Registry receives no commercial funding. Dr. Desai has been a consultant to, speaker on behalf of, and received research funding from Gore, and he has also spoken on behalf of Cook, Medtronic, and Terumo Aortic. Dr. Cleveland, Dr. Mack, and Dr. Pershad had no disclosures.
The long-sought goal of measuring the quality of U.S. transcatheter aortic valve replacement (TAVR) programs by patient outcomes rather than by the surrogate measure of case volume is about to be realized.
Starting more or less immediately, the U.S. national register for all TAVR cases that’s mandated by Food and Drug Administration labeling of these devices and run through a collaboration of the American College of Cardiology and the Society of Thoracic Surgeons will start applying a newly developed and validated five-item metric for measuring 30-day patient outcomes and designed to gauge the quality of TAVR programs.
At first, the only recipients of the data will be the programs themselves, but starting in about a year, by sometime in 2021, the STS/ACC TVT (transcatheter valve therapy) Registry will start to make its star-based rating of TAVR programs available to the public, Nimesh D. Desai, MD, said on March 29 at the joint scientific sessions of the ACC and the World Heart Federation. The meeting was conducted online after its cancellation because of the COVID-19 pandemic. These societies already make star-based ratings of U.S. programs available to the public for several other types of cardiac interventions, including coronary artery bypass surgery and MI management.
The new, composite metric based on 30-day outcome data “is appropriate for high-stakes applications such as public reporting,” said Dr. Desai, a thoracic surgeon and director of thoracic aortic surgery research at the University of Pennsylvania in Philadelphia. “We’re confident this model can be used for public reporting. It’s undergone extensive testing of its validity.” The steering committee of the STS/ACC TVT Registry commissioned development of the metric, and it’s now “considered approved,” and ready for use, he explained.
To create the new metric, Dr. Desai and his associates used data from 52,561 patients who underwent transfemoral TAVR during 2015-2017 at any of 301 U.S. sites. These data came from a total pool of more than 114,000 patients at 556 sites, but data from many sites weren’t usable because they were not adequately complete. The researchers then identified the top four measures taken during the 30 days following intervention (hospitalization included) that best correlated with 1-year survival and patients’ quality-of-life scores on the Kansas City Cardiomyopathy Questionnaire: stroke; major, life-threatening, or disabling bleed; acute kidney injury (stage III); and moderate or severe paravalvular leak. These outcomes “matter most to patients,” Dr. Desai said.
They used these four outcomes plus 30-day mortality to calculate the programs’ ratings. Among the 52,561 patients, 14% had at least one of these adverse outcomes. The researchers then used a logistic regression model that adjusted for 46 measured variables to calculate how each program performed relative to the average performance of all the programs. Programs with outcomes that fell within the 95% confidence intervals of average performance were rated as performing as expected; those outside rated as performing either better or worse than expected. The results showed 34 centers (11%) had worse than expected outcomes and 25 (8%) had better than expected outcomes, Dr. Desai said.
“This is a major step forward in measuring TAVR quality,” commented Michael Mack, MD, a cardiac surgeon with Baylor Scott & White Health in Dallas who has been very active in studying TAVR. “Until now, we used volume as a surrogate for quality, but the precision was not great. This is an extremely welcome metric.” The next step is to eventually use 1-year follow-up data instead of 30-day outcomes, he added.
“With the rapid expansion of TAVR over the past 6-8 years, we’re now at the point to start to do this. It’s an ethical obligation This will be one of the most high-fidelity, valid models for public reporting” of clinical outcomes,” said Joseph Cleveland, MD, a professor of surgery at the University of Colorado at Denver in Aurora. “It’s reassuring that about 90% of the program performed as expected or better than expected,” he added.
“Transparency and outcomes should drive how TAVR is delivered,” commented Ashish Pershad, MD, an interventional cardiologist at Banner-University Medicine Heart Institute in Phoenix who estimated that he performs about 150 TAVR procedures annually. “This is a step forward. I’ve been waiting for this for a long time. Until now, volume has been used as a surrogate outcome, but we know it’s not accurate. I’m confident that this model is a good starting point.” But Dr. Pershad also had concern that this new approach “can lend itself to some degree of gaming,” like a bleeding event getting classified as minor when it was really major, or outlier patients getting dropped from reports.
The temptation to cut corners may be higher for TAVR than it’s been for the cardiac-disease metrics that already get publicly reported, like bypass surgery and myocardial infarction management, because of TAVR’s higher cost and higher profile, Dr. Pershad said. Existing measures “have not been as linked to financial disincentive as TAVR might be” because TAVR reimbursements can run as high as $50,000 per case. “The stakes with TAVR are higher,” he said.
Ultimately, the reliable examination of TAVR outcomes that this new metric allows may lead to a shake-up of TAVR programs, Dr. Pershad predicted. “This is clearly a step toward closing down some programs that [consistently] underperform.”
The STS/ACC TVT Registry receives no commercial funding. Dr. Desai has been a consultant to, speaker on behalf of, and received research funding from Gore, and he has also spoken on behalf of Cook, Medtronic, and Terumo Aortic. Dr. Cleveland, Dr. Mack, and Dr. Pershad had no disclosures.
REPORTING FROM ACC 20
Larger absolute rivaroxaban benefit in diabetes: COMPASS
In the COMPASS trial of patients with stable coronary or peripheral artery disease (PAD), the combination of aspirin plus rivaroxaban, 2.5 mg twice daily, provided a larger absolute benefit on cardiovascular endpoints — including a threefold greater reduction in all-cause mortality — in patients with diabetes compared with the overall population.
The results of the diabetes subset of the COMPASS trial were presented by Deepak Bhatt, MD, Brigham and Women’s Hospital Heart & Vascular Center, Boston, Massachusetts, on March 28 at the “virtual” American College of Cardiology 2020 Scientific Session (ACC.20)/World Congress of Cardiology (WCC). They were also simultaneously published online in Circulation.
“Use of dual pathway inhibition with low-dose rivaroxaban plus aspirin is particularly attractive in high-risk patients such as those with diabetes,” Bhatt concluded.
The COMPASS trial was first reported in 2017 and showed a new low dose of rivaroxaban (2.5-mg twice-daily; Xarelto, Bayer/Janssen Pharmaceuticals) plus aspirin, 100 mg once daily, was associated with a reduction in ischemic events and mortality and a superior net clinical benefit, balancing ischemic benefit with severe bleeding, compared with aspirin alone for secondary prevention in patients with stable atherosclerotic vascular disease.
But clinicians have been slow to prescribe rivaroxaban in this new and very large population.
“It’s been more than 2 years now since main COMPASS results, and there isn’t a sense that this therapy has really caught on,” chair of the current ACC session at which the diabetes subgroup results were presented, Hadley Wilson, MD, Sanger Heart and Vascular Institute, Charlotte, North Carolina, commented:
He asked Bhatt whether the diabetes subgroup may be “the tipping point that will make people aware of rivaroxaban and then that may trickle down to other patients.”
Bhatt said that he hoped that would be the case. “We as a steering committee of this trial could say the results were positive so rivaroxaban should now be used in everyone with stable coronary or peripheral arterial disease, but that is impractical and as you out point out it hasn’t happened,” he replied.
“In PAD/vascular medicine we have embraced this new therapy. In the broader cardiology world there are a lot of patients with stable coronary arterial disease at high ischemic risk who could take rivaroxaban, but its use is bound to be limited by it being a branded drug and the fact that there is a bleeding risk,” Bhatt explained.
“I think we need to identify patients with the highest ischemic risk and focus drugs such as these with a financial cost and a bleeding risk on those who most likely will derive the greatest absolute reduction in risk,” he said. “The PAD subgroup is one group where this is the case, and now we have shown the diabetes subgroup is another. And there is no incremental bleeding risk in this group over the whole population, so they get a much greater benefit without a greater risk. I hope this helps get rivaroxaban at the new lower dose used much more often.”
A total of 18,278 patients were randomly assigned to the combination of rivaroxaban and aspirin or aspirin alone in the COMPASS trial. Of these, 6922 had diabetes mellitus at baseline and 11,356 did not have diabetes.
Results from the current analysis show a consistent and similar relative risk reduction for benefit of rivaroxaban plus aspirin vs placebo plus aspirin in patients both with and without diabetes for the primary efficacy endpoint, a composite of cardiovascular death, myocardial infarction (MI), or stroke, with a hazard ratio of 0.74 for patients with diabetes and 0.77 for those without diabetes, the researchers report.
Because of the higher baseline risk in the diabetes subgroup, these patients had numerically larger absolute risk reductions with rivaroxaban than those without diabetes for the primary efficacy endpoint at 3 years (2.3% vs 1.4%) and for all-cause mortality (1.9% vs 0.6%).
These results translate into a number needed to treat (NNT) with rivaroxaban for 3 years to prevent one CV death, MI, or stroke of 44 for the diabetes group vs 73 for the nondiabetes group; the NNT to prevent one all-cause death was 54 for the diabetes group vs 167 for the nondiabetes group, the authors write.
Because the bleeding hazards were similar among patients with and without diabetes, the absolute net clinical benefit (MI, stroke, cardiovascular death, or bleeding leading to death or symptomatic bleeding into a critical organ) for rivaroxaban was “particularly favorable” in the diabetes group (2.7% fewer events in the diabetes group vs 1.0% fewer events in the nondiabetes group), they add.
Panelist at the ACC Featured Clinical Research session at which these results were presented, Jennifer Robinson, MD, University of Iowa College of Public Health, Iowa City, asked Bhatt how clinicians were supposed to decide which of the many new agents now becoming available for patients with stable coronary artery disease to prescribe first.
“We often forget about rivaroxaban when we’re thinking about what to add next for our secondary prevention patients,” she said. “You also led the REDUCE-IT trial showing benefit of icosapent ethyl, icosapent ethyl icosapent ethyl icosapent ethyl and there is also ezetimibe, PCSK9 inhibitors and SGLT2 inhibitors. For your patients with coronary disease who are already on a high dose statin which one of these would you add next?”
“That is what physicians need to ponder all the time,” Bhatt replied. “And when a patient has several risk factors that are not well controlled, I guess it’s all important. I go through a checklist with my patients and try and figure what they’re not on that could further reduce their risk.”
“In the COMPASS trial there was an overall positive result with rivaroxaban in the whole population. And now we have shown that patients with diabetes had an even greater absolute risk reduction. That pattern has also been seen with other classes of agents including the statins, PCSK9 inhibitors, and icosapent ethyl,” Bhatt noted.
“In patients with diabetes, I will usually target whatever is standing out most at that time. If their glycemic control is completely out of whack, then that is what I would focus on first, and these days often with a SGLT2 inhibitor or GLP-1 agonist. If the LDL was out of control, I would add ezetimibe or a PCSK9 inhibitor. If the triglycerides were high, I would add icosapent ethyl. If multiple things were out of control, I would usually focus on the number most out of kilter first and try not to forget about everything else.”
But Bhatt noted that the challenge with rivaroxaban is that there is no test of thrombosis risk that would prompt the physician to take action. “Basically, the doctor just has to remember to do it. In that regard I would consider whether patients are at low bleeding risk and are they still at high ischemic risk despite controlling other risk factors and, if so, then I would add this low dose of rivaroxaban.”
Another panel member, Sekar Kathiresan, MD, asked Bhatt whether he recommended using available scores to assess the bleeding/thrombosis risk/benefits of adding an antithrombotic.
Bhatt replied: “That’s a terrific question. I guess the right answer is that we should be doing that, but in reality I have to concede that I don’t use these scores. They have shown appropriate C statistics in populations, but they are not fantastic in individual patients.”
“I have to confess that I use the eyeball test. There is nothing as good at predicting future bleeding as past bleeding. So if a patient has had bleeding problems on aspirin alone I wouldn’t add rivaroxaban. But if a patient hasn’t bled before, especially if they had some experience of dual antiplatelet therapy, then they would be good candidates for a low vascular dose of rivaroxaban,” he said.
“It is not as easy as with other drugs as there is always a bleeding trade-off with an antithrombotic. There is no such thing as a free lunch. So patients need careful assessment when considering prescribing rivaroxaban and regular reassessment over time to check if they have had any bleeding,” he added.
The COMPASS study was funded by Bayer. Bhatt reports honoraria from Bayer via the Population Health Research Institute for his role on the COMPASS trial and other research funding from Bayer to the Brigham & Women’s Hospital.
American College of Cardiology 2020 Scientific Session (ACC.20)/World Congress of Cardiology (WCC). Abstract 20-LB-20544-ACC. Presented March 28, 2020.
Circulation. Published online March 28, 2020. Full text.
This article first appeared on Medscape.com.
In the COMPASS trial of patients with stable coronary or peripheral artery disease (PAD), the combination of aspirin plus rivaroxaban, 2.5 mg twice daily, provided a larger absolute benefit on cardiovascular endpoints — including a threefold greater reduction in all-cause mortality — in patients with diabetes compared with the overall population.
The results of the diabetes subset of the COMPASS trial were presented by Deepak Bhatt, MD, Brigham and Women’s Hospital Heart & Vascular Center, Boston, Massachusetts, on March 28 at the “virtual” American College of Cardiology 2020 Scientific Session (ACC.20)/World Congress of Cardiology (WCC). They were also simultaneously published online in Circulation.
“Use of dual pathway inhibition with low-dose rivaroxaban plus aspirin is particularly attractive in high-risk patients such as those with diabetes,” Bhatt concluded.
The COMPASS trial was first reported in 2017 and showed a new low dose of rivaroxaban (2.5-mg twice-daily; Xarelto, Bayer/Janssen Pharmaceuticals) plus aspirin, 100 mg once daily, was associated with a reduction in ischemic events and mortality and a superior net clinical benefit, balancing ischemic benefit with severe bleeding, compared with aspirin alone for secondary prevention in patients with stable atherosclerotic vascular disease.
But clinicians have been slow to prescribe rivaroxaban in this new and very large population.
“It’s been more than 2 years now since main COMPASS results, and there isn’t a sense that this therapy has really caught on,” chair of the current ACC session at which the diabetes subgroup results were presented, Hadley Wilson, MD, Sanger Heart and Vascular Institute, Charlotte, North Carolina, commented:
He asked Bhatt whether the diabetes subgroup may be “the tipping point that will make people aware of rivaroxaban and then that may trickle down to other patients.”
Bhatt said that he hoped that would be the case. “We as a steering committee of this trial could say the results were positive so rivaroxaban should now be used in everyone with stable coronary or peripheral arterial disease, but that is impractical and as you out point out it hasn’t happened,” he replied.
“In PAD/vascular medicine we have embraced this new therapy. In the broader cardiology world there are a lot of patients with stable coronary arterial disease at high ischemic risk who could take rivaroxaban, but its use is bound to be limited by it being a branded drug and the fact that there is a bleeding risk,” Bhatt explained.
“I think we need to identify patients with the highest ischemic risk and focus drugs such as these with a financial cost and a bleeding risk on those who most likely will derive the greatest absolute reduction in risk,” he said. “The PAD subgroup is one group where this is the case, and now we have shown the diabetes subgroup is another. And there is no incremental bleeding risk in this group over the whole population, so they get a much greater benefit without a greater risk. I hope this helps get rivaroxaban at the new lower dose used much more often.”
A total of 18,278 patients were randomly assigned to the combination of rivaroxaban and aspirin or aspirin alone in the COMPASS trial. Of these, 6922 had diabetes mellitus at baseline and 11,356 did not have diabetes.
Results from the current analysis show a consistent and similar relative risk reduction for benefit of rivaroxaban plus aspirin vs placebo plus aspirin in patients both with and without diabetes for the primary efficacy endpoint, a composite of cardiovascular death, myocardial infarction (MI), or stroke, with a hazard ratio of 0.74 for patients with diabetes and 0.77 for those without diabetes, the researchers report.
Because of the higher baseline risk in the diabetes subgroup, these patients had numerically larger absolute risk reductions with rivaroxaban than those without diabetes for the primary efficacy endpoint at 3 years (2.3% vs 1.4%) and for all-cause mortality (1.9% vs 0.6%).
These results translate into a number needed to treat (NNT) with rivaroxaban for 3 years to prevent one CV death, MI, or stroke of 44 for the diabetes group vs 73 for the nondiabetes group; the NNT to prevent one all-cause death was 54 for the diabetes group vs 167 for the nondiabetes group, the authors write.
Because the bleeding hazards were similar among patients with and without diabetes, the absolute net clinical benefit (MI, stroke, cardiovascular death, or bleeding leading to death or symptomatic bleeding into a critical organ) for rivaroxaban was “particularly favorable” in the diabetes group (2.7% fewer events in the diabetes group vs 1.0% fewer events in the nondiabetes group), they add.
Panelist at the ACC Featured Clinical Research session at which these results were presented, Jennifer Robinson, MD, University of Iowa College of Public Health, Iowa City, asked Bhatt how clinicians were supposed to decide which of the many new agents now becoming available for patients with stable coronary artery disease to prescribe first.
“We often forget about rivaroxaban when we’re thinking about what to add next for our secondary prevention patients,” she said. “You also led the REDUCE-IT trial showing benefit of icosapent ethyl, icosapent ethyl icosapent ethyl icosapent ethyl and there is also ezetimibe, PCSK9 inhibitors and SGLT2 inhibitors. For your patients with coronary disease who are already on a high dose statin which one of these would you add next?”
“That is what physicians need to ponder all the time,” Bhatt replied. “And when a patient has several risk factors that are not well controlled, I guess it’s all important. I go through a checklist with my patients and try and figure what they’re not on that could further reduce their risk.”
“In the COMPASS trial there was an overall positive result with rivaroxaban in the whole population. And now we have shown that patients with diabetes had an even greater absolute risk reduction. That pattern has also been seen with other classes of agents including the statins, PCSK9 inhibitors, and icosapent ethyl,” Bhatt noted.
“In patients with diabetes, I will usually target whatever is standing out most at that time. If their glycemic control is completely out of whack, then that is what I would focus on first, and these days often with a SGLT2 inhibitor or GLP-1 agonist. If the LDL was out of control, I would add ezetimibe or a PCSK9 inhibitor. If the triglycerides were high, I would add icosapent ethyl. If multiple things were out of control, I would usually focus on the number most out of kilter first and try not to forget about everything else.”
But Bhatt noted that the challenge with rivaroxaban is that there is no test of thrombosis risk that would prompt the physician to take action. “Basically, the doctor just has to remember to do it. In that regard I would consider whether patients are at low bleeding risk and are they still at high ischemic risk despite controlling other risk factors and, if so, then I would add this low dose of rivaroxaban.”
Another panel member, Sekar Kathiresan, MD, asked Bhatt whether he recommended using available scores to assess the bleeding/thrombosis risk/benefits of adding an antithrombotic.
Bhatt replied: “That’s a terrific question. I guess the right answer is that we should be doing that, but in reality I have to concede that I don’t use these scores. They have shown appropriate C statistics in populations, but they are not fantastic in individual patients.”
“I have to confess that I use the eyeball test. There is nothing as good at predicting future bleeding as past bleeding. So if a patient has had bleeding problems on aspirin alone I wouldn’t add rivaroxaban. But if a patient hasn’t bled before, especially if they had some experience of dual antiplatelet therapy, then they would be good candidates for a low vascular dose of rivaroxaban,” he said.
“It is not as easy as with other drugs as there is always a bleeding trade-off with an antithrombotic. There is no such thing as a free lunch. So patients need careful assessment when considering prescribing rivaroxaban and regular reassessment over time to check if they have had any bleeding,” he added.
The COMPASS study was funded by Bayer. Bhatt reports honoraria from Bayer via the Population Health Research Institute for his role on the COMPASS trial and other research funding from Bayer to the Brigham & Women’s Hospital.
American College of Cardiology 2020 Scientific Session (ACC.20)/World Congress of Cardiology (WCC). Abstract 20-LB-20544-ACC. Presented March 28, 2020.
Circulation. Published online March 28, 2020. Full text.
This article first appeared on Medscape.com.
In the COMPASS trial of patients with stable coronary or peripheral artery disease (PAD), the combination of aspirin plus rivaroxaban, 2.5 mg twice daily, provided a larger absolute benefit on cardiovascular endpoints — including a threefold greater reduction in all-cause mortality — in patients with diabetes compared with the overall population.
The results of the diabetes subset of the COMPASS trial were presented by Deepak Bhatt, MD, Brigham and Women’s Hospital Heart & Vascular Center, Boston, Massachusetts, on March 28 at the “virtual” American College of Cardiology 2020 Scientific Session (ACC.20)/World Congress of Cardiology (WCC). They were also simultaneously published online in Circulation.
“Use of dual pathway inhibition with low-dose rivaroxaban plus aspirin is particularly attractive in high-risk patients such as those with diabetes,” Bhatt concluded.
The COMPASS trial was first reported in 2017 and showed a new low dose of rivaroxaban (2.5-mg twice-daily; Xarelto, Bayer/Janssen Pharmaceuticals) plus aspirin, 100 mg once daily, was associated with a reduction in ischemic events and mortality and a superior net clinical benefit, balancing ischemic benefit with severe bleeding, compared with aspirin alone for secondary prevention in patients with stable atherosclerotic vascular disease.
But clinicians have been slow to prescribe rivaroxaban in this new and very large population.
“It’s been more than 2 years now since main COMPASS results, and there isn’t a sense that this therapy has really caught on,” chair of the current ACC session at which the diabetes subgroup results were presented, Hadley Wilson, MD, Sanger Heart and Vascular Institute, Charlotte, North Carolina, commented:
He asked Bhatt whether the diabetes subgroup may be “the tipping point that will make people aware of rivaroxaban and then that may trickle down to other patients.”
Bhatt said that he hoped that would be the case. “We as a steering committee of this trial could say the results were positive so rivaroxaban should now be used in everyone with stable coronary or peripheral arterial disease, but that is impractical and as you out point out it hasn’t happened,” he replied.
“In PAD/vascular medicine we have embraced this new therapy. In the broader cardiology world there are a lot of patients with stable coronary arterial disease at high ischemic risk who could take rivaroxaban, but its use is bound to be limited by it being a branded drug and the fact that there is a bleeding risk,” Bhatt explained.
“I think we need to identify patients with the highest ischemic risk and focus drugs such as these with a financial cost and a bleeding risk on those who most likely will derive the greatest absolute reduction in risk,” he said. “The PAD subgroup is one group where this is the case, and now we have shown the diabetes subgroup is another. And there is no incremental bleeding risk in this group over the whole population, so they get a much greater benefit without a greater risk. I hope this helps get rivaroxaban at the new lower dose used much more often.”
A total of 18,278 patients were randomly assigned to the combination of rivaroxaban and aspirin or aspirin alone in the COMPASS trial. Of these, 6922 had diabetes mellitus at baseline and 11,356 did not have diabetes.
Results from the current analysis show a consistent and similar relative risk reduction for benefit of rivaroxaban plus aspirin vs placebo plus aspirin in patients both with and without diabetes for the primary efficacy endpoint, a composite of cardiovascular death, myocardial infarction (MI), or stroke, with a hazard ratio of 0.74 for patients with diabetes and 0.77 for those without diabetes, the researchers report.
Because of the higher baseline risk in the diabetes subgroup, these patients had numerically larger absolute risk reductions with rivaroxaban than those without diabetes for the primary efficacy endpoint at 3 years (2.3% vs 1.4%) and for all-cause mortality (1.9% vs 0.6%).
These results translate into a number needed to treat (NNT) with rivaroxaban for 3 years to prevent one CV death, MI, or stroke of 44 for the diabetes group vs 73 for the nondiabetes group; the NNT to prevent one all-cause death was 54 for the diabetes group vs 167 for the nondiabetes group, the authors write.
Because the bleeding hazards were similar among patients with and without diabetes, the absolute net clinical benefit (MI, stroke, cardiovascular death, or bleeding leading to death or symptomatic bleeding into a critical organ) for rivaroxaban was “particularly favorable” in the diabetes group (2.7% fewer events in the diabetes group vs 1.0% fewer events in the nondiabetes group), they add.
Panelist at the ACC Featured Clinical Research session at which these results were presented, Jennifer Robinson, MD, University of Iowa College of Public Health, Iowa City, asked Bhatt how clinicians were supposed to decide which of the many new agents now becoming available for patients with stable coronary artery disease to prescribe first.
“We often forget about rivaroxaban when we’re thinking about what to add next for our secondary prevention patients,” she said. “You also led the REDUCE-IT trial showing benefit of icosapent ethyl, icosapent ethyl icosapent ethyl icosapent ethyl and there is also ezetimibe, PCSK9 inhibitors and SGLT2 inhibitors. For your patients with coronary disease who are already on a high dose statin which one of these would you add next?”
“That is what physicians need to ponder all the time,” Bhatt replied. “And when a patient has several risk factors that are not well controlled, I guess it’s all important. I go through a checklist with my patients and try and figure what they’re not on that could further reduce their risk.”
“In the COMPASS trial there was an overall positive result with rivaroxaban in the whole population. And now we have shown that patients with diabetes had an even greater absolute risk reduction. That pattern has also been seen with other classes of agents including the statins, PCSK9 inhibitors, and icosapent ethyl,” Bhatt noted.
“In patients with diabetes, I will usually target whatever is standing out most at that time. If their glycemic control is completely out of whack, then that is what I would focus on first, and these days often with a SGLT2 inhibitor or GLP-1 agonist. If the LDL was out of control, I would add ezetimibe or a PCSK9 inhibitor. If the triglycerides were high, I would add icosapent ethyl. If multiple things were out of control, I would usually focus on the number most out of kilter first and try not to forget about everything else.”
But Bhatt noted that the challenge with rivaroxaban is that there is no test of thrombosis risk that would prompt the physician to take action. “Basically, the doctor just has to remember to do it. In that regard I would consider whether patients are at low bleeding risk and are they still at high ischemic risk despite controlling other risk factors and, if so, then I would add this low dose of rivaroxaban.”
Another panel member, Sekar Kathiresan, MD, asked Bhatt whether he recommended using available scores to assess the bleeding/thrombosis risk/benefits of adding an antithrombotic.
Bhatt replied: “That’s a terrific question. I guess the right answer is that we should be doing that, but in reality I have to concede that I don’t use these scores. They have shown appropriate C statistics in populations, but they are not fantastic in individual patients.”
“I have to confess that I use the eyeball test. There is nothing as good at predicting future bleeding as past bleeding. So if a patient has had bleeding problems on aspirin alone I wouldn’t add rivaroxaban. But if a patient hasn’t bled before, especially if they had some experience of dual antiplatelet therapy, then they would be good candidates for a low vascular dose of rivaroxaban,” he said.
“It is not as easy as with other drugs as there is always a bleeding trade-off with an antithrombotic. There is no such thing as a free lunch. So patients need careful assessment when considering prescribing rivaroxaban and regular reassessment over time to check if they have had any bleeding,” he added.
The COMPASS study was funded by Bayer. Bhatt reports honoraria from Bayer via the Population Health Research Institute for his role on the COMPASS trial and other research funding from Bayer to the Brigham & Women’s Hospital.
American College of Cardiology 2020 Scientific Session (ACC.20)/World Congress of Cardiology (WCC). Abstract 20-LB-20544-ACC. Presented March 28, 2020.
Circulation. Published online March 28, 2020. Full text.
This article first appeared on Medscape.com.
Adenoma detection rate removed from 2020 MIPS, or was it?
Every year, the Centers for Medicare & Medicaid Services (CMS) releases their proposed recommendations for the next performance year and in 2019, the gastroenterology community was surprised that CMS recommended removal of QPP 0343 – Screening Colonoscopy Adenoma Detection Rate from a reportable measure in the Quality Payment Program. So what happened? Why was the measure removed from the QPP? Is there anything that we can do?

Over the next several months we will be publishing a series of articles related to the Adenoma Detection Rate Measure to give every gastroenterologist an inside look at the work that is done on your behalf and steps that you can take in the future to help your fellow gastroenterologists.
This current article explains the joint effort made by all GI societies to try to save the Adenoma Detection Rate measure from removal from the 2020 Quality Payment Program. All societies uniformly submitted a letter to CMS in disapproval of the recommendation and outlined the importance of this measure as follows:
Measure 343: Screening Colonoscopy Adenoma Detection Rate
Our societies are disappointed and disagree with CMS’s decision to remove Measure 343: Screening Colonoscopy Adenoma Detection Rate (ADR) from the Quality Payment Program (QPP) beginning with the 2020 performance year.

The ADR plays a central role in quality improvement and colorectal cancer screening. We urge CMS to reconsider this decision and issue a technical correction to reinstate the measure back into the QPP, as it is the only outcome measure specific to endoscopic skills of gastroenterologists currently available for public reporting.
Studies show that high adenoma detection rates are associated with a significant reduction in colorectal cancer risk.1 Virtually all studies on this subject have demonstrated that there is, in fact, marked variation in adenoma detection rates among physicians. Further, ADR is essential to recommended intervals2 between screening and surveillance examinations.2,3
1. Variables influencing ADR. CMS explained that the measure does not account for variables that may influence the ADR such as geographic location, socioeconomic status of patient population, community compliance of screening, etc. The agency further states that according to the risk factors outlined by the American Cancer Society, African Americans have the highest colorectal cancer incidence and mortality rates of all racial groups in the United States. “In addition, dietary factors, such as consumption of highly processed meats will contribute to an increased risk of colorectal cancer. This diet is more prevalent in lower socioeconomic areas, which could influence the outcome of the measure. There are other patient factors like education, health literacy, etc. that might also affect things like the adequacy of bowel preparation, which in turn could affect performance.”
The societies advised CMS that this rationale reflects a misunderstanding of the definition of ADR, which includes all average-risk patients in whom the physician finds at least one adenoma. Further, ADR only includes colonoscopies with adequate bowel preparation and complete examinations. Studies demonstrate that ADR is not influenced by socioeconomic status and sex mix of the provider’s patient population, or by the rate of screening in the community.
Socioeconomics, ethnicity, and diet are not relevant factors of ADR. That said, our societies welcome the opportunity to work with CMS on creating age and sex standardized ADRs for the U.S. population, if feasible, in order to capture information that CMS deems important.
2. Failure to detect all adenomas. CMS stated that the measure does not account for MIPS eligible clinicians that fail to detect adenomas but may score higher based on the patient population.
The societies pushed back with CMS explaining that this rationale again reflects a misunderstanding of the definition of ADR, which includes average-risk patients for whom the physician finds at least one adenoma. Colonoscopy is heavily operator dependent. In an average-risk, mixed population, the variability in ADR reflects quality of the provider’s endoscopic skills and pathology recognition, rather than the risk of the underlying population.
3. Incidence measure. CMS concluded that Measure 343: Screening Colonoscopy Adenoma Detection Rate is considered an “incidence measure” that does not assess the quality of the care provided. In essence, according to CMS, the measure is based on happenstance rather than the eligible clinician providing a thorough examination.
The societies strongly disagreed with this characterization of ADR. Measure 343: Screening Colonoscopy Adenoma Detection Rate is the only measure that assess the quality of the exam performed by the physician in an average-risk patient with an adequate bowel preparation. Physicians can improve their adenoma detection rate by paying attention to detail, spending more time looking for adenomas, and learning better techniques.
4. Benchmarking. CMS stated that because of the measure construct, benchmarks calculated from this measure are misrepresented and do not align with the MIPS scoring methodology where 100% indicates better clinical care or control. Guidelines and supplemental literature support a performance target for adenoma detection rate of 25% for a mixed sex population (20% in women and 30% in men). CMS determined that Measure 343: Screening Colonoscopy Adenoma Detection Rate may be appropriate for other programs but does not align with the scoring logic within MIPS. When this measure was introduced, according to the agency, it was under the legacy program, Physician Quality Reporting System (PQRS), a pay-for-reporting program that does not have the same scoring implications as MIPS.
The societies reminded CMS that the 25% is the minimum requirement for performance and is not a benchmark. This minimum requirement continues to increase as well. With 25% being the threshold, for every 1% increase in ADR the risk of fatal interval colon cancer decreases by 3%. In one important study by Corley et al, the lowest quintile of ADR was 19% or lower, and was associated with the highest risk of interval colon cancer.4
CMS must begin to move beyond traditional approaches toward benchmarking performance where 100% compliance is expected. It was encouraging to see CMS acknowledge that nuances to evaluating scores are needed based on the ability of a measure to accurately identify and capture performance based on the patient population and measure specifications. For example, these adjustments were finalized for the blood pressure and diabetes HbA1c measures, where the highest number of points will be achieved for anyone scoring 90% or higher. This modification was based on the knowledge that it is not realistic nor in the interest of patients to assume that clinicians will be able to achieve the desired targeted outcome for every patient. The potential for unintended consequences was factored into an assessment of what performance could be considered achievable.
In our view, ADR is a similar example where 100% performance across a clinician’s population of patients is biologically impossible since not every individual who receives a screening colonoscopy will have an adenoma detected. ADR is the best-established colorectal neoplasia-related quality indicator and research demonstrates that high rates are associated with significant reductions in colorectal cancer risk.
CMS must continue to explore alternative strategies toward benchmarking in MIPS to ensure that achievement is fairly assessed, and top performance scores are determined not solely based on peer performance but also based on clinical evidence balanced with minimizing unintended consequences. The MIPS program and its benchmarking and scoring methodologies must continue to innovate to ensure that physicians provide the best possible care to their patients while also accurately and fairly representing and rewarding clinicians’ performance. Continuing to promote a siloed view toward quality will only reduce the relevance of the MIPS program and lead our members to question the integrity and validity of the program.
5. Lack of alignment between cost and quality measures. CMS noted that the agency will consider the relationship between cost and quality, viewing it as an essential component of episode-based measures. Our societies agree that a value-based payment system must balance cost and quality, and as such, members of our societies have been highly engaged in the development of episode-based cost measures as part of episode group prioritization for development, CMS’ measure development contractor asked clinical subcommittee members to consider a measure’s potential for alignment with established quality measures. This includes consideration of whether there is potential for overlap in covering the same patient cohort and the dimensions of care that the quality measure would be capturing in relation to a procedure or condition on which the episode-based cost measure would be focused.
The societies believe that given the well-established role of ADR in gastroenterology practices’ quality improvement programs nationwide, and internationally, the introduction of the Screening/Surveillance Colonoscopy episode-based cost measure beginning in the 2019 performance year, and the proposal from CMS to introduce “MIPS Value Pathways” beginning with the 2021 performance year, the removal of Measure 343: Screening Colonoscopy Adenoma Detection Rate undermines the collective desire of CMS and our organizations to move toward aligned reporting of quality and cost measures relevant to a gastroenterologist’s scope of practice and meaningful to patient care.
6. Development of a new measure. CMS suggested that there is the need for an alternate measure, however, the agency does not agree that Measure 343: Screening Colonoscopy Adenoma Detection Rate should be maintained in the interim.
Our societies welcomed the opportunity to work with CMS on developing a revised version for quality reporting purposes. We also welcomed the opportunity to suggest specific changes with CMS staff to further our shared goal on improving quality reporting and patient care. However, as of now, ADR remains the only validated, relevant, outcome-based measure to evaluate gastroenterologists’ endoscopic quality. It is important that the measure be maintained in the QPP in the interim.
The importance of ADR lies in its association with long-term outcomes. Corley et al. published in the New England Journal of Medicine an examination of the association between adenoma detection rate and risks of subsequent colorectal cancer and death among 264,792 colonoscopies by 136 gastroenterologists. Patients were followed from their baseline examinations for either 10 years or until another colonoscopy with negative results, left the health care system, or were diagnosed with colorectal cancer. There was a 3% reduction in colorectal cancer incidence and a 5% reduction in cancer mortality for each 1% increase in adenoma detection rate. This observation remained for both proximal and distal cancer in both men and women.4 Kaminski et al published a study on the association between adenoma detection rate and interval cancer in Gastroenterology of 294 endoscopists and data on 146,860 colonoscopies that reviewed 895,916 person-years of follow-up evaluation through the National Cancer Registry. The study concluded that there is an association between increased adenoma detection rate and reduced risk of interval cancer and death.5
The focus of any quality improvement program relative to colorectal cancer screening is to reduce colorectal cancer incidence and deaths. As discussed, the literature clearly supports driving improvement in each gastroenterologist’s ADR as the mechanism to achieve these outcomes. Indeed, the first step in any gastroenterology practice’s quality improvement program relative to CRC screening is to measure the endoscopist’s ADR and report to it to the physician, ideally benchmarked against a group or national study. Best practice is to measure and report ADR quarterly. There are a variety of well-established and emerging techniques6-11 technologies,12 and education,13,14 with varying associated cost and effort that can be deployed as systemic interventions aimed at improving adenoma detection rate. The effect of multiple interventions over time aimed at improving ADR has demonstrated increased ADRs with notable increases in the identification of difficult to identify colorectal cancer precursors (i.e., sessile serrated adenomas) and advanced adenomas.15 While the landscape of gastroenterology is changing, the constant is the importance of measuring an endoscopist’s ADR. ADR is fundamental to training and definitions of competency for gastroenterologists.
CMS appears to have listened to the concerns brought to their attention and has been willing to have external discussions with the GI societies in an effort to placate some of these concerns. Over the next several months we will explain the current progress with CMS including reinstating a modified ADR measure as a non-MIPS measure available for reporting in a QCDR. We will also discuss what you can do as a gastroenterologist to help propel some of these efforts forward.
References
1. Kaminski MF, Regula J, et al. Quality indicators for colonoscopy and the risk of interval cancer. N Engl J Med. 2010;362(19):1795-803.
2. Lieberman DA, Rex DK, Winawer SJ, et al. Guidelines for colonoscopy surveillance after screening and polypectomy: a consensus update by the US Multi-Society Task Force on Colorectal Cancer. Gastroenterology. 2012;143:844-57.
3. Rubin CE, Haggitt RC, Burmer GC, et al. DNA aneuploidy in colonic biopsies predicts future development of dysplasia in ulcerative colitis. Gastroenterology. 1992;103:1611-20.
4. Corley D, Jensen CD, Marks AR, et al. Adenoma detection rate and risk of colorectal cancer and death. N Engl J Med. 2014;370:1298-306.
5. Kaminski MF, et al. Increased rate of adenoma detection associates with reduced risk of colorectal cancer and death. Gastroenterology. 2017 Jul;153[1]:98-105. doi: 10.1053/j.gastro.2017.04.006. Epub 2017 Apr 17.
6. ASGE practice guideline: Measuring the quality of endoscopy. Gastrointest Endosc. 2006;58:S1-S38.
7. Rex DK. Colonoscopic withdrawal technique is associated with adenoma miss rate. Gastrointest Endosc. 2000;51:33-6.
8. Barclay RL, et al. Effect of a time-dependent colonoscopic withdrawal protocol on adenoma detection during screening colonoscopy. Clin Gastroenterol Hepatol. 2008;6:1091-8.
9. Shaukat A, et al. Longer withdrawal time is associated with a reduced incidence of interval cancer after screening colonoscopy. Gastroenterology. 2015 Oct;149[4]:952-7
10. Lee S, et al. Am J Gastroenterol. 2016 Jan;111(1):63-9.
11. Jia H, et al. Water exchange method significantly improves adenoma detection rate: A multicenter, randomized controlled trial. Am J Gastroenterol. 2017;112(4):568-76.
12. ASGE. Endoscopes and devices to improve colon polyp detection. GIE 2015;81:1122-9.
13. Ussui V, et al. Am J Gastroenterol. 2015;110:489-96.
14. Kaminski MF, et al. Leadership training to improve adenoma detection rate in screening colonoscopy: a randomized trial. Gut 2016;65:616-24.
15. Shaukat A, et al. Rates of detection of adenoma, sessile serrated adenoma, and advanced adenoma are stable over time and modifiable. Gastroenterology 2018(Feb);156:816-7.
Dr. Adams is a gastroenterologist and assistant professor at the University of Michigan, Ann Arbor; Dr. Leiman is a gastroenterologist and assistant professor of medicine at Duke Health, Durham, N.C.; Dr. Mathews is a gastroenterologist and leader of Clinical Innovation at the Johns Hopkins Armstrong Institute for Patient Safety and Quality, Baltimore.
Every year, the Centers for Medicare & Medicaid Services (CMS) releases their proposed recommendations for the next performance year and in 2019, the gastroenterology community was surprised that CMS recommended removal of QPP 0343 – Screening Colonoscopy Adenoma Detection Rate from a reportable measure in the Quality Payment Program. So what happened? Why was the measure removed from the QPP? Is there anything that we can do?
Over the next several months we will be publishing a series of articles related to the Adenoma Detection Rate Measure to give every gastroenterologist an inside look at the work that is done on your behalf and steps that you can take in the future to help your fellow gastroenterologists.
This current article explains the joint effort made by all GI societies to try to save the Adenoma Detection Rate measure from removal from the 2020 Quality Payment Program. All societies uniformly submitted a letter to CMS in disapproval of the recommendation and outlined the importance of this measure as follows:
Measure 343: Screening Colonoscopy Adenoma Detection Rate
Our societies are disappointed and disagree with CMS’s decision to remove Measure 343: Screening Colonoscopy Adenoma Detection Rate (ADR) from the Quality Payment Program (QPP) beginning with the 2020 performance year.
The ADR plays a central role in quality improvement and colorectal cancer screening. We urge CMS to reconsider this decision and issue a technical correction to reinstate the measure back into the QPP, as it is the only outcome measure specific to endoscopic skills of gastroenterologists currently available for public reporting.
Studies show that high adenoma detection rates are associated with a significant reduction in colorectal cancer risk.1 Virtually all studies on this subject have demonstrated that there is, in fact, marked variation in adenoma detection rates among physicians. Further, ADR is essential to recommended intervals2 between screening and surveillance examinations.2,3
1. Variables influencing ADR. CMS explained that the measure does not account for variables that may influence the ADR such as geographic location, socioeconomic status of patient population, community compliance of screening, etc. The agency further states that according to the risk factors outlined by the American Cancer Society, African Americans have the highest colorectal cancer incidence and mortality rates of all racial groups in the United States. “In addition, dietary factors, such as consumption of highly processed meats will contribute to an increased risk of colorectal cancer. This diet is more prevalent in lower socioeconomic areas, which could influence the outcome of the measure. There are other patient factors like education, health literacy, etc. that might also affect things like the adequacy of bowel preparation, which in turn could affect performance.”
The societies advised CMS that this rationale reflects a misunderstanding of the definition of ADR, which includes all average-risk patients in whom the physician finds at least one adenoma. Further, ADR only includes colonoscopies with adequate bowel preparation and complete examinations. Studies demonstrate that ADR is not influenced by socioeconomic status and sex mix of the provider’s patient population, or by the rate of screening in the community.
Socioeconomics, ethnicity, and diet are not relevant factors of ADR. That said, our societies welcome the opportunity to work with CMS on creating age and sex standardized ADRs for the U.S. population, if feasible, in order to capture information that CMS deems important.
2. Failure to detect all adenomas. CMS stated that the measure does not account for MIPS eligible clinicians that fail to detect adenomas but may score higher based on the patient population.
The societies pushed back with CMS explaining that this rationale again reflects a misunderstanding of the definition of ADR, which includes average-risk patients for whom the physician finds at least one adenoma. Colonoscopy is heavily operator dependent. In an average-risk, mixed population, the variability in ADR reflects quality of the provider’s endoscopic skills and pathology recognition, rather than the risk of the underlying population.
3. Incidence measure. CMS concluded that Measure 343: Screening Colonoscopy Adenoma Detection Rate is considered an “incidence measure” that does not assess the quality of the care provided. In essence, according to CMS, the measure is based on happenstance rather than the eligible clinician providing a thorough examination.
The societies strongly disagreed with this characterization of ADR. Measure 343: Screening Colonoscopy Adenoma Detection Rate is the only measure that assess the quality of the exam performed by the physician in an average-risk patient with an adequate bowel preparation. Physicians can improve their adenoma detection rate by paying attention to detail, spending more time looking for adenomas, and learning better techniques.
4. Benchmarking. CMS stated that because of the measure construct, benchmarks calculated from this measure are misrepresented and do not align with the MIPS scoring methodology where 100% indicates better clinical care or control. Guidelines and supplemental literature support a performance target for adenoma detection rate of 25% for a mixed sex population (20% in women and 30% in men). CMS determined that Measure 343: Screening Colonoscopy Adenoma Detection Rate may be appropriate for other programs but does not align with the scoring logic within MIPS. When this measure was introduced, according to the agency, it was under the legacy program, Physician Quality Reporting System (PQRS), a pay-for-reporting program that does not have the same scoring implications as MIPS.
The societies reminded CMS that the 25% is the minimum requirement for performance and is not a benchmark. This minimum requirement continues to increase as well. With 25% being the threshold, for every 1% increase in ADR the risk of fatal interval colon cancer decreases by 3%. In one important study by Corley et al, the lowest quintile of ADR was 19% or lower, and was associated with the highest risk of interval colon cancer.4
CMS must begin to move beyond traditional approaches toward benchmarking performance where 100% compliance is expected. It was encouraging to see CMS acknowledge that nuances to evaluating scores are needed based on the ability of a measure to accurately identify and capture performance based on the patient population and measure specifications. For example, these adjustments were finalized for the blood pressure and diabetes HbA1c measures, where the highest number of points will be achieved for anyone scoring 90% or higher. This modification was based on the knowledge that it is not realistic nor in the interest of patients to assume that clinicians will be able to achieve the desired targeted outcome for every patient. The potential for unintended consequences was factored into an assessment of what performance could be considered achievable.
In our view, ADR is a similar example where 100% performance across a clinician’s population of patients is biologically impossible since not every individual who receives a screening colonoscopy will have an adenoma detected. ADR is the best-established colorectal neoplasia-related quality indicator and research demonstrates that high rates are associated with significant reductions in colorectal cancer risk.
CMS must continue to explore alternative strategies toward benchmarking in MIPS to ensure that achievement is fairly assessed, and top performance scores are determined not solely based on peer performance but also based on clinical evidence balanced with minimizing unintended consequences. The MIPS program and its benchmarking and scoring methodologies must continue to innovate to ensure that physicians provide the best possible care to their patients while also accurately and fairly representing and rewarding clinicians’ performance. Continuing to promote a siloed view toward quality will only reduce the relevance of the MIPS program and lead our members to question the integrity and validity of the program.
5. Lack of alignment between cost and quality measures. CMS noted that the agency will consider the relationship between cost and quality, viewing it as an essential component of episode-based measures. Our societies agree that a value-based payment system must balance cost and quality, and as such, members of our societies have been highly engaged in the development of episode-based cost measures as part of episode group prioritization for development, CMS’ measure development contractor asked clinical subcommittee members to consider a measure’s potential for alignment with established quality measures. This includes consideration of whether there is potential for overlap in covering the same patient cohort and the dimensions of care that the quality measure would be capturing in relation to a procedure or condition on which the episode-based cost measure would be focused.
The societies believe that given the well-established role of ADR in gastroenterology practices’ quality improvement programs nationwide, and internationally, the introduction of the Screening/Surveillance Colonoscopy episode-based cost measure beginning in the 2019 performance year, and the proposal from CMS to introduce “MIPS Value Pathways” beginning with the 2021 performance year, the removal of Measure 343: Screening Colonoscopy Adenoma Detection Rate undermines the collective desire of CMS and our organizations to move toward aligned reporting of quality and cost measures relevant to a gastroenterologist’s scope of practice and meaningful to patient care.
6. Development of a new measure. CMS suggested that there is the need for an alternate measure, however, the agency does not agree that Measure 343: Screening Colonoscopy Adenoma Detection Rate should be maintained in the interim.
Our societies welcomed the opportunity to work with CMS on developing a revised version for quality reporting purposes. We also welcomed the opportunity to suggest specific changes with CMS staff to further our shared goal on improving quality reporting and patient care. However, as of now, ADR remains the only validated, relevant, outcome-based measure to evaluate gastroenterologists’ endoscopic quality. It is important that the measure be maintained in the QPP in the interim.
The importance of ADR lies in its association with long-term outcomes. Corley et al. published in the New England Journal of Medicine an examination of the association between adenoma detection rate and risks of subsequent colorectal cancer and death among 264,792 colonoscopies by 136 gastroenterologists. Patients were followed from their baseline examinations for either 10 years or until another colonoscopy with negative results, left the health care system, or were diagnosed with colorectal cancer. There was a 3% reduction in colorectal cancer incidence and a 5% reduction in cancer mortality for each 1% increase in adenoma detection rate. This observation remained for both proximal and distal cancer in both men and women.4 Kaminski et al published a study on the association between adenoma detection rate and interval cancer in Gastroenterology of 294 endoscopists and data on 146,860 colonoscopies that reviewed 895,916 person-years of follow-up evaluation through the National Cancer Registry. The study concluded that there is an association between increased adenoma detection rate and reduced risk of interval cancer and death.5
The focus of any quality improvement program relative to colorectal cancer screening is to reduce colorectal cancer incidence and deaths. As discussed, the literature clearly supports driving improvement in each gastroenterologist’s ADR as the mechanism to achieve these outcomes. Indeed, the first step in any gastroenterology practice’s quality improvement program relative to CRC screening is to measure the endoscopist’s ADR and report to it to the physician, ideally benchmarked against a group or national study. Best practice is to measure and report ADR quarterly. There are a variety of well-established and emerging techniques6-11 technologies,12 and education,13,14 with varying associated cost and effort that can be deployed as systemic interventions aimed at improving adenoma detection rate. The effect of multiple interventions over time aimed at improving ADR has demonstrated increased ADRs with notable increases in the identification of difficult to identify colorectal cancer precursors (i.e., sessile serrated adenomas) and advanced adenomas.15 While the landscape of gastroenterology is changing, the constant is the importance of measuring an endoscopist’s ADR. ADR is fundamental to training and definitions of competency for gastroenterologists.
CMS appears to have listened to the concerns brought to their attention and has been willing to have external discussions with the GI societies in an effort to placate some of these concerns. Over the next several months we will explain the current progress with CMS including reinstating a modified ADR measure as a non-MIPS measure available for reporting in a QCDR. We will also discuss what you can do as a gastroenterologist to help propel some of these efforts forward.
References
1. Kaminski MF, Regula J, et al. Quality indicators for colonoscopy and the risk of interval cancer. N Engl J Med. 2010;362(19):1795-803.
2. Lieberman DA, Rex DK, Winawer SJ, et al. Guidelines for colonoscopy surveillance after screening and polypectomy: a consensus update by the US Multi-Society Task Force on Colorectal Cancer. Gastroenterology. 2012;143:844-57.
3. Rubin CE, Haggitt RC, Burmer GC, et al. DNA aneuploidy in colonic biopsies predicts future development of dysplasia in ulcerative colitis. Gastroenterology. 1992;103:1611-20.
4. Corley D, Jensen CD, Marks AR, et al. Adenoma detection rate and risk of colorectal cancer and death. N Engl J Med. 2014;370:1298-306.
5. Kaminski MF, et al. Increased rate of adenoma detection associates with reduced risk of colorectal cancer and death. Gastroenterology. 2017 Jul;153[1]:98-105. doi: 10.1053/j.gastro.2017.04.006. Epub 2017 Apr 17.
6. ASGE practice guideline: Measuring the quality of endoscopy. Gastrointest Endosc. 2006;58:S1-S38.
7. Rex DK. Colonoscopic withdrawal technique is associated with adenoma miss rate. Gastrointest Endosc. 2000;51:33-6.
8. Barclay RL, et al. Effect of a time-dependent colonoscopic withdrawal protocol on adenoma detection during screening colonoscopy. Clin Gastroenterol Hepatol. 2008;6:1091-8.
9. Shaukat A, et al. Longer withdrawal time is associated with a reduced incidence of interval cancer after screening colonoscopy. Gastroenterology. 2015 Oct;149[4]:952-7
10. Lee S, et al. Am J Gastroenterol. 2016 Jan;111(1):63-9.
11. Jia H, et al. Water exchange method significantly improves adenoma detection rate: A multicenter, randomized controlled trial. Am J Gastroenterol. 2017;112(4):568-76.
12. ASGE. Endoscopes and devices to improve colon polyp detection. GIE 2015;81:1122-9.
13. Ussui V, et al. Am J Gastroenterol. 2015;110:489-96.
14. Kaminski MF, et al. Leadership training to improve adenoma detection rate in screening colonoscopy: a randomized trial. Gut 2016;65:616-24.
15. Shaukat A, et al. Rates of detection of adenoma, sessile serrated adenoma, and advanced adenoma are stable over time and modifiable. Gastroenterology 2018(Feb);156:816-7.
Dr. Adams is a gastroenterologist and assistant professor at the University of Michigan, Ann Arbor; Dr. Leiman is a gastroenterologist and assistant professor of medicine at Duke Health, Durham, N.C.; Dr. Mathews is a gastroenterologist and leader of Clinical Innovation at the Johns Hopkins Armstrong Institute for Patient Safety and Quality, Baltimore.
Every year, the Centers for Medicare & Medicaid Services (CMS) releases their proposed recommendations for the next performance year and in 2019, the gastroenterology community was surprised that CMS recommended removal of QPP 0343 – Screening Colonoscopy Adenoma Detection Rate from a reportable measure in the Quality Payment Program. So what happened? Why was the measure removed from the QPP? Is there anything that we can do?
Over the next several months we will be publishing a series of articles related to the Adenoma Detection Rate Measure to give every gastroenterologist an inside look at the work that is done on your behalf and steps that you can take in the future to help your fellow gastroenterologists.
This current article explains the joint effort made by all GI societies to try to save the Adenoma Detection Rate measure from removal from the 2020 Quality Payment Program. All societies uniformly submitted a letter to CMS in disapproval of the recommendation and outlined the importance of this measure as follows:
Measure 343: Screening Colonoscopy Adenoma Detection Rate
Our societies are disappointed and disagree with CMS’s decision to remove Measure 343: Screening Colonoscopy Adenoma Detection Rate (ADR) from the Quality Payment Program (QPP) beginning with the 2020 performance year.
The ADR plays a central role in quality improvement and colorectal cancer screening. We urge CMS to reconsider this decision and issue a technical correction to reinstate the measure back into the QPP, as it is the only outcome measure specific to endoscopic skills of gastroenterologists currently available for public reporting.
Studies show that high adenoma detection rates are associated with a significant reduction in colorectal cancer risk.1 Virtually all studies on this subject have demonstrated that there is, in fact, marked variation in adenoma detection rates among physicians. Further, ADR is essential to recommended intervals2 between screening and surveillance examinations.2,3
1. Variables influencing ADR. CMS explained that the measure does not account for variables that may influence the ADR such as geographic location, socioeconomic status of patient population, community compliance of screening, etc. The agency further states that according to the risk factors outlined by the American Cancer Society, African Americans have the highest colorectal cancer incidence and mortality rates of all racial groups in the United States. “In addition, dietary factors, such as consumption of highly processed meats will contribute to an increased risk of colorectal cancer. This diet is more prevalent in lower socioeconomic areas, which could influence the outcome of the measure. There are other patient factors like education, health literacy, etc. that might also affect things like the adequacy of bowel preparation, which in turn could affect performance.”
The societies advised CMS that this rationale reflects a misunderstanding of the definition of ADR, which includes all average-risk patients in whom the physician finds at least one adenoma. Further, ADR only includes colonoscopies with adequate bowel preparation and complete examinations. Studies demonstrate that ADR is not influenced by socioeconomic status and sex mix of the provider’s patient population, or by the rate of screening in the community.
Socioeconomics, ethnicity, and diet are not relevant factors of ADR. That said, our societies welcome the opportunity to work with CMS on creating age and sex standardized ADRs for the U.S. population, if feasible, in order to capture information that CMS deems important.
2. Failure to detect all adenomas. CMS stated that the measure does not account for MIPS eligible clinicians that fail to detect adenomas but may score higher based on the patient population.
The societies pushed back with CMS explaining that this rationale again reflects a misunderstanding of the definition of ADR, which includes average-risk patients for whom the physician finds at least one adenoma. Colonoscopy is heavily operator dependent. In an average-risk, mixed population, the variability in ADR reflects quality of the provider’s endoscopic skills and pathology recognition, rather than the risk of the underlying population.
3. Incidence measure. CMS concluded that Measure 343: Screening Colonoscopy Adenoma Detection Rate is considered an “incidence measure” that does not assess the quality of the care provided. In essence, according to CMS, the measure is based on happenstance rather than the eligible clinician providing a thorough examination.
The societies strongly disagreed with this characterization of ADR. Measure 343: Screening Colonoscopy Adenoma Detection Rate is the only measure that assess the quality of the exam performed by the physician in an average-risk patient with an adequate bowel preparation. Physicians can improve their adenoma detection rate by paying attention to detail, spending more time looking for adenomas, and learning better techniques.
4. Benchmarking. CMS stated that because of the measure construct, benchmarks calculated from this measure are misrepresented and do not align with the MIPS scoring methodology where 100% indicates better clinical care or control. Guidelines and supplemental literature support a performance target for adenoma detection rate of 25% for a mixed sex population (20% in women and 30% in men). CMS determined that Measure 343: Screening Colonoscopy Adenoma Detection Rate may be appropriate for other programs but does not align with the scoring logic within MIPS. When this measure was introduced, according to the agency, it was under the legacy program, Physician Quality Reporting System (PQRS), a pay-for-reporting program that does not have the same scoring implications as MIPS.
The societies reminded CMS that the 25% is the minimum requirement for performance and is not a benchmark. This minimum requirement continues to increase as well. With 25% being the threshold, for every 1% increase in ADR the risk of fatal interval colon cancer decreases by 3%. In one important study by Corley et al, the lowest quintile of ADR was 19% or lower, and was associated with the highest risk of interval colon cancer.4
CMS must begin to move beyond traditional approaches toward benchmarking performance where 100% compliance is expected. It was encouraging to see CMS acknowledge that nuances to evaluating scores are needed based on the ability of a measure to accurately identify and capture performance based on the patient population and measure specifications. For example, these adjustments were finalized for the blood pressure and diabetes HbA1c measures, where the highest number of points will be achieved for anyone scoring 90% or higher. This modification was based on the knowledge that it is not realistic nor in the interest of patients to assume that clinicians will be able to achieve the desired targeted outcome for every patient. The potential for unintended consequences was factored into an assessment of what performance could be considered achievable.
In our view, ADR is a similar example where 100% performance across a clinician’s population of patients is biologically impossible since not every individual who receives a screening colonoscopy will have an adenoma detected. ADR is the best-established colorectal neoplasia-related quality indicator and research demonstrates that high rates are associated with significant reductions in colorectal cancer risk.
CMS must continue to explore alternative strategies toward benchmarking in MIPS to ensure that achievement is fairly assessed, and top performance scores are determined not solely based on peer performance but also based on clinical evidence balanced with minimizing unintended consequences. The MIPS program and its benchmarking and scoring methodologies must continue to innovate to ensure that physicians provide the best possible care to their patients while also accurately and fairly representing and rewarding clinicians’ performance. Continuing to promote a siloed view toward quality will only reduce the relevance of the MIPS program and lead our members to question the integrity and validity of the program.
5. Lack of alignment between cost and quality measures. CMS noted that the agency will consider the relationship between cost and quality, viewing it as an essential component of episode-based measures. Our societies agree that a value-based payment system must balance cost and quality, and as such, members of our societies have been highly engaged in the development of episode-based cost measures as part of episode group prioritization for development, CMS’ measure development contractor asked clinical subcommittee members to consider a measure’s potential for alignment with established quality measures. This includes consideration of whether there is potential for overlap in covering the same patient cohort and the dimensions of care that the quality measure would be capturing in relation to a procedure or condition on which the episode-based cost measure would be focused.
The societies believe that given the well-established role of ADR in gastroenterology practices’ quality improvement programs nationwide, and internationally, the introduction of the Screening/Surveillance Colonoscopy episode-based cost measure beginning in the 2019 performance year, and the proposal from CMS to introduce “MIPS Value Pathways” beginning with the 2021 performance year, the removal of Measure 343: Screening Colonoscopy Adenoma Detection Rate undermines the collective desire of CMS and our organizations to move toward aligned reporting of quality and cost measures relevant to a gastroenterologist’s scope of practice and meaningful to patient care.
6. Development of a new measure. CMS suggested that there is the need for an alternate measure, however, the agency does not agree that Measure 343: Screening Colonoscopy Adenoma Detection Rate should be maintained in the interim.
Our societies welcomed the opportunity to work with CMS on developing a revised version for quality reporting purposes. We also welcomed the opportunity to suggest specific changes with CMS staff to further our shared goal on improving quality reporting and patient care. However, as of now, ADR remains the only validated, relevant, outcome-based measure to evaluate gastroenterologists’ endoscopic quality. It is important that the measure be maintained in the QPP in the interim.
The importance of ADR lies in its association with long-term outcomes. Corley et al. published in the New England Journal of Medicine an examination of the association between adenoma detection rate and risks of subsequent colorectal cancer and death among 264,792 colonoscopies by 136 gastroenterologists. Patients were followed from their baseline examinations for either 10 years or until another colonoscopy with negative results, left the health care system, or were diagnosed with colorectal cancer. There was a 3% reduction in colorectal cancer incidence and a 5% reduction in cancer mortality for each 1% increase in adenoma detection rate. This observation remained for both proximal and distal cancer in both men and women.4 Kaminski et al published a study on the association between adenoma detection rate and interval cancer in Gastroenterology of 294 endoscopists and data on 146,860 colonoscopies that reviewed 895,916 person-years of follow-up evaluation through the National Cancer Registry. The study concluded that there is an association between increased adenoma detection rate and reduced risk of interval cancer and death.5
The focus of any quality improvement program relative to colorectal cancer screening is to reduce colorectal cancer incidence and deaths. As discussed, the literature clearly supports driving improvement in each gastroenterologist’s ADR as the mechanism to achieve these outcomes. Indeed, the first step in any gastroenterology practice’s quality improvement program relative to CRC screening is to measure the endoscopist’s ADR and report to it to the physician, ideally benchmarked against a group or national study. Best practice is to measure and report ADR quarterly. There are a variety of well-established and emerging techniques6-11 technologies,12 and education,13,14 with varying associated cost and effort that can be deployed as systemic interventions aimed at improving adenoma detection rate. The effect of multiple interventions over time aimed at improving ADR has demonstrated increased ADRs with notable increases in the identification of difficult to identify colorectal cancer precursors (i.e., sessile serrated adenomas) and advanced adenomas.15 While the landscape of gastroenterology is changing, the constant is the importance of measuring an endoscopist’s ADR. ADR is fundamental to training and definitions of competency for gastroenterologists.
CMS appears to have listened to the concerns brought to their attention and has been willing to have external discussions with the GI societies in an effort to placate some of these concerns. Over the next several months we will explain the current progress with CMS including reinstating a modified ADR measure as a non-MIPS measure available for reporting in a QCDR. We will also discuss what you can do as a gastroenterologist to help propel some of these efforts forward.
References
1. Kaminski MF, Regula J, et al. Quality indicators for colonoscopy and the risk of interval cancer. N Engl J Med. 2010;362(19):1795-803.
2. Lieberman DA, Rex DK, Winawer SJ, et al. Guidelines for colonoscopy surveillance after screening and polypectomy: a consensus update by the US Multi-Society Task Force on Colorectal Cancer. Gastroenterology. 2012;143:844-57.
3. Rubin CE, Haggitt RC, Burmer GC, et al. DNA aneuploidy in colonic biopsies predicts future development of dysplasia in ulcerative colitis. Gastroenterology. 1992;103:1611-20.
4. Corley D, Jensen CD, Marks AR, et al. Adenoma detection rate and risk of colorectal cancer and death. N Engl J Med. 2014;370:1298-306.
5. Kaminski MF, et al. Increased rate of adenoma detection associates with reduced risk of colorectal cancer and death. Gastroenterology. 2017 Jul;153[1]:98-105. doi: 10.1053/j.gastro.2017.04.006. Epub 2017 Apr 17.
6. ASGE practice guideline: Measuring the quality of endoscopy. Gastrointest Endosc. 2006;58:S1-S38.
7. Rex DK. Colonoscopic withdrawal technique is associated with adenoma miss rate. Gastrointest Endosc. 2000;51:33-6.
8. Barclay RL, et al. Effect of a time-dependent colonoscopic withdrawal protocol on adenoma detection during screening colonoscopy. Clin Gastroenterol Hepatol. 2008;6:1091-8.
9. Shaukat A, et al. Longer withdrawal time is associated with a reduced incidence of interval cancer after screening colonoscopy. Gastroenterology. 2015 Oct;149[4]:952-7
10. Lee S, et al. Am J Gastroenterol. 2016 Jan;111(1):63-9.
11. Jia H, et al. Water exchange method significantly improves adenoma detection rate: A multicenter, randomized controlled trial. Am J Gastroenterol. 2017;112(4):568-76.
12. ASGE. Endoscopes and devices to improve colon polyp detection. GIE 2015;81:1122-9.
13. Ussui V, et al. Am J Gastroenterol. 2015;110:489-96.
14. Kaminski MF, et al. Leadership training to improve adenoma detection rate in screening colonoscopy: a randomized trial. Gut 2016;65:616-24.
15. Shaukat A, et al. Rates of detection of adenoma, sessile serrated adenoma, and advanced adenoma are stable over time and modifiable. Gastroenterology 2018(Feb);156:816-7.
Dr. Adams is a gastroenterologist and assistant professor at the University of Michigan, Ann Arbor; Dr. Leiman is a gastroenterologist and assistant professor of medicine at Duke Health, Durham, N.C.; Dr. Mathews is a gastroenterologist and leader of Clinical Innovation at the Johns Hopkins Armstrong Institute for Patient Safety and Quality, Baltimore.
UK TAVI: Similar outcomes to surgery in real world
Transcatheter aortic valve replacement (TAVR) was not inferior to conventional surgery with respect to death from any cause at 1 year in a new real-world study in patients age 70 years or older with severe symptomatic aortic stenosis at increased operative risk due to age or comorbidity.
The UK TAVI study was presented March 29 at the “virtual” American College of Cardiology 2020 Scientific Session (ACC.20)/World Congress of Cardiology (WCC).
The trial involved a broad group of patients who were treated at every medical center that performs the transcatheter procedure across the United Kingdom.
“The importance of this trial is that it confirms the effectiveness of the TAVR strategy in a real-world setting,” said lead author, William D. Toff, MD, professor of cardiology at the University of Leicester, United Kingdom.
Previous clinical trials have found TAVR to be noninferior or superior to open-heart surgery for various patient groups, but most trials have been limited to medical centers that perform a high volume of procedures or focus on the use of specific types of replacement valves, he noted.
“Our results are concordant with those from earlier trials in intermediate- and low-risk patients, but those earlier trials were performed in the best centers and had many exclusion criteria. We have replicated those results in populations more representative of the real world.”
“I think it is a very important message that supports the findings in earlier trials that were focused on showing whether TAVR can work under ideal conditions, while our trial shows that it does work in real-world clinical practice,” he added.
The UK TAVI trial enrolled 913 patients referred for treatment of severe aortic stenosis at 34 UK sites from 2014 to 2018. They were randomly assigned to receive TAVR or open-heart surgery.
Enrollment was limited to participants age 70 years or older (with additional risk factors) or age 80 years or older (with or without additional risk factors). The average age was 81 years.
Overall, participants were at intermediate to low risk from surgery, with a median Society of Thoracic Surgeons (STS) risk score of 2.6%. However, researchers did not specify a particular risk score cutoff for enrollment.
“This allowed the trial to evolve along with changes in guidelines and practice regarding TAVR over the course of the study and to reflect physicians’ nuanced, real-world approach to considering risk in decision-making rather than taking a formulaic approach,” Toff said.
At 1 year, the rate of death from any cause (the primary endpoint) was 4.6% in the TAVR group and 6.6% in the surgery group, a difference that met the trial’s prespecified threshold for noninferiority of TAVR.
Rates of death from cardiovascular disease or stroke were also similar between the two groups.
Patients who received TAVR had a significantly higher rate of vascular complications (4.8%) than those receiving surgery (1.3%).
TAVR patients were also more likely to have a pacemaker implanted. This occurred in 12.2% of TAVR patients and 6.6% of those undergoing surgery.
In addition, patients who underwent TAVR had a higher rate of aortic regurgitation. Mild aortic regurgitation occurred at 1 year in 38.3% of the TAVR group and 11.7% of the surgery group, whereas moderate regurgitation occurred in 2.3% of TAVR patients and 0.6% of surgery patients.
On the other hand, patients undergoing TAVR had a significantly lower rate of major bleeding complications, which occurred in 6.3% of patients having TAVR and 17.1% of those undergoing surgery.
TAVR was also associated with a shorter hospital stay, fewer days in intensive care, and a faster improvement in functional capacity and quality of life. Functional capacity and quality-of-life measures at 6 weeks after the procedure were better in the TAVR group but by 1 year they were similar in the two groups.
“Longer follow-up is required to confirm sustained clinical benefit and valve durability to inform clinical practice, particularly in younger patients,” Toff concluded.
“The results from our trial and others are encouraging, but patients need to be fully informed and know that the long-term durability of the TAVR valves and the long-term implications of the increased risk of aortic regurgitation are still uncertain,” he added.
The researchers plan to continue to track outcomes for a minimum of 5 years.
Discussant of the UK TAVI trial at an ACC press conference, Julia Grapsa, MD, Guys and St Thomas NHS Trust, London, United Kingdom, said it was a well-designed study.
“It was impressive to see so many UK sites and the age range of patients from 70 to 91 years, and the shorter hospital stays and functional recoveries as well as reduced major bleeding in the TAVR group,” Grapsa said.
“But something that was very striking to me was the increase in moderate aortic regurgitation in the TAVR arm, 2.3% versus 0.6% in the surgical arm, so it is very important to keep following these patients long term,” she added.
In answer to a question during the main session about using age alone as an inclusion criterion in those over 80 years old, Toff said, “We were more comfortable taking all comers over 80 years of age because of the uncertainty about TAVR is more in relation to its durability and the clinical significance of the aortic regurgitation, which may have consequences in the longer term. But the longer term for the over 80s is obviously less of a problem than for those in their 70s.”
This study was funded by the UK National Institute for Health Research Health Technology Assessment Programme. Toff reports no disclosures.
American College of Cardiology 2020 Scientific Session (ACC.20)/World Congress of Cardiology (WCC). Abstract 20-LB-20410-ACC. Presented March 29, 2020.
This article first appeared on Medscape.com.
Transcatheter aortic valve replacement (TAVR) was not inferior to conventional surgery with respect to death from any cause at 1 year in a new real-world study in patients age 70 years or older with severe symptomatic aortic stenosis at increased operative risk due to age or comorbidity.
The UK TAVI study was presented March 29 at the “virtual” American College of Cardiology 2020 Scientific Session (ACC.20)/World Congress of Cardiology (WCC).
The trial involved a broad group of patients who were treated at every medical center that performs the transcatheter procedure across the United Kingdom.
“The importance of this trial is that it confirms the effectiveness of the TAVR strategy in a real-world setting,” said lead author, William D. Toff, MD, professor of cardiology at the University of Leicester, United Kingdom.
Previous clinical trials have found TAVR to be noninferior or superior to open-heart surgery for various patient groups, but most trials have been limited to medical centers that perform a high volume of procedures or focus on the use of specific types of replacement valves, he noted.
“Our results are concordant with those from earlier trials in intermediate- and low-risk patients, but those earlier trials were performed in the best centers and had many exclusion criteria. We have replicated those results in populations more representative of the real world.”
“I think it is a very important message that supports the findings in earlier trials that were focused on showing whether TAVR can work under ideal conditions, while our trial shows that it does work in real-world clinical practice,” he added.
The UK TAVI trial enrolled 913 patients referred for treatment of severe aortic stenosis at 34 UK sites from 2014 to 2018. They were randomly assigned to receive TAVR or open-heart surgery.
Enrollment was limited to participants age 70 years or older (with additional risk factors) or age 80 years or older (with or without additional risk factors). The average age was 81 years.
Overall, participants were at intermediate to low risk from surgery, with a median Society of Thoracic Surgeons (STS) risk score of 2.6%. However, researchers did not specify a particular risk score cutoff for enrollment.
“This allowed the trial to evolve along with changes in guidelines and practice regarding TAVR over the course of the study and to reflect physicians’ nuanced, real-world approach to considering risk in decision-making rather than taking a formulaic approach,” Toff said.
At 1 year, the rate of death from any cause (the primary endpoint) was 4.6% in the TAVR group and 6.6% in the surgery group, a difference that met the trial’s prespecified threshold for noninferiority of TAVR.
Rates of death from cardiovascular disease or stroke were also similar between the two groups.
Patients who received TAVR had a significantly higher rate of vascular complications (4.8%) than those receiving surgery (1.3%).
TAVR patients were also more likely to have a pacemaker implanted. This occurred in 12.2% of TAVR patients and 6.6% of those undergoing surgery.
In addition, patients who underwent TAVR had a higher rate of aortic regurgitation. Mild aortic regurgitation occurred at 1 year in 38.3% of the TAVR group and 11.7% of the surgery group, whereas moderate regurgitation occurred in 2.3% of TAVR patients and 0.6% of surgery patients.
On the other hand, patients undergoing TAVR had a significantly lower rate of major bleeding complications, which occurred in 6.3% of patients having TAVR and 17.1% of those undergoing surgery.
TAVR was also associated with a shorter hospital stay, fewer days in intensive care, and a faster improvement in functional capacity and quality of life. Functional capacity and quality-of-life measures at 6 weeks after the procedure were better in the TAVR group but by 1 year they were similar in the two groups.
“Longer follow-up is required to confirm sustained clinical benefit and valve durability to inform clinical practice, particularly in younger patients,” Toff concluded.
“The results from our trial and others are encouraging, but patients need to be fully informed and know that the long-term durability of the TAVR valves and the long-term implications of the increased risk of aortic regurgitation are still uncertain,” he added.
The researchers plan to continue to track outcomes for a minimum of 5 years.
Discussant of the UK TAVI trial at an ACC press conference, Julia Grapsa, MD, Guys and St Thomas NHS Trust, London, United Kingdom, said it was a well-designed study.
“It was impressive to see so many UK sites and the age range of patients from 70 to 91 years, and the shorter hospital stays and functional recoveries as well as reduced major bleeding in the TAVR group,” Grapsa said.
“But something that was very striking to me was the increase in moderate aortic regurgitation in the TAVR arm, 2.3% versus 0.6% in the surgical arm, so it is very important to keep following these patients long term,” she added.
In answer to a question during the main session about using age alone as an inclusion criterion in those over 80 years old, Toff said, “We were more comfortable taking all comers over 80 years of age because of the uncertainty about TAVR is more in relation to its durability and the clinical significance of the aortic regurgitation, which may have consequences in the longer term. But the longer term for the over 80s is obviously less of a problem than for those in their 70s.”
This study was funded by the UK National Institute for Health Research Health Technology Assessment Programme. Toff reports no disclosures.
American College of Cardiology 2020 Scientific Session (ACC.20)/World Congress of Cardiology (WCC). Abstract 20-LB-20410-ACC. Presented March 29, 2020.
This article first appeared on Medscape.com.
Transcatheter aortic valve replacement (TAVR) was not inferior to conventional surgery with respect to death from any cause at 1 year in a new real-world study in patients age 70 years or older with severe symptomatic aortic stenosis at increased operative risk due to age or comorbidity.
The UK TAVI study was presented March 29 at the “virtual” American College of Cardiology 2020 Scientific Session (ACC.20)/World Congress of Cardiology (WCC).
The trial involved a broad group of patients who were treated at every medical center that performs the transcatheter procedure across the United Kingdom.
“The importance of this trial is that it confirms the effectiveness of the TAVR strategy in a real-world setting,” said lead author, William D. Toff, MD, professor of cardiology at the University of Leicester, United Kingdom.
Previous clinical trials have found TAVR to be noninferior or superior to open-heart surgery for various patient groups, but most trials have been limited to medical centers that perform a high volume of procedures or focus on the use of specific types of replacement valves, he noted.
“Our results are concordant with those from earlier trials in intermediate- and low-risk patients, but those earlier trials were performed in the best centers and had many exclusion criteria. We have replicated those results in populations more representative of the real world.”
“I think it is a very important message that supports the findings in earlier trials that were focused on showing whether TAVR can work under ideal conditions, while our trial shows that it does work in real-world clinical practice,” he added.
The UK TAVI trial enrolled 913 patients referred for treatment of severe aortic stenosis at 34 UK sites from 2014 to 2018. They were randomly assigned to receive TAVR or open-heart surgery.
Enrollment was limited to participants age 70 years or older (with additional risk factors) or age 80 years or older (with or without additional risk factors). The average age was 81 years.
Overall, participants were at intermediate to low risk from surgery, with a median Society of Thoracic Surgeons (STS) risk score of 2.6%. However, researchers did not specify a particular risk score cutoff for enrollment.
“This allowed the trial to evolve along with changes in guidelines and practice regarding TAVR over the course of the study and to reflect physicians’ nuanced, real-world approach to considering risk in decision-making rather than taking a formulaic approach,” Toff said.
At 1 year, the rate of death from any cause (the primary endpoint) was 4.6% in the TAVR group and 6.6% in the surgery group, a difference that met the trial’s prespecified threshold for noninferiority of TAVR.
Rates of death from cardiovascular disease or stroke were also similar between the two groups.
Patients who received TAVR had a significantly higher rate of vascular complications (4.8%) than those receiving surgery (1.3%).
TAVR patients were also more likely to have a pacemaker implanted. This occurred in 12.2% of TAVR patients and 6.6% of those undergoing surgery.
In addition, patients who underwent TAVR had a higher rate of aortic regurgitation. Mild aortic regurgitation occurred at 1 year in 38.3% of the TAVR group and 11.7% of the surgery group, whereas moderate regurgitation occurred in 2.3% of TAVR patients and 0.6% of surgery patients.
On the other hand, patients undergoing TAVR had a significantly lower rate of major bleeding complications, which occurred in 6.3% of patients having TAVR and 17.1% of those undergoing surgery.
TAVR was also associated with a shorter hospital stay, fewer days in intensive care, and a faster improvement in functional capacity and quality of life. Functional capacity and quality-of-life measures at 6 weeks after the procedure were better in the TAVR group but by 1 year they were similar in the two groups.
“Longer follow-up is required to confirm sustained clinical benefit and valve durability to inform clinical practice, particularly in younger patients,” Toff concluded.
“The results from our trial and others are encouraging, but patients need to be fully informed and know that the long-term durability of the TAVR valves and the long-term implications of the increased risk of aortic regurgitation are still uncertain,” he added.
The researchers plan to continue to track outcomes for a minimum of 5 years.
Discussant of the UK TAVI trial at an ACC press conference, Julia Grapsa, MD, Guys and St Thomas NHS Trust, London, United Kingdom, said it was a well-designed study.
“It was impressive to see so many UK sites and the age range of patients from 70 to 91 years, and the shorter hospital stays and functional recoveries as well as reduced major bleeding in the TAVR group,” Grapsa said.
“But something that was very striking to me was the increase in moderate aortic regurgitation in the TAVR arm, 2.3% versus 0.6% in the surgical arm, so it is very important to keep following these patients long term,” she added.
In answer to a question during the main session about using age alone as an inclusion criterion in those over 80 years old, Toff said, “We were more comfortable taking all comers over 80 years of age because of the uncertainty about TAVR is more in relation to its durability and the clinical significance of the aortic regurgitation, which may have consequences in the longer term. But the longer term for the over 80s is obviously less of a problem than for those in their 70s.”
This study was funded by the UK National Institute for Health Research Health Technology Assessment Programme. Toff reports no disclosures.
American College of Cardiology 2020 Scientific Session (ACC.20)/World Congress of Cardiology (WCC). Abstract 20-LB-20410-ACC. Presented March 29, 2020.
This article first appeared on Medscape.com.
Vaginal artesunate quells CIN 2/3 lesions, clears HPV
In a small study, a self-administered vaginal insert containing the antimalarial agent artesunate resolved cervical intraepithelial neoplasia (CIN) 2/3 lesions in two-thirds of patients and cleared human papillomavirus (HPV) genotypes in nearly half of women whose lesions disappeared.

Among 28 women with biopsy-confirmed CIN 2/3 who used the inserts prior to a planned standard-of-care resection, histologic regression of lesions occurred in 19 patients. In 9 of the 19 women, there was clearance of baseline HPV genotypes.
These results were reported in an abstract that had been slated for presentation at the Society of Gynecologic Oncology’s Annual Meeting on Women’s Cancer. The meeting was canceled because of the COVID-19 pandemic. The study results were also published in Gynecologic Oncology.
An unexpected treatment
“The implications of having a safe, inexpensive, self-administered, shelf-stable, nonsurgical treatment for HPV intraepithelial disease, not only here in the U.S., but also extending to low-resource settings,” are self-evident, said study author Cornelia L. Trimble, MD, of Johns Hopkins University in Baltimore.
“This could change the entire landscape of care,” Dr. Trimble said in an interview. “Who’d have thunk that a freaking Chinese herbal medicine derived from the bark of a tree could have this effect?”
Artesunate is a derivative of artemisinin, an antimalarial isolated from the plant Artemisia annua, which is used in traditional Chinese medicine. According to the Centers for Disease Control and Prevention, intravenous artesunate is the first-line drug for treatment of severe malaria in the United States.
However, artesunate is neither approved by the Food and Drug Administration nor commercially available in the United States. The CDC provides artesunate to U.S. clinicians on an as-needed basis.
In addition to its antimalarial activity, artesunate has been shown to have a cytotoxic effect on squamous cells transformed by HPV in vitro. Dr. Trimble and colleagues are also testing a topical form of the drug for the treatment of vulvar intraepithelial neoplasia.
Patients, dosing, and efficacy
In the current study, Dr. Trimble and colleagues enrolled adult immunocompetent women with CIN 2/3, visible residual lesions, and detectable HPV. The patients were assigned sequentially to one of four treatment groups: one 5-day cycle of 50-mg inserts or one, two, or three 5-day cycles using 200-mg inserts.
The patients were instructed to place the inserts at bedtime using a vaginal applicator, followed by a tampon, and then remove the inserts in the morning.
In a modified intention-to-treat analysis including all women who received at least one dose of artesunate and who had endpoint data available, 19 of 28 (67.9%) had histologic regression of CIN lesions. Of the 19 patients, 9 (47.4%) had clearance of all HPV genotypes that had been present at baseline.

Asked how the investigators could distinguish between the treatment effect of the inserts and spontaneous clearance of lesions seen as part of the natural history of CIN in some patients, Dr. Trimble pointed to two observations suggesting an immunologic effect from treatment.
Specifically, although there was lesion regression to CIN 1 or less in all treatment groups, the patients who had only a single treatment cycle had a longer time to regression than those who received two or three cycles.
Additionally, among the nine patients who had viral clearance, three had clearance at the same study time point where histologic regression was observed. For the other six patients, the virus did not clear until several weeks following lesion regression.
These two observations suggest the therapeutic effect of artesunate is recognized by the immune system, which may stimulate a localized immune-mediated cytotoxic effect, Dr. Trimble said.
Safety and next steps
The safety analysis showed that side effects were generally mild and well tolerated. There were 161 adverse events among 29 women for whom safety data were available. The most frequently reported adverse events were vaginal itching (n = 13), vaginal pain (n = 12), vaginal discharge (n = 8), spotting (n = 6), uterine cramping (n = 6), vaginal dryness (n = 4), pelvic pain (n = 1), perineal pain (n = 1), and dyspareunia (n = 1).
Grade 2 adverse events included vaginal yeast infection (n = 6), bacterial vaginosis (n = 2), vaginal inflammation (n = 2), urinary tract infection (n = 2), and noninfective cystitis (n = 1). There were no grade 3 or 4 adverse events reported, and three women reported no noticeable side effects.
Dr. Trimble and colleagues are continuing to study immune responses in cervical tissues and are examining the composition and functions of the cervicovaginal metagenome, looking at bacterial, viral, and fungal components. The team has joined with collaborators at the University of Texas MD Anderson Cancer Center in Houston to look for immune markers in longitudinally collected, subject-matched cervical swabs.
Frantz Viral Therapeutics supplied the artesunate vaginal inserts and partial financial support for this study. Dr. Trimble disclosed relationships with a range of companies and organizations outside this work.
SOURCE: Trimble C L et al. SGO 2020, Abstract LBA 1.
In a small study, a self-administered vaginal insert containing the antimalarial agent artesunate resolved cervical intraepithelial neoplasia (CIN) 2/3 lesions in two-thirds of patients and cleared human papillomavirus (HPV) genotypes in nearly half of women whose lesions disappeared.
Among 28 women with biopsy-confirmed CIN 2/3 who used the inserts prior to a planned standard-of-care resection, histologic regression of lesions occurred in 19 patients. In 9 of the 19 women, there was clearance of baseline HPV genotypes.
These results were reported in an abstract that had been slated for presentation at the Society of Gynecologic Oncology’s Annual Meeting on Women’s Cancer. The meeting was canceled because of the COVID-19 pandemic. The study results were also published in Gynecologic Oncology.
An unexpected treatment
“The implications of having a safe, inexpensive, self-administered, shelf-stable, nonsurgical treatment for HPV intraepithelial disease, not only here in the U.S., but also extending to low-resource settings,” are self-evident, said study author Cornelia L. Trimble, MD, of Johns Hopkins University in Baltimore.
“This could change the entire landscape of care,” Dr. Trimble said in an interview. “Who’d have thunk that a freaking Chinese herbal medicine derived from the bark of a tree could have this effect?”
Artesunate is a derivative of artemisinin, an antimalarial isolated from the plant Artemisia annua, which is used in traditional Chinese medicine. According to the Centers for Disease Control and Prevention, intravenous artesunate is the first-line drug for treatment of severe malaria in the United States.
However, artesunate is neither approved by the Food and Drug Administration nor commercially available in the United States. The CDC provides artesunate to U.S. clinicians on an as-needed basis.
In addition to its antimalarial activity, artesunate has been shown to have a cytotoxic effect on squamous cells transformed by HPV in vitro. Dr. Trimble and colleagues are also testing a topical form of the drug for the treatment of vulvar intraepithelial neoplasia.
Patients, dosing, and efficacy
In the current study, Dr. Trimble and colleagues enrolled adult immunocompetent women with CIN 2/3, visible residual lesions, and detectable HPV. The patients were assigned sequentially to one of four treatment groups: one 5-day cycle of 50-mg inserts or one, two, or three 5-day cycles using 200-mg inserts.
The patients were instructed to place the inserts at bedtime using a vaginal applicator, followed by a tampon, and then remove the inserts in the morning.
In a modified intention-to-treat analysis including all women who received at least one dose of artesunate and who had endpoint data available, 19 of 28 (67.9%) had histologic regression of CIN lesions. Of the 19 patients, 9 (47.4%) had clearance of all HPV genotypes that had been present at baseline.
Asked how the investigators could distinguish between the treatment effect of the inserts and spontaneous clearance of lesions seen as part of the natural history of CIN in some patients, Dr. Trimble pointed to two observations suggesting an immunologic effect from treatment.
Specifically, although there was lesion regression to CIN 1 or less in all treatment groups, the patients who had only a single treatment cycle had a longer time to regression than those who received two or three cycles.
Additionally, among the nine patients who had viral clearance, three had clearance at the same study time point where histologic regression was observed. For the other six patients, the virus did not clear until several weeks following lesion regression.
These two observations suggest the therapeutic effect of artesunate is recognized by the immune system, which may stimulate a localized immune-mediated cytotoxic effect, Dr. Trimble said.
Safety and next steps
The safety analysis showed that side effects were generally mild and well tolerated. There were 161 adverse events among 29 women for whom safety data were available. The most frequently reported adverse events were vaginal itching (n = 13), vaginal pain (n = 12), vaginal discharge (n = 8), spotting (n = 6), uterine cramping (n = 6), vaginal dryness (n = 4), pelvic pain (n = 1), perineal pain (n = 1), and dyspareunia (n = 1).
Grade 2 adverse events included vaginal yeast infection (n = 6), bacterial vaginosis (n = 2), vaginal inflammation (n = 2), urinary tract infection (n = 2), and noninfective cystitis (n = 1). There were no grade 3 or 4 adverse events reported, and three women reported no noticeable side effects.
Dr. Trimble and colleagues are continuing to study immune responses in cervical tissues and are examining the composition and functions of the cervicovaginal metagenome, looking at bacterial, viral, and fungal components. The team has joined with collaborators at the University of Texas MD Anderson Cancer Center in Houston to look for immune markers in longitudinally collected, subject-matched cervical swabs.
Frantz Viral Therapeutics supplied the artesunate vaginal inserts and partial financial support for this study. Dr. Trimble disclosed relationships with a range of companies and organizations outside this work.
SOURCE: Trimble C L et al. SGO 2020, Abstract LBA 1.
In a small study, a self-administered vaginal insert containing the antimalarial agent artesunate resolved cervical intraepithelial neoplasia (CIN) 2/3 lesions in two-thirds of patients and cleared human papillomavirus (HPV) genotypes in nearly half of women whose lesions disappeared.
Among 28 women with biopsy-confirmed CIN 2/3 who used the inserts prior to a planned standard-of-care resection, histologic regression of lesions occurred in 19 patients. In 9 of the 19 women, there was clearance of baseline HPV genotypes.
These results were reported in an abstract that had been slated for presentation at the Society of Gynecologic Oncology’s Annual Meeting on Women’s Cancer. The meeting was canceled because of the COVID-19 pandemic. The study results were also published in Gynecologic Oncology.
An unexpected treatment
“The implications of having a safe, inexpensive, self-administered, shelf-stable, nonsurgical treatment for HPV intraepithelial disease, not only here in the U.S., but also extending to low-resource settings,” are self-evident, said study author Cornelia L. Trimble, MD, of Johns Hopkins University in Baltimore.
“This could change the entire landscape of care,” Dr. Trimble said in an interview. “Who’d have thunk that a freaking Chinese herbal medicine derived from the bark of a tree could have this effect?”
Artesunate is a derivative of artemisinin, an antimalarial isolated from the plant Artemisia annua, which is used in traditional Chinese medicine. According to the Centers for Disease Control and Prevention, intravenous artesunate is the first-line drug for treatment of severe malaria in the United States.
However, artesunate is neither approved by the Food and Drug Administration nor commercially available in the United States. The CDC provides artesunate to U.S. clinicians on an as-needed basis.
In addition to its antimalarial activity, artesunate has been shown to have a cytotoxic effect on squamous cells transformed by HPV in vitro. Dr. Trimble and colleagues are also testing a topical form of the drug for the treatment of vulvar intraepithelial neoplasia.
Patients, dosing, and efficacy
In the current study, Dr. Trimble and colleagues enrolled adult immunocompetent women with CIN 2/3, visible residual lesions, and detectable HPV. The patients were assigned sequentially to one of four treatment groups: one 5-day cycle of 50-mg inserts or one, two, or three 5-day cycles using 200-mg inserts.
The patients were instructed to place the inserts at bedtime using a vaginal applicator, followed by a tampon, and then remove the inserts in the morning.
In a modified intention-to-treat analysis including all women who received at least one dose of artesunate and who had endpoint data available, 19 of 28 (67.9%) had histologic regression of CIN lesions. Of the 19 patients, 9 (47.4%) had clearance of all HPV genotypes that had been present at baseline.
Asked how the investigators could distinguish between the treatment effect of the inserts and spontaneous clearance of lesions seen as part of the natural history of CIN in some patients, Dr. Trimble pointed to two observations suggesting an immunologic effect from treatment.
Specifically, although there was lesion regression to CIN 1 or less in all treatment groups, the patients who had only a single treatment cycle had a longer time to regression than those who received two or three cycles.
Additionally, among the nine patients who had viral clearance, three had clearance at the same study time point where histologic regression was observed. For the other six patients, the virus did not clear until several weeks following lesion regression.
These two observations suggest the therapeutic effect of artesunate is recognized by the immune system, which may stimulate a localized immune-mediated cytotoxic effect, Dr. Trimble said.
Safety and next steps
The safety analysis showed that side effects were generally mild and well tolerated. There were 161 adverse events among 29 women for whom safety data were available. The most frequently reported adverse events were vaginal itching (n = 13), vaginal pain (n = 12), vaginal discharge (n = 8), spotting (n = 6), uterine cramping (n = 6), vaginal dryness (n = 4), pelvic pain (n = 1), perineal pain (n = 1), and dyspareunia (n = 1).
Grade 2 adverse events included vaginal yeast infection (n = 6), bacterial vaginosis (n = 2), vaginal inflammation (n = 2), urinary tract infection (n = 2), and noninfective cystitis (n = 1). There were no grade 3 or 4 adverse events reported, and three women reported no noticeable side effects.
Dr. Trimble and colleagues are continuing to study immune responses in cervical tissues and are examining the composition and functions of the cervicovaginal metagenome, looking at bacterial, viral, and fungal components. The team has joined with collaborators at the University of Texas MD Anderson Cancer Center in Houston to look for immune markers in longitudinally collected, subject-matched cervical swabs.
Frantz Viral Therapeutics supplied the artesunate vaginal inserts and partial financial support for this study. Dr. Trimble disclosed relationships with a range of companies and organizations outside this work.
SOURCE: Trimble C L et al. SGO 2020, Abstract LBA 1.
FROM SGO 2020
The Society of Hospital Medicine’s Commitment to Increasing Academic Representation for Women and Underrepresented Groups in Medicine: A Good Start
Documentation of gender-based disparities in medicine often focus on lower numbers of women in prominent positions as evidence of inequality and inequity; examples include lower proportion of women physicians as conference speakers,1 first and last authors of manuscripts,2 invited editorials,3 award recipients,4 grant recipients,5 medical society leadership,6 editorial boards,7 and presenters at grand rounds.8 Notably, these disparities are likely greater for intersectional physicians, who experience bias through multiple lenses of disadvantage.9 While the scarcity of women and marginalized populations in leadership roles in medicine provides convincing evidence that inequality exists, the underrepresentation of women and other marginalized physicians in prominent positions is also a cause of continued disparity. Fewer academic opportunities for women physicians and other underrepresented physician groups in medicine may perpetuate slower career advancement10 and contribute to less availability of mentors and sponsors.11 Less obviously, underrepresentation also unintentionally and explicitly signals to junior faculty from marginalized groups that they are not welcome and are unlikely to be successful.9,12
Improving representation of women in other fields has been demonstrated to reduce implicit and explicit sexism.13,14 Increasing diversity in academic leadership is likely to further improve diversity at all levels,9,15 which may in turn reduce gaps in health outcomes seen for marginalized patients.16-18 Measuring and eliminating bias that disadvantages underrepresented physicians in academic opportunities is a moral imperative for institutions and organizations. For this reason, the Society of Hospital Medicine (SHM) has been attempting to address this issue within its organizational structure, publications, and conference presenters.19
The first step for an organization that aims to increase representation of women and other marginalized groups in medicine is to assess the current representation of leadership and opportunities.20 If data are available, this review should include intersectional measurement of other axes of discrimination. Rapid analysis of large data sets of names is feasible using freely available computer algorithms, for example.21 Only once a baseline understanding of representation within an organization is established can identification of goals and areas of improvement and evaluation of efforts to increase representation begin. Reporting this data to the organization’s membership should be undertaken to increase the accountability of leadership to reduce gaps. This work is currently underway at the Journal of Hospital Medicine and within the Society of Hospital Medicine.19
This month’s issue of the Journal of Hospital Medicine includes an article written by Northcutt, et al that describes one such attempt, focusing on representation of conference speakers at SHM’s Annual Meeting. In this study, authors performed a pre- and postintervention analysis of an open call system for selecting didactic speakers for the SHM Annual Meeting. The open call system, implemented for the 2019 SHM Annual Meeting, invited all members to apply for a didactic session. The planning committee then utilized a standardized evaluation form to determine the final speaker list. In previous years, didactic speakers did not apply but were invited and were not formally evaluated. Northcutt et al report that this intervention was associated with a significant increase in the proportion of women conference speakers.22
The Northcutt article and the open call and evaluation system is one example of an intentional adjustment to the speaker selection process aimed at recruiting more diverse presenters. Other examples of intentional efforts to increase diversity within conferences include using curated lists designed to improve representation or contacting other national organizations for recommendations. 20 Efforts such as these are necessary because men in medicine are more likely to volunteer for prominent positions than women,23 meaning that any system of recruitment or allocation of academic opportunities that relies on self-promotion is likely to perpetuate underrepresentation. Using pre-existing speakers list or previous programs will also support ongoing disparities, because men have traditionally represented the majority of speakers.
Of course, conferences are an important and public representation of a society, but are only the starting point for working towards equity within a large organization such as SHM. Similar efforts must be directed towards authorship in SHM publications, representation on editorial boards, society leadership and employment opportunities. Once organizations have an established baseline around publications, leadership recruitment, and employment representation, a review of recruitment policies (for articles, speakers, leaders, and employees) should then be conducted, looking for areas that lead to bias.
Planning committees, editorial boards, and society leadership groups should also intentionally increase their own diversity, as increasing the proportion of women on a convening committee has been demonstrated to increase the number of invited women speakers.15,24 In addition, committees can adopt a mandate to increase diversity in invited speakers, editorials, and authorship; for example, direct instruction to avoid all-male panels led a conference planning committee to invite more women and increased the numbers of women speakers.25 A speaker, authorship, or editorial policy that emphasizes diversity and inclusion should be developed and made available to the organization’s membership.26
Finally, there is evidence that implicit bias training for editorial boards and conference planning committees may be effective.27 Implicit bias training emphasizes that judgements of merit and skill are often subjective and based on in-group membership rather than the quality of applicants.9 For example, underrepresentation of women at a neuroimmunology conference was not explained by quantity or impact of previous publications,28 and evaluation scores for the Society for Hospital Medicine’s Annual Meeting have increased as the proportion of women speakers has increased, suggesting that the presence of women presenters was associated with better presentations. To address concerns about how diversity and inclusion efforts may influence the quality of speakers and authors,29 objective criteria could be developed in advance of a selection process and candidates should be held to the same standard.30 The use of objective evaluation criteria in the selection of conference speakers has also been associated with increasing the proportion of women conference speakers. All in all, SHM’s efforts (and Northcutt’s work) should be lauded but also recognized as what they are: a good start. Continued vigilance focused on equity is the only way to ensure that the move towards greater representation continues.
1. Ruzycki SM, Fletcher S, Earp M, Bharwani A, Lithgow KC. Trends in the proportion of female speakers at medical conferences in the United States and in Canada, 2007 to 2017. JAMA Netw Open. 2019;2(4):e192103. https://doi.org/ 10.1001/jamanetworkopen.2019.2103.
2. Penn CA, Ebott JA, Larach DB, Hesson AM, Waljee JF, Larach MG. The gender authorship gap in gynecologic oncology research. Gynecol Oncol Rep. 2019;29:83-84. https://doi.org/10.1016/j.gore.2019.07.011.
3. Thomas EG, Jayabalasingham B, Collins T, Geertzen J, Bui C, Dominici F. Gender disparities in invited commentary authorship in 2459 medical journals. JAMA Netw Open. 2019;2(10):e1913682.https://doi.org/10.1001/jamanetworkopen.2019.13682.
4. Silver JK, Slocum CS, Bank AM, et al. Where are the women? The underrepresentation of women physicians among recognition award recipients from medical specialty societies. PM R. 2017;9(8):804-815. https://doi.org/ 10.1016/j.pmrj.2017.06.001.
5. Burns KEA, Straus SE, Liu K, Rizv, L, Guyatt G. Gender differences in grant and personnel award funding rates at the Canadian Institute of Health Research based on research content area: a retrospective analysis. PLoS Med. 2019;16(10):e1002935. https://doi.org/ 10.1371/journal.pmed.1002935.
6. Silver JK, Ghalib R, Poorman JA, Al-Assi D, Parangi S, Bhargava H, et al. Analysis of gender equity in leadership of physician-focused medical specialty societies, 2008-2017analysis of gender equity in leadership of physician-focused medical specialty societies, 2008-2017. JAMA Internal Medicine. 2019;179(3):433-435. https://doi.org/10.1001/jamainternmed.2018.5303.
7. Erren TC, Groß JV, Shaw DM, Selle B. Representation of women as authors, reviewers, editors in chief, and editorial board members at 6 general medical journals in 2010 and 2011. JAMA Intern Med. 2014;174(4):633-635. https://doi.org/ 10.1001/jamainternmed.2013.14760.
8. Files JA, Mayer AP, Ko MG, et al. Speaker introductions at internal medicine grand rounds: forms of address reveal gender bias. J Womens Health (Larchmt). 2017;26(5):413-419. https://doi.org/ 10.1089/jwh.2016.6044.
9. Price EG, Gozu A, Kern DE, et al. The role of cultural diversity climate in recruitment, promotion, and retention of faculty in academic medicine. J Gen Intern Med. 2005;20(7):565-571. https://doi.org/10.1111/j.1525-1497.2005.0127.x.
10. Carr PL, Gunn CM, Kaplan SA, Raj A, Freund KM. Inadequate progress for women in academic medicine: findings from the National Faculty Study. J Womens Health (Larchmt). 2015;24(3):190-199. https://doi.org/10.1089/jwh.2014.4848.
11. Farkas AH, Bonifacino E, Turner R, Tilstra SA, Corbelli JA. Mentorship of women in academic medicine: a systematic review. J Gen Intern Med. 2019;34(7):1322-1329. https://doi.org/10.1007/s11606-019-04955-2.
12. Pololi L, Cooper LA, Carr P. Race, disadvantage and faculty experiences in academic medicine. J Gen Intern Med. 2010;25(12):1363-1369. https://doi.org/10.1007/s11606-010-1478-7.
13. Beaman L CR, Duflo E, Pande R, Topalova P. Powerful women: does exposure reduce bias? Q J Econ. 2009;124(4):1497-1540.
14. Mansbridge J. Should Blacks represent Blacks and women represent women? A contingent “Yes”. J Polit. 1999;61(3):628-657. https://doi.org/ https://doi.org/10.2307/2647821.
15. Lithgow KC, Fletcher, S., Earp, M.E., Bharwani, A., Ruzycki, S.M. Association between the proprtion of women on a conference planning committee and the proportion of women conference speakers at medical conferences. JAMA Netw Open. 2020; In press.
16. Alsan M, Garrick, O., Graziani, G.C. Does diversity matter for health? Experimental evidence from Oakland. National Bureau of Economic Research. 2018.
17. Greenwood BN, Carnahan, S., Huang, L. Patient–physician gender concordance and increased mortality among female heart attack patients. Proc Natl Acad Sci USA. 2018;115(34):8569-8574. https://doi.org/10.1073/pnas.1800097115.
18. Silver JK, Bean AC, Slocum C, et al. Physician Workforce Disparities and Patient Care: A Narrative Review. Health Equity. 2019;3(1):360-777. https://doi.org/10.1089/heq.2019.0040.
19. Shah SS, Shaughnessy, E.E., Spector, N.D. Leading by example: How medical journals can improve representation in academic medicine. J Hos Med. 2019;14(7):393. https://doi.org/10.12788/jhm.3247.
20. Martin JL. Ten simple rules to achieve conference speaker gender balance. PLoS Comput Biol. 2014;10(11):e1003903. https://doi.org/ 10.1371/journal.pcbi.1003903.
21. Sumner J. The Gender Balance Assessment Tool (GBAT): a web-based tool for estimating gender balance in syllabi and bibliographies. Polit Sci Polit. 2018;2(51):396-400. https://doi.org/10.1017/S1049096517002074.
22. Northcutt N, Papp S, Keniston A, et al; on behalf of the Society of Hospital Medicine Diversity, Equity and Inclusion Special Interest Group. SPEAKers at the National Society of Hospital Medicine Meeting: A Follow-UP Study of Gender Equity for Conference Speakers from 2015 to 2019. The SPEAK Up Study. J Hosp Med. 2020;15(4):228-231. https://doi.org/10.12788/jhm.3401.
23. Wayne NL, Vermillion M, Uijtdehaage S. Gender differences in leadership amongst first-year medical students in the small-group setting. Acad Med. 2010;85(8):1276-1281. https://doi.org/10.1097/ACM.0b013e3181e5f2ce
24. Casadevall A, Handelsman J. The presence of female conveners correlates with a higher proportion of female speakers at scientific symposia. MBio. 2014;5(1):e00846-13. https://doi.org/10.1128/mBio.00846-13.25. Casadevall A. Achieving speaker gender equity at the American Society for Microbiology General Meeting. MBio. 2015;6(4):e01146. https://doi.org/10.1128/mBio.01146-15.
26. Health NIo. Guidelines for the inclusion of women, minorities, and persons with disabilities in NIH-supported conference grats 2003. https://grants.nih.gov/grants/guide/notice-files/NOT-OD-03-066.html. Accessed March 12, 2019.
27. Devine PG, Forscher PS, Cox WTL, Kaatz A, Sheridan J, Carnes M. A gender bias habit-breaking intervention led to increased hiring of female faculty in STEMM departments. J Exp Soc Psychol. 2017;73:211-215. https://doi.org/10.1016/j.jesp.2017.07.002.
28. Klein RS, Voskuhl, R, Segal BM, et al. Speaking out about gender imbalance in invited speakers improves diversity. Nat Immunol. 201;18(5):475-478. https://doi.org/10.1038/ni.3707.
29. Borrero-Mejias C, Starling AJ, Burch R, Loder E. Ten (Eleven) things not to say to your female colleagues. Headache. 2019;59(10):1846-1854. https://doi.org/10.1111/head.13647.
30. Bandiera G, Abrahams C, Ruetalo M, Hanson MD, Nickell L, Spadafora S. Identifying and promoting best practices in residency application and selection in a complex academic health network. Acad Med. 2015;90(12):1594-1601. https://doi.org/10.1097/ACM.0000000000000954.
Documentation of gender-based disparities in medicine often focus on lower numbers of women in prominent positions as evidence of inequality and inequity; examples include lower proportion of women physicians as conference speakers,1 first and last authors of manuscripts,2 invited editorials,3 award recipients,4 grant recipients,5 medical society leadership,6 editorial boards,7 and presenters at grand rounds.8 Notably, these disparities are likely greater for intersectional physicians, who experience bias through multiple lenses of disadvantage.9 While the scarcity of women and marginalized populations in leadership roles in medicine provides convincing evidence that inequality exists, the underrepresentation of women and other marginalized physicians in prominent positions is also a cause of continued disparity. Fewer academic opportunities for women physicians and other underrepresented physician groups in medicine may perpetuate slower career advancement10 and contribute to less availability of mentors and sponsors.11 Less obviously, underrepresentation also unintentionally and explicitly signals to junior faculty from marginalized groups that they are not welcome and are unlikely to be successful.9,12
Improving representation of women in other fields has been demonstrated to reduce implicit and explicit sexism.13,14 Increasing diversity in academic leadership is likely to further improve diversity at all levels,9,15 which may in turn reduce gaps in health outcomes seen for marginalized patients.16-18 Measuring and eliminating bias that disadvantages underrepresented physicians in academic opportunities is a moral imperative for institutions and organizations. For this reason, the Society of Hospital Medicine (SHM) has been attempting to address this issue within its organizational structure, publications, and conference presenters.19
The first step for an organization that aims to increase representation of women and other marginalized groups in medicine is to assess the current representation of leadership and opportunities.20 If data are available, this review should include intersectional measurement of other axes of discrimination. Rapid analysis of large data sets of names is feasible using freely available computer algorithms, for example.21 Only once a baseline understanding of representation within an organization is established can identification of goals and areas of improvement and evaluation of efforts to increase representation begin. Reporting this data to the organization’s membership should be undertaken to increase the accountability of leadership to reduce gaps. This work is currently underway at the Journal of Hospital Medicine and within the Society of Hospital Medicine.19
This month’s issue of the Journal of Hospital Medicine includes an article written by Northcutt, et al that describes one such attempt, focusing on representation of conference speakers at SHM’s Annual Meeting. In this study, authors performed a pre- and postintervention analysis of an open call system for selecting didactic speakers for the SHM Annual Meeting. The open call system, implemented for the 2019 SHM Annual Meeting, invited all members to apply for a didactic session. The planning committee then utilized a standardized evaluation form to determine the final speaker list. In previous years, didactic speakers did not apply but were invited and were not formally evaluated. Northcutt et al report that this intervention was associated with a significant increase in the proportion of women conference speakers.22
The Northcutt article and the open call and evaluation system is one example of an intentional adjustment to the speaker selection process aimed at recruiting more diverse presenters. Other examples of intentional efforts to increase diversity within conferences include using curated lists designed to improve representation or contacting other national organizations for recommendations. 20 Efforts such as these are necessary because men in medicine are more likely to volunteer for prominent positions than women,23 meaning that any system of recruitment or allocation of academic opportunities that relies on self-promotion is likely to perpetuate underrepresentation. Using pre-existing speakers list or previous programs will also support ongoing disparities, because men have traditionally represented the majority of speakers.
Of course, conferences are an important and public representation of a society, but are only the starting point for working towards equity within a large organization such as SHM. Similar efforts must be directed towards authorship in SHM publications, representation on editorial boards, society leadership and employment opportunities. Once organizations have an established baseline around publications, leadership recruitment, and employment representation, a review of recruitment policies (for articles, speakers, leaders, and employees) should then be conducted, looking for areas that lead to bias.
Planning committees, editorial boards, and society leadership groups should also intentionally increase their own diversity, as increasing the proportion of women on a convening committee has been demonstrated to increase the number of invited women speakers.15,24 In addition, committees can adopt a mandate to increase diversity in invited speakers, editorials, and authorship; for example, direct instruction to avoid all-male panels led a conference planning committee to invite more women and increased the numbers of women speakers.25 A speaker, authorship, or editorial policy that emphasizes diversity and inclusion should be developed and made available to the organization’s membership.26
Finally, there is evidence that implicit bias training for editorial boards and conference planning committees may be effective.27 Implicit bias training emphasizes that judgements of merit and skill are often subjective and based on in-group membership rather than the quality of applicants.9 For example, underrepresentation of women at a neuroimmunology conference was not explained by quantity or impact of previous publications,28 and evaluation scores for the Society for Hospital Medicine’s Annual Meeting have increased as the proportion of women speakers has increased, suggesting that the presence of women presenters was associated with better presentations. To address concerns about how diversity and inclusion efforts may influence the quality of speakers and authors,29 objective criteria could be developed in advance of a selection process and candidates should be held to the same standard.30 The use of objective evaluation criteria in the selection of conference speakers has also been associated with increasing the proportion of women conference speakers. All in all, SHM’s efforts (and Northcutt’s work) should be lauded but also recognized as what they are: a good start. Continued vigilance focused on equity is the only way to ensure that the move towards greater representation continues.
Documentation of gender-based disparities in medicine often focus on lower numbers of women in prominent positions as evidence of inequality and inequity; examples include lower proportion of women physicians as conference speakers,1 first and last authors of manuscripts,2 invited editorials,3 award recipients,4 grant recipients,5 medical society leadership,6 editorial boards,7 and presenters at grand rounds.8 Notably, these disparities are likely greater for intersectional physicians, who experience bias through multiple lenses of disadvantage.9 While the scarcity of women and marginalized populations in leadership roles in medicine provides convincing evidence that inequality exists, the underrepresentation of women and other marginalized physicians in prominent positions is also a cause of continued disparity. Fewer academic opportunities for women physicians and other underrepresented physician groups in medicine may perpetuate slower career advancement10 and contribute to less availability of mentors and sponsors.11 Less obviously, underrepresentation also unintentionally and explicitly signals to junior faculty from marginalized groups that they are not welcome and are unlikely to be successful.9,12
Improving representation of women in other fields has been demonstrated to reduce implicit and explicit sexism.13,14 Increasing diversity in academic leadership is likely to further improve diversity at all levels,9,15 which may in turn reduce gaps in health outcomes seen for marginalized patients.16-18 Measuring and eliminating bias that disadvantages underrepresented physicians in academic opportunities is a moral imperative for institutions and organizations. For this reason, the Society of Hospital Medicine (SHM) has been attempting to address this issue within its organizational structure, publications, and conference presenters.19
The first step for an organization that aims to increase representation of women and other marginalized groups in medicine is to assess the current representation of leadership and opportunities.20 If data are available, this review should include intersectional measurement of other axes of discrimination. Rapid analysis of large data sets of names is feasible using freely available computer algorithms, for example.21 Only once a baseline understanding of representation within an organization is established can identification of goals and areas of improvement and evaluation of efforts to increase representation begin. Reporting this data to the organization’s membership should be undertaken to increase the accountability of leadership to reduce gaps. This work is currently underway at the Journal of Hospital Medicine and within the Society of Hospital Medicine.19
This month’s issue of the Journal of Hospital Medicine includes an article written by Northcutt, et al that describes one such attempt, focusing on representation of conference speakers at SHM’s Annual Meeting. In this study, authors performed a pre- and postintervention analysis of an open call system for selecting didactic speakers for the SHM Annual Meeting. The open call system, implemented for the 2019 SHM Annual Meeting, invited all members to apply for a didactic session. The planning committee then utilized a standardized evaluation form to determine the final speaker list. In previous years, didactic speakers did not apply but were invited and were not formally evaluated. Northcutt et al report that this intervention was associated with a significant increase in the proportion of women conference speakers.22
The Northcutt article and the open call and evaluation system is one example of an intentional adjustment to the speaker selection process aimed at recruiting more diverse presenters. Other examples of intentional efforts to increase diversity within conferences include using curated lists designed to improve representation or contacting other national organizations for recommendations. 20 Efforts such as these are necessary because men in medicine are more likely to volunteer for prominent positions than women,23 meaning that any system of recruitment or allocation of academic opportunities that relies on self-promotion is likely to perpetuate underrepresentation. Using pre-existing speakers list or previous programs will also support ongoing disparities, because men have traditionally represented the majority of speakers.
Of course, conferences are an important and public representation of a society, but are only the starting point for working towards equity within a large organization such as SHM. Similar efforts must be directed towards authorship in SHM publications, representation on editorial boards, society leadership and employment opportunities. Once organizations have an established baseline around publications, leadership recruitment, and employment representation, a review of recruitment policies (for articles, speakers, leaders, and employees) should then be conducted, looking for areas that lead to bias.
Planning committees, editorial boards, and society leadership groups should also intentionally increase their own diversity, as increasing the proportion of women on a convening committee has been demonstrated to increase the number of invited women speakers.15,24 In addition, committees can adopt a mandate to increase diversity in invited speakers, editorials, and authorship; for example, direct instruction to avoid all-male panels led a conference planning committee to invite more women and increased the numbers of women speakers.25 A speaker, authorship, or editorial policy that emphasizes diversity and inclusion should be developed and made available to the organization’s membership.26
Finally, there is evidence that implicit bias training for editorial boards and conference planning committees may be effective.27 Implicit bias training emphasizes that judgements of merit and skill are often subjective and based on in-group membership rather than the quality of applicants.9 For example, underrepresentation of women at a neuroimmunology conference was not explained by quantity or impact of previous publications,28 and evaluation scores for the Society for Hospital Medicine’s Annual Meeting have increased as the proportion of women speakers has increased, suggesting that the presence of women presenters was associated with better presentations. To address concerns about how diversity and inclusion efforts may influence the quality of speakers and authors,29 objective criteria could be developed in advance of a selection process and candidates should be held to the same standard.30 The use of objective evaluation criteria in the selection of conference speakers has also been associated with increasing the proportion of women conference speakers. All in all, SHM’s efforts (and Northcutt’s work) should be lauded but also recognized as what they are: a good start. Continued vigilance focused on equity is the only way to ensure that the move towards greater representation continues.
1. Ruzycki SM, Fletcher S, Earp M, Bharwani A, Lithgow KC. Trends in the proportion of female speakers at medical conferences in the United States and in Canada, 2007 to 2017. JAMA Netw Open. 2019;2(4):e192103. https://doi.org/ 10.1001/jamanetworkopen.2019.2103.
2. Penn CA, Ebott JA, Larach DB, Hesson AM, Waljee JF, Larach MG. The gender authorship gap in gynecologic oncology research. Gynecol Oncol Rep. 2019;29:83-84. https://doi.org/10.1016/j.gore.2019.07.011.
3. Thomas EG, Jayabalasingham B, Collins T, Geertzen J, Bui C, Dominici F. Gender disparities in invited commentary authorship in 2459 medical journals. JAMA Netw Open. 2019;2(10):e1913682.https://doi.org/10.1001/jamanetworkopen.2019.13682.
4. Silver JK, Slocum CS, Bank AM, et al. Where are the women? The underrepresentation of women physicians among recognition award recipients from medical specialty societies. PM R. 2017;9(8):804-815. https://doi.org/ 10.1016/j.pmrj.2017.06.001.
5. Burns KEA, Straus SE, Liu K, Rizv, L, Guyatt G. Gender differences in grant and personnel award funding rates at the Canadian Institute of Health Research based on research content area: a retrospective analysis. PLoS Med. 2019;16(10):e1002935. https://doi.org/ 10.1371/journal.pmed.1002935.
6. Silver JK, Ghalib R, Poorman JA, Al-Assi D, Parangi S, Bhargava H, et al. Analysis of gender equity in leadership of physician-focused medical specialty societies, 2008-2017analysis of gender equity in leadership of physician-focused medical specialty societies, 2008-2017. JAMA Internal Medicine. 2019;179(3):433-435. https://doi.org/10.1001/jamainternmed.2018.5303.
7. Erren TC, Groß JV, Shaw DM, Selle B. Representation of women as authors, reviewers, editors in chief, and editorial board members at 6 general medical journals in 2010 and 2011. JAMA Intern Med. 2014;174(4):633-635. https://doi.org/ 10.1001/jamainternmed.2013.14760.
8. Files JA, Mayer AP, Ko MG, et al. Speaker introductions at internal medicine grand rounds: forms of address reveal gender bias. J Womens Health (Larchmt). 2017;26(5):413-419. https://doi.org/ 10.1089/jwh.2016.6044.
9. Price EG, Gozu A, Kern DE, et al. The role of cultural diversity climate in recruitment, promotion, and retention of faculty in academic medicine. J Gen Intern Med. 2005;20(7):565-571. https://doi.org/10.1111/j.1525-1497.2005.0127.x.
10. Carr PL, Gunn CM, Kaplan SA, Raj A, Freund KM. Inadequate progress for women in academic medicine: findings from the National Faculty Study. J Womens Health (Larchmt). 2015;24(3):190-199. https://doi.org/10.1089/jwh.2014.4848.
11. Farkas AH, Bonifacino E, Turner R, Tilstra SA, Corbelli JA. Mentorship of women in academic medicine: a systematic review. J Gen Intern Med. 2019;34(7):1322-1329. https://doi.org/10.1007/s11606-019-04955-2.
12. Pololi L, Cooper LA, Carr P. Race, disadvantage and faculty experiences in academic medicine. J Gen Intern Med. 2010;25(12):1363-1369. https://doi.org/10.1007/s11606-010-1478-7.
13. Beaman L CR, Duflo E, Pande R, Topalova P. Powerful women: does exposure reduce bias? Q J Econ. 2009;124(4):1497-1540.
14. Mansbridge J. Should Blacks represent Blacks and women represent women? A contingent “Yes”. J Polit. 1999;61(3):628-657. https://doi.org/ https://doi.org/10.2307/2647821.
15. Lithgow KC, Fletcher, S., Earp, M.E., Bharwani, A., Ruzycki, S.M. Association between the proprtion of women on a conference planning committee and the proportion of women conference speakers at medical conferences. JAMA Netw Open. 2020; In press.
16. Alsan M, Garrick, O., Graziani, G.C. Does diversity matter for health? Experimental evidence from Oakland. National Bureau of Economic Research. 2018.
17. Greenwood BN, Carnahan, S., Huang, L. Patient–physician gender concordance and increased mortality among female heart attack patients. Proc Natl Acad Sci USA. 2018;115(34):8569-8574. https://doi.org/10.1073/pnas.1800097115.
18. Silver JK, Bean AC, Slocum C, et al. Physician Workforce Disparities and Patient Care: A Narrative Review. Health Equity. 2019;3(1):360-777. https://doi.org/10.1089/heq.2019.0040.
19. Shah SS, Shaughnessy, E.E., Spector, N.D. Leading by example: How medical journals can improve representation in academic medicine. J Hos Med. 2019;14(7):393. https://doi.org/10.12788/jhm.3247.
20. Martin JL. Ten simple rules to achieve conference speaker gender balance. PLoS Comput Biol. 2014;10(11):e1003903. https://doi.org/ 10.1371/journal.pcbi.1003903.
21. Sumner J. The Gender Balance Assessment Tool (GBAT): a web-based tool for estimating gender balance in syllabi and bibliographies. Polit Sci Polit. 2018;2(51):396-400. https://doi.org/10.1017/S1049096517002074.
22. Northcutt N, Papp S, Keniston A, et al; on behalf of the Society of Hospital Medicine Diversity, Equity and Inclusion Special Interest Group. SPEAKers at the National Society of Hospital Medicine Meeting: A Follow-UP Study of Gender Equity for Conference Speakers from 2015 to 2019. The SPEAK Up Study. J Hosp Med. 2020;15(4):228-231. https://doi.org/10.12788/jhm.3401.
23. Wayne NL, Vermillion M, Uijtdehaage S. Gender differences in leadership amongst first-year medical students in the small-group setting. Acad Med. 2010;85(8):1276-1281. https://doi.org/10.1097/ACM.0b013e3181e5f2ce
24. Casadevall A, Handelsman J. The presence of female conveners correlates with a higher proportion of female speakers at scientific symposia. MBio. 2014;5(1):e00846-13. https://doi.org/10.1128/mBio.00846-13.25. Casadevall A. Achieving speaker gender equity at the American Society for Microbiology General Meeting. MBio. 2015;6(4):e01146. https://doi.org/10.1128/mBio.01146-15.
26. Health NIo. Guidelines for the inclusion of women, minorities, and persons with disabilities in NIH-supported conference grats 2003. https://grants.nih.gov/grants/guide/notice-files/NOT-OD-03-066.html. Accessed March 12, 2019.
27. Devine PG, Forscher PS, Cox WTL, Kaatz A, Sheridan J, Carnes M. A gender bias habit-breaking intervention led to increased hiring of female faculty in STEMM departments. J Exp Soc Psychol. 2017;73:211-215. https://doi.org/10.1016/j.jesp.2017.07.002.
28. Klein RS, Voskuhl, R, Segal BM, et al. Speaking out about gender imbalance in invited speakers improves diversity. Nat Immunol. 201;18(5):475-478. https://doi.org/10.1038/ni.3707.
29. Borrero-Mejias C, Starling AJ, Burch R, Loder E. Ten (Eleven) things not to say to your female colleagues. Headache. 2019;59(10):1846-1854. https://doi.org/10.1111/head.13647.
30. Bandiera G, Abrahams C, Ruetalo M, Hanson MD, Nickell L, Spadafora S. Identifying and promoting best practices in residency application and selection in a complex academic health network. Acad Med. 2015;90(12):1594-1601. https://doi.org/10.1097/ACM.0000000000000954.
1. Ruzycki SM, Fletcher S, Earp M, Bharwani A, Lithgow KC. Trends in the proportion of female speakers at medical conferences in the United States and in Canada, 2007 to 2017. JAMA Netw Open. 2019;2(4):e192103. https://doi.org/ 10.1001/jamanetworkopen.2019.2103.
2. Penn CA, Ebott JA, Larach DB, Hesson AM, Waljee JF, Larach MG. The gender authorship gap in gynecologic oncology research. Gynecol Oncol Rep. 2019;29:83-84. https://doi.org/10.1016/j.gore.2019.07.011.
3. Thomas EG, Jayabalasingham B, Collins T, Geertzen J, Bui C, Dominici F. Gender disparities in invited commentary authorship in 2459 medical journals. JAMA Netw Open. 2019;2(10):e1913682.https://doi.org/10.1001/jamanetworkopen.2019.13682.
4. Silver JK, Slocum CS, Bank AM, et al. Where are the women? The underrepresentation of women physicians among recognition award recipients from medical specialty societies. PM R. 2017;9(8):804-815. https://doi.org/ 10.1016/j.pmrj.2017.06.001.
5. Burns KEA, Straus SE, Liu K, Rizv, L, Guyatt G. Gender differences in grant and personnel award funding rates at the Canadian Institute of Health Research based on research content area: a retrospective analysis. PLoS Med. 2019;16(10):e1002935. https://doi.org/ 10.1371/journal.pmed.1002935.
6. Silver JK, Ghalib R, Poorman JA, Al-Assi D, Parangi S, Bhargava H, et al. Analysis of gender equity in leadership of physician-focused medical specialty societies, 2008-2017analysis of gender equity in leadership of physician-focused medical specialty societies, 2008-2017. JAMA Internal Medicine. 2019;179(3):433-435. https://doi.org/10.1001/jamainternmed.2018.5303.
7. Erren TC, Groß JV, Shaw DM, Selle B. Representation of women as authors, reviewers, editors in chief, and editorial board members at 6 general medical journals in 2010 and 2011. JAMA Intern Med. 2014;174(4):633-635. https://doi.org/ 10.1001/jamainternmed.2013.14760.
8. Files JA, Mayer AP, Ko MG, et al. Speaker introductions at internal medicine grand rounds: forms of address reveal gender bias. J Womens Health (Larchmt). 2017;26(5):413-419. https://doi.org/ 10.1089/jwh.2016.6044.
9. Price EG, Gozu A, Kern DE, et al. The role of cultural diversity climate in recruitment, promotion, and retention of faculty in academic medicine. J Gen Intern Med. 2005;20(7):565-571. https://doi.org/10.1111/j.1525-1497.2005.0127.x.
10. Carr PL, Gunn CM, Kaplan SA, Raj A, Freund KM. Inadequate progress for women in academic medicine: findings from the National Faculty Study. J Womens Health (Larchmt). 2015;24(3):190-199. https://doi.org/10.1089/jwh.2014.4848.
11. Farkas AH, Bonifacino E, Turner R, Tilstra SA, Corbelli JA. Mentorship of women in academic medicine: a systematic review. J Gen Intern Med. 2019;34(7):1322-1329. https://doi.org/10.1007/s11606-019-04955-2.
12. Pololi L, Cooper LA, Carr P. Race, disadvantage and faculty experiences in academic medicine. J Gen Intern Med. 2010;25(12):1363-1369. https://doi.org/10.1007/s11606-010-1478-7.
13. Beaman L CR, Duflo E, Pande R, Topalova P. Powerful women: does exposure reduce bias? Q J Econ. 2009;124(4):1497-1540.
14. Mansbridge J. Should Blacks represent Blacks and women represent women? A contingent “Yes”. J Polit. 1999;61(3):628-657. https://doi.org/ https://doi.org/10.2307/2647821.
15. Lithgow KC, Fletcher, S., Earp, M.E., Bharwani, A., Ruzycki, S.M. Association between the proprtion of women on a conference planning committee and the proportion of women conference speakers at medical conferences. JAMA Netw Open. 2020; In press.
16. Alsan M, Garrick, O., Graziani, G.C. Does diversity matter for health? Experimental evidence from Oakland. National Bureau of Economic Research. 2018.
17. Greenwood BN, Carnahan, S., Huang, L. Patient–physician gender concordance and increased mortality among female heart attack patients. Proc Natl Acad Sci USA. 2018;115(34):8569-8574. https://doi.org/10.1073/pnas.1800097115.
18. Silver JK, Bean AC, Slocum C, et al. Physician Workforce Disparities and Patient Care: A Narrative Review. Health Equity. 2019;3(1):360-777. https://doi.org/10.1089/heq.2019.0040.
19. Shah SS, Shaughnessy, E.E., Spector, N.D. Leading by example: How medical journals can improve representation in academic medicine. J Hos Med. 2019;14(7):393. https://doi.org/10.12788/jhm.3247.
20. Martin JL. Ten simple rules to achieve conference speaker gender balance. PLoS Comput Biol. 2014;10(11):e1003903. https://doi.org/ 10.1371/journal.pcbi.1003903.
21. Sumner J. The Gender Balance Assessment Tool (GBAT): a web-based tool for estimating gender balance in syllabi and bibliographies. Polit Sci Polit. 2018;2(51):396-400. https://doi.org/10.1017/S1049096517002074.
22. Northcutt N, Papp S, Keniston A, et al; on behalf of the Society of Hospital Medicine Diversity, Equity and Inclusion Special Interest Group. SPEAKers at the National Society of Hospital Medicine Meeting: A Follow-UP Study of Gender Equity for Conference Speakers from 2015 to 2019. The SPEAK Up Study. J Hosp Med. 2020;15(4):228-231. https://doi.org/10.12788/jhm.3401.
23. Wayne NL, Vermillion M, Uijtdehaage S. Gender differences in leadership amongst first-year medical students in the small-group setting. Acad Med. 2010;85(8):1276-1281. https://doi.org/10.1097/ACM.0b013e3181e5f2ce
24. Casadevall A, Handelsman J. The presence of female conveners correlates with a higher proportion of female speakers at scientific symposia. MBio. 2014;5(1):e00846-13. https://doi.org/10.1128/mBio.00846-13.25. Casadevall A. Achieving speaker gender equity at the American Society for Microbiology General Meeting. MBio. 2015;6(4):e01146. https://doi.org/10.1128/mBio.01146-15.
26. Health NIo. Guidelines for the inclusion of women, minorities, and persons with disabilities in NIH-supported conference grats 2003. https://grants.nih.gov/grants/guide/notice-files/NOT-OD-03-066.html. Accessed March 12, 2019.
27. Devine PG, Forscher PS, Cox WTL, Kaatz A, Sheridan J, Carnes M. A gender bias habit-breaking intervention led to increased hiring of female faculty in STEMM departments. J Exp Soc Psychol. 2017;73:211-215. https://doi.org/10.1016/j.jesp.2017.07.002.
28. Klein RS, Voskuhl, R, Segal BM, et al. Speaking out about gender imbalance in invited speakers improves diversity. Nat Immunol. 201;18(5):475-478. https://doi.org/10.1038/ni.3707.
29. Borrero-Mejias C, Starling AJ, Burch R, Loder E. Ten (Eleven) things not to say to your female colleagues. Headache. 2019;59(10):1846-1854. https://doi.org/10.1111/head.13647.
30. Bandiera G, Abrahams C, Ruetalo M, Hanson MD, Nickell L, Spadafora S. Identifying and promoting best practices in residency application and selection in a complex academic health network. Acad Med. 2015;90(12):1594-1601. https://doi.org/10.1097/ACM.0000000000000954.
© 2020 Society of Hospital Medicine