User login
Access Problems Persist Despite Health Insurance: Lessons from Massachusetts
A surprising lesson from Massachusetts is that expanding health insurance coverage does not automatically improve access to healthcare services. Here’s proof:
- More than half of primary-care physicians (PCPs) in Massachusetts are not accepting new patients.
- Wait times to see PCPs remain high: 48 days for internal medicine, 36 days for family medicine.
- The percentage of internal medicine physicians accepting Medicaid has decreased by double digits.
- Many physicians who accept Medicaid report that a lack of qualified specialists in their area is a major problem that limits their ability to provide high-quality care.
- Many physicians who accept a high proportion of Medicaid patients are in solo or two-physician practices, and have limited ability to expand hours of availability.
- ED use increased 10% from 2004 to 2008, and high levels of ED use have persisted since the reform law was enacted—a strong indicator of PCP shortages. Massachusetts has 491 ED visits per 1,000 residents, compared with a national average of 401 visits per 1,000 residents.
- Preventable hospitalization rates have not decreased, and are comparable to that of Medicaid patients and uninsured patients—remaining at about 10% from 2004 to 2008.
A surprising lesson from Massachusetts is that expanding health insurance coverage does not automatically improve access to healthcare services. Here’s proof:
- More than half of primary-care physicians (PCPs) in Massachusetts are not accepting new patients.
- Wait times to see PCPs remain high: 48 days for internal medicine, 36 days for family medicine.
- The percentage of internal medicine physicians accepting Medicaid has decreased by double digits.
- Many physicians who accept Medicaid report that a lack of qualified specialists in their area is a major problem that limits their ability to provide high-quality care.
- Many physicians who accept a high proportion of Medicaid patients are in solo or two-physician practices, and have limited ability to expand hours of availability.
- ED use increased 10% from 2004 to 2008, and high levels of ED use have persisted since the reform law was enacted—a strong indicator of PCP shortages. Massachusetts has 491 ED visits per 1,000 residents, compared with a national average of 401 visits per 1,000 residents.
- Preventable hospitalization rates have not decreased, and are comparable to that of Medicaid patients and uninsured patients—remaining at about 10% from 2004 to 2008.
A surprising lesson from Massachusetts is that expanding health insurance coverage does not automatically improve access to healthcare services. Here’s proof:
- More than half of primary-care physicians (PCPs) in Massachusetts are not accepting new patients.
- Wait times to see PCPs remain high: 48 days for internal medicine, 36 days for family medicine.
- The percentage of internal medicine physicians accepting Medicaid has decreased by double digits.
- Many physicians who accept Medicaid report that a lack of qualified specialists in their area is a major problem that limits their ability to provide high-quality care.
- Many physicians who accept a high proportion of Medicaid patients are in solo or two-physician practices, and have limited ability to expand hours of availability.
- ED use increased 10% from 2004 to 2008, and high levels of ED use have persisted since the reform law was enacted—a strong indicator of PCP shortages. Massachusetts has 491 ED visits per 1,000 residents, compared with a national average of 401 visits per 1,000 residents.
- Preventable hospitalization rates have not decreased, and are comparable to that of Medicaid patients and uninsured patients—remaining at about 10% from 2004 to 2008.
Negotiation Strategies for Better Compensation

The first step in negotiating is deciding to negotiate at all, Dr. Gebhard says. You must also recognize that many employers initially offer a lower compensation package because they expect negotiation to occur.
“You should have the mindset that everything is negotiable,” she says. “You have things to offer them and they have things to offer you, and it’s usually somewhere in between where you land.”
To prepare, a hospitalist should at minimum know what the local expectations are in pay, Dr. Fisher says. You might want to consider hiring a physician coach to learn effective negotiating strategies, Dr. Gebhard adds. Role-playing negotiation situations with a more experienced hospitalist can help, Dr. Reich says, as can attending negotiation skills workshops offered by SHM, the American Medical Women’s Association, and the American College of Physician Executives.
“It’s a matter of training people to feel negotiating is not self-serving or asking for more than what you’re valued at,” Dr. Fisher says. “It’s instead placing a value that’s appropriate and feeling confident that you’re asking for something that others in your same position would be asking for.”
Compensation isn’t the only negotiating point. “How much you’re worth is how many resources they’re going to invest in you so you can do the best job possible,” Dr. Brodsky says. “If you have adequate resources, then it’s much easier to bring yourself into a flexible situation because you’re getting what you need fairly. You can make the job look the way you want it to look while giving your employer fair value.”
Because people expect women to be communally interested rather than self-interested, a female hospitalist might want to approach negotiating from the standpoint of the common good of her family or the company, Dr. Gault says. “These sorts of requests aren’t met with surprise or negative judgment as much,” she says.
Nonetheless, women must be prepared for defeat.
“I think women should negotiate more. Not so much because it will be a successful strategy, but because in order to support one another, women have to get used to doing it,” Dr. Gault says. “We have to be willing to take the risk so that our perceptions and our ideas about what women should or shouldn’t do gradually shift over time.”
The first step in negotiating is deciding to negotiate at all, Dr. Gebhard says. You must also recognize that many employers initially offer a lower compensation package because they expect negotiation to occur.
“You should have the mindset that everything is negotiable,” she says. “You have things to offer them and they have things to offer you, and it’s usually somewhere in between where you land.”
To prepare, a hospitalist should at minimum know what the local expectations are in pay, Dr. Fisher says. You might want to consider hiring a physician coach to learn effective negotiating strategies, Dr. Gebhard adds. Role-playing negotiation situations with a more experienced hospitalist can help, Dr. Reich says, as can attending negotiation skills workshops offered by SHM, the American Medical Women’s Association, and the American College of Physician Executives.
“It’s a matter of training people to feel negotiating is not self-serving or asking for more than what you’re valued at,” Dr. Fisher says. “It’s instead placing a value that’s appropriate and feeling confident that you’re asking for something that others in your same position would be asking for.”
Compensation isn’t the only negotiating point. “How much you’re worth is how many resources they’re going to invest in you so you can do the best job possible,” Dr. Brodsky says. “If you have adequate resources, then it’s much easier to bring yourself into a flexible situation because you’re getting what you need fairly. You can make the job look the way you want it to look while giving your employer fair value.”
Because people expect women to be communally interested rather than self-interested, a female hospitalist might want to approach negotiating from the standpoint of the common good of her family or the company, Dr. Gault says. “These sorts of requests aren’t met with surprise or negative judgment as much,” she says.
Nonetheless, women must be prepared for defeat.
“I think women should negotiate more. Not so much because it will be a successful strategy, but because in order to support one another, women have to get used to doing it,” Dr. Gault says. “We have to be willing to take the risk so that our perceptions and our ideas about what women should or shouldn’t do gradually shift over time.”
The first step in negotiating is deciding to negotiate at all, Dr. Gebhard says. You must also recognize that many employers initially offer a lower compensation package because they expect negotiation to occur.
“You should have the mindset that everything is negotiable,” she says. “You have things to offer them and they have things to offer you, and it’s usually somewhere in between where you land.”
To prepare, a hospitalist should at minimum know what the local expectations are in pay, Dr. Fisher says. You might want to consider hiring a physician coach to learn effective negotiating strategies, Dr. Gebhard adds. Role-playing negotiation situations with a more experienced hospitalist can help, Dr. Reich says, as can attending negotiation skills workshops offered by SHM, the American Medical Women’s Association, and the American College of Physician Executives.
“It’s a matter of training people to feel negotiating is not self-serving or asking for more than what you’re valued at,” Dr. Fisher says. “It’s instead placing a value that’s appropriate and feeling confident that you’re asking for something that others in your same position would be asking for.”
Compensation isn’t the only negotiating point. “How much you’re worth is how many resources they’re going to invest in you so you can do the best job possible,” Dr. Brodsky says. “If you have adequate resources, then it’s much easier to bring yourself into a flexible situation because you’re getting what you need fairly. You can make the job look the way you want it to look while giving your employer fair value.”
Because people expect women to be communally interested rather than self-interested, a female hospitalist might want to approach negotiating from the standpoint of the common good of her family or the company, Dr. Gault says. “These sorts of requests aren’t met with surprise or negative judgment as much,” she says.
Nonetheless, women must be prepared for defeat.
“I think women should negotiate more. Not so much because it will be a successful strategy, but because in order to support one another, women have to get used to doing it,” Dr. Gault says. “We have to be willing to take the risk so that our perceptions and our ideas about what women should or shouldn’t do gradually shift over time.”
Online Exclusive: TK
Enter text here
Enter text here
Enter text here
Patient Experiences of Hospital Discharge
The transition from hospital to home is a complex event offering multiple provider‐identified opportunities to improve healthcare quality.18 Centering care delivery around patient needs and preferences is both inherently valuable and linked with better outcomes.9
The Care Transitions Measure (CTM) identifies 4 domains of patient experience related to hospital discharge: information transfer, patient and caregiver preparation, self‐management support, and empowerment to assert preferences.10 It discriminates between patients who do or do not experience a subsequent readmission or emergency room visit and between levels of care coordination.11 Quality indicators like the CTM are important tools for systematic healthcare improvement, but they provide a limited understanding of patient experiences, which can drive the transformation of systems.12, 13
With the exception of patients with a few specific clinical conditions, relatively little is known about how adult patients perceive the hospital‐to‐home transition.1417 They recall receiving discharge instructions but lack details about what to do if problems arise.18 They may lack important information despite receiving instruction.19 Caregivers report problems related to emotional support, discharge planning, and family participation,20 and patients and caregivers express anxiety, confusion, a sense of abandonment by the healthcare system, and the perception that their preferences are disregarded.21
As part of ongoing quality improvement activities, we sought to develop a richly detailed, patient‐centered view of the hospital‐to‐home transition. Our purpose was to understand patient and caregiver experiences during this pivotal healthcare experience.
METHODS
We used an applied ethnographic approach,22 conducting participant observation and video recording in‐depth, semi‐structured interviews in Kaiser Permanente Southern California, Colorado, and Hawaii. The United States' largest, private, not‐for‐profit integrated healthcare delivery system, Kaiser Permanente addresses all health needs for more than 8.9 million members.
To balance the pragmatic imperatives of quality improvement with obtaining enough information to understand patient experiences, we planned a sample of 24 patients across 3 settings with a mix of resource‐intensive and less‐intensive healthcare needs. We defined resource‐intensive needs as occurring among patients aged 65 or older with 3 or more chronic conditions. We asked hospital staff to identify patients by level of need and variety in diagnoses and illness severity, planned or unplanned hospitalizations, age, and ability to self manage. Reasons for admission included joint replacement, acute appendicitis, chronic illness exacerbation, complications of cancer chemotherapy, and others. We included patients who were inpatients or discharged no more than 3 weeks before interview. We excluded those under the age of 18 or discharged to non‐home settings. The project took place between September and November of 2008; 24 patients, half of whom were male, gave written informed consent for video recordings and authorization to distribute protected health information throughout and beyond Kaiser Permanente for quality improvement and educational purposes. Participants took part in interviews and observations lasting 1 to 3 hours; caregivers and family members participated in 9 instances.
Two or 3 observers attended each interview, which took place in the hospital on discharge day, at postdischarge appointments, or in patients' homes. Open‐ended questions prompted broad‐ranging inquiry into patients' lives, medical history, hospitalization experience, medications, care network, challenges, personal goals, and inner experience. Some questions were adapted and expanded from the CTM; others were prompts to demonstrate activities (eg, Can you show us how you organize your medications?). In addition to interviewing patients and caregivers, we observed interactions between patients, families, and hospital staff before discharge. We also observed patients and caregivers at home and when interacting with outpatient primary care providers. The purpose of observation was to understand the context of patient and caregiver experiences and to identify consistencies or discrepancies with their descriptions of experiences. (see Supporting Information In‐Home Interview Guide in the online version of this article)
Data included field notes and video recordings. In addition, observers summarized their strongest daily impressions as brief team stories that were shared with the observation team, local operations staff, and Kaiser Permanente national subject matter experts.23 Consistent with a grounded theory approach, interviews were professionally transcribed and qualitatively analyzed by multiple observers in iterative stages to develop broad domains of patient experiences.24 We clustered similar experiences and identified exemplar statements and behaviors. Team stories were analyzed separately, using a similar process. We reviewed recorded interviews to refine our emerging understanding of patient and caregiver experiences and discussed our observations and impressions about each domain. To maximize internal validity, an independent researcher who did not attend the interviews reviewed the transcripts and coding and participated in final qualitative analysis. Institutional review board approval was not required for this quality improvement project.
RESULTS
Patients and caregivers expressed or demonstrated 6 domains of experience as they transitioned from hospital to home (Table 1).
| Need | Key Observations |
|---|---|
| Translating knowledge into safe, health‐promoting actions at home | Even when patients and caregivers believe they have all needed information before discharge, they often find later that they are lacking knowledge or cannot translate it into contextually appropriate actions. |
| Patients and caregivers may inaccurately perceive that they have successfully translated knowledge into safe, health‐promoting actions. | |
| The day of discharge may not be the optimal time for learning. | |
| Inclusion of caregivers at every step of the transition process | Caregivers are integrally involved in the care for many patients. |
| Discharge teaching does not optimally include caregivers. | |
| Having readily available problem‐solving resources | Questions normally arise after the transition home as patients and caregivers engage in ongoing care activities. |
| Even patients and caregivers successfully providing care at home may need help interpreting experiences. | |
| Feeling connected to and trusting providers | Patients and caregivers highly value a feeling of being connected to providers, typically in the context of ongoing relationships. |
| Providers sometimes miss opportunities to connect with patients. | |
| Although investing in building connections with patients is time‐consuming for providers, patients may disregard communication unless it occurs. | |
| Transitioning from illness‐defined experience to normal life | Patients and caregivers want to return to a sense of normal life as quickly as possible. |
| This desire may interfere with the ability to absorb information and translate it, to prioritize healthcare needs, or to accurately assess the risk in a situation. | |
| Anticipating needs at home and making arrangements to meet them | Patients and caregivers require many types of help, but some may have trouble reconciling the need for assistance with the desire to return to a normal life. |
| Patients and caregivers find it stressful when needed arrangements have not been made. | |
| Some needed arrangements do not pertain strictly to healthcare (eg, help at home, meals). |
Translating Knowledge Into Safe, Health‐Promoting Actions at Home
A primary activity on discharge day was patient education provided by hospital staff. Topics included health conditions, medications, resources, activity, diet, equipment, supplies, and procedures. A nurse typically reviewed written instructions with the patient; the process ranged from thoughtful conversations to cursory recitation of printed information. Teaching was often sandwiched between other activities, and some staff members appeared pressured to complete it.
Patients and caregivers generally reported having all the information they needed; however, when we observed them at home, we noted that translating knowledge into safe, health‐promoting actions was a separate step. A common example was medication management. Patients or caregivers often rewrote the discharge medication list, grouping medications by purpose or creating charts of when to take each one. Patients and caregivers developed varying and somewhat complex systems for home medication management. For example, 1 patient taking 16 medications filled five 7‐day pillboxes each week; from these, he filled a tiny mug 5 times a day, placing it where it would remind him to take his medications. Patients interviewed about their medications at home often expressed uncertainty about their understanding of the medications and about how and why they were taking them.
When procedures were involved, such as dressing changes or administering intravenous (IV) solutions, in‐hospital teaching didn't always translate smoothly into safe action at home. A man who learned to administer total parenteral nutrition in the hospital found his first at‐home session unexpectedly challenging: I just got home and was behind schedule hooking up to the machine. I'm thinking, Which (tube) goes where? and getting real tired. I looked at the sheets. They have all the information you need, but it's too much for a tired person. I didn't want to read, and the pictures weren't clear, and I thought, I'll just try to remember what they said. (Patient #9)
We directly observed patients and caregivers failing to translate knowledge into safe, health‐promoting actions at home. Two days after discharge following a total knee replacement, a patient navigated a flight of stairs with a walker. In another instance, a caregiver hung an IV on a coat hanger hooked precariously to a mailbox as children raced around the room. An older man described strengthening and mobility exercises as instructed by his physical therapist but didn't perform them. Their reasoning was often unclear. For instance, after a nurse reviewed a list of discharge medications and left the room, despite verbal agreement with the instructions, the patient commented: Eight pills are too many. I'll take 3 today and 3 tomorrow and see how I feel. (Patient #27)
Inclusion of caregivers at Every Step of the Transition Process
After discharge, caregivers helped with or took responsibility for managing medications, wound care, administering intravenous antibiotics, adjusting diets, filling prescriptions, obtaining medical supplies and equipment, taking vital signs, interpreting signs and symptoms, monitoring health indicators, deciding who and when to call, and advocating for patients. When patients required hands‐on care tasks, such as dressing changes or intravenous medications, caregivers typically received instruction from hospital staff before discharge.
However, in many cases, including caregivers in discharge teaching appeared to be a low priority. In several instances, caregivers were unable to speak directly with a physician before the patient's discharge: I was hoping I could do that before she came home. I know it's hard to get hold of the doctors, but I wanted to know what to expect. (Caregiver #24)
Even when a caregiver was present, hospital staff frequently directed teaching exclusively toward the patient. For example, a nurse and patient sat side‐by‐side to review instructions; the highly motivated caregiver, seated across the room due to lack of space, was unable to see the written material. The integral role of caregivers in helping patients at home contrasted with their often peripheral role in in‐hospital transition processes.
Having Readily Available Problem‐Solving Resources
Patients and caregivers needed to know who and when to call for more information. They needed to discriminate between providers (eg, when to call a cardiologist vs a primary care provider), identify who to call in an urgent or emergent situation, and know how to access various resources. Some questions arose because patients lacked sufficient detail about what to expect. Even patients who successfully translated knowledge into safe, health‐promoting actions might need help interpreting observations: The wound is closed on top but not underneath, and the WoundVac is supposed to be working on the cells. I'm using the same amount of foam as when I started, so is it really healing? Shouldn't we be using less foam? We don't have anyone to answer the questions. (Patient #22)
Many patients with chronic conditions had direct numbers to their physicians' office; some had important numbers for a doctor or pharmacy on speed‐dial. Many patients and caregivers expressed a sense of pride at knowing how to navigate the healthcare system: I've learned how to get to him. I call downtown, and then they call out to his office. (Patient #8)
Other patients and caregivers gave conflicting messages; they said they knew who to call but provided few specifics: If he needed a nurse, I'd ask for the nurse assistant. I'll just do that or something. (Caregiver #20)
Feeling Connected to and Trusting Providers
For patients and caregivers, a critical aspect of communications with providers was a sense of connection, typically with a particular healthcare provider as part of an ongoing, trusting relationship. Patients expressed feeling respected, that their individual concerns and needs mattered, and that providers appreciated their emotional experiences, listened carefully without seeming rushed, and valued their knowledge. Successful experiences of connection were clearly meaningful to patients: The most important thing is how genuine the doctor is as a person. I pick up on that right away. It bothers me when they're not all there. It amazes me that they have the intellectual prowess to be a doctor, but there are other components that are not quite there yet. My doctor, he's got it all. (Patient #9)
This sense of connection often contrasted with what they may have experienced during short‐term relationships with providers in the hospital. In addition, providers sometimes overlooked opportunities to connect with patients. For instance, a clinic nurse, busy with intake, did not acknowledge a patient's repeated requests for help modifying his diet.
Transitioning From Illness‐Defined Experience to Normal Life
Patients and caregivers described or demonstrated a variety of ways of leavingor wanting to leavethe experience of illness behind, including feeling independent, useful, motivated, confident, and in control; helping others, including other patients in similar circumstances; feeling hopeful about recovery; and maintaining a sense of perspective.
This desire to get back to normal life affected the amount of information patients and caregivers absorbed on discharge day: I was so anxious to leave. I was like, Yeah, yeah, let's do this. I'm all packed. I've got one foot out the door. At home, I got ready to take my medication; the discharge instructions didn't jibe with what the doctor wrote. It was as much my fault as anyone's, because I was rushing to get home. (Patient #16)
Resuming usual activities, sleeping in one's own bed, eating familiar foods, being among friends and neighbors, and intentionally limiting the impact of a health condition on activities were all attempts to quickly restore a sense of normal life. Any milestone on the path to recovery seemed to help: I was so ecstatic in the car coming home. We were back on the road of real life. (Patient #22)
In some instances, the drive to feel a sense of normal life outweighed physical needs. For instance, a young woman with cancer delayed notifying her physician that she had cellulitis because she didn't want to interrupt her usual activities. After several days, she was taken to the emergency room by ambulance and admitted for IV antibiotics.
Anticipating Needs at Home and Making Arrangements to Meet Them
Patients and caregivers anticipated a variety of postdischarge needs. These included hands‐on healthcare tasks, grocery shopping, food preparation, and the like, as well as household maintenance, assistance with pets, and other daily activities that were unrelated to healthcare: I can't do it by myself. I can't just jump in the car and drive. So there are things that you need other people to help you with to get through the day. (Patient #9)
However many patients described a network of support including family members, neighbors, friends, clergy, and others. More than 1 helper was often required. However, patients sometimes found it difficult to reconcile the desire to return to normal life with needs for help. For example, an older woman refused a home health nursing visit for congestive heart failure because she felt it encroached on her independence. The same desire to return to normal life led patients to overestimate their ability to function independently. After a several‐day hospital stay for back surgery, a patient asked a friend to drop him off at home. He then used his walker to get to his car to retrieve a cart for his belongings. He pushed the walker with 1 hand and dragged the cart behind him up 2 floors to his apartment. Once inside, he went to bed, exhausted. In addition, it was sometimes difficult for patients to accurately anticipate needs. For example, a man who returned home alone after surgery suddenly realized his bed was much lower than the hospital bed; he wasn't sure he could get out of it without help.
Transportation home from the hospital and to outpatient appointments after discharge was a frequently identified need, leaving patients making hasty and suboptimal arrangements for a ride home, worried about keeping scheduled appointments, or both.
Patients and caregivers found it stressful when arrangements had not been made: First, we have to worry about getting home, and then I have to go to the medical supply store. What if she has to use the restroom? She has to wait until I get back. (Caregiver #8)
Patients and caregivers described experiences of making arrangements that were largely successful; however, they were also often time‐consuming.
DISCUSSION
Using an ethnographic approach, we identified 6 domains of patient and caregiver experience during the hospital‐to‐home transition. Many needs in these domains arose in the hours and days after patients returned home, and patients and caregivers often found it challenging to meet them. Our project adds a detailed, patient‐centered perspective on the transition from hospital to home.
The domains we identified share some conceptual territory with the dimensions of the Care Transition Measure and the Transitional Care Model,25 but generate a more detailed understanding of patient and caregiver experiences. Key findings include the fact that patients can find it challenging to translate knowledge into contextually appropriate action at home. This confirms some published results. For instance, estimates of outpatient adherence to complicated regimens range from 5% to 77%.2629 Significant opportunities exist to improve the reliability of translating medication instructions into systems that work at home,30 including aligning medication lists with physical aids (such as weekly pill boxes) and explaining medications in patient‐friendly terms. We also found that same‐day discharge teaching can be ineffective because patients are anxious to leave the hospital or staff members feel rushed. Emotion can interfere with cognition, and transferring information shortly before hospital discharge may overlook learning readiness, a fundamental principle of patient education.31, 32 In addition, the desire to return to normal life, coupled with uncertainty about who to call for clarification, can lead patients to simply do the best they can with whatever information they recall.
The literature refers to handoffs of patients from one provider to another as an episode of care is completed, but our findings suggest patients perceive hospitalization as an event occurring within ongoing relationships with the healthcare providers to whom they feel most connected.33, 34 Some patient and caregiver needs could be addressed by actively supporting these relationships during the hospital‐to‐home transition: explicitly acknowledging their importance to patients, ensuring that providers have discharge information, and framing discharge as a transition back to the care of trusted providers. Some of our findings require system‐level changes. Patients and caregivers with unmet transportation needs expressed anxiety about how or if help would materialize. Partnerships with community organizations could enable healthcare organizations to address needs like transportation that fall outside traditional discharge activities but significantly impact patient experiences. In addition, healthcare organizations are rarely designed for straightforward navigation; patient‐centered organizational designs could eliminate the need for patients and caregivers to learn how to navigate. For instance, a single point of contact for recently discharged patients might improve the process of finding help.
Strengths of our quality improvement project include the range of patients we interviewed and in‐depth observations and interviews across settings. Ethnography is ideal for generating a rich understanding of patient experiences, allowing us to observe needs patients did not mention, as well as the physical and emotional context of the transition. Weaknesses of our approach include the fact that the experiences reflected in each category were determined, to some extent, by the questions we asked. This may have constrained the variety of experiences patients reported. In addition, Kaiser Permanente's integrated nature may have affected our findings, although we believe patients and caregivers reported experiences that are likely universal.
Our project occurred in a healthcare system with an integrated electronic health record (EHR). Interventions to improve provider‐identified gaps in the discharge process often rely on information technology.3543 However, information technology does not eliminate continuity of care issues.44 Our EHR is widely used, but available information did not consistently ensure strong enough care coordination or good communication.
Including the patient's primary caregiver in discharge teaching appeared to be a relatively low priority for hospital staff, unless there was a hands‐on care task. Even when a primary caregiver was present, hospital staff frequently directed teaching exclusively toward the patient. The extent to which caregivers feel adequately prepared for their roles and responsibilities needs further exploration.
CONCLUSION
Our applied ethnographic approach reveals that patients experience several challenges while transitioning from hospital to home. Reducing readmissions is likely to remain challenging unless we broaden our understanding of the types of support and coaching required. We are translating our findings into quality improvement activities, conducting pilot projects focusing on risk stratification and tailoring of care, a specialized phone number for recently discharged patients, standardized same‐day discharge summaries to primary care providers, medication reconciliation, follow‐up phone calls, and scheduling appointments before discharge.
- ,,,.Promoting effective transitions of care at hospital discharge: a review of key issues for hospitalists.J Hosp Med.2007;2(5):314–323.
- ,,.Reconcilable differences: correcting medication errors at hospital admission and discharge.Qual Saf Health Care.2006;15(2):122–126.
- ,,,,,.Deficits in communication and information transfer between hospital‐based and primary care physicians: implications for patient safety and continuity of care.JAMA.2007;297(8):831–841.
- ,,,.Interventions to improve medication reconciliation in primary care.Ann Pharmacother.2009;43(10):1667–1675.
- ,,, et al.A quality improvement intervention to facilitate the transition of older adults from three hospitals back to their homes.J Am Geriatr Soc.2009;57(9):1540–1546.
- ,.The effects of a discharge planning and home follow‐up intervention on elders hospitalized with common medical and surgical cardiac conditions.J Cardiovasc Nurs.1999;14(1):44–54.
- ,,,,,.Improved quality in the hospital discharge summary reduces medication errors—LIMM: Landskrona Integrated Medicines Management.Eur J Clin Pharmacol.2009;65(10):1037–1046.
- ,,,,,.Omitted and unjustified medications in the discharge summary.Qual Saf Health Care.2009;18(3):205–208.
- ,,, et al.Evidence suggesting that a chronic disease self‐management program can improve health status while reducing hospitalization: a randomized trial.Med Care.1999;37(1):5–14.
- ,,,,,.Development and testing of a measure designed to assess the quality of care transitions.Int J Integr Care.2002;2:e02.
- ,,.Assessing the quality of preparation for posthospital care from the patient's perspective: the care transitions measure.Med Care.2005;43(3):246–255.
- ,.If you build it, will they come? Designing truly patient‐centered health care.Health Aff (Millwood).29(5):914–920.
- ,,,.Analysis 33:818–829.
- ,,, et al.Identifying factors associated with perceived success in the transition from hospital to home after brain injury.J Head Trauma Rehabil2011;April 25.
- ,,, et al.Perceived participation, experiences from persons with spinal cord injury in their transition period from hospital to home.Int J Rehabil Res.2010;July 31.
- ,,, et al.Reengagement in meaningful occupations during the transition from hospital to home for people with acquired brain injury and their family caregivers.Am J Occup Ther.2009;63:609–620.
- ,,.Hospital to home health care transition: patient, caregiver, and clinician perspectives.West J Nurs Res.2011;Mar 22.
- ,,.Survey on transition from inpatient to outpatient for patients on insulin: what really goes on at home?Endocr Pract.2010;16:785–791.
- ,,, et al.Carepartner experiences with hospital care.Med Care.1999;37:33–38.
- ,,, et al.Transitions of Care Consensus Policy Statement: American College of Physicians–Society of General Internal Medicine–Society of Hospital Medicine–American Geriatrics Society–American College of Emergency Physicians–Society of Academic Emergency Medicine.J Gen Intern Med.2009;24:971–976.
- .Case Study Research: Design and Methods.3rd ed.Thousand Oaks, CA:Sage Publications;2003.
- ,,.Writing Ethnographic Fieldnotes (Chicago Guides to Writing, Editing, and Publishing).Chicago, IL:University of Chicago Press;1995.
- .Learning From Strangers: The Art and Method of Qualitative Interview Studies.New York, NY:Free Press;1995.
- ,,, et al.Comprehensive discharge planning and home follow‐up of hospitalized elders: a randomized clinical trial.JAMA.1999;281(7):613–620.
- ,.Improving medication reconciliation in the 21st century.Curr Drug Saf.2008;3(3):227–229.
- ,,, et al.Trends in adherence to secondary prevention medications in elderly post‐myocardial infarction patients.Pharmacoepidemiol Drug Saf.2008;17:1189–1196.
- ,,, et al.Association between patient beliefs and medication adherence following hospitalization for acute coronary syndrome.Am Heart J.2011;161:855–863.
- ,,, et al.Adherence to statin therapy in elderly patients after hospitalization for coronary revascularization.Am J Cardiol.2011;107:1409–1414.
- ,.Medication use in the transition from hospital to home.Ann Acad Med Singapore.2008;37(2):136–141.
- .A model for assessing learning readiness for self‐direction of care in individuals with spinal cord injuries: a qualitative study.SCI Nurs.2004;21:69–74.
- .Motivational and emotional controls of cognition.Psychol Rev.1967;74(1):29–39.
- .Key legal principles for hospitalists.Dis Mon.2002;48(4):197–206.
- ,,, et al.Transition of care for hospitalized elderly patients—development of a discharge checklist for hospitalists.J Hosp Med.2006;1(6):354–360.
- ,,, et al.Electronic versus dictated hospital discharge summaries: a randomized controlled trial.J Gen Intern Med.2009;24(9):995–1001.
- ,,, et al.Creating a better discharge summary: improvement in quality and timeliness using an electronic discharge summary.J Hosp Med.2009;4(4):219–225.
- ,,,,.Electronic discharge summaries: the current state of play.HIM J.2007;36(3):30–36.
- ,,,.Patient and physician perceptions after software‐assisted hospital discharge: cluster randomized trial.J Hosp Med.2009;4(6):356–363.
- ,,, et al.Effect of an electronic medication reconciliation application and process redesign on potential adverse drug events: a cluster‐randomized trial.Arch Intern Med.2009;169(8):771–780.
- ,,,.Implementing online medication reconciliation at a large academic medical center.Jt Comm J Qual Patient Saf.2008;34(9):499–508.
- ,,,.Medication reconciliation: a necessity in promoting a safe hospital discharge.J Healthc Qual.2006;28(3):12–19.
- ,,,,.Effect of a computerized referral at hospital discharge on cardiac rehabilitation participation rates.J Cardiopulm Rehabil Prev.2009;29(6):365–369.
- ,,, et al.Implementation of an electronic system for medication reconciliation.Am J Health Syst Pharm.2007;64(4):404–422.
- ,,.Coordination of diabetes care in four delivery models using an electronic health record.Med Care.2009;47(9):993–999.
The transition from hospital to home is a complex event offering multiple provider‐identified opportunities to improve healthcare quality.18 Centering care delivery around patient needs and preferences is both inherently valuable and linked with better outcomes.9
The Care Transitions Measure (CTM) identifies 4 domains of patient experience related to hospital discharge: information transfer, patient and caregiver preparation, self‐management support, and empowerment to assert preferences.10 It discriminates between patients who do or do not experience a subsequent readmission or emergency room visit and between levels of care coordination.11 Quality indicators like the CTM are important tools for systematic healthcare improvement, but they provide a limited understanding of patient experiences, which can drive the transformation of systems.12, 13
With the exception of patients with a few specific clinical conditions, relatively little is known about how adult patients perceive the hospital‐to‐home transition.1417 They recall receiving discharge instructions but lack details about what to do if problems arise.18 They may lack important information despite receiving instruction.19 Caregivers report problems related to emotional support, discharge planning, and family participation,20 and patients and caregivers express anxiety, confusion, a sense of abandonment by the healthcare system, and the perception that their preferences are disregarded.21
As part of ongoing quality improvement activities, we sought to develop a richly detailed, patient‐centered view of the hospital‐to‐home transition. Our purpose was to understand patient and caregiver experiences during this pivotal healthcare experience.
METHODS
We used an applied ethnographic approach,22 conducting participant observation and video recording in‐depth, semi‐structured interviews in Kaiser Permanente Southern California, Colorado, and Hawaii. The United States' largest, private, not‐for‐profit integrated healthcare delivery system, Kaiser Permanente addresses all health needs for more than 8.9 million members.
To balance the pragmatic imperatives of quality improvement with obtaining enough information to understand patient experiences, we planned a sample of 24 patients across 3 settings with a mix of resource‐intensive and less‐intensive healthcare needs. We defined resource‐intensive needs as occurring among patients aged 65 or older with 3 or more chronic conditions. We asked hospital staff to identify patients by level of need and variety in diagnoses and illness severity, planned or unplanned hospitalizations, age, and ability to self manage. Reasons for admission included joint replacement, acute appendicitis, chronic illness exacerbation, complications of cancer chemotherapy, and others. We included patients who were inpatients or discharged no more than 3 weeks before interview. We excluded those under the age of 18 or discharged to non‐home settings. The project took place between September and November of 2008; 24 patients, half of whom were male, gave written informed consent for video recordings and authorization to distribute protected health information throughout and beyond Kaiser Permanente for quality improvement and educational purposes. Participants took part in interviews and observations lasting 1 to 3 hours; caregivers and family members participated in 9 instances.
Two or 3 observers attended each interview, which took place in the hospital on discharge day, at postdischarge appointments, or in patients' homes. Open‐ended questions prompted broad‐ranging inquiry into patients' lives, medical history, hospitalization experience, medications, care network, challenges, personal goals, and inner experience. Some questions were adapted and expanded from the CTM; others were prompts to demonstrate activities (eg, Can you show us how you organize your medications?). In addition to interviewing patients and caregivers, we observed interactions between patients, families, and hospital staff before discharge. We also observed patients and caregivers at home and when interacting with outpatient primary care providers. The purpose of observation was to understand the context of patient and caregiver experiences and to identify consistencies or discrepancies with their descriptions of experiences. (see Supporting Information In‐Home Interview Guide in the online version of this article)
Data included field notes and video recordings. In addition, observers summarized their strongest daily impressions as brief team stories that were shared with the observation team, local operations staff, and Kaiser Permanente national subject matter experts.23 Consistent with a grounded theory approach, interviews were professionally transcribed and qualitatively analyzed by multiple observers in iterative stages to develop broad domains of patient experiences.24 We clustered similar experiences and identified exemplar statements and behaviors. Team stories were analyzed separately, using a similar process. We reviewed recorded interviews to refine our emerging understanding of patient and caregiver experiences and discussed our observations and impressions about each domain. To maximize internal validity, an independent researcher who did not attend the interviews reviewed the transcripts and coding and participated in final qualitative analysis. Institutional review board approval was not required for this quality improvement project.
RESULTS
Patients and caregivers expressed or demonstrated 6 domains of experience as they transitioned from hospital to home (Table 1).
| Need | Key Observations |
|---|---|
| Translating knowledge into safe, health‐promoting actions at home | Even when patients and caregivers believe they have all needed information before discharge, they often find later that they are lacking knowledge or cannot translate it into contextually appropriate actions. |
| Patients and caregivers may inaccurately perceive that they have successfully translated knowledge into safe, health‐promoting actions. | |
| The day of discharge may not be the optimal time for learning. | |
| Inclusion of caregivers at every step of the transition process | Caregivers are integrally involved in the care for many patients. |
| Discharge teaching does not optimally include caregivers. | |
| Having readily available problem‐solving resources | Questions normally arise after the transition home as patients and caregivers engage in ongoing care activities. |
| Even patients and caregivers successfully providing care at home may need help interpreting experiences. | |
| Feeling connected to and trusting providers | Patients and caregivers highly value a feeling of being connected to providers, typically in the context of ongoing relationships. |
| Providers sometimes miss opportunities to connect with patients. | |
| Although investing in building connections with patients is time‐consuming for providers, patients may disregard communication unless it occurs. | |
| Transitioning from illness‐defined experience to normal life | Patients and caregivers want to return to a sense of normal life as quickly as possible. |
| This desire may interfere with the ability to absorb information and translate it, to prioritize healthcare needs, or to accurately assess the risk in a situation. | |
| Anticipating needs at home and making arrangements to meet them | Patients and caregivers require many types of help, but some may have trouble reconciling the need for assistance with the desire to return to a normal life. |
| Patients and caregivers find it stressful when needed arrangements have not been made. | |
| Some needed arrangements do not pertain strictly to healthcare (eg, help at home, meals). |
Translating Knowledge Into Safe, Health‐Promoting Actions at Home
A primary activity on discharge day was patient education provided by hospital staff. Topics included health conditions, medications, resources, activity, diet, equipment, supplies, and procedures. A nurse typically reviewed written instructions with the patient; the process ranged from thoughtful conversations to cursory recitation of printed information. Teaching was often sandwiched between other activities, and some staff members appeared pressured to complete it.
Patients and caregivers generally reported having all the information they needed; however, when we observed them at home, we noted that translating knowledge into safe, health‐promoting actions was a separate step. A common example was medication management. Patients or caregivers often rewrote the discharge medication list, grouping medications by purpose or creating charts of when to take each one. Patients and caregivers developed varying and somewhat complex systems for home medication management. For example, 1 patient taking 16 medications filled five 7‐day pillboxes each week; from these, he filled a tiny mug 5 times a day, placing it where it would remind him to take his medications. Patients interviewed about their medications at home often expressed uncertainty about their understanding of the medications and about how and why they were taking them.
When procedures were involved, such as dressing changes or administering intravenous (IV) solutions, in‐hospital teaching didn't always translate smoothly into safe action at home. A man who learned to administer total parenteral nutrition in the hospital found his first at‐home session unexpectedly challenging: I just got home and was behind schedule hooking up to the machine. I'm thinking, Which (tube) goes where? and getting real tired. I looked at the sheets. They have all the information you need, but it's too much for a tired person. I didn't want to read, and the pictures weren't clear, and I thought, I'll just try to remember what they said. (Patient #9)
We directly observed patients and caregivers failing to translate knowledge into safe, health‐promoting actions at home. Two days after discharge following a total knee replacement, a patient navigated a flight of stairs with a walker. In another instance, a caregiver hung an IV on a coat hanger hooked precariously to a mailbox as children raced around the room. An older man described strengthening and mobility exercises as instructed by his physical therapist but didn't perform them. Their reasoning was often unclear. For instance, after a nurse reviewed a list of discharge medications and left the room, despite verbal agreement with the instructions, the patient commented: Eight pills are too many. I'll take 3 today and 3 tomorrow and see how I feel. (Patient #27)
Inclusion of caregivers at Every Step of the Transition Process
After discharge, caregivers helped with or took responsibility for managing medications, wound care, administering intravenous antibiotics, adjusting diets, filling prescriptions, obtaining medical supplies and equipment, taking vital signs, interpreting signs and symptoms, monitoring health indicators, deciding who and when to call, and advocating for patients. When patients required hands‐on care tasks, such as dressing changes or intravenous medications, caregivers typically received instruction from hospital staff before discharge.
However, in many cases, including caregivers in discharge teaching appeared to be a low priority. In several instances, caregivers were unable to speak directly with a physician before the patient's discharge: I was hoping I could do that before she came home. I know it's hard to get hold of the doctors, but I wanted to know what to expect. (Caregiver #24)
Even when a caregiver was present, hospital staff frequently directed teaching exclusively toward the patient. For example, a nurse and patient sat side‐by‐side to review instructions; the highly motivated caregiver, seated across the room due to lack of space, was unable to see the written material. The integral role of caregivers in helping patients at home contrasted with their often peripheral role in in‐hospital transition processes.
Having Readily Available Problem‐Solving Resources
Patients and caregivers needed to know who and when to call for more information. They needed to discriminate between providers (eg, when to call a cardiologist vs a primary care provider), identify who to call in an urgent or emergent situation, and know how to access various resources. Some questions arose because patients lacked sufficient detail about what to expect. Even patients who successfully translated knowledge into safe, health‐promoting actions might need help interpreting observations: The wound is closed on top but not underneath, and the WoundVac is supposed to be working on the cells. I'm using the same amount of foam as when I started, so is it really healing? Shouldn't we be using less foam? We don't have anyone to answer the questions. (Patient #22)
Many patients with chronic conditions had direct numbers to their physicians' office; some had important numbers for a doctor or pharmacy on speed‐dial. Many patients and caregivers expressed a sense of pride at knowing how to navigate the healthcare system: I've learned how to get to him. I call downtown, and then they call out to his office. (Patient #8)
Other patients and caregivers gave conflicting messages; they said they knew who to call but provided few specifics: If he needed a nurse, I'd ask for the nurse assistant. I'll just do that or something. (Caregiver #20)
Feeling Connected to and Trusting Providers
For patients and caregivers, a critical aspect of communications with providers was a sense of connection, typically with a particular healthcare provider as part of an ongoing, trusting relationship. Patients expressed feeling respected, that their individual concerns and needs mattered, and that providers appreciated their emotional experiences, listened carefully without seeming rushed, and valued their knowledge. Successful experiences of connection were clearly meaningful to patients: The most important thing is how genuine the doctor is as a person. I pick up on that right away. It bothers me when they're not all there. It amazes me that they have the intellectual prowess to be a doctor, but there are other components that are not quite there yet. My doctor, he's got it all. (Patient #9)
This sense of connection often contrasted with what they may have experienced during short‐term relationships with providers in the hospital. In addition, providers sometimes overlooked opportunities to connect with patients. For instance, a clinic nurse, busy with intake, did not acknowledge a patient's repeated requests for help modifying his diet.
Transitioning From Illness‐Defined Experience to Normal Life
Patients and caregivers described or demonstrated a variety of ways of leavingor wanting to leavethe experience of illness behind, including feeling independent, useful, motivated, confident, and in control; helping others, including other patients in similar circumstances; feeling hopeful about recovery; and maintaining a sense of perspective.
This desire to get back to normal life affected the amount of information patients and caregivers absorbed on discharge day: I was so anxious to leave. I was like, Yeah, yeah, let's do this. I'm all packed. I've got one foot out the door. At home, I got ready to take my medication; the discharge instructions didn't jibe with what the doctor wrote. It was as much my fault as anyone's, because I was rushing to get home. (Patient #16)
Resuming usual activities, sleeping in one's own bed, eating familiar foods, being among friends and neighbors, and intentionally limiting the impact of a health condition on activities were all attempts to quickly restore a sense of normal life. Any milestone on the path to recovery seemed to help: I was so ecstatic in the car coming home. We were back on the road of real life. (Patient #22)
In some instances, the drive to feel a sense of normal life outweighed physical needs. For instance, a young woman with cancer delayed notifying her physician that she had cellulitis because she didn't want to interrupt her usual activities. After several days, she was taken to the emergency room by ambulance and admitted for IV antibiotics.
Anticipating Needs at Home and Making Arrangements to Meet Them
Patients and caregivers anticipated a variety of postdischarge needs. These included hands‐on healthcare tasks, grocery shopping, food preparation, and the like, as well as household maintenance, assistance with pets, and other daily activities that were unrelated to healthcare: I can't do it by myself. I can't just jump in the car and drive. So there are things that you need other people to help you with to get through the day. (Patient #9)
However many patients described a network of support including family members, neighbors, friends, clergy, and others. More than 1 helper was often required. However, patients sometimes found it difficult to reconcile the desire to return to normal life with needs for help. For example, an older woman refused a home health nursing visit for congestive heart failure because she felt it encroached on her independence. The same desire to return to normal life led patients to overestimate their ability to function independently. After a several‐day hospital stay for back surgery, a patient asked a friend to drop him off at home. He then used his walker to get to his car to retrieve a cart for his belongings. He pushed the walker with 1 hand and dragged the cart behind him up 2 floors to his apartment. Once inside, he went to bed, exhausted. In addition, it was sometimes difficult for patients to accurately anticipate needs. For example, a man who returned home alone after surgery suddenly realized his bed was much lower than the hospital bed; he wasn't sure he could get out of it without help.
Transportation home from the hospital and to outpatient appointments after discharge was a frequently identified need, leaving patients making hasty and suboptimal arrangements for a ride home, worried about keeping scheduled appointments, or both.
Patients and caregivers found it stressful when arrangements had not been made: First, we have to worry about getting home, and then I have to go to the medical supply store. What if she has to use the restroom? She has to wait until I get back. (Caregiver #8)
Patients and caregivers described experiences of making arrangements that were largely successful; however, they were also often time‐consuming.
DISCUSSION
Using an ethnographic approach, we identified 6 domains of patient and caregiver experience during the hospital‐to‐home transition. Many needs in these domains arose in the hours and days after patients returned home, and patients and caregivers often found it challenging to meet them. Our project adds a detailed, patient‐centered perspective on the transition from hospital to home.
The domains we identified share some conceptual territory with the dimensions of the Care Transition Measure and the Transitional Care Model,25 but generate a more detailed understanding of patient and caregiver experiences. Key findings include the fact that patients can find it challenging to translate knowledge into contextually appropriate action at home. This confirms some published results. For instance, estimates of outpatient adherence to complicated regimens range from 5% to 77%.2629 Significant opportunities exist to improve the reliability of translating medication instructions into systems that work at home,30 including aligning medication lists with physical aids (such as weekly pill boxes) and explaining medications in patient‐friendly terms. We also found that same‐day discharge teaching can be ineffective because patients are anxious to leave the hospital or staff members feel rushed. Emotion can interfere with cognition, and transferring information shortly before hospital discharge may overlook learning readiness, a fundamental principle of patient education.31, 32 In addition, the desire to return to normal life, coupled with uncertainty about who to call for clarification, can lead patients to simply do the best they can with whatever information they recall.
The literature refers to handoffs of patients from one provider to another as an episode of care is completed, but our findings suggest patients perceive hospitalization as an event occurring within ongoing relationships with the healthcare providers to whom they feel most connected.33, 34 Some patient and caregiver needs could be addressed by actively supporting these relationships during the hospital‐to‐home transition: explicitly acknowledging their importance to patients, ensuring that providers have discharge information, and framing discharge as a transition back to the care of trusted providers. Some of our findings require system‐level changes. Patients and caregivers with unmet transportation needs expressed anxiety about how or if help would materialize. Partnerships with community organizations could enable healthcare organizations to address needs like transportation that fall outside traditional discharge activities but significantly impact patient experiences. In addition, healthcare organizations are rarely designed for straightforward navigation; patient‐centered organizational designs could eliminate the need for patients and caregivers to learn how to navigate. For instance, a single point of contact for recently discharged patients might improve the process of finding help.
Strengths of our quality improvement project include the range of patients we interviewed and in‐depth observations and interviews across settings. Ethnography is ideal for generating a rich understanding of patient experiences, allowing us to observe needs patients did not mention, as well as the physical and emotional context of the transition. Weaknesses of our approach include the fact that the experiences reflected in each category were determined, to some extent, by the questions we asked. This may have constrained the variety of experiences patients reported. In addition, Kaiser Permanente's integrated nature may have affected our findings, although we believe patients and caregivers reported experiences that are likely universal.
Our project occurred in a healthcare system with an integrated electronic health record (EHR). Interventions to improve provider‐identified gaps in the discharge process often rely on information technology.3543 However, information technology does not eliminate continuity of care issues.44 Our EHR is widely used, but available information did not consistently ensure strong enough care coordination or good communication.
Including the patient's primary caregiver in discharge teaching appeared to be a relatively low priority for hospital staff, unless there was a hands‐on care task. Even when a primary caregiver was present, hospital staff frequently directed teaching exclusively toward the patient. The extent to which caregivers feel adequately prepared for their roles and responsibilities needs further exploration.
CONCLUSION
Our applied ethnographic approach reveals that patients experience several challenges while transitioning from hospital to home. Reducing readmissions is likely to remain challenging unless we broaden our understanding of the types of support and coaching required. We are translating our findings into quality improvement activities, conducting pilot projects focusing on risk stratification and tailoring of care, a specialized phone number for recently discharged patients, standardized same‐day discharge summaries to primary care providers, medication reconciliation, follow‐up phone calls, and scheduling appointments before discharge.
The transition from hospital to home is a complex event offering multiple provider‐identified opportunities to improve healthcare quality.18 Centering care delivery around patient needs and preferences is both inherently valuable and linked with better outcomes.9
The Care Transitions Measure (CTM) identifies 4 domains of patient experience related to hospital discharge: information transfer, patient and caregiver preparation, self‐management support, and empowerment to assert preferences.10 It discriminates between patients who do or do not experience a subsequent readmission or emergency room visit and between levels of care coordination.11 Quality indicators like the CTM are important tools for systematic healthcare improvement, but they provide a limited understanding of patient experiences, which can drive the transformation of systems.12, 13
With the exception of patients with a few specific clinical conditions, relatively little is known about how adult patients perceive the hospital‐to‐home transition.1417 They recall receiving discharge instructions but lack details about what to do if problems arise.18 They may lack important information despite receiving instruction.19 Caregivers report problems related to emotional support, discharge planning, and family participation,20 and patients and caregivers express anxiety, confusion, a sense of abandonment by the healthcare system, and the perception that their preferences are disregarded.21
As part of ongoing quality improvement activities, we sought to develop a richly detailed, patient‐centered view of the hospital‐to‐home transition. Our purpose was to understand patient and caregiver experiences during this pivotal healthcare experience.
METHODS
We used an applied ethnographic approach,22 conducting participant observation and video recording in‐depth, semi‐structured interviews in Kaiser Permanente Southern California, Colorado, and Hawaii. The United States' largest, private, not‐for‐profit integrated healthcare delivery system, Kaiser Permanente addresses all health needs for more than 8.9 million members.
To balance the pragmatic imperatives of quality improvement with obtaining enough information to understand patient experiences, we planned a sample of 24 patients across 3 settings with a mix of resource‐intensive and less‐intensive healthcare needs. We defined resource‐intensive needs as occurring among patients aged 65 or older with 3 or more chronic conditions. We asked hospital staff to identify patients by level of need and variety in diagnoses and illness severity, planned or unplanned hospitalizations, age, and ability to self manage. Reasons for admission included joint replacement, acute appendicitis, chronic illness exacerbation, complications of cancer chemotherapy, and others. We included patients who were inpatients or discharged no more than 3 weeks before interview. We excluded those under the age of 18 or discharged to non‐home settings. The project took place between September and November of 2008; 24 patients, half of whom were male, gave written informed consent for video recordings and authorization to distribute protected health information throughout and beyond Kaiser Permanente for quality improvement and educational purposes. Participants took part in interviews and observations lasting 1 to 3 hours; caregivers and family members participated in 9 instances.
Two or 3 observers attended each interview, which took place in the hospital on discharge day, at postdischarge appointments, or in patients' homes. Open‐ended questions prompted broad‐ranging inquiry into patients' lives, medical history, hospitalization experience, medications, care network, challenges, personal goals, and inner experience. Some questions were adapted and expanded from the CTM; others were prompts to demonstrate activities (eg, Can you show us how you organize your medications?). In addition to interviewing patients and caregivers, we observed interactions between patients, families, and hospital staff before discharge. We also observed patients and caregivers at home and when interacting with outpatient primary care providers. The purpose of observation was to understand the context of patient and caregiver experiences and to identify consistencies or discrepancies with their descriptions of experiences. (see Supporting Information In‐Home Interview Guide in the online version of this article)
Data included field notes and video recordings. In addition, observers summarized their strongest daily impressions as brief team stories that were shared with the observation team, local operations staff, and Kaiser Permanente national subject matter experts.23 Consistent with a grounded theory approach, interviews were professionally transcribed and qualitatively analyzed by multiple observers in iterative stages to develop broad domains of patient experiences.24 We clustered similar experiences and identified exemplar statements and behaviors. Team stories were analyzed separately, using a similar process. We reviewed recorded interviews to refine our emerging understanding of patient and caregiver experiences and discussed our observations and impressions about each domain. To maximize internal validity, an independent researcher who did not attend the interviews reviewed the transcripts and coding and participated in final qualitative analysis. Institutional review board approval was not required for this quality improvement project.
RESULTS
Patients and caregivers expressed or demonstrated 6 domains of experience as they transitioned from hospital to home (Table 1).
| Need | Key Observations |
|---|---|
| Translating knowledge into safe, health‐promoting actions at home | Even when patients and caregivers believe they have all needed information before discharge, they often find later that they are lacking knowledge or cannot translate it into contextually appropriate actions. |
| Patients and caregivers may inaccurately perceive that they have successfully translated knowledge into safe, health‐promoting actions. | |
| The day of discharge may not be the optimal time for learning. | |
| Inclusion of caregivers at every step of the transition process | Caregivers are integrally involved in the care for many patients. |
| Discharge teaching does not optimally include caregivers. | |
| Having readily available problem‐solving resources | Questions normally arise after the transition home as patients and caregivers engage in ongoing care activities. |
| Even patients and caregivers successfully providing care at home may need help interpreting experiences. | |
| Feeling connected to and trusting providers | Patients and caregivers highly value a feeling of being connected to providers, typically in the context of ongoing relationships. |
| Providers sometimes miss opportunities to connect with patients. | |
| Although investing in building connections with patients is time‐consuming for providers, patients may disregard communication unless it occurs. | |
| Transitioning from illness‐defined experience to normal life | Patients and caregivers want to return to a sense of normal life as quickly as possible. |
| This desire may interfere with the ability to absorb information and translate it, to prioritize healthcare needs, or to accurately assess the risk in a situation. | |
| Anticipating needs at home and making arrangements to meet them | Patients and caregivers require many types of help, but some may have trouble reconciling the need for assistance with the desire to return to a normal life. |
| Patients and caregivers find it stressful when needed arrangements have not been made. | |
| Some needed arrangements do not pertain strictly to healthcare (eg, help at home, meals). |
Translating Knowledge Into Safe, Health‐Promoting Actions at Home
A primary activity on discharge day was patient education provided by hospital staff. Topics included health conditions, medications, resources, activity, diet, equipment, supplies, and procedures. A nurse typically reviewed written instructions with the patient; the process ranged from thoughtful conversations to cursory recitation of printed information. Teaching was often sandwiched between other activities, and some staff members appeared pressured to complete it.
Patients and caregivers generally reported having all the information they needed; however, when we observed them at home, we noted that translating knowledge into safe, health‐promoting actions was a separate step. A common example was medication management. Patients or caregivers often rewrote the discharge medication list, grouping medications by purpose or creating charts of when to take each one. Patients and caregivers developed varying and somewhat complex systems for home medication management. For example, 1 patient taking 16 medications filled five 7‐day pillboxes each week; from these, he filled a tiny mug 5 times a day, placing it where it would remind him to take his medications. Patients interviewed about their medications at home often expressed uncertainty about their understanding of the medications and about how and why they were taking them.
When procedures were involved, such as dressing changes or administering intravenous (IV) solutions, in‐hospital teaching didn't always translate smoothly into safe action at home. A man who learned to administer total parenteral nutrition in the hospital found his first at‐home session unexpectedly challenging: I just got home and was behind schedule hooking up to the machine. I'm thinking, Which (tube) goes where? and getting real tired. I looked at the sheets. They have all the information you need, but it's too much for a tired person. I didn't want to read, and the pictures weren't clear, and I thought, I'll just try to remember what they said. (Patient #9)
We directly observed patients and caregivers failing to translate knowledge into safe, health‐promoting actions at home. Two days after discharge following a total knee replacement, a patient navigated a flight of stairs with a walker. In another instance, a caregiver hung an IV on a coat hanger hooked precariously to a mailbox as children raced around the room. An older man described strengthening and mobility exercises as instructed by his physical therapist but didn't perform them. Their reasoning was often unclear. For instance, after a nurse reviewed a list of discharge medications and left the room, despite verbal agreement with the instructions, the patient commented: Eight pills are too many. I'll take 3 today and 3 tomorrow and see how I feel. (Patient #27)
Inclusion of caregivers at Every Step of the Transition Process
After discharge, caregivers helped with or took responsibility for managing medications, wound care, administering intravenous antibiotics, adjusting diets, filling prescriptions, obtaining medical supplies and equipment, taking vital signs, interpreting signs and symptoms, monitoring health indicators, deciding who and when to call, and advocating for patients. When patients required hands‐on care tasks, such as dressing changes or intravenous medications, caregivers typically received instruction from hospital staff before discharge.
However, in many cases, including caregivers in discharge teaching appeared to be a low priority. In several instances, caregivers were unable to speak directly with a physician before the patient's discharge: I was hoping I could do that before she came home. I know it's hard to get hold of the doctors, but I wanted to know what to expect. (Caregiver #24)
Even when a caregiver was present, hospital staff frequently directed teaching exclusively toward the patient. For example, a nurse and patient sat side‐by‐side to review instructions; the highly motivated caregiver, seated across the room due to lack of space, was unable to see the written material. The integral role of caregivers in helping patients at home contrasted with their often peripheral role in in‐hospital transition processes.
Having Readily Available Problem‐Solving Resources
Patients and caregivers needed to know who and when to call for more information. They needed to discriminate between providers (eg, when to call a cardiologist vs a primary care provider), identify who to call in an urgent or emergent situation, and know how to access various resources. Some questions arose because patients lacked sufficient detail about what to expect. Even patients who successfully translated knowledge into safe, health‐promoting actions might need help interpreting observations: The wound is closed on top but not underneath, and the WoundVac is supposed to be working on the cells. I'm using the same amount of foam as when I started, so is it really healing? Shouldn't we be using less foam? We don't have anyone to answer the questions. (Patient #22)
Many patients with chronic conditions had direct numbers to their physicians' office; some had important numbers for a doctor or pharmacy on speed‐dial. Many patients and caregivers expressed a sense of pride at knowing how to navigate the healthcare system: I've learned how to get to him. I call downtown, and then they call out to his office. (Patient #8)
Other patients and caregivers gave conflicting messages; they said they knew who to call but provided few specifics: If he needed a nurse, I'd ask for the nurse assistant. I'll just do that or something. (Caregiver #20)
Feeling Connected to and Trusting Providers
For patients and caregivers, a critical aspect of communications with providers was a sense of connection, typically with a particular healthcare provider as part of an ongoing, trusting relationship. Patients expressed feeling respected, that their individual concerns and needs mattered, and that providers appreciated their emotional experiences, listened carefully without seeming rushed, and valued their knowledge. Successful experiences of connection were clearly meaningful to patients: The most important thing is how genuine the doctor is as a person. I pick up on that right away. It bothers me when they're not all there. It amazes me that they have the intellectual prowess to be a doctor, but there are other components that are not quite there yet. My doctor, he's got it all. (Patient #9)
This sense of connection often contrasted with what they may have experienced during short‐term relationships with providers in the hospital. In addition, providers sometimes overlooked opportunities to connect with patients. For instance, a clinic nurse, busy with intake, did not acknowledge a patient's repeated requests for help modifying his diet.
Transitioning From Illness‐Defined Experience to Normal Life
Patients and caregivers described or demonstrated a variety of ways of leavingor wanting to leavethe experience of illness behind, including feeling independent, useful, motivated, confident, and in control; helping others, including other patients in similar circumstances; feeling hopeful about recovery; and maintaining a sense of perspective.
This desire to get back to normal life affected the amount of information patients and caregivers absorbed on discharge day: I was so anxious to leave. I was like, Yeah, yeah, let's do this. I'm all packed. I've got one foot out the door. At home, I got ready to take my medication; the discharge instructions didn't jibe with what the doctor wrote. It was as much my fault as anyone's, because I was rushing to get home. (Patient #16)
Resuming usual activities, sleeping in one's own bed, eating familiar foods, being among friends and neighbors, and intentionally limiting the impact of a health condition on activities were all attempts to quickly restore a sense of normal life. Any milestone on the path to recovery seemed to help: I was so ecstatic in the car coming home. We were back on the road of real life. (Patient #22)
In some instances, the drive to feel a sense of normal life outweighed physical needs. For instance, a young woman with cancer delayed notifying her physician that she had cellulitis because she didn't want to interrupt her usual activities. After several days, she was taken to the emergency room by ambulance and admitted for IV antibiotics.
Anticipating Needs at Home and Making Arrangements to Meet Them
Patients and caregivers anticipated a variety of postdischarge needs. These included hands‐on healthcare tasks, grocery shopping, food preparation, and the like, as well as household maintenance, assistance with pets, and other daily activities that were unrelated to healthcare: I can't do it by myself. I can't just jump in the car and drive. So there are things that you need other people to help you with to get through the day. (Patient #9)
However many patients described a network of support including family members, neighbors, friends, clergy, and others. More than 1 helper was often required. However, patients sometimes found it difficult to reconcile the desire to return to normal life with needs for help. For example, an older woman refused a home health nursing visit for congestive heart failure because she felt it encroached on her independence. The same desire to return to normal life led patients to overestimate their ability to function independently. After a several‐day hospital stay for back surgery, a patient asked a friend to drop him off at home. He then used his walker to get to his car to retrieve a cart for his belongings. He pushed the walker with 1 hand and dragged the cart behind him up 2 floors to his apartment. Once inside, he went to bed, exhausted. In addition, it was sometimes difficult for patients to accurately anticipate needs. For example, a man who returned home alone after surgery suddenly realized his bed was much lower than the hospital bed; he wasn't sure he could get out of it without help.
Transportation home from the hospital and to outpatient appointments after discharge was a frequently identified need, leaving patients making hasty and suboptimal arrangements for a ride home, worried about keeping scheduled appointments, or both.
Patients and caregivers found it stressful when arrangements had not been made: First, we have to worry about getting home, and then I have to go to the medical supply store. What if she has to use the restroom? She has to wait until I get back. (Caregiver #8)
Patients and caregivers described experiences of making arrangements that were largely successful; however, they were also often time‐consuming.
DISCUSSION
Using an ethnographic approach, we identified 6 domains of patient and caregiver experience during the hospital‐to‐home transition. Many needs in these domains arose in the hours and days after patients returned home, and patients and caregivers often found it challenging to meet them. Our project adds a detailed, patient‐centered perspective on the transition from hospital to home.
The domains we identified share some conceptual territory with the dimensions of the Care Transition Measure and the Transitional Care Model,25 but generate a more detailed understanding of patient and caregiver experiences. Key findings include the fact that patients can find it challenging to translate knowledge into contextually appropriate action at home. This confirms some published results. For instance, estimates of outpatient adherence to complicated regimens range from 5% to 77%.2629 Significant opportunities exist to improve the reliability of translating medication instructions into systems that work at home,30 including aligning medication lists with physical aids (such as weekly pill boxes) and explaining medications in patient‐friendly terms. We also found that same‐day discharge teaching can be ineffective because patients are anxious to leave the hospital or staff members feel rushed. Emotion can interfere with cognition, and transferring information shortly before hospital discharge may overlook learning readiness, a fundamental principle of patient education.31, 32 In addition, the desire to return to normal life, coupled with uncertainty about who to call for clarification, can lead patients to simply do the best they can with whatever information they recall.
The literature refers to handoffs of patients from one provider to another as an episode of care is completed, but our findings suggest patients perceive hospitalization as an event occurring within ongoing relationships with the healthcare providers to whom they feel most connected.33, 34 Some patient and caregiver needs could be addressed by actively supporting these relationships during the hospital‐to‐home transition: explicitly acknowledging their importance to patients, ensuring that providers have discharge information, and framing discharge as a transition back to the care of trusted providers. Some of our findings require system‐level changes. Patients and caregivers with unmet transportation needs expressed anxiety about how or if help would materialize. Partnerships with community organizations could enable healthcare organizations to address needs like transportation that fall outside traditional discharge activities but significantly impact patient experiences. In addition, healthcare organizations are rarely designed for straightforward navigation; patient‐centered organizational designs could eliminate the need for patients and caregivers to learn how to navigate. For instance, a single point of contact for recently discharged patients might improve the process of finding help.
Strengths of our quality improvement project include the range of patients we interviewed and in‐depth observations and interviews across settings. Ethnography is ideal for generating a rich understanding of patient experiences, allowing us to observe needs patients did not mention, as well as the physical and emotional context of the transition. Weaknesses of our approach include the fact that the experiences reflected in each category were determined, to some extent, by the questions we asked. This may have constrained the variety of experiences patients reported. In addition, Kaiser Permanente's integrated nature may have affected our findings, although we believe patients and caregivers reported experiences that are likely universal.
Our project occurred in a healthcare system with an integrated electronic health record (EHR). Interventions to improve provider‐identified gaps in the discharge process often rely on information technology.3543 However, information technology does not eliminate continuity of care issues.44 Our EHR is widely used, but available information did not consistently ensure strong enough care coordination or good communication.
Including the patient's primary caregiver in discharge teaching appeared to be a relatively low priority for hospital staff, unless there was a hands‐on care task. Even when a primary caregiver was present, hospital staff frequently directed teaching exclusively toward the patient. The extent to which caregivers feel adequately prepared for their roles and responsibilities needs further exploration.
CONCLUSION
Our applied ethnographic approach reveals that patients experience several challenges while transitioning from hospital to home. Reducing readmissions is likely to remain challenging unless we broaden our understanding of the types of support and coaching required. We are translating our findings into quality improvement activities, conducting pilot projects focusing on risk stratification and tailoring of care, a specialized phone number for recently discharged patients, standardized same‐day discharge summaries to primary care providers, medication reconciliation, follow‐up phone calls, and scheduling appointments before discharge.
- ,,,.Promoting effective transitions of care at hospital discharge: a review of key issues for hospitalists.J Hosp Med.2007;2(5):314–323.
- ,,.Reconcilable differences: correcting medication errors at hospital admission and discharge.Qual Saf Health Care.2006;15(2):122–126.
- ,,,,,.Deficits in communication and information transfer between hospital‐based and primary care physicians: implications for patient safety and continuity of care.JAMA.2007;297(8):831–841.
- ,,,.Interventions to improve medication reconciliation in primary care.Ann Pharmacother.2009;43(10):1667–1675.
- ,,, et al.A quality improvement intervention to facilitate the transition of older adults from three hospitals back to their homes.J Am Geriatr Soc.2009;57(9):1540–1546.
- ,.The effects of a discharge planning and home follow‐up intervention on elders hospitalized with common medical and surgical cardiac conditions.J Cardiovasc Nurs.1999;14(1):44–54.
- ,,,,,.Improved quality in the hospital discharge summary reduces medication errors—LIMM: Landskrona Integrated Medicines Management.Eur J Clin Pharmacol.2009;65(10):1037–1046.
- ,,,,,.Omitted and unjustified medications in the discharge summary.Qual Saf Health Care.2009;18(3):205–208.
- ,,, et al.Evidence suggesting that a chronic disease self‐management program can improve health status while reducing hospitalization: a randomized trial.Med Care.1999;37(1):5–14.
- ,,,,,.Development and testing of a measure designed to assess the quality of care transitions.Int J Integr Care.2002;2:e02.
- ,,.Assessing the quality of preparation for posthospital care from the patient's perspective: the care transitions measure.Med Care.2005;43(3):246–255.
- ,.If you build it, will they come? Designing truly patient‐centered health care.Health Aff (Millwood).29(5):914–920.
- ,,,.Analysis 33:818–829.
- ,,, et al.Identifying factors associated with perceived success in the transition from hospital to home after brain injury.J Head Trauma Rehabil2011;April 25.
- ,,, et al.Perceived participation, experiences from persons with spinal cord injury in their transition period from hospital to home.Int J Rehabil Res.2010;July 31.
- ,,, et al.Reengagement in meaningful occupations during the transition from hospital to home for people with acquired brain injury and their family caregivers.Am J Occup Ther.2009;63:609–620.
- ,,.Hospital to home health care transition: patient, caregiver, and clinician perspectives.West J Nurs Res.2011;Mar 22.
- ,,.Survey on transition from inpatient to outpatient for patients on insulin: what really goes on at home?Endocr Pract.2010;16:785–791.
- ,,, et al.Carepartner experiences with hospital care.Med Care.1999;37:33–38.
- ,,, et al.Transitions of Care Consensus Policy Statement: American College of Physicians–Society of General Internal Medicine–Society of Hospital Medicine–American Geriatrics Society–American College of Emergency Physicians–Society of Academic Emergency Medicine.J Gen Intern Med.2009;24:971–976.
- .Case Study Research: Design and Methods.3rd ed.Thousand Oaks, CA:Sage Publications;2003.
- ,,.Writing Ethnographic Fieldnotes (Chicago Guides to Writing, Editing, and Publishing).Chicago, IL:University of Chicago Press;1995.
- .Learning From Strangers: The Art and Method of Qualitative Interview Studies.New York, NY:Free Press;1995.
- ,,, et al.Comprehensive discharge planning and home follow‐up of hospitalized elders: a randomized clinical trial.JAMA.1999;281(7):613–620.
- ,.Improving medication reconciliation in the 21st century.Curr Drug Saf.2008;3(3):227–229.
- ,,, et al.Trends in adherence to secondary prevention medications in elderly post‐myocardial infarction patients.Pharmacoepidemiol Drug Saf.2008;17:1189–1196.
- ,,, et al.Association between patient beliefs and medication adherence following hospitalization for acute coronary syndrome.Am Heart J.2011;161:855–863.
- ,,, et al.Adherence to statin therapy in elderly patients after hospitalization for coronary revascularization.Am J Cardiol.2011;107:1409–1414.
- ,.Medication use in the transition from hospital to home.Ann Acad Med Singapore.2008;37(2):136–141.
- .A model for assessing learning readiness for self‐direction of care in individuals with spinal cord injuries: a qualitative study.SCI Nurs.2004;21:69–74.
- .Motivational and emotional controls of cognition.Psychol Rev.1967;74(1):29–39.
- .Key legal principles for hospitalists.Dis Mon.2002;48(4):197–206.
- ,,, et al.Transition of care for hospitalized elderly patients—development of a discharge checklist for hospitalists.J Hosp Med.2006;1(6):354–360.
- ,,, et al.Electronic versus dictated hospital discharge summaries: a randomized controlled trial.J Gen Intern Med.2009;24(9):995–1001.
- ,,, et al.Creating a better discharge summary: improvement in quality and timeliness using an electronic discharge summary.J Hosp Med.2009;4(4):219–225.
- ,,,,.Electronic discharge summaries: the current state of play.HIM J.2007;36(3):30–36.
- ,,,.Patient and physician perceptions after software‐assisted hospital discharge: cluster randomized trial.J Hosp Med.2009;4(6):356–363.
- ,,, et al.Effect of an electronic medication reconciliation application and process redesign on potential adverse drug events: a cluster‐randomized trial.Arch Intern Med.2009;169(8):771–780.
- ,,,.Implementing online medication reconciliation at a large academic medical center.Jt Comm J Qual Patient Saf.2008;34(9):499–508.
- ,,,.Medication reconciliation: a necessity in promoting a safe hospital discharge.J Healthc Qual.2006;28(3):12–19.
- ,,,,.Effect of a computerized referral at hospital discharge on cardiac rehabilitation participation rates.J Cardiopulm Rehabil Prev.2009;29(6):365–369.
- ,,, et al.Implementation of an electronic system for medication reconciliation.Am J Health Syst Pharm.2007;64(4):404–422.
- ,,.Coordination of diabetes care in four delivery models using an electronic health record.Med Care.2009;47(9):993–999.
- ,,,.Promoting effective transitions of care at hospital discharge: a review of key issues for hospitalists.J Hosp Med.2007;2(5):314–323.
- ,,.Reconcilable differences: correcting medication errors at hospital admission and discharge.Qual Saf Health Care.2006;15(2):122–126.
- ,,,,,.Deficits in communication and information transfer between hospital‐based and primary care physicians: implications for patient safety and continuity of care.JAMA.2007;297(8):831–841.
- ,,,.Interventions to improve medication reconciliation in primary care.Ann Pharmacother.2009;43(10):1667–1675.
- ,,, et al.A quality improvement intervention to facilitate the transition of older adults from three hospitals back to their homes.J Am Geriatr Soc.2009;57(9):1540–1546.
- ,.The effects of a discharge planning and home follow‐up intervention on elders hospitalized with common medical and surgical cardiac conditions.J Cardiovasc Nurs.1999;14(1):44–54.
- ,,,,,.Improved quality in the hospital discharge summary reduces medication errors—LIMM: Landskrona Integrated Medicines Management.Eur J Clin Pharmacol.2009;65(10):1037–1046.
- ,,,,,.Omitted and unjustified medications in the discharge summary.Qual Saf Health Care.2009;18(3):205–208.
- ,,, et al.Evidence suggesting that a chronic disease self‐management program can improve health status while reducing hospitalization: a randomized trial.Med Care.1999;37(1):5–14.
- ,,,,,.Development and testing of a measure designed to assess the quality of care transitions.Int J Integr Care.2002;2:e02.
- ,,.Assessing the quality of preparation for posthospital care from the patient's perspective: the care transitions measure.Med Care.2005;43(3):246–255.
- ,.If you build it, will they come? Designing truly patient‐centered health care.Health Aff (Millwood).29(5):914–920.
- ,,,.Analysis 33:818–829.
- ,,, et al.Identifying factors associated with perceived success in the transition from hospital to home after brain injury.J Head Trauma Rehabil2011;April 25.
- ,,, et al.Perceived participation, experiences from persons with spinal cord injury in their transition period from hospital to home.Int J Rehabil Res.2010;July 31.
- ,,, et al.Reengagement in meaningful occupations during the transition from hospital to home for people with acquired brain injury and their family caregivers.Am J Occup Ther.2009;63:609–620.
- ,,.Hospital to home health care transition: patient, caregiver, and clinician perspectives.West J Nurs Res.2011;Mar 22.
- ,,.Survey on transition from inpatient to outpatient for patients on insulin: what really goes on at home?Endocr Pract.2010;16:785–791.
- ,,, et al.Carepartner experiences with hospital care.Med Care.1999;37:33–38.
- ,,, et al.Transitions of Care Consensus Policy Statement: American College of Physicians–Society of General Internal Medicine–Society of Hospital Medicine–American Geriatrics Society–American College of Emergency Physicians–Society of Academic Emergency Medicine.J Gen Intern Med.2009;24:971–976.
- .Case Study Research: Design and Methods.3rd ed.Thousand Oaks, CA:Sage Publications;2003.
- ,,.Writing Ethnographic Fieldnotes (Chicago Guides to Writing, Editing, and Publishing).Chicago, IL:University of Chicago Press;1995.
- .Learning From Strangers: The Art and Method of Qualitative Interview Studies.New York, NY:Free Press;1995.
- ,,, et al.Comprehensive discharge planning and home follow‐up of hospitalized elders: a randomized clinical trial.JAMA.1999;281(7):613–620.
- ,.Improving medication reconciliation in the 21st century.Curr Drug Saf.2008;3(3):227–229.
- ,,, et al.Trends in adherence to secondary prevention medications in elderly post‐myocardial infarction patients.Pharmacoepidemiol Drug Saf.2008;17:1189–1196.
- ,,, et al.Association between patient beliefs and medication adherence following hospitalization for acute coronary syndrome.Am Heart J.2011;161:855–863.
- ,,, et al.Adherence to statin therapy in elderly patients after hospitalization for coronary revascularization.Am J Cardiol.2011;107:1409–1414.
- ,.Medication use in the transition from hospital to home.Ann Acad Med Singapore.2008;37(2):136–141.
- .A model for assessing learning readiness for self‐direction of care in individuals with spinal cord injuries: a qualitative study.SCI Nurs.2004;21:69–74.
- .Motivational and emotional controls of cognition.Psychol Rev.1967;74(1):29–39.
- .Key legal principles for hospitalists.Dis Mon.2002;48(4):197–206.
- ,,, et al.Transition of care for hospitalized elderly patients—development of a discharge checklist for hospitalists.J Hosp Med.2006;1(6):354–360.
- ,,, et al.Electronic versus dictated hospital discharge summaries: a randomized controlled trial.J Gen Intern Med.2009;24(9):995–1001.
- ,,, et al.Creating a better discharge summary: improvement in quality and timeliness using an electronic discharge summary.J Hosp Med.2009;4(4):219–225.
- ,,,,.Electronic discharge summaries: the current state of play.HIM J.2007;36(3):30–36.
- ,,,.Patient and physician perceptions after software‐assisted hospital discharge: cluster randomized trial.J Hosp Med.2009;4(6):356–363.
- ,,, et al.Effect of an electronic medication reconciliation application and process redesign on potential adverse drug events: a cluster‐randomized trial.Arch Intern Med.2009;169(8):771–780.
- ,,,.Implementing online medication reconciliation at a large academic medical center.Jt Comm J Qual Patient Saf.2008;34(9):499–508.
- ,,,.Medication reconciliation: a necessity in promoting a safe hospital discharge.J Healthc Qual.2006;28(3):12–19.
- ,,,,.Effect of a computerized referral at hospital discharge on cardiac rehabilitation participation rates.J Cardiopulm Rehabil Prev.2009;29(6):365–369.
- ,,, et al.Implementation of an electronic system for medication reconciliation.Am J Health Syst Pharm.2007;64(4):404–422.
- ,,.Coordination of diabetes care in four delivery models using an electronic health record.Med Care.2009;47(9):993–999.
Copyright © 2012 Society of Hospital Medicine
PCP Referral
Over the past decade, research has demonstrated a value gap in US healthcare, characterized by rapidly rising costs and substandard quality.1, 2 Public reporting of hospital performance data is one of several strategies promoted to help address these deficiencies. To this end, a number of hospital rating services have created Web sites aimed at healthcare consumers.3 These services provide information about multiple aspects of healthcare quality, which in theory might be used by patients when deciding where to seek medical care.
Despite the increasing availability of publicly reported quality data comparing doctors and hospitals, a 2008 survey found that only 14% of Americans have seen and used such information in the past year, a decrease from 2006 (36%).4 A similar study in 2007 found that after seeking input from family and friends, patients generally rely on their primary care physician (PCP) to assist them to make decisions about where to have elective surgery.5 Surprisingly, almost nothing is known about how publicly reported data is used, if at all, by PCPs in the referral of patients to hospitals.
The physician is an important intermediary in the buying process for many healthcare services.6 Tertiary care hospitals depend on physician referrals for much of their patient volume.7 Until the emergence of the hospitalist model of care, most primary care physicians cared for their own hospitalized patients, and thus hospital referral decisions were largely driven by the PCP's admitting privileges. However, following the rapid expansion of the hospitalist movement,8, 9 there has been a sharp decrease in the number of PCPs who provide direct patient care for their hospitalized patients.8 As a result, PCPs may now have more choice in regards to hospital referrals for general medical conditions. Potential factors influencing a PCP's referral decisions might include familiarity with the hospital, care quality, patient convenience, satisfaction with the hospital, or hospital reputation.
Studies of cardiac surgery report cards in New York9 and Pennsylvania,10 conducted in the mid‐1990s, found that cardiologists did not use publicly reported mortality data in referral decisions, nor did they share it with patients. Over the past 2 decades, public reporting has grown exponentially, and now includes many measures of structure, processes, and outcomes for almost all US hospitals, available for free over the Internet. The growth of the patient safety movement and mandated public reporting might also have affected physicians' views about publicly reported quality data. We surveyed primary care physicians to determine the extent to which they use information about hospital quality in their referral decisions for community‐acquired pneumonia, and to identify other factors that might influence referral decisions.
METHODS
We obtained an e‐mail list of primary care physicians from the medical staff offices of all area hospitals within a 10‐mile radius of Springfield, MA (Baystate Medical Center, Holyoke Medical Center, and Mercy Medical Center). Baystate Medical Center is a 659‐bed academic medical center and Level 1 trauma center, while Holyoke and Mercy Medical Center are both 180‐bed acute care hospitals. Physicians were contacted via e‐mail from June through September of 2009, and asked to participate in an anonymous, 10‐minute, online survey accessible through an Internet link (SurveyMonkey.com) about factors influencing a primary care physician's hospital referral choice for a patient with pneumonia. To facilitate participation, we sent 2 follow‐up e‐mail reminders, and respondents who completed the entire survey received a $15 gift card. The study was approved by the institutional review board of Baystate Medical Center and closed to participation on September 23, 2009.
We created the online survey based on previous research7 and approximately 10 key informant interviews. The survey (see Supporting Information, Appendix, in the online version of this article) contained 13 demographic questions and 10 questions based on a case study of pneumonia (Figure 1). The instrument was pilot tested for clarity with a small group of primary care physicians at the author's institution and subsequently modified. We chose pneumonia because it is a common reason for a PCP to make an urgent hospital referral,11 and because there is a well‐established set of quality measures that are publicly reported.12 Unlike elective surgery, for which patients might research hospitals or surgeons on their own, patients with pneumonia would likely rely on their PCP to recommend a hospital for urgent referral. In contrast, PCPs know they will refer a number of pneumonia patients to hospitals each year and therefore might have an interest in comparing the publicly reported quality measures for local hospitals.

Respondents were shown the case study and asked to refer the hypothetical patient to 1 of 4 area hospitals. Respondents were asked to rate (on a 3‐point scale: not at all, somewhat, or very) the importance of the following factors in their referral decision: waiting time in the emergency room, distance traveled by the patient, experience of other patients, severity of patient's illness, patient's insurance, hospital's reputation among other physicians and partners, admitting privileges with a specific hospital, admitting arrangements with a hospitalist group, familiarity with the hospital, availability of subspecialists, quality of subspecialists, nursing quality, nursing staffing ratios, hospital's case volume for pneumonia, publicly available quality measures, patient preference, distance from your practice, shared electronic record system, and quality of hospital discharge summaries. Next, we measured provider's awareness of publicly reported hospital quality data and whether they used such data in referring patients or choosing their own medical care. Specifically, we asked about familiarity with the following 4 Web sites: Massachusetts Quality and Cost (a state‐specific Web site produced by the Massachusetts Executive Office of Health and Human Services)13; Hospital Compare (a Web site developed and maintained by Centers for Medicare and Medicaid Services [CMS] and the Department of Health and Human Services)14; Leapfrog Group (a private, nonprofit organization)15; and Health Grades (a private, for‐profit company).16
We then asked participants to rate the importance of the following performance measures when judging a hospital's performance: antibiotics within 6 hours of arrival to the hospital, appropriate initial antibiotic, blood culture drawn before antibiotics given, smoking cessation advice/counseling, oxygenation assessment, risk‐adjusted mortality, intensive care unit staffing, influenza vaccination, pneumococcal vaccination, Leapfrog's never events,15 volume, Leapfrog safe practices score, cost, computerized physician order entry system, Magnet status,17 and U.S. News & World Report's Best Hospitals designation.18 Lastly, we asked participants to state, using a 3‐point scale (agree, disagree, neutral), their level of agreement that the following factors, adapted from Schneider and Epstein,10 represented limitations of public reporting: 1) risk‐adjusted methods are inadequate to compare hospitals fairly; 2) mortality rates are an incomplete indication of the quality of a hospital's care; 3) hospitals can manipulate the data; and 4) ratings are inaccurate for hospitals with small caseloads.
Factors associated with physicians' knowledge of publicly reported data were analyzed with bivariate analysis. Since all factors are categorical, chi‐square analysis was used for bivariate analysis. No factor had a P value <0.2 on bivariate analysis, thus multiple logistic regression was not performed.
RESULTS
Of 194 primary care physicians who received invitations, 92 responded (response rate of 47%). See Table 1 for respondents' characteristics. All age groups were represented; most were male and between 3554 years of age. Respondents were evenly divided between those who owned their own practices (54%) and those working for a health system (46%). Ninety‐three percent of PCPs maintained admitting privileges (45% to more than 1 hospital), but only 20% continued to admit their own patients. When asked where they would send a hypothetical pneumonia patient, only 4% of PCPs chose a hospital to which they had never had admitting privileges.
| Variable | No. (%) of Respondents |
|---|---|
| Age | |
| 2534 | 5 (5) |
| 3544 | 27 (29) |
| 4554 | 24 (26) |
| >55 | 36 (39) |
| Gender | |
| Male | 65 (71) |
| Female | 27 (29) |
| Years out of medical school | |
| <6 | 6 (7) |
| 610 | 9 (10) |
| 1115 | 17 (18) |
| >15 | 60 (65) |
| % Patients seen who are covered by | |
| Medicaid: Mean (SD) | 28 (26) |
| Medicare: Mean (SD) | 31 (18) |
| Private: Mean (SD) | 40 (25) |
| Number of time doing patient care: Mean (SD) | 85 (23) |
| Number of patients admitted/sent to hospital/mo | |
| <6 | 40 (47) |
| 610 | 25 (29) |
| 1120 | 12 (14) |
| >20 | 8 (9) |
| Practice type | |
| Solo | 13 (15) |
| Single specialty group | 36 (42) |
| Multi‐specialty group | 36 (42) |
| Practice ownership | |
| Independent | 45 (54) |
| Health system | 38 (46) |
| Currently admits own patients | |
| Yes | 17 (20) |
| No | 66 (80) |
| Current hospital admitting privileges | |
| A | 63 (76) |
| B | 41 (49) |
| C | 3 (4) |
| D | 12 (14) |
| None | 6 (7) |
| Other | 2 (2) |
Physician's ratings of the importance of various factors in their referral decision are shown in Figure 2. The following factors were most often considered very important: familiarity with the hospital (70%), patient preference (62%), and admitting arrangements with a hospitalist group (62%). In contrast, only 18% of physicians viewed publicly available hospital quality measures as very important when making a referral decision. Factors most often rated not at all important to participants' decisions were patient insurance (48%), hospital's case volume for pneumonia (48%), and publicly available quality measures (42%).
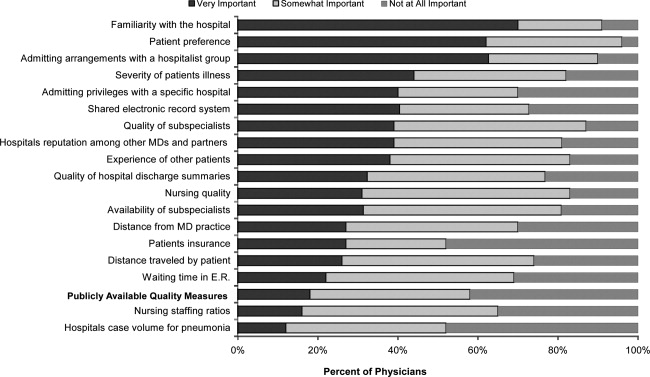
Of the 61% who were aware of Web sites that report hospital quality, most (52%) were familiar with Massachusetts Quality and Cost, while few (27%) were familiar with Hospital Compare. None of the physicians we surveyed reported having used publicly reported quality information when making a referral decision or having discussed such data with their patients. However, 49% stated that publicly reported performance data was somewhat and 10% very important to decisions regarding the medical care they receive. None of the demographic characteristics that we assessed (including age, gender, or years out of medical school) were associated with awareness of publicly reported data in bivariate analyses.
Respondents' ratings of specific quality measures appear in Figure 3. PCPs most often identified the following factors as being very important when judging hospital quality: percent of pneumonia patients given initial antibiotics within 6 hours after arrival (66%), percent of pneumonia patients given the most appropriate initial antibiotic (63%), and percent of pneumonia patients whose initial emergency room (ER) blood culture was performed prior to the administration of the first hospital dose of antibiotics (51%). The factors most often rated not at all important included: U.S. News & World Report's Best Hospitals designation (57%), Magnet Status (42%), and computer physician order entry system (40%).
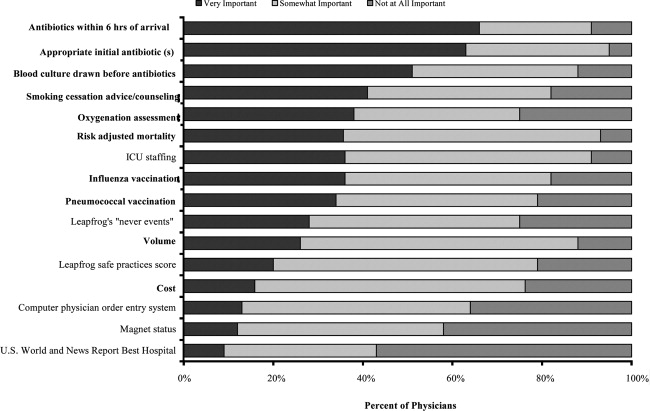
When asked about limitations of publicly reported performance data, 42% agreed that risk‐adjusted methods were inadequate to compare hospitals fairly, 76% agreed that mortality rates were an incomplete indication of the quality of hospitals care, 62% agreed that hospitals could manipulate the data, and 72% agreed that the ratings were inaccurate for hospitals with small caseloads.
DISCUSSION
In 2003, the Hospital Quality Alliance began a voluntary public reporting program of hospital performance measures, for pneumonia, acute myocardial infarction, and congestive heart failure, that was intended to encourage quality improvement activity by hospitals, and to provide patients and referring physicians with information to make better‐informed choices.19 These data are now easily available to the public through a free Web site (
Despite their lack of familiarity with Hospital Compare, it was the quality measures that are reported by Hospital Compare that they identified as the best indicators of hospital quality: appropriate initial antibiotic, antibiotics within 6 hours, and blood cultures performed prior to the administration of antibiotics. In fact, the 5 measures most often cited as very important to judging hospital quality were all measures reported on Hospital Compare.
As the US healthcare system becomes increasingly complex and costly, there is a growing interest in providing patients with physician and hospital performance data to help them select the provider.21 It is postulated that if patients took a more active role in choosing healthcare providers, and were forced to assume greater financial responsibility, then consumerism will force improvements in quality of care while maintaining or even lowering costs.21 However, studies demonstrate that most patients are unaware of performance data and, if they are aware, still value familiarity over quality ratings.4 Moreover, patients rely on the knowledge of their primary care physician to guide them.5
This is the first study we are aware of that examines how primary care physicians use publicly reported quality data in hospital referral decisions. Studies from more than a decade ago found that publicly reported data had minimal impact on referral decisions from cardiologists to cardiac surgeons. A survey of Pennsylvania's cardiologists and cardiac surgeons showed that although 82% were aware of risk‐adjusted mortality rates published for surgeons, only 10% of cardiologists reported these to be very important when evaluating the performance of a cardiothoracic surgeon. Furthermore, 87% of cardiologists stated that mortality and case volume information reported on cardiac surgeons had minimal or no influence on their referral practices.10 In 1997, a survey of cardiologists in New York found that only 38% of respondents reported that risk‐adjusted outcome data had affected their referrals to surgeons very much or somewhat.9 In addition, most authors conclude that public reporting has had little or no effect on market share.22 Despite growth in the number of measures and improved accessibility, our physicians were even less likely to be aware of, or use, publicly reported data than physicians a decade earlier.
Of course, even if public reporting does not influence referral patterns, it could still improve healthcare quality in several ways. First, feedback about performance may focus quality improvement activities in specific areas that represent gaps in care.10 This could take the form of an appeal to professionalism,23 or the desire to preserve one's reputation by not appearing on a list of poor performers.24 Second, hospitals' desire to appear on lists of high performers, such as U.S. News & World Report's hospital rankings, for marketing purposes, might stimulate improvement activities.10 Finally, publicly reported measures could form the basis for pay‐for‐performance incentives that further speed improvement.25
Our study has several limitations. First, our sample size was small and restricted to 1 region of 1 state, and may not be representative of either the state or nation as a whole. Still, our area has a high level of Internet use, and several local hospitals have been at the vanguard of the quality movement, generally scoring above both state and national averages on Hospital Compare. In addition, Massachusetts has made substantial efforts to promote its own public reporting program, and half the surveyed physicians reported being aware of the Massachusetts Quality and Cost Web site. The fact that not a single area physician surveyed used publicly reported data when making referral decisions is sobering. We believe it is unlikely that other areas of the country will have a substantially higher rate of use. Similarly, our response rate was under 50%. Physicians who did not take the survey may have differed in important ways from those who did. Nevertheless, our sample included a broad range of physician ages, practice types, and affiliations. It seems unlikely that those who did not respond would be more inclined to use publicly reported data than those who did. Second, we assessed decision‐making around a single medical condition. Physicians may have used publicly reported data for other decisions. However, the condition we chose was both urgent (as opposed to emergent) and possesses a robust set of publicly reported quality measures. If physicians do not use publicly reported data for this decision, it seems unlikely they would use it for conditions that have fewer reliable measures (eg, gall bladder surgery) or where the choice of hospital is generally made in an ambulance (eg, myocardial infarction). Finally, the low awareness of public reporting made it difficult for some physicians to answer some of the questions regarding publicly reported hospital quality data because they were unfamiliar with the language utilized by the Web sites (eg, magnet status, Leapfrog never events). It is possible that our results may have been altered slightly if a glossary had been provided.
Despite these limitations, our study suggests that more than 6 years after the launch of the Hospital Quality Alliance, primary care physicians do not appear to make use of these data when choosing a hospital for their patients suffering from pneumonia. Instead, they rely on familiarity with a hospital and past relationships. Even though a majority of the physicians surveyed no longer admitted their own patients, they continue to send patients to hospitals where they had privileges. This finding is not surprising, as physicians also cling to familiar therapies, and may be reluctant to prescribe a new medication or perform an unfamiliar procedure, even if it is indicated. Such reliance on familiarity may make physicians feel comfortable, but does not always result in the best care for patients. Acquiring familiarity, however, requires time and effort, something that physicians generally have in short supply; and while there are plenty of industry representatives to overcome physicians' hesitancy to prescribe new treatments, there are no analogous agents to educate physicians about public reporting or to help them overcome hesitancy about trying a new hospital.
Suspicion about the validity of public reporting may also play a role in the physicians' reported behavior. In past studies of cardiac report cards, cardiologists were most concerned that risk adjustment methods were inadequate (77%) and that mortality rates were an incomplete indicator of the quality of surgical care (74%). They were less concerned about manipulation of data (52%) or small caseloads (15%).10 Our physicians were also concerned that mortality rates were an incomplete measure of quality (76%) but less concerned about risk adjustment (42%), perhaps because many structure and process measures are not subject to risk adjustment. In contrast, they were somewhat more concerned that hospitals could manipulate the data (62%), which again may reflect process measures versus mortality statistics. Other reasons for not using the data may include a lack of awareness of the data or how to access it, or a belief that hospitals do not vary in quality.
Interestingly, even though most respondents were not aware of Hospital Compare, they found the information presented there to best reflect the overall hospital quality. Also, while respondents indicated that they did not use publicly reported data when referring patients, almost half of PCPs reported that publicly reported performance data was at least somewhat important in choosing their own medical care. Thus, although public reporting appears not to have reached its full potential, some publicly reported quality measures have clearly entered the consciousness of PCPs. In contrast, other highly touted measures such as computerized physician order entry systems were not appreciated, and popular designations such as U.S. News & World Report's Best Hospitals were least valued, even though 1 area hospital carries this designation. One conclusion might be that CMS should abandon Hospital Compare since neither patients4 nor providers use it. However, public reporting may improve quality in other ways. Moreover, physicians appear interested in the data even if they are not aware of it. Therefore, given the large investment by CMS and individual hospitals in collecting the data required for Hospital Compare, CMS might consider making greater efforts to increase primary care physician awareness of the Hospital Compare Web site. At the same time, high‐performing hospitals may want to communicate their performance scores to local PCPs as part of their marketing strategy. Future studies could assess whether such practices affect physician referral decisions and subsequent market share of high‐performing hospitals.
Acknowledgements
The authors of this study thank Jane Garb for her help with statistical analysis.
- Centers for Medicare and Medicaid Services. National Health Care Expenditures Data.2010. Available at: http://www.2.cms.gov/NationalHealthExpendData/25_NHE_Fact_Sheet.asp. Accessed April 22,year="2010"2010.
- ,,, et al.The quality of health care delivered to adults in the United States.N Engl J Med.2003;348(26):2635–2645.
- ,. The State‐of‐the‐Art of Online Hospital Public Reporting: a Review of Fifty‐One Websites. 2005. Available at: http://www.delmarvafoundation.org/newsAndPublications/reports/documents/WebSummariesFinal9.2.04.pdf. Accessed February 24,2012.
- . Kaiser Family Foundation. 2008 Update on Consumers' Views of Patient Safety and Quality Information. 2010. Available at: http://www.kff.org/kaiserpolls/upload/7819.pdf. Accessed April 20,2010.
- ,,.Choosing where to have major surgery: who makes the decision?Arch Surg.2007;142(3):242–246.
- ,,, et al.Resolving the gatekeeper conundrum: what patients value in primary care and referrals to specialists.JAMA.1999;282(3):261–266.
- ,,,.How physicians make referrals.J Health Care Mark.1993;13(2):6–17.
- ,,,.Growth in the care of older patients by hospitalists in the United States.N Engl J Med.2009;360(11):1102–1112.
- ,,,DeBuono BA. Public release of cardiac surgery outcomes data in New York: what do New York state cardiologists think of it?Am Heart J.1997;134(6):1120–1128.
- ,.Influence of cardiac‐surgery performance reports on referral practices and access to care. A survey of cardiovascular specialists.N Engl J Med.1996;335(4):251–256.
- ,,,,.Primary care summary of the British Thoracic Society Guidelines for the management of community acquired pneumonia in adults: 2009 update. Endorsed by the Royal College of General Practitioners and the Primary Care Respiratory Society UK.Prim Care Respir J.2010;19(1):21–27.
- Hospital Quality Alliance Quality Measures.2010. Available at: http://www.hospitalqualityalliance.org/hospitalqualityalliance/qualitymeasures/qualitymeasures.html. Accessed April 25,year="2010"2010.
- Massachusetts Executive Office of Health and Human Services. Massachusetts Executive Quality and Cost.2010. Available at: http://www.mass.gov/healthcareqc. Accessed February 24,year="2012"2012.
- Centers for Medicare and Medicaid Services. Hospital Compare.2010. Available at: http://www.hospitalcompare.hhs.gov. Accessed April 19,year="2010"2010.
- The Leapfrog Group for Patient Safety.2010. Available at: http://www.leapfroggroup.org/. Accessed April 23,year="2010"2010.
- Health Grades. 2010. Available at: http://www.healthgrades.com. Accessed April 19,2010.
- American Nurses Credentialing Center. Magnet Recognition Program. 2010. Available at: http://www.nursecredentialing.org/Magnet.aspx. Accessed April 15,2010.
- U.S. News 353(3):265–274.
- . US ads push patients to shop for hospitals. USA Today. May 20, 2008. Available at: http://www.usatoday.com/news/health/2008‐05‐20‐Hospitalads_N.htm. Accessed February 24, 2012.
- ,,.How do elderly patients decide where to go for major surgery? Telephone interview survey.BMJ.2005;331(7520):821.
- ,,, et al.Public reporting of cardiac surgery performance: part 1—history, rationale, consequences.Ann Thorac Surg.2011;92(3 suppl):S2–S11.
- ,,.Public reporting of hospital quality: recommendations to benefit patients and hospitals.J Hosp Med.2009;4(9):541–545.
- ,,, et al.When things go wrong: the impact of being a statistical outlier in publicly reported coronary artery bypass graft surgery mortality data.Am J Med Qual.2008;23(2):90–95.
- ,,, et al.Public reporting and pay for performance in hospital quality improvement.N Engl J Med.2007;356(5):486–496.
Over the past decade, research has demonstrated a value gap in US healthcare, characterized by rapidly rising costs and substandard quality.1, 2 Public reporting of hospital performance data is one of several strategies promoted to help address these deficiencies. To this end, a number of hospital rating services have created Web sites aimed at healthcare consumers.3 These services provide information about multiple aspects of healthcare quality, which in theory might be used by patients when deciding where to seek medical care.
Despite the increasing availability of publicly reported quality data comparing doctors and hospitals, a 2008 survey found that only 14% of Americans have seen and used such information in the past year, a decrease from 2006 (36%).4 A similar study in 2007 found that after seeking input from family and friends, patients generally rely on their primary care physician (PCP) to assist them to make decisions about where to have elective surgery.5 Surprisingly, almost nothing is known about how publicly reported data is used, if at all, by PCPs in the referral of patients to hospitals.
The physician is an important intermediary in the buying process for many healthcare services.6 Tertiary care hospitals depend on physician referrals for much of their patient volume.7 Until the emergence of the hospitalist model of care, most primary care physicians cared for their own hospitalized patients, and thus hospital referral decisions were largely driven by the PCP's admitting privileges. However, following the rapid expansion of the hospitalist movement,8, 9 there has been a sharp decrease in the number of PCPs who provide direct patient care for their hospitalized patients.8 As a result, PCPs may now have more choice in regards to hospital referrals for general medical conditions. Potential factors influencing a PCP's referral decisions might include familiarity with the hospital, care quality, patient convenience, satisfaction with the hospital, or hospital reputation.
Studies of cardiac surgery report cards in New York9 and Pennsylvania,10 conducted in the mid‐1990s, found that cardiologists did not use publicly reported mortality data in referral decisions, nor did they share it with patients. Over the past 2 decades, public reporting has grown exponentially, and now includes many measures of structure, processes, and outcomes for almost all US hospitals, available for free over the Internet. The growth of the patient safety movement and mandated public reporting might also have affected physicians' views about publicly reported quality data. We surveyed primary care physicians to determine the extent to which they use information about hospital quality in their referral decisions for community‐acquired pneumonia, and to identify other factors that might influence referral decisions.
METHODS
We obtained an e‐mail list of primary care physicians from the medical staff offices of all area hospitals within a 10‐mile radius of Springfield, MA (Baystate Medical Center, Holyoke Medical Center, and Mercy Medical Center). Baystate Medical Center is a 659‐bed academic medical center and Level 1 trauma center, while Holyoke and Mercy Medical Center are both 180‐bed acute care hospitals. Physicians were contacted via e‐mail from June through September of 2009, and asked to participate in an anonymous, 10‐minute, online survey accessible through an Internet link (SurveyMonkey.com) about factors influencing a primary care physician's hospital referral choice for a patient with pneumonia. To facilitate participation, we sent 2 follow‐up e‐mail reminders, and respondents who completed the entire survey received a $15 gift card. The study was approved by the institutional review board of Baystate Medical Center and closed to participation on September 23, 2009.
We created the online survey based on previous research7 and approximately 10 key informant interviews. The survey (see Supporting Information, Appendix, in the online version of this article) contained 13 demographic questions and 10 questions based on a case study of pneumonia (Figure 1). The instrument was pilot tested for clarity with a small group of primary care physicians at the author's institution and subsequently modified. We chose pneumonia because it is a common reason for a PCP to make an urgent hospital referral,11 and because there is a well‐established set of quality measures that are publicly reported.12 Unlike elective surgery, for which patients might research hospitals or surgeons on their own, patients with pneumonia would likely rely on their PCP to recommend a hospital for urgent referral. In contrast, PCPs know they will refer a number of pneumonia patients to hospitals each year and therefore might have an interest in comparing the publicly reported quality measures for local hospitals.
Respondents were shown the case study and asked to refer the hypothetical patient to 1 of 4 area hospitals. Respondents were asked to rate (on a 3‐point scale: not at all, somewhat, or very) the importance of the following factors in their referral decision: waiting time in the emergency room, distance traveled by the patient, experience of other patients, severity of patient's illness, patient's insurance, hospital's reputation among other physicians and partners, admitting privileges with a specific hospital, admitting arrangements with a hospitalist group, familiarity with the hospital, availability of subspecialists, quality of subspecialists, nursing quality, nursing staffing ratios, hospital's case volume for pneumonia, publicly available quality measures, patient preference, distance from your practice, shared electronic record system, and quality of hospital discharge summaries. Next, we measured provider's awareness of publicly reported hospital quality data and whether they used such data in referring patients or choosing their own medical care. Specifically, we asked about familiarity with the following 4 Web sites: Massachusetts Quality and Cost (a state‐specific Web site produced by the Massachusetts Executive Office of Health and Human Services)13; Hospital Compare (a Web site developed and maintained by Centers for Medicare and Medicaid Services [CMS] and the Department of Health and Human Services)14; Leapfrog Group (a private, nonprofit organization)15; and Health Grades (a private, for‐profit company).16
We then asked participants to rate the importance of the following performance measures when judging a hospital's performance: antibiotics within 6 hours of arrival to the hospital, appropriate initial antibiotic, blood culture drawn before antibiotics given, smoking cessation advice/counseling, oxygenation assessment, risk‐adjusted mortality, intensive care unit staffing, influenza vaccination, pneumococcal vaccination, Leapfrog's never events,15 volume, Leapfrog safe practices score, cost, computerized physician order entry system, Magnet status,17 and U.S. News & World Report's Best Hospitals designation.18 Lastly, we asked participants to state, using a 3‐point scale (agree, disagree, neutral), their level of agreement that the following factors, adapted from Schneider and Epstein,10 represented limitations of public reporting: 1) risk‐adjusted methods are inadequate to compare hospitals fairly; 2) mortality rates are an incomplete indication of the quality of a hospital's care; 3) hospitals can manipulate the data; and 4) ratings are inaccurate for hospitals with small caseloads.
Factors associated with physicians' knowledge of publicly reported data were analyzed with bivariate analysis. Since all factors are categorical, chi‐square analysis was used for bivariate analysis. No factor had a P value <0.2 on bivariate analysis, thus multiple logistic regression was not performed.
RESULTS
Of 194 primary care physicians who received invitations, 92 responded (response rate of 47%). See Table 1 for respondents' characteristics. All age groups were represented; most were male and between 3554 years of age. Respondents were evenly divided between those who owned their own practices (54%) and those working for a health system (46%). Ninety‐three percent of PCPs maintained admitting privileges (45% to more than 1 hospital), but only 20% continued to admit their own patients. When asked where they would send a hypothetical pneumonia patient, only 4% of PCPs chose a hospital to which they had never had admitting privileges.
| Variable | No. (%) of Respondents |
|---|---|
| Age | |
| 2534 | 5 (5) |
| 3544 | 27 (29) |
| 4554 | 24 (26) |
| >55 | 36 (39) |
| Gender | |
| Male | 65 (71) |
| Female | 27 (29) |
| Years out of medical school | |
| <6 | 6 (7) |
| 610 | 9 (10) |
| 1115 | 17 (18) |
| >15 | 60 (65) |
| % Patients seen who are covered by | |
| Medicaid: Mean (SD) | 28 (26) |
| Medicare: Mean (SD) | 31 (18) |
| Private: Mean (SD) | 40 (25) |
| Number of time doing patient care: Mean (SD) | 85 (23) |
| Number of patients admitted/sent to hospital/mo | |
| <6 | 40 (47) |
| 610 | 25 (29) |
| 1120 | 12 (14) |
| >20 | 8 (9) |
| Practice type | |
| Solo | 13 (15) |
| Single specialty group | 36 (42) |
| Multi‐specialty group | 36 (42) |
| Practice ownership | |
| Independent | 45 (54) |
| Health system | 38 (46) |
| Currently admits own patients | |
| Yes | 17 (20) |
| No | 66 (80) |
| Current hospital admitting privileges | |
| A | 63 (76) |
| B | 41 (49) |
| C | 3 (4) |
| D | 12 (14) |
| None | 6 (7) |
| Other | 2 (2) |
Physician's ratings of the importance of various factors in their referral decision are shown in Figure 2. The following factors were most often considered very important: familiarity with the hospital (70%), patient preference (62%), and admitting arrangements with a hospitalist group (62%). In contrast, only 18% of physicians viewed publicly available hospital quality measures as very important when making a referral decision. Factors most often rated not at all important to participants' decisions were patient insurance (48%), hospital's case volume for pneumonia (48%), and publicly available quality measures (42%).
Of the 61% who were aware of Web sites that report hospital quality, most (52%) were familiar with Massachusetts Quality and Cost, while few (27%) were familiar with Hospital Compare. None of the physicians we surveyed reported having used publicly reported quality information when making a referral decision or having discussed such data with their patients. However, 49% stated that publicly reported performance data was somewhat and 10% very important to decisions regarding the medical care they receive. None of the demographic characteristics that we assessed (including age, gender, or years out of medical school) were associated with awareness of publicly reported data in bivariate analyses.
Respondents' ratings of specific quality measures appear in Figure 3. PCPs most often identified the following factors as being very important when judging hospital quality: percent of pneumonia patients given initial antibiotics within 6 hours after arrival (66%), percent of pneumonia patients given the most appropriate initial antibiotic (63%), and percent of pneumonia patients whose initial emergency room (ER) blood culture was performed prior to the administration of the first hospital dose of antibiotics (51%). The factors most often rated not at all important included: U.S. News & World Report's Best Hospitals designation (57%), Magnet Status (42%), and computer physician order entry system (40%).
When asked about limitations of publicly reported performance data, 42% agreed that risk‐adjusted methods were inadequate to compare hospitals fairly, 76% agreed that mortality rates were an incomplete indication of the quality of hospitals care, 62% agreed that hospitals could manipulate the data, and 72% agreed that the ratings were inaccurate for hospitals with small caseloads.
DISCUSSION
In 2003, the Hospital Quality Alliance began a voluntary public reporting program of hospital performance measures, for pneumonia, acute myocardial infarction, and congestive heart failure, that was intended to encourage quality improvement activity by hospitals, and to provide patients and referring physicians with information to make better‐informed choices.19 These data are now easily available to the public through a free Web site (
Despite their lack of familiarity with Hospital Compare, it was the quality measures that are reported by Hospital Compare that they identified as the best indicators of hospital quality: appropriate initial antibiotic, antibiotics within 6 hours, and blood cultures performed prior to the administration of antibiotics. In fact, the 5 measures most often cited as very important to judging hospital quality were all measures reported on Hospital Compare.
As the US healthcare system becomes increasingly complex and costly, there is a growing interest in providing patients with physician and hospital performance data to help them select the provider.21 It is postulated that if patients took a more active role in choosing healthcare providers, and were forced to assume greater financial responsibility, then consumerism will force improvements in quality of care while maintaining or even lowering costs.21 However, studies demonstrate that most patients are unaware of performance data and, if they are aware, still value familiarity over quality ratings.4 Moreover, patients rely on the knowledge of their primary care physician to guide them.5
This is the first study we are aware of that examines how primary care physicians use publicly reported quality data in hospital referral decisions. Studies from more than a decade ago found that publicly reported data had minimal impact on referral decisions from cardiologists to cardiac surgeons. A survey of Pennsylvania's cardiologists and cardiac surgeons showed that although 82% were aware of risk‐adjusted mortality rates published for surgeons, only 10% of cardiologists reported these to be very important when evaluating the performance of a cardiothoracic surgeon. Furthermore, 87% of cardiologists stated that mortality and case volume information reported on cardiac surgeons had minimal or no influence on their referral practices.10 In 1997, a survey of cardiologists in New York found that only 38% of respondents reported that risk‐adjusted outcome data had affected their referrals to surgeons very much or somewhat.9 In addition, most authors conclude that public reporting has had little or no effect on market share.22 Despite growth in the number of measures and improved accessibility, our physicians were even less likely to be aware of, or use, publicly reported data than physicians a decade earlier.
Of course, even if public reporting does not influence referral patterns, it could still improve healthcare quality in several ways. First, feedback about performance may focus quality improvement activities in specific areas that represent gaps in care.10 This could take the form of an appeal to professionalism,23 or the desire to preserve one's reputation by not appearing on a list of poor performers.24 Second, hospitals' desire to appear on lists of high performers, such as U.S. News & World Report's hospital rankings, for marketing purposes, might stimulate improvement activities.10 Finally, publicly reported measures could form the basis for pay‐for‐performance incentives that further speed improvement.25
Our study has several limitations. First, our sample size was small and restricted to 1 region of 1 state, and may not be representative of either the state or nation as a whole. Still, our area has a high level of Internet use, and several local hospitals have been at the vanguard of the quality movement, generally scoring above both state and national averages on Hospital Compare. In addition, Massachusetts has made substantial efforts to promote its own public reporting program, and half the surveyed physicians reported being aware of the Massachusetts Quality and Cost Web site. The fact that not a single area physician surveyed used publicly reported data when making referral decisions is sobering. We believe it is unlikely that other areas of the country will have a substantially higher rate of use. Similarly, our response rate was under 50%. Physicians who did not take the survey may have differed in important ways from those who did. Nevertheless, our sample included a broad range of physician ages, practice types, and affiliations. It seems unlikely that those who did not respond would be more inclined to use publicly reported data than those who did. Second, we assessed decision‐making around a single medical condition. Physicians may have used publicly reported data for other decisions. However, the condition we chose was both urgent (as opposed to emergent) and possesses a robust set of publicly reported quality measures. If physicians do not use publicly reported data for this decision, it seems unlikely they would use it for conditions that have fewer reliable measures (eg, gall bladder surgery) or where the choice of hospital is generally made in an ambulance (eg, myocardial infarction). Finally, the low awareness of public reporting made it difficult for some physicians to answer some of the questions regarding publicly reported hospital quality data because they were unfamiliar with the language utilized by the Web sites (eg, magnet status, Leapfrog never events). It is possible that our results may have been altered slightly if a glossary had been provided.
Despite these limitations, our study suggests that more than 6 years after the launch of the Hospital Quality Alliance, primary care physicians do not appear to make use of these data when choosing a hospital for their patients suffering from pneumonia. Instead, they rely on familiarity with a hospital and past relationships. Even though a majority of the physicians surveyed no longer admitted their own patients, they continue to send patients to hospitals where they had privileges. This finding is not surprising, as physicians also cling to familiar therapies, and may be reluctant to prescribe a new medication or perform an unfamiliar procedure, even if it is indicated. Such reliance on familiarity may make physicians feel comfortable, but does not always result in the best care for patients. Acquiring familiarity, however, requires time and effort, something that physicians generally have in short supply; and while there are plenty of industry representatives to overcome physicians' hesitancy to prescribe new treatments, there are no analogous agents to educate physicians about public reporting or to help them overcome hesitancy about trying a new hospital.
Suspicion about the validity of public reporting may also play a role in the physicians' reported behavior. In past studies of cardiac report cards, cardiologists were most concerned that risk adjustment methods were inadequate (77%) and that mortality rates were an incomplete indicator of the quality of surgical care (74%). They were less concerned about manipulation of data (52%) or small caseloads (15%).10 Our physicians were also concerned that mortality rates were an incomplete measure of quality (76%) but less concerned about risk adjustment (42%), perhaps because many structure and process measures are not subject to risk adjustment. In contrast, they were somewhat more concerned that hospitals could manipulate the data (62%), which again may reflect process measures versus mortality statistics. Other reasons for not using the data may include a lack of awareness of the data or how to access it, or a belief that hospitals do not vary in quality.
Interestingly, even though most respondents were not aware of Hospital Compare, they found the information presented there to best reflect the overall hospital quality. Also, while respondents indicated that they did not use publicly reported data when referring patients, almost half of PCPs reported that publicly reported performance data was at least somewhat important in choosing their own medical care. Thus, although public reporting appears not to have reached its full potential, some publicly reported quality measures have clearly entered the consciousness of PCPs. In contrast, other highly touted measures such as computerized physician order entry systems were not appreciated, and popular designations such as U.S. News & World Report's Best Hospitals were least valued, even though 1 area hospital carries this designation. One conclusion might be that CMS should abandon Hospital Compare since neither patients4 nor providers use it. However, public reporting may improve quality in other ways. Moreover, physicians appear interested in the data even if they are not aware of it. Therefore, given the large investment by CMS and individual hospitals in collecting the data required for Hospital Compare, CMS might consider making greater efforts to increase primary care physician awareness of the Hospital Compare Web site. At the same time, high‐performing hospitals may want to communicate their performance scores to local PCPs as part of their marketing strategy. Future studies could assess whether such practices affect physician referral decisions and subsequent market share of high‐performing hospitals.
Acknowledgements
The authors of this study thank Jane Garb for her help with statistical analysis.
Over the past decade, research has demonstrated a value gap in US healthcare, characterized by rapidly rising costs and substandard quality.1, 2 Public reporting of hospital performance data is one of several strategies promoted to help address these deficiencies. To this end, a number of hospital rating services have created Web sites aimed at healthcare consumers.3 These services provide information about multiple aspects of healthcare quality, which in theory might be used by patients when deciding where to seek medical care.
Despite the increasing availability of publicly reported quality data comparing doctors and hospitals, a 2008 survey found that only 14% of Americans have seen and used such information in the past year, a decrease from 2006 (36%).4 A similar study in 2007 found that after seeking input from family and friends, patients generally rely on their primary care physician (PCP) to assist them to make decisions about where to have elective surgery.5 Surprisingly, almost nothing is known about how publicly reported data is used, if at all, by PCPs in the referral of patients to hospitals.
The physician is an important intermediary in the buying process for many healthcare services.6 Tertiary care hospitals depend on physician referrals for much of their patient volume.7 Until the emergence of the hospitalist model of care, most primary care physicians cared for their own hospitalized patients, and thus hospital referral decisions were largely driven by the PCP's admitting privileges. However, following the rapid expansion of the hospitalist movement,8, 9 there has been a sharp decrease in the number of PCPs who provide direct patient care for their hospitalized patients.8 As a result, PCPs may now have more choice in regards to hospital referrals for general medical conditions. Potential factors influencing a PCP's referral decisions might include familiarity with the hospital, care quality, patient convenience, satisfaction with the hospital, or hospital reputation.
Studies of cardiac surgery report cards in New York9 and Pennsylvania,10 conducted in the mid‐1990s, found that cardiologists did not use publicly reported mortality data in referral decisions, nor did they share it with patients. Over the past 2 decades, public reporting has grown exponentially, and now includes many measures of structure, processes, and outcomes for almost all US hospitals, available for free over the Internet. The growth of the patient safety movement and mandated public reporting might also have affected physicians' views about publicly reported quality data. We surveyed primary care physicians to determine the extent to which they use information about hospital quality in their referral decisions for community‐acquired pneumonia, and to identify other factors that might influence referral decisions.
METHODS
We obtained an e‐mail list of primary care physicians from the medical staff offices of all area hospitals within a 10‐mile radius of Springfield, MA (Baystate Medical Center, Holyoke Medical Center, and Mercy Medical Center). Baystate Medical Center is a 659‐bed academic medical center and Level 1 trauma center, while Holyoke and Mercy Medical Center are both 180‐bed acute care hospitals. Physicians were contacted via e‐mail from June through September of 2009, and asked to participate in an anonymous, 10‐minute, online survey accessible through an Internet link (SurveyMonkey.com) about factors influencing a primary care physician's hospital referral choice for a patient with pneumonia. To facilitate participation, we sent 2 follow‐up e‐mail reminders, and respondents who completed the entire survey received a $15 gift card. The study was approved by the institutional review board of Baystate Medical Center and closed to participation on September 23, 2009.
We created the online survey based on previous research7 and approximately 10 key informant interviews. The survey (see Supporting Information, Appendix, in the online version of this article) contained 13 demographic questions and 10 questions based on a case study of pneumonia (Figure 1). The instrument was pilot tested for clarity with a small group of primary care physicians at the author's institution and subsequently modified. We chose pneumonia because it is a common reason for a PCP to make an urgent hospital referral,11 and because there is a well‐established set of quality measures that are publicly reported.12 Unlike elective surgery, for which patients might research hospitals or surgeons on their own, patients with pneumonia would likely rely on their PCP to recommend a hospital for urgent referral. In contrast, PCPs know they will refer a number of pneumonia patients to hospitals each year and therefore might have an interest in comparing the publicly reported quality measures for local hospitals.
Respondents were shown the case study and asked to refer the hypothetical patient to 1 of 4 area hospitals. Respondents were asked to rate (on a 3‐point scale: not at all, somewhat, or very) the importance of the following factors in their referral decision: waiting time in the emergency room, distance traveled by the patient, experience of other patients, severity of patient's illness, patient's insurance, hospital's reputation among other physicians and partners, admitting privileges with a specific hospital, admitting arrangements with a hospitalist group, familiarity with the hospital, availability of subspecialists, quality of subspecialists, nursing quality, nursing staffing ratios, hospital's case volume for pneumonia, publicly available quality measures, patient preference, distance from your practice, shared electronic record system, and quality of hospital discharge summaries. Next, we measured provider's awareness of publicly reported hospital quality data and whether they used such data in referring patients or choosing their own medical care. Specifically, we asked about familiarity with the following 4 Web sites: Massachusetts Quality and Cost (a state‐specific Web site produced by the Massachusetts Executive Office of Health and Human Services)13; Hospital Compare (a Web site developed and maintained by Centers for Medicare and Medicaid Services [CMS] and the Department of Health and Human Services)14; Leapfrog Group (a private, nonprofit organization)15; and Health Grades (a private, for‐profit company).16
We then asked participants to rate the importance of the following performance measures when judging a hospital's performance: antibiotics within 6 hours of arrival to the hospital, appropriate initial antibiotic, blood culture drawn before antibiotics given, smoking cessation advice/counseling, oxygenation assessment, risk‐adjusted mortality, intensive care unit staffing, influenza vaccination, pneumococcal vaccination, Leapfrog's never events,15 volume, Leapfrog safe practices score, cost, computerized physician order entry system, Magnet status,17 and U.S. News & World Report's Best Hospitals designation.18 Lastly, we asked participants to state, using a 3‐point scale (agree, disagree, neutral), their level of agreement that the following factors, adapted from Schneider and Epstein,10 represented limitations of public reporting: 1) risk‐adjusted methods are inadequate to compare hospitals fairly; 2) mortality rates are an incomplete indication of the quality of a hospital's care; 3) hospitals can manipulate the data; and 4) ratings are inaccurate for hospitals with small caseloads.
Factors associated with physicians' knowledge of publicly reported data were analyzed with bivariate analysis. Since all factors are categorical, chi‐square analysis was used for bivariate analysis. No factor had a P value <0.2 on bivariate analysis, thus multiple logistic regression was not performed.
RESULTS
Of 194 primary care physicians who received invitations, 92 responded (response rate of 47%). See Table 1 for respondents' characteristics. All age groups were represented; most were male and between 3554 years of age. Respondents were evenly divided between those who owned their own practices (54%) and those working for a health system (46%). Ninety‐three percent of PCPs maintained admitting privileges (45% to more than 1 hospital), but only 20% continued to admit their own patients. When asked where they would send a hypothetical pneumonia patient, only 4% of PCPs chose a hospital to which they had never had admitting privileges.
| Variable | No. (%) of Respondents |
|---|---|
| Age | |
| 2534 | 5 (5) |
| 3544 | 27 (29) |
| 4554 | 24 (26) |
| >55 | 36 (39) |
| Gender | |
| Male | 65 (71) |
| Female | 27 (29) |
| Years out of medical school | |
| <6 | 6 (7) |
| 610 | 9 (10) |
| 1115 | 17 (18) |
| >15 | 60 (65) |
| % Patients seen who are covered by | |
| Medicaid: Mean (SD) | 28 (26) |
| Medicare: Mean (SD) | 31 (18) |
| Private: Mean (SD) | 40 (25) |
| Number of time doing patient care: Mean (SD) | 85 (23) |
| Number of patients admitted/sent to hospital/mo | |
| <6 | 40 (47) |
| 610 | 25 (29) |
| 1120 | 12 (14) |
| >20 | 8 (9) |
| Practice type | |
| Solo | 13 (15) |
| Single specialty group | 36 (42) |
| Multi‐specialty group | 36 (42) |
| Practice ownership | |
| Independent | 45 (54) |
| Health system | 38 (46) |
| Currently admits own patients | |
| Yes | 17 (20) |
| No | 66 (80) |
| Current hospital admitting privileges | |
| A | 63 (76) |
| B | 41 (49) |
| C | 3 (4) |
| D | 12 (14) |
| None | 6 (7) |
| Other | 2 (2) |
Physician's ratings of the importance of various factors in their referral decision are shown in Figure 2. The following factors were most often considered very important: familiarity with the hospital (70%), patient preference (62%), and admitting arrangements with a hospitalist group (62%). In contrast, only 18% of physicians viewed publicly available hospital quality measures as very important when making a referral decision. Factors most often rated not at all important to participants' decisions were patient insurance (48%), hospital's case volume for pneumonia (48%), and publicly available quality measures (42%).
Of the 61% who were aware of Web sites that report hospital quality, most (52%) were familiar with Massachusetts Quality and Cost, while few (27%) were familiar with Hospital Compare. None of the physicians we surveyed reported having used publicly reported quality information when making a referral decision or having discussed such data with their patients. However, 49% stated that publicly reported performance data was somewhat and 10% very important to decisions regarding the medical care they receive. None of the demographic characteristics that we assessed (including age, gender, or years out of medical school) were associated with awareness of publicly reported data in bivariate analyses.
Respondents' ratings of specific quality measures appear in Figure 3. PCPs most often identified the following factors as being very important when judging hospital quality: percent of pneumonia patients given initial antibiotics within 6 hours after arrival (66%), percent of pneumonia patients given the most appropriate initial antibiotic (63%), and percent of pneumonia patients whose initial emergency room (ER) blood culture was performed prior to the administration of the first hospital dose of antibiotics (51%). The factors most often rated not at all important included: U.S. News & World Report's Best Hospitals designation (57%), Magnet Status (42%), and computer physician order entry system (40%).
When asked about limitations of publicly reported performance data, 42% agreed that risk‐adjusted methods were inadequate to compare hospitals fairly, 76% agreed that mortality rates were an incomplete indication of the quality of hospitals care, 62% agreed that hospitals could manipulate the data, and 72% agreed that the ratings were inaccurate for hospitals with small caseloads.
DISCUSSION
In 2003, the Hospital Quality Alliance began a voluntary public reporting program of hospital performance measures, for pneumonia, acute myocardial infarction, and congestive heart failure, that was intended to encourage quality improvement activity by hospitals, and to provide patients and referring physicians with information to make better‐informed choices.19 These data are now easily available to the public through a free Web site (
Despite their lack of familiarity with Hospital Compare, it was the quality measures that are reported by Hospital Compare that they identified as the best indicators of hospital quality: appropriate initial antibiotic, antibiotics within 6 hours, and blood cultures performed prior to the administration of antibiotics. In fact, the 5 measures most often cited as very important to judging hospital quality were all measures reported on Hospital Compare.
As the US healthcare system becomes increasingly complex and costly, there is a growing interest in providing patients with physician and hospital performance data to help them select the provider.21 It is postulated that if patients took a more active role in choosing healthcare providers, and were forced to assume greater financial responsibility, then consumerism will force improvements in quality of care while maintaining or even lowering costs.21 However, studies demonstrate that most patients are unaware of performance data and, if they are aware, still value familiarity over quality ratings.4 Moreover, patients rely on the knowledge of their primary care physician to guide them.5
This is the first study we are aware of that examines how primary care physicians use publicly reported quality data in hospital referral decisions. Studies from more than a decade ago found that publicly reported data had minimal impact on referral decisions from cardiologists to cardiac surgeons. A survey of Pennsylvania's cardiologists and cardiac surgeons showed that although 82% were aware of risk‐adjusted mortality rates published for surgeons, only 10% of cardiologists reported these to be very important when evaluating the performance of a cardiothoracic surgeon. Furthermore, 87% of cardiologists stated that mortality and case volume information reported on cardiac surgeons had minimal or no influence on their referral practices.10 In 1997, a survey of cardiologists in New York found that only 38% of respondents reported that risk‐adjusted outcome data had affected their referrals to surgeons very much or somewhat.9 In addition, most authors conclude that public reporting has had little or no effect on market share.22 Despite growth in the number of measures and improved accessibility, our physicians were even less likely to be aware of, or use, publicly reported data than physicians a decade earlier.
Of course, even if public reporting does not influence referral patterns, it could still improve healthcare quality in several ways. First, feedback about performance may focus quality improvement activities in specific areas that represent gaps in care.10 This could take the form of an appeal to professionalism,23 or the desire to preserve one's reputation by not appearing on a list of poor performers.24 Second, hospitals' desire to appear on lists of high performers, such as U.S. News & World Report's hospital rankings, for marketing purposes, might stimulate improvement activities.10 Finally, publicly reported measures could form the basis for pay‐for‐performance incentives that further speed improvement.25
Our study has several limitations. First, our sample size was small and restricted to 1 region of 1 state, and may not be representative of either the state or nation as a whole. Still, our area has a high level of Internet use, and several local hospitals have been at the vanguard of the quality movement, generally scoring above both state and national averages on Hospital Compare. In addition, Massachusetts has made substantial efforts to promote its own public reporting program, and half the surveyed physicians reported being aware of the Massachusetts Quality and Cost Web site. The fact that not a single area physician surveyed used publicly reported data when making referral decisions is sobering. We believe it is unlikely that other areas of the country will have a substantially higher rate of use. Similarly, our response rate was under 50%. Physicians who did not take the survey may have differed in important ways from those who did. Nevertheless, our sample included a broad range of physician ages, practice types, and affiliations. It seems unlikely that those who did not respond would be more inclined to use publicly reported data than those who did. Second, we assessed decision‐making around a single medical condition. Physicians may have used publicly reported data for other decisions. However, the condition we chose was both urgent (as opposed to emergent) and possesses a robust set of publicly reported quality measures. If physicians do not use publicly reported data for this decision, it seems unlikely they would use it for conditions that have fewer reliable measures (eg, gall bladder surgery) or where the choice of hospital is generally made in an ambulance (eg, myocardial infarction). Finally, the low awareness of public reporting made it difficult for some physicians to answer some of the questions regarding publicly reported hospital quality data because they were unfamiliar with the language utilized by the Web sites (eg, magnet status, Leapfrog never events). It is possible that our results may have been altered slightly if a glossary had been provided.
Despite these limitations, our study suggests that more than 6 years after the launch of the Hospital Quality Alliance, primary care physicians do not appear to make use of these data when choosing a hospital for their patients suffering from pneumonia. Instead, they rely on familiarity with a hospital and past relationships. Even though a majority of the physicians surveyed no longer admitted their own patients, they continue to send patients to hospitals where they had privileges. This finding is not surprising, as physicians also cling to familiar therapies, and may be reluctant to prescribe a new medication or perform an unfamiliar procedure, even if it is indicated. Such reliance on familiarity may make physicians feel comfortable, but does not always result in the best care for patients. Acquiring familiarity, however, requires time and effort, something that physicians generally have in short supply; and while there are plenty of industry representatives to overcome physicians' hesitancy to prescribe new treatments, there are no analogous agents to educate physicians about public reporting or to help them overcome hesitancy about trying a new hospital.
Suspicion about the validity of public reporting may also play a role in the physicians' reported behavior. In past studies of cardiac report cards, cardiologists were most concerned that risk adjustment methods were inadequate (77%) and that mortality rates were an incomplete indicator of the quality of surgical care (74%). They were less concerned about manipulation of data (52%) or small caseloads (15%).10 Our physicians were also concerned that mortality rates were an incomplete measure of quality (76%) but less concerned about risk adjustment (42%), perhaps because many structure and process measures are not subject to risk adjustment. In contrast, they were somewhat more concerned that hospitals could manipulate the data (62%), which again may reflect process measures versus mortality statistics. Other reasons for not using the data may include a lack of awareness of the data or how to access it, or a belief that hospitals do not vary in quality.
Interestingly, even though most respondents were not aware of Hospital Compare, they found the information presented there to best reflect the overall hospital quality. Also, while respondents indicated that they did not use publicly reported data when referring patients, almost half of PCPs reported that publicly reported performance data was at least somewhat important in choosing their own medical care. Thus, although public reporting appears not to have reached its full potential, some publicly reported quality measures have clearly entered the consciousness of PCPs. In contrast, other highly touted measures such as computerized physician order entry systems were not appreciated, and popular designations such as U.S. News & World Report's Best Hospitals were least valued, even though 1 area hospital carries this designation. One conclusion might be that CMS should abandon Hospital Compare since neither patients4 nor providers use it. However, public reporting may improve quality in other ways. Moreover, physicians appear interested in the data even if they are not aware of it. Therefore, given the large investment by CMS and individual hospitals in collecting the data required for Hospital Compare, CMS might consider making greater efforts to increase primary care physician awareness of the Hospital Compare Web site. At the same time, high‐performing hospitals may want to communicate their performance scores to local PCPs as part of their marketing strategy. Future studies could assess whether such practices affect physician referral decisions and subsequent market share of high‐performing hospitals.
Acknowledgements
The authors of this study thank Jane Garb for her help with statistical analysis.
- Centers for Medicare and Medicaid Services. National Health Care Expenditures Data.2010. Available at: http://www.2.cms.gov/NationalHealthExpendData/25_NHE_Fact_Sheet.asp. Accessed April 22,year="2010"2010.
- ,,, et al.The quality of health care delivered to adults in the United States.N Engl J Med.2003;348(26):2635–2645.
- ,. The State‐of‐the‐Art of Online Hospital Public Reporting: a Review of Fifty‐One Websites. 2005. Available at: http://www.delmarvafoundation.org/newsAndPublications/reports/documents/WebSummariesFinal9.2.04.pdf. Accessed February 24,2012.
- . Kaiser Family Foundation. 2008 Update on Consumers' Views of Patient Safety and Quality Information. 2010. Available at: http://www.kff.org/kaiserpolls/upload/7819.pdf. Accessed April 20,2010.
- ,,.Choosing where to have major surgery: who makes the decision?Arch Surg.2007;142(3):242–246.
- ,,, et al.Resolving the gatekeeper conundrum: what patients value in primary care and referrals to specialists.JAMA.1999;282(3):261–266.
- ,,,.How physicians make referrals.J Health Care Mark.1993;13(2):6–17.
- ,,,.Growth in the care of older patients by hospitalists in the United States.N Engl J Med.2009;360(11):1102–1112.
- ,,,DeBuono BA. Public release of cardiac surgery outcomes data in New York: what do New York state cardiologists think of it?Am Heart J.1997;134(6):1120–1128.
- ,.Influence of cardiac‐surgery performance reports on referral practices and access to care. A survey of cardiovascular specialists.N Engl J Med.1996;335(4):251–256.
- ,,,,.Primary care summary of the British Thoracic Society Guidelines for the management of community acquired pneumonia in adults: 2009 update. Endorsed by the Royal College of General Practitioners and the Primary Care Respiratory Society UK.Prim Care Respir J.2010;19(1):21–27.
- Hospital Quality Alliance Quality Measures.2010. Available at: http://www.hospitalqualityalliance.org/hospitalqualityalliance/qualitymeasures/qualitymeasures.html. Accessed April 25,year="2010"2010.
- Massachusetts Executive Office of Health and Human Services. Massachusetts Executive Quality and Cost.2010. Available at: http://www.mass.gov/healthcareqc. Accessed February 24,year="2012"2012.
- Centers for Medicare and Medicaid Services. Hospital Compare.2010. Available at: http://www.hospitalcompare.hhs.gov. Accessed April 19,year="2010"2010.
- The Leapfrog Group for Patient Safety.2010. Available at: http://www.leapfroggroup.org/. Accessed April 23,year="2010"2010.
- Health Grades. 2010. Available at: http://www.healthgrades.com. Accessed April 19,2010.
- American Nurses Credentialing Center. Magnet Recognition Program. 2010. Available at: http://www.nursecredentialing.org/Magnet.aspx. Accessed April 15,2010.
- U.S. News 353(3):265–274.
- . US ads push patients to shop for hospitals. USA Today. May 20, 2008. Available at: http://www.usatoday.com/news/health/2008‐05‐20‐Hospitalads_N.htm. Accessed February 24, 2012.
- ,,.How do elderly patients decide where to go for major surgery? Telephone interview survey.BMJ.2005;331(7520):821.
- ,,, et al.Public reporting of cardiac surgery performance: part 1—history, rationale, consequences.Ann Thorac Surg.2011;92(3 suppl):S2–S11.
- ,,.Public reporting of hospital quality: recommendations to benefit patients and hospitals.J Hosp Med.2009;4(9):541–545.
- ,,, et al.When things go wrong: the impact of being a statistical outlier in publicly reported coronary artery bypass graft surgery mortality data.Am J Med Qual.2008;23(2):90–95.
- ,,, et al.Public reporting and pay for performance in hospital quality improvement.N Engl J Med.2007;356(5):486–496.
- Centers for Medicare and Medicaid Services. National Health Care Expenditures Data.2010. Available at: http://www.2.cms.gov/NationalHealthExpendData/25_NHE_Fact_Sheet.asp. Accessed April 22,year="2010"2010.
- ,,, et al.The quality of health care delivered to adults in the United States.N Engl J Med.2003;348(26):2635–2645.
- ,. The State‐of‐the‐Art of Online Hospital Public Reporting: a Review of Fifty‐One Websites. 2005. Available at: http://www.delmarvafoundation.org/newsAndPublications/reports/documents/WebSummariesFinal9.2.04.pdf. Accessed February 24,2012.
- . Kaiser Family Foundation. 2008 Update on Consumers' Views of Patient Safety and Quality Information. 2010. Available at: http://www.kff.org/kaiserpolls/upload/7819.pdf. Accessed April 20,2010.
- ,,.Choosing where to have major surgery: who makes the decision?Arch Surg.2007;142(3):242–246.
- ,,, et al.Resolving the gatekeeper conundrum: what patients value in primary care and referrals to specialists.JAMA.1999;282(3):261–266.
- ,,,.How physicians make referrals.J Health Care Mark.1993;13(2):6–17.
- ,,,.Growth in the care of older patients by hospitalists in the United States.N Engl J Med.2009;360(11):1102–1112.
- ,,,DeBuono BA. Public release of cardiac surgery outcomes data in New York: what do New York state cardiologists think of it?Am Heart J.1997;134(6):1120–1128.
- ,.Influence of cardiac‐surgery performance reports on referral practices and access to care. A survey of cardiovascular specialists.N Engl J Med.1996;335(4):251–256.
- ,,,,.Primary care summary of the British Thoracic Society Guidelines for the management of community acquired pneumonia in adults: 2009 update. Endorsed by the Royal College of General Practitioners and the Primary Care Respiratory Society UK.Prim Care Respir J.2010;19(1):21–27.
- Hospital Quality Alliance Quality Measures.2010. Available at: http://www.hospitalqualityalliance.org/hospitalqualityalliance/qualitymeasures/qualitymeasures.html. Accessed April 25,year="2010"2010.
- Massachusetts Executive Office of Health and Human Services. Massachusetts Executive Quality and Cost.2010. Available at: http://www.mass.gov/healthcareqc. Accessed February 24,year="2012"2012.
- Centers for Medicare and Medicaid Services. Hospital Compare.2010. Available at: http://www.hospitalcompare.hhs.gov. Accessed April 19,year="2010"2010.
- The Leapfrog Group for Patient Safety.2010. Available at: http://www.leapfroggroup.org/. Accessed April 23,year="2010"2010.
- Health Grades. 2010. Available at: http://www.healthgrades.com. Accessed April 19,2010.
- American Nurses Credentialing Center. Magnet Recognition Program. 2010. Available at: http://www.nursecredentialing.org/Magnet.aspx. Accessed April 15,2010.
- U.S. News 353(3):265–274.
- . US ads push patients to shop for hospitals. USA Today. May 20, 2008. Available at: http://www.usatoday.com/news/health/2008‐05‐20‐Hospitalads_N.htm. Accessed February 24, 2012.
- ,,.How do elderly patients decide where to go for major surgery? Telephone interview survey.BMJ.2005;331(7520):821.
- ,,, et al.Public reporting of cardiac surgery performance: part 1—history, rationale, consequences.Ann Thorac Surg.2011;92(3 suppl):S2–S11.
- ,,.Public reporting of hospital quality: recommendations to benefit patients and hospitals.J Hosp Med.2009;4(9):541–545.
- ,,, et al.When things go wrong: the impact of being a statistical outlier in publicly reported coronary artery bypass graft surgery mortality data.Am J Med Qual.2008;23(2):90–95.
- ,,, et al.Public reporting and pay for performance in hospital quality improvement.N Engl J Med.2007;356(5):486–496.
Copyright © 2012 Society of Hospital Medicine

“Out of Sight, Out of Mind”
Hospital readmission is a common, costly, and often preventable occurrence in the United States. Among Medicare beneficiaries, 1 out of 5 patients is readmitted within 30 days, and the cost of unplanned readmissions exceeded $17 billion in 2007.1 As a result, the Centers for Medicare and Medicaid Services (CMS) and others have called for focused efforts to reduce hospital readmission rates.24 The quality of hospital discharge care is a key determinant of readmission rates,57 and many recent interventions to reduce readmission have focused on improving various aspects of the discharge process.810 Although these approaches have shown promise, the role of physicians in improving the quality of discharge care has not been extensively studied. Existing studies have focused on communication barriers between physicians in the hospital and outpatient settings,1113 but these have not examined the hospital discharge process itself and the experience of physicians in that process. Physician perspectives on this process are critical to inform strategies to leverage their roles in improving the performance of discharge teams.
Accordingly, we sought to understand physician experiences with the hospital discharge process, focusing on factors that physicians perceived to limit the quality of the discharge process at teaching hospitals. Teaching hospitals provided an ideal setting for this study given their high readmission rates,14 despite efforts to improve discharge quality of care through multidisciplinary team approaches. We focused on housestaff physicians because of their in‐depth involvement in the discharge process at teaching hospitals, which collectively provide 20% of all hospital care in the US.15 Housestaff perspectives on quality‐limiting factors of the discharge process may help identify targets for interventions to improve the quality of inpatient discharge care and to ultimately reduce hospital readmissions.
METHODS
Study Design and Sample
We conducted a qualitative study of internal medicine housestaff at 2 residency programs, with 7 different hospital settings, to ensure breadth of experience and perspectives (Table 1). Both programs train a large number of housestaff, and both are affiliated with prestigious medical schools and major universities. Qualitative methods are ideally suited to examine physician perspectives on discharge care because the inherent complexity of discharge processes, and importance of communication and multidisciplinary teamwork, are difficult to quantify.16, 17 We focused on housestaff because they are responsible for coordinating discharge care at teaching hospitals and have direct experience with the phenomenon of interest.18 We created a discussion guide (see Supporting Information, Out of Sight, Out of Mind Interview Guide in the online version of this article) informed by clinical experience and recent qualitative studies of housestaff, to guide conversation during the interviews.1921
| Hospital | Residency Program | Ownership | Setting | Teaching Intensity |
|---|---|---|---|---|
| A | A | Private, nonprofit | Urban | High |
| B | B | Private, nonprofit | Semi‐urban | High |
| C | A | Private, nonprofit specialty (oncology) | Urban | High |
| D | B | Private, nonprofit community hospital | Rural | Low |
| E | A | Public (Veterans Affairs) | Urban | High |
| F | B | Public (Veterans Affairs) | Semi‐urban | High |
| G | A | Public (county hospital) | Urban | High |
We obtained a list of current housestaff from directors at both residency programs and invited participation from all housestaff with an inpatient rotation in the preceding 6 months, using purposeful sampling to ensure adequate representation by postgraduate year (PGY) and gender. Given that interns are more involved in executing the details of discharge care, we purposefully over‐sampled for PGY‐1 rather than sampling each PGY equally. As an incentive, participants were entered into a lottery for one of three $100 gift cards at each site. All participants gave informed consent, and all research procedures were approved by the Institutional Review Boards of record for both residency programs.
Data Collection
We conducted in‐depth interviews until no new concepts were elicited with successive interviews; this theoretical saturation22, 23 occurred after 29 interviews. To ensure rigor in our approach, we adhered to a focused scope of inquiry, developed a cohesive theoretical sample, and held regular team meetings to assess the adequacy and comprehensiveness of all analytic results.24 All interviews were digitally recorded and transcribed by a professional transcription service, and all transcripts were reviewed for accuracy. A brief demographic survey was administered after each interview (Table 2).
| Characteristic | Total N = 29 |
|---|---|
| |
| Age | Mean: 29.6 yr |
| Range: 2634 yr | |
| Gender | |
| Female | 19 (66%) |
| Male | 10 (34%) |
| Residency program | |
| A | 12 (41%) |
| B | 17 (59%) |
| Year in training | |
| PGY‐1 | 17 (59%) |
| PGY‐2 | 7 (24%) |
| PGY‐3 | 5 (17%) |
Data Analysis
We employed the constant comparative method of qualitative data analysis.16, 18 Codes were developed iteratively and refined to identify conceptual segments of the data. The team reviewed the code structure throughout the analytic process, and revised the scope and content of codes as needed. The final code structure contained 22 codes, which we subsequently integrated into the 5 recurrent themes. Two members of the research team (S.R.G., D.S.) coded all of the transcripts; other team members (L.I.H., L.C., and E.H.B.) double‐ and triple‐coded portions of the data. All data were entered into a single database (Atlas.ti version 5.2) to ensure consistent application of codes across all transcripts. Disagreements in coding were resolved through negotiated consensus. Additional strategies to enhance the reliability of our findings included creation of an audit trail documenting the data coding and analysis processes, and seeking participant review and confirmation of the findings.24, 25 We shared summary findings with all participants via e‐mail, and sought participant confirmation through in‐person conversations with several individuals and responses to findings via e‐mail.
RESULTS
Based on interview transcripts from 29 internal medicine housestaff physicians (Table 3), we identified 5 recurrent and unifying themes describing factors perceived to limit the quality of inpatient discharge care: (1) competing priorities in the discharge process; (2) inadequate coordination within multidisciplinary discharge teams; (3) lack of standardization in discharge procedures; (4) poor patient and family communication; and (5) lack of postdischarge feedback and clinical responsibility.
| Theme: Competing priorities of timeliness and thoroughness |
| Supporting codes |
| Professional or hospital norms about discharge |
| Time pressures including early discharge rules |
| Balancing multiple priorities or responsibilities |
| Duty hours and off hours including weekends and cross‐cover |
| Theme: Lack of coordination within multidisciplinary discharge team members |
| Supporting codes |
| Teamwork including individual roles, communication and coordination between team members |
| Clinical complexity or specific complexities of the healthcare system |
| Specific difficulties arranging for follow‐up care |
| Theme: Uncertainty about provider roles and patient readiness for discharge |
| Supporting codes |
| Uncertainty about provider roles or discharge timing |
| Readmissions and bounce‐backs |
| Clinical complexity or specific complexities of the healthcare system |
| Theme: Lack of standardization in discharge procedures |
| Supporting codes |
| Teamwork |
| Readmissions and bounce‐backs |
| Patient safety including the concept of safe discharge and mistakes or errors |
| Clinical complexity or specific complexities of the healthcare system |
| Checklists or other specific procedures/aids or clever systems to improve quality |
| Discharge documentation |
| Theme: Poor patient communication and postdischarge continuity of care |
| Supporting codes |
| Lack of continuity of care after discharge |
| Specific difficulties arranging for follow‐up care |
| Information technology including electronic medical records |
| Patient communication, education, or understanding |
| Discharge documentation |
Competing Priorities in the Discharge Process
Housestaff uniformly asserted the importance of consistently performing high‐quality discharge; however, they identified several competing priorities that turned their attention elsewhere. Housestaff noted that the pressure to discharge early in the day was palpable, even if this compromised the thoroughness of the discharge process. Illustrating this theme, one participant said:
One thing that I found very frustrating here is the goal for 11:00 AM discharge . It's more important to get the patient out than it is to be thorough in the discharge is how it feels a lot of the time. [PGY‐1, Program B, Interview #3]
In addition to competing institutional priorities, housestaff also articulated tensions between their roles as learners and providers. Although educational duties, such as noon conference, contributed to general time constraints, they highlighted other patient care responsibilities as the primary competing priority to a high‐quality discharge:
The worst part in discharging is that it takes a lot of time and you're often limited by having to admit new patients . I don't think people realize how much time it takes often a lot longer than doing an admission. [PGY‐1, Program A, Interview #27]
Participants also described competing priorities in the context of transfers of care or sign‐out from the post‐call team to the on‐call team. Because discharges frequently occurred around the same time as these sign‐outs, housestaff described conflicting institutional priorities that created ambiguity about post‐call discharge responsibilities:
When you're post‐call, the hospital administration wants you to be out by 12:00, but then they're also saying do all the [discharge] stuff. So, which one do you want me to do? They kind of endorse both and that's confusing. [PGY‐1, Program B, Interview #7]
Although housestaff articulated patient safety as an essential goal of discharge care, the net effect of these competing individual and institutional priorities was an inconsistent focus on the discharge process and an unspoken or hidden message that discharge care was not of top‐level importance.
Inadequate Coordination Within Multidisciplinary Discharge Teams
Housestaff described difficulties in coordination and communication with multidisciplinary staff involved with the discharge process beyond the physician team. They felt their engagement with other team members was constrained by professional hierarchy and insufficient contact among team members, both of which directly affected hospital efficiency and patient safety:
On the hospital floor, it still feels like a hierarchy and it's very difficult to fit communication with nurses into our daily rounds . If we worked together more as a team, we could discharge patients faster and safer. [PGY‐3, Program B, Interview #1]
Housestaff also noted that discharge team experiences were diverse. Some discharge teams were described as cohesive, while others were described as fragmented and characterized by last‐minute problem solving and lack of cooperation among team members:
A low‐quality discharge is a rushed discharge for whatever reason, you don't really know that you're discharging the patient until that day. Those are the ones that are really hard. You're pushing social work to get things set up. They're pushing back at you. [PGY‐2, Program B, Interview #6]
Housestaff concerns about inadequate discharge planning were exacerbated by role confusion and uncertainty about which components of discharge care were to be performed by other team members. Even when housestaff articulated clear ownership for a particular task such as documenting plans in a discharge summary, they were uncertain how these documents would be used by other team members to communicate these plans to patients:
Half the time, I'm not sure if the patient gets the discharge summary, because I enter it but I don't actually know what the nurse does with it. I know she goes over their meds with them and gives them appointments, but if she actually gives them the discharge summary, I have no idea. [PGY‐1, Program A, Interview #18]
Thus, although housestaff described multidisciplinary teamwork as important, they often did not know how to lead or function effectively within the team, leading to conflict, misunderstanding, delays, and inefficiency. Moreover, uncertainty about roles for team members often led to wide variation in discharge practices observed at their institutions.
Lack of Standards for Discharge Procedures
Housestaff described an overall lack of standardization for the discharge process; a high degree of variation in practices was apparent at several levels. Housestaff noted differences in approaches to arranging follow‐up care depending on the hospital where they were rotating:
At this hospital, making follow‐up appointments is intermittent because there are some rotations that have someone help you with that, and others that don't. That is something that I feel should be standardized everywhere. [PGY‐1, Program B, Interview #7]
Housestaff also noted differences in approaches to discharge planning across different services within a single hospital, including examples of units that stood out for their ability to consistently provide high‐quality discharge care:
Coordinating with social work is very team‐dependent. On the Chest service and Virology services, we've got very good social workers who focus on those conditions so they know the issues in and out, and it just flows much more smoothly. [PGY‐3, Program A, Interview #20]
Lastly, variation was also noted in individual physician practices, especially with respect to attending physician involvement with the discharge team and teaching or supervision of housestaff discharge care:
The role of the attending totally varies. This month, I don't even think my attending looked at the prescriptions. She just stamped, stamped, signed whatever. But last month my attending was very involved; she double‐checked every prescription. [PGY‐1, Program A, Interview #21]
Overall, lack of standardization limited efforts to coordinate discharge procedures and set the stage for poor communication practices between discharge team members and patients and their families.
Poor Patient and Family Communication
Housestaff described practices for communicating with patients and families, at the time of discharge, as problematic. Although housestaff articulated this communication as critically important, they also recognized that time allocated to achieving this goal was not always commensurate:
I think, in a perfect world, I would have time to sit down with every single patient and say take these meds in the morning, these in the evening, and these are the reasons you're taking all of them, but I don't think that you have time to do all of that and I find that frustrating. [PGY‐2, Program A, Interview #27]
In addition to direct patient communication, housestaff identified problems with information in printed discharge materials. Although problems could stem from inadequate details in documentation given to patients, information overload was also a concern:
The discharge packet is like a book. I think there's too much extraneous information in it, and it's overwhelming to be discharged with this book of information. [PGY‐1, Program A, Interview #18]
Further, housestaff described the execution of discharge communication as perfunctory and lacking in attention to signs of adequate patient understanding:
Often, all patients get is a handshake and a stack of paperwork. Many of them don't know why they were in the hospital and what was done. [PGY‐2, Program B, Interview #2]
Overall, housestaff described patient understanding as a goal for the entire discharge team, but lacked individual accountability for patient and family communication. Housestaff also indicated that responsibilities to assess patient readiness to navigate the transition from hospital to post‐hospital care were not clearly defined.
Lack of Postdischarge Feedback and Clinical Responsibility
Housestaff described that the norms and culture of being on service focused on the hospital portion of care, and underemphasized post‐hospitalization care. With the extensive workload on inpatient services, housestaff commonly expressed their lack of involvement with a patient's care after discharge:
So often when you're on service once the patient is out of sight, they're out of mind. Once they leave our service, we are not the doctor anymore. That's the mentality. [PGY‐2, Program A, Interview #19]
Additionally, housestaff indicated that they rarely received feedback concerning postdischarge patient outcomes, and that the only mechanism for learning about outcomes of discharge care was patient readmission:
There's a lot of uncertainty at the time of discharge which is frustrating. I hope that I sent them out on the right doses, the right medication, to the right sorts of facilities with the right follow‐up providers, but I never know. The only way I'll find out if it's wrong is they come back to the hospital. [PGY‐1, Program B, Interview #4]
Housestaff also conceded that they could not follow patients postdischarge, given the demands of high turnover on inpatient rotations, and needed to limit their obligations to discharged patients to focus on newly admitted patients:
It's hard to keep track because sometimes we're discharging 10 patients a day, admitting 10 patients a day . So, once they leave, you did a good job and they're okay. [PGY‐3, Program A, Interview #26]
Furthermore, for patients readmitted to the hospital, housestaff described an approach to workup and management that focused on events during the prior admission, rather than events in the postdischarge period:
So if I'm admitting someone who's just been discharged, I think, Is this a new problem? Did we do this to the person? and if it's the same problem, Well, what did we do about it last time? Did we do anything? [PGY‐2, Program B, Interview #13]
Thus, although readmissions were described as problematic and undesirable, housestaff described a limited ability to follow up with patients or learn about the impact of the discharge practices on subsequent patient outcomes. More specifically, housestaff portrayed a limited ability to address the root causes for poor outcomes, such as readmission.
DISCUSSION
Housestaff physicians experienced 5 quality‐limiting factors that collectively created and reinforced a practice environment in which patients and patient outcomes after discharge remain largely out of sight, out of mind. In this environment, discharge was often viewed as a summative event that signaled the conclusion of care in one setting rather than a transition in care from one setting to another. Paradoxically, this environment was apparent despite the values and goals participants described for providing high‐quality discharge care, working within multidisciplinary discharge teams, and reducing readmissions.
The degree to which housestaff were focused on the hospital portion of patients' care, and viewed postdischarge care as beyond their scope or responsibility, was striking. The tight boundary they drew between hospital and post‐hospital care reflected the demanding workload in the hospital, the lack of data feedback about patients post‐hospitalization, and professional norms and expectations about housestaff responsibilities. Downstream effects of this tight boundary may result in confusion for patients and family about who to contact in case of postdischarge complications, and may ultimately catalyze higher emergency department use and readmissions.26 Efforts to redefine inpatient physician responsibilities, as providing patient care until management has been successfully transferred to a community‐based provider, may be necessary to ensure adequate postdischarge continuity of care.27
We also found that housestaff physicians reported marked variation in discharge practices across different hospitals and training settings, across different teams within hospitals, and across individual attending physicians. Although guidelines for discharge care currently endorsed by the National Quality Forum28 and others4, 27, 29 provide excellent templates, our findings suggest that the implementation of these standards at the hospital and physician level is limited. Furthermore, while existing single‐site interventions to standardize various discharge practices provide a foundational evidence base for high‐quality discharge care,2932 our study adds insight into the individual and institutional barriers that prevent diffusion of these practices to other hospitals.
Finally, the lack of coordination within discharge teams, described by housestaff physicians in our study, also suggests a need for improved leadership in the hospital overall and at the level of the discharge team. Studies of high‐performing hospitals have shown that top‐level institutional support is a necessary substrate for the creation and maintenance of high‐performance teamwork.33 At the level of the discharge team, creating a culture of high‐quality discharge care will require greater focus on defining team‐member roles and responsibilities. At the individual level, changes in physician training to provide discharge care are critical, especially since practice patterns learned in residency may predict quality of care over physicians' careers.34 Recent examples of curricular innovations for discharge care are encouraging,35 but more research on how physicians learn about discharge care and related systems‐based practice, learning, and improvement is needed to enable changes on a national scale.
Our findings should be interpreted in light of several limitations. First, we recruited housestaff from 1 specialty at 2 large training programs; experiences of housestaff in other specialties and other training programs may differ. Second, we cannot quantify the frequency of specific discharge procedures or outcomes described by our participants, as this was beyond the scope of our qualitative approach. Nevertheless, our aim was to explore the range of quality‐limiting factors, rather than their prevalence, and this in‐depth analysis has extended previous work by identifying factors that may influence the quality of discharge care. Third, social desirability bias36 could have led participants to exaggerate or minimize aspects of quality‐limiting factors identified in this study. To minimize this potential bias, we included specific prompts for both negative and positive aspects of providing discharge care in our interview guide. Finally, our analytic decisions to over‐sample for interns, and to not include physicians who have completed training (eg, hospitalists), may introduce bias towards inexperience; however, our objective was to study the culture of discharge care at teaching hospitals, and our sample reflects the distribution of labor for tasks of discharge care at such institutions. Future research should address important questions raised by this study about the role of attending physicians in discharge care at teaching and non‐teaching hospitals.
Improving the quality of discharge care is an important step to improving overall outcomes of hospitalization, including reduced adverse events and unnecessary admissions. Our study suggests important quality‐limiting factors embedded in the norms for discharge care at teaching hospitals. These factors are unlikely to change without interventions at multiple levels of hospitals, discharge teams, and individual providers. Targeted interventions to change these practices will be necessary to achieve higher overall quality of care for hospitalized patients at teaching hospitals.
- ,,.Rehospitalizations among patients in the Medicare fee‐for‐service program.N Engl J Med.2009;360:1418–1428.
- ,.Hospital readmission as an accountability measure.JAMA.2011;305(5):504–505.
- Hospital to Home (H2H) Initiative. Available at: http://www.h2hquality.org/. Accessed May 15,2011.
- Better Outcomes for Older adults through Safe Transitions (Project BOOST). Available at: http://www.hospitalmedicine.org/boost. Accessed May 18,2011.
- ,,,,.The association between the quality of inpatient care and early readmission.Ann Intern Med.1995;122(6):415–421.
- ,,,,.The association between the quality of inpatient care and early readmission: a meta‐analysis of the evidence.Med Care.1997;35(10):1044–1059.
- ,.Hospital readmissions as a measure of quality of health care: advantages and limitations.Arch Intern Med.2000;160(8):1074–1081.
- ,,.The hospital discharge: a review of a high risk care transition with highlights of a reengineered discharge process.J Patient Saf.2007;3:97–106.
- ,,, et al.Transitional care of older adults hospitalized with heart failure: a randomized, controlled trial.J Am Geriatr Soc.2004;52(5):675–684.
- ,,,,,.Comprehensive discharge planning with postdischarge support for older patients with congestive heart failure: a meta‐analysis.JAMA.2004;291:1358–1367.
- ,,,,,.Improving the quality of discharge communication with an educational intervention.Pediatrics.2010;126(4):734–739.
- ,,, et al.Improving transitions of care at hospital discharge—implications for pediatric hospitalists and primary care providers.J Healthc Qual.2010;32(5):51–60.
- ,,, et al.Deficits in communication and information transfer between hospital‐based and primary care physicians: implications for patient safety and continuity of care.JAMA.2007;297:831–841.
- ,,, et al.The impact of resident duty hour reform on hospital readmission rates among Medicare beneficiaries.J Gen Intern Med.2011;26(4):405–411.
- American Association of Medical Colleges. What Roles Do Teaching Hospitals Fullfill? Available at: http://www.aamc.org/about/teachhosp_facts1.pdf. Accessed December 15,2009.
- ,,.Qualitative data analysis for health services research: developing taxonomy, themes, and theory.Health Serv Res.2007;42(4):1758–1772.
- ,.Reaching the parts other methods cannot reach: an introduction to qualitative methods in health and health services research.BMJ.1995;311(6996):42–45.
- .Qualitative Research and Evaluation Methods.Thousand Oaks, CA:Sage Publications;2002.
- ,,,,.Consequences of inadequate sign‐out for patient care.Arch Intern Med.2008;168(16):1755–1760.
- ,,, et al.What are covering doctors told about their patients? Analysis of sign‐out among internal medicine house staff.Qual Saf Health Care.2009;18:248–255.
- .,,,,.Getting by: underuse of interpreters by resident physicians.J Gen Intern Med.2008;24(2):256–262.
- .The significance of saturation.Qual Health Res.1995;5(2):147–149.
- ,.The Discovery of Grounded Theory: Strategies for Qualitative Research.Chicago, IL:Aldine;1967.
- ,, eds.Doing Qualitative Research (Research Methods for Primary Care).Thousand Oaks, CA: Sage;1999:33–46.
- ,.Qualitative Data Analysis.2nd ed.Thousand Oaks, CA: Sage;1994.
- ,,, et al.Reduction of 30‐day post‐discharge hospital readmission or ED visit rates in high‐risk elderly medical patients through delivery of a targeted care bundle.J Hosp Med.2009;4:211–218.
- ,,, et al.Transitions of Care Consensus Policy Statement American College of Physicians–Society of General Internal Medicine–Society of Hospital Medicine–American Geriatrics Society–American College of Emergency Physicians–Society of Academic Emergency Medicine.J Gen Intern Med.2009;24(8):971–976.
- .Reengineering hospital discharge: a protocol to improve patient safety, reduce costs, and boost patient satisfaction.Am J Med Qual.2009;24(4):344–346.
- ,,.Assessing the quality of preparation for post‐hospital care from the patient's perspective: the care transitions measure.Med Care.2005;43(3):246–255.
- ,,, et al.Hospital discharge documentation and risk of rehospitalisation.BMJ Qual Saf.2011;20(9):773–778.
- ,,,,.Effect of standardized electronic discharge instructions on post‐discharge hospital utilization.J Gen Intern Med.2011;26(7):718–723.
- ,,, et al.Patient safety concerns arising from test results that return after hospital discharge.Ann Intern Med.2005;143(2):121–128.
- ,,, et al.What distinguishes top‐performing hospitals in acute myocardial infarction mortality rates? A qualitative study.Ann Intern Med.2011;154(6):384–390.
- ,,,,.Evaluating obstetrical residency programs using patient outcomes.JAMA.2009;302(12):1277–1283.
- ,,, et al.Creating a better discharge summary: improvement in quality and timeliness using an electronic discharge summary.J Hosp Med.2009;4:219–225.
- ,,.Thinking About Answers: The Application of Cognitive Processes to Survey Methodology.San Francisco, CA:Jossey‐Bass;1996.
Hospital readmission is a common, costly, and often preventable occurrence in the United States. Among Medicare beneficiaries, 1 out of 5 patients is readmitted within 30 days, and the cost of unplanned readmissions exceeded $17 billion in 2007.1 As a result, the Centers for Medicare and Medicaid Services (CMS) and others have called for focused efforts to reduce hospital readmission rates.24 The quality of hospital discharge care is a key determinant of readmission rates,57 and many recent interventions to reduce readmission have focused on improving various aspects of the discharge process.810 Although these approaches have shown promise, the role of physicians in improving the quality of discharge care has not been extensively studied. Existing studies have focused on communication barriers between physicians in the hospital and outpatient settings,1113 but these have not examined the hospital discharge process itself and the experience of physicians in that process. Physician perspectives on this process are critical to inform strategies to leverage their roles in improving the performance of discharge teams.
Accordingly, we sought to understand physician experiences with the hospital discharge process, focusing on factors that physicians perceived to limit the quality of the discharge process at teaching hospitals. Teaching hospitals provided an ideal setting for this study given their high readmission rates,14 despite efforts to improve discharge quality of care through multidisciplinary team approaches. We focused on housestaff physicians because of their in‐depth involvement in the discharge process at teaching hospitals, which collectively provide 20% of all hospital care in the US.15 Housestaff perspectives on quality‐limiting factors of the discharge process may help identify targets for interventions to improve the quality of inpatient discharge care and to ultimately reduce hospital readmissions.
METHODS
Study Design and Sample
We conducted a qualitative study of internal medicine housestaff at 2 residency programs, with 7 different hospital settings, to ensure breadth of experience and perspectives (Table 1). Both programs train a large number of housestaff, and both are affiliated with prestigious medical schools and major universities. Qualitative methods are ideally suited to examine physician perspectives on discharge care because the inherent complexity of discharge processes, and importance of communication and multidisciplinary teamwork, are difficult to quantify.16, 17 We focused on housestaff because they are responsible for coordinating discharge care at teaching hospitals and have direct experience with the phenomenon of interest.18 We created a discussion guide (see Supporting Information, Out of Sight, Out of Mind Interview Guide in the online version of this article) informed by clinical experience and recent qualitative studies of housestaff, to guide conversation during the interviews.1921
| Hospital | Residency Program | Ownership | Setting | Teaching Intensity |
|---|---|---|---|---|
| A | A | Private, nonprofit | Urban | High |
| B | B | Private, nonprofit | Semi‐urban | High |
| C | A | Private, nonprofit specialty (oncology) | Urban | High |
| D | B | Private, nonprofit community hospital | Rural | Low |
| E | A | Public (Veterans Affairs) | Urban | High |
| F | B | Public (Veterans Affairs) | Semi‐urban | High |
| G | A | Public (county hospital) | Urban | High |
We obtained a list of current housestaff from directors at both residency programs and invited participation from all housestaff with an inpatient rotation in the preceding 6 months, using purposeful sampling to ensure adequate representation by postgraduate year (PGY) and gender. Given that interns are more involved in executing the details of discharge care, we purposefully over‐sampled for PGY‐1 rather than sampling each PGY equally. As an incentive, participants were entered into a lottery for one of three $100 gift cards at each site. All participants gave informed consent, and all research procedures were approved by the Institutional Review Boards of record for both residency programs.
Data Collection
We conducted in‐depth interviews until no new concepts were elicited with successive interviews; this theoretical saturation22, 23 occurred after 29 interviews. To ensure rigor in our approach, we adhered to a focused scope of inquiry, developed a cohesive theoretical sample, and held regular team meetings to assess the adequacy and comprehensiveness of all analytic results.24 All interviews were digitally recorded and transcribed by a professional transcription service, and all transcripts were reviewed for accuracy. A brief demographic survey was administered after each interview (Table 2).
| Characteristic | Total N = 29 |
|---|---|
| |
| Age | Mean: 29.6 yr |
| Range: 2634 yr | |
| Gender | |
| Female | 19 (66%) |
| Male | 10 (34%) |
| Residency program | |
| A | 12 (41%) |
| B | 17 (59%) |
| Year in training | |
| PGY‐1 | 17 (59%) |
| PGY‐2 | 7 (24%) |
| PGY‐3 | 5 (17%) |
Data Analysis
We employed the constant comparative method of qualitative data analysis.16, 18 Codes were developed iteratively and refined to identify conceptual segments of the data. The team reviewed the code structure throughout the analytic process, and revised the scope and content of codes as needed. The final code structure contained 22 codes, which we subsequently integrated into the 5 recurrent themes. Two members of the research team (S.R.G., D.S.) coded all of the transcripts; other team members (L.I.H., L.C., and E.H.B.) double‐ and triple‐coded portions of the data. All data were entered into a single database (Atlas.ti version 5.2) to ensure consistent application of codes across all transcripts. Disagreements in coding were resolved through negotiated consensus. Additional strategies to enhance the reliability of our findings included creation of an audit trail documenting the data coding and analysis processes, and seeking participant review and confirmation of the findings.24, 25 We shared summary findings with all participants via e‐mail, and sought participant confirmation through in‐person conversations with several individuals and responses to findings via e‐mail.
RESULTS
Based on interview transcripts from 29 internal medicine housestaff physicians (Table 3), we identified 5 recurrent and unifying themes describing factors perceived to limit the quality of inpatient discharge care: (1) competing priorities in the discharge process; (2) inadequate coordination within multidisciplinary discharge teams; (3) lack of standardization in discharge procedures; (4) poor patient and family communication; and (5) lack of postdischarge feedback and clinical responsibility.
| Theme: Competing priorities of timeliness and thoroughness |
| Supporting codes |
| Professional or hospital norms about discharge |
| Time pressures including early discharge rules |
| Balancing multiple priorities or responsibilities |
| Duty hours and off hours including weekends and cross‐cover |
| Theme: Lack of coordination within multidisciplinary discharge team members |
| Supporting codes |
| Teamwork including individual roles, communication and coordination between team members |
| Clinical complexity or specific complexities of the healthcare system |
| Specific difficulties arranging for follow‐up care |
| Theme: Uncertainty about provider roles and patient readiness for discharge |
| Supporting codes |
| Uncertainty about provider roles or discharge timing |
| Readmissions and bounce‐backs |
| Clinical complexity or specific complexities of the healthcare system |
| Theme: Lack of standardization in discharge procedures |
| Supporting codes |
| Teamwork |
| Readmissions and bounce‐backs |
| Patient safety including the concept of safe discharge and mistakes or errors |
| Clinical complexity or specific complexities of the healthcare system |
| Checklists or other specific procedures/aids or clever systems to improve quality |
| Discharge documentation |
| Theme: Poor patient communication and postdischarge continuity of care |
| Supporting codes |
| Lack of continuity of care after discharge |
| Specific difficulties arranging for follow‐up care |
| Information technology including electronic medical records |
| Patient communication, education, or understanding |
| Discharge documentation |
Competing Priorities in the Discharge Process
Housestaff uniformly asserted the importance of consistently performing high‐quality discharge; however, they identified several competing priorities that turned their attention elsewhere. Housestaff noted that the pressure to discharge early in the day was palpable, even if this compromised the thoroughness of the discharge process. Illustrating this theme, one participant said:
One thing that I found very frustrating here is the goal for 11:00 AM discharge . It's more important to get the patient out than it is to be thorough in the discharge is how it feels a lot of the time. [PGY‐1, Program B, Interview #3]
In addition to competing institutional priorities, housestaff also articulated tensions between their roles as learners and providers. Although educational duties, such as noon conference, contributed to general time constraints, they highlighted other patient care responsibilities as the primary competing priority to a high‐quality discharge:
The worst part in discharging is that it takes a lot of time and you're often limited by having to admit new patients . I don't think people realize how much time it takes often a lot longer than doing an admission. [PGY‐1, Program A, Interview #27]
Participants also described competing priorities in the context of transfers of care or sign‐out from the post‐call team to the on‐call team. Because discharges frequently occurred around the same time as these sign‐outs, housestaff described conflicting institutional priorities that created ambiguity about post‐call discharge responsibilities:
When you're post‐call, the hospital administration wants you to be out by 12:00, but then they're also saying do all the [discharge] stuff. So, which one do you want me to do? They kind of endorse both and that's confusing. [PGY‐1, Program B, Interview #7]
Although housestaff articulated patient safety as an essential goal of discharge care, the net effect of these competing individual and institutional priorities was an inconsistent focus on the discharge process and an unspoken or hidden message that discharge care was not of top‐level importance.
Inadequate Coordination Within Multidisciplinary Discharge Teams
Housestaff described difficulties in coordination and communication with multidisciplinary staff involved with the discharge process beyond the physician team. They felt their engagement with other team members was constrained by professional hierarchy and insufficient contact among team members, both of which directly affected hospital efficiency and patient safety:
On the hospital floor, it still feels like a hierarchy and it's very difficult to fit communication with nurses into our daily rounds . If we worked together more as a team, we could discharge patients faster and safer. [PGY‐3, Program B, Interview #1]
Housestaff also noted that discharge team experiences were diverse. Some discharge teams were described as cohesive, while others were described as fragmented and characterized by last‐minute problem solving and lack of cooperation among team members:
A low‐quality discharge is a rushed discharge for whatever reason, you don't really know that you're discharging the patient until that day. Those are the ones that are really hard. You're pushing social work to get things set up. They're pushing back at you. [PGY‐2, Program B, Interview #6]
Housestaff concerns about inadequate discharge planning were exacerbated by role confusion and uncertainty about which components of discharge care were to be performed by other team members. Even when housestaff articulated clear ownership for a particular task such as documenting plans in a discharge summary, they were uncertain how these documents would be used by other team members to communicate these plans to patients:
Half the time, I'm not sure if the patient gets the discharge summary, because I enter it but I don't actually know what the nurse does with it. I know she goes over their meds with them and gives them appointments, but if she actually gives them the discharge summary, I have no idea. [PGY‐1, Program A, Interview #18]
Thus, although housestaff described multidisciplinary teamwork as important, they often did not know how to lead or function effectively within the team, leading to conflict, misunderstanding, delays, and inefficiency. Moreover, uncertainty about roles for team members often led to wide variation in discharge practices observed at their institutions.
Lack of Standards for Discharge Procedures
Housestaff described an overall lack of standardization for the discharge process; a high degree of variation in practices was apparent at several levels. Housestaff noted differences in approaches to arranging follow‐up care depending on the hospital where they were rotating:
At this hospital, making follow‐up appointments is intermittent because there are some rotations that have someone help you with that, and others that don't. That is something that I feel should be standardized everywhere. [PGY‐1, Program B, Interview #7]
Housestaff also noted differences in approaches to discharge planning across different services within a single hospital, including examples of units that stood out for their ability to consistently provide high‐quality discharge care:
Coordinating with social work is very team‐dependent. On the Chest service and Virology services, we've got very good social workers who focus on those conditions so they know the issues in and out, and it just flows much more smoothly. [PGY‐3, Program A, Interview #20]
Lastly, variation was also noted in individual physician practices, especially with respect to attending physician involvement with the discharge team and teaching or supervision of housestaff discharge care:
The role of the attending totally varies. This month, I don't even think my attending looked at the prescriptions. She just stamped, stamped, signed whatever. But last month my attending was very involved; she double‐checked every prescription. [PGY‐1, Program A, Interview #21]
Overall, lack of standardization limited efforts to coordinate discharge procedures and set the stage for poor communication practices between discharge team members and patients and their families.
Poor Patient and Family Communication
Housestaff described practices for communicating with patients and families, at the time of discharge, as problematic. Although housestaff articulated this communication as critically important, they also recognized that time allocated to achieving this goal was not always commensurate:
I think, in a perfect world, I would have time to sit down with every single patient and say take these meds in the morning, these in the evening, and these are the reasons you're taking all of them, but I don't think that you have time to do all of that and I find that frustrating. [PGY‐2, Program A, Interview #27]
In addition to direct patient communication, housestaff identified problems with information in printed discharge materials. Although problems could stem from inadequate details in documentation given to patients, information overload was also a concern:
The discharge packet is like a book. I think there's too much extraneous information in it, and it's overwhelming to be discharged with this book of information. [PGY‐1, Program A, Interview #18]
Further, housestaff described the execution of discharge communication as perfunctory and lacking in attention to signs of adequate patient understanding:
Often, all patients get is a handshake and a stack of paperwork. Many of them don't know why they were in the hospital and what was done. [PGY‐2, Program B, Interview #2]
Overall, housestaff described patient understanding as a goal for the entire discharge team, but lacked individual accountability for patient and family communication. Housestaff also indicated that responsibilities to assess patient readiness to navigate the transition from hospital to post‐hospital care were not clearly defined.
Lack of Postdischarge Feedback and Clinical Responsibility
Housestaff described that the norms and culture of being on service focused on the hospital portion of care, and underemphasized post‐hospitalization care. With the extensive workload on inpatient services, housestaff commonly expressed their lack of involvement with a patient's care after discharge:
So often when you're on service once the patient is out of sight, they're out of mind. Once they leave our service, we are not the doctor anymore. That's the mentality. [PGY‐2, Program A, Interview #19]
Additionally, housestaff indicated that they rarely received feedback concerning postdischarge patient outcomes, and that the only mechanism for learning about outcomes of discharge care was patient readmission:
There's a lot of uncertainty at the time of discharge which is frustrating. I hope that I sent them out on the right doses, the right medication, to the right sorts of facilities with the right follow‐up providers, but I never know. The only way I'll find out if it's wrong is they come back to the hospital. [PGY‐1, Program B, Interview #4]
Housestaff also conceded that they could not follow patients postdischarge, given the demands of high turnover on inpatient rotations, and needed to limit their obligations to discharged patients to focus on newly admitted patients:
It's hard to keep track because sometimes we're discharging 10 patients a day, admitting 10 patients a day . So, once they leave, you did a good job and they're okay. [PGY‐3, Program A, Interview #26]
Furthermore, for patients readmitted to the hospital, housestaff described an approach to workup and management that focused on events during the prior admission, rather than events in the postdischarge period:
So if I'm admitting someone who's just been discharged, I think, Is this a new problem? Did we do this to the person? and if it's the same problem, Well, what did we do about it last time? Did we do anything? [PGY‐2, Program B, Interview #13]
Thus, although readmissions were described as problematic and undesirable, housestaff described a limited ability to follow up with patients or learn about the impact of the discharge practices on subsequent patient outcomes. More specifically, housestaff portrayed a limited ability to address the root causes for poor outcomes, such as readmission.
DISCUSSION
Housestaff physicians experienced 5 quality‐limiting factors that collectively created and reinforced a practice environment in which patients and patient outcomes after discharge remain largely out of sight, out of mind. In this environment, discharge was often viewed as a summative event that signaled the conclusion of care in one setting rather than a transition in care from one setting to another. Paradoxically, this environment was apparent despite the values and goals participants described for providing high‐quality discharge care, working within multidisciplinary discharge teams, and reducing readmissions.
The degree to which housestaff were focused on the hospital portion of patients' care, and viewed postdischarge care as beyond their scope or responsibility, was striking. The tight boundary they drew between hospital and post‐hospital care reflected the demanding workload in the hospital, the lack of data feedback about patients post‐hospitalization, and professional norms and expectations about housestaff responsibilities. Downstream effects of this tight boundary may result in confusion for patients and family about who to contact in case of postdischarge complications, and may ultimately catalyze higher emergency department use and readmissions.26 Efforts to redefine inpatient physician responsibilities, as providing patient care until management has been successfully transferred to a community‐based provider, may be necessary to ensure adequate postdischarge continuity of care.27
We also found that housestaff physicians reported marked variation in discharge practices across different hospitals and training settings, across different teams within hospitals, and across individual attending physicians. Although guidelines for discharge care currently endorsed by the National Quality Forum28 and others4, 27, 29 provide excellent templates, our findings suggest that the implementation of these standards at the hospital and physician level is limited. Furthermore, while existing single‐site interventions to standardize various discharge practices provide a foundational evidence base for high‐quality discharge care,2932 our study adds insight into the individual and institutional barriers that prevent diffusion of these practices to other hospitals.
Finally, the lack of coordination within discharge teams, described by housestaff physicians in our study, also suggests a need for improved leadership in the hospital overall and at the level of the discharge team. Studies of high‐performing hospitals have shown that top‐level institutional support is a necessary substrate for the creation and maintenance of high‐performance teamwork.33 At the level of the discharge team, creating a culture of high‐quality discharge care will require greater focus on defining team‐member roles and responsibilities. At the individual level, changes in physician training to provide discharge care are critical, especially since practice patterns learned in residency may predict quality of care over physicians' careers.34 Recent examples of curricular innovations for discharge care are encouraging,35 but more research on how physicians learn about discharge care and related systems‐based practice, learning, and improvement is needed to enable changes on a national scale.
Our findings should be interpreted in light of several limitations. First, we recruited housestaff from 1 specialty at 2 large training programs; experiences of housestaff in other specialties and other training programs may differ. Second, we cannot quantify the frequency of specific discharge procedures or outcomes described by our participants, as this was beyond the scope of our qualitative approach. Nevertheless, our aim was to explore the range of quality‐limiting factors, rather than their prevalence, and this in‐depth analysis has extended previous work by identifying factors that may influence the quality of discharge care. Third, social desirability bias36 could have led participants to exaggerate or minimize aspects of quality‐limiting factors identified in this study. To minimize this potential bias, we included specific prompts for both negative and positive aspects of providing discharge care in our interview guide. Finally, our analytic decisions to over‐sample for interns, and to not include physicians who have completed training (eg, hospitalists), may introduce bias towards inexperience; however, our objective was to study the culture of discharge care at teaching hospitals, and our sample reflects the distribution of labor for tasks of discharge care at such institutions. Future research should address important questions raised by this study about the role of attending physicians in discharge care at teaching and non‐teaching hospitals.
Improving the quality of discharge care is an important step to improving overall outcomes of hospitalization, including reduced adverse events and unnecessary admissions. Our study suggests important quality‐limiting factors embedded in the norms for discharge care at teaching hospitals. These factors are unlikely to change without interventions at multiple levels of hospitals, discharge teams, and individual providers. Targeted interventions to change these practices will be necessary to achieve higher overall quality of care for hospitalized patients at teaching hospitals.
Hospital readmission is a common, costly, and often preventable occurrence in the United States. Among Medicare beneficiaries, 1 out of 5 patients is readmitted within 30 days, and the cost of unplanned readmissions exceeded $17 billion in 2007.1 As a result, the Centers for Medicare and Medicaid Services (CMS) and others have called for focused efforts to reduce hospital readmission rates.24 The quality of hospital discharge care is a key determinant of readmission rates,57 and many recent interventions to reduce readmission have focused on improving various aspects of the discharge process.810 Although these approaches have shown promise, the role of physicians in improving the quality of discharge care has not been extensively studied. Existing studies have focused on communication barriers between physicians in the hospital and outpatient settings,1113 but these have not examined the hospital discharge process itself and the experience of physicians in that process. Physician perspectives on this process are critical to inform strategies to leverage their roles in improving the performance of discharge teams.
Accordingly, we sought to understand physician experiences with the hospital discharge process, focusing on factors that physicians perceived to limit the quality of the discharge process at teaching hospitals. Teaching hospitals provided an ideal setting for this study given their high readmission rates,14 despite efforts to improve discharge quality of care through multidisciplinary team approaches. We focused on housestaff physicians because of their in‐depth involvement in the discharge process at teaching hospitals, which collectively provide 20% of all hospital care in the US.15 Housestaff perspectives on quality‐limiting factors of the discharge process may help identify targets for interventions to improve the quality of inpatient discharge care and to ultimately reduce hospital readmissions.
METHODS
Study Design and Sample
We conducted a qualitative study of internal medicine housestaff at 2 residency programs, with 7 different hospital settings, to ensure breadth of experience and perspectives (Table 1). Both programs train a large number of housestaff, and both are affiliated with prestigious medical schools and major universities. Qualitative methods are ideally suited to examine physician perspectives on discharge care because the inherent complexity of discharge processes, and importance of communication and multidisciplinary teamwork, are difficult to quantify.16, 17 We focused on housestaff because they are responsible for coordinating discharge care at teaching hospitals and have direct experience with the phenomenon of interest.18 We created a discussion guide (see Supporting Information, Out of Sight, Out of Mind Interview Guide in the online version of this article) informed by clinical experience and recent qualitative studies of housestaff, to guide conversation during the interviews.1921
| Hospital | Residency Program | Ownership | Setting | Teaching Intensity |
|---|---|---|---|---|
| A | A | Private, nonprofit | Urban | High |
| B | B | Private, nonprofit | Semi‐urban | High |
| C | A | Private, nonprofit specialty (oncology) | Urban | High |
| D | B | Private, nonprofit community hospital | Rural | Low |
| E | A | Public (Veterans Affairs) | Urban | High |
| F | B | Public (Veterans Affairs) | Semi‐urban | High |
| G | A | Public (county hospital) | Urban | High |
We obtained a list of current housestaff from directors at both residency programs and invited participation from all housestaff with an inpatient rotation in the preceding 6 months, using purposeful sampling to ensure adequate representation by postgraduate year (PGY) and gender. Given that interns are more involved in executing the details of discharge care, we purposefully over‐sampled for PGY‐1 rather than sampling each PGY equally. As an incentive, participants were entered into a lottery for one of three $100 gift cards at each site. All participants gave informed consent, and all research procedures were approved by the Institutional Review Boards of record for both residency programs.
Data Collection
We conducted in‐depth interviews until no new concepts were elicited with successive interviews; this theoretical saturation22, 23 occurred after 29 interviews. To ensure rigor in our approach, we adhered to a focused scope of inquiry, developed a cohesive theoretical sample, and held regular team meetings to assess the adequacy and comprehensiveness of all analytic results.24 All interviews were digitally recorded and transcribed by a professional transcription service, and all transcripts were reviewed for accuracy. A brief demographic survey was administered after each interview (Table 2).
| Characteristic | Total N = 29 |
|---|---|
| |
| Age | Mean: 29.6 yr |
| Range: 2634 yr | |
| Gender | |
| Female | 19 (66%) |
| Male | 10 (34%) |
| Residency program | |
| A | 12 (41%) |
| B | 17 (59%) |
| Year in training | |
| PGY‐1 | 17 (59%) |
| PGY‐2 | 7 (24%) |
| PGY‐3 | 5 (17%) |
Data Analysis
We employed the constant comparative method of qualitative data analysis.16, 18 Codes were developed iteratively and refined to identify conceptual segments of the data. The team reviewed the code structure throughout the analytic process, and revised the scope and content of codes as needed. The final code structure contained 22 codes, which we subsequently integrated into the 5 recurrent themes. Two members of the research team (S.R.G., D.S.) coded all of the transcripts; other team members (L.I.H., L.C., and E.H.B.) double‐ and triple‐coded portions of the data. All data were entered into a single database (Atlas.ti version 5.2) to ensure consistent application of codes across all transcripts. Disagreements in coding were resolved through negotiated consensus. Additional strategies to enhance the reliability of our findings included creation of an audit trail documenting the data coding and analysis processes, and seeking participant review and confirmation of the findings.24, 25 We shared summary findings with all participants via e‐mail, and sought participant confirmation through in‐person conversations with several individuals and responses to findings via e‐mail.
RESULTS
Based on interview transcripts from 29 internal medicine housestaff physicians (Table 3), we identified 5 recurrent and unifying themes describing factors perceived to limit the quality of inpatient discharge care: (1) competing priorities in the discharge process; (2) inadequate coordination within multidisciplinary discharge teams; (3) lack of standardization in discharge procedures; (4) poor patient and family communication; and (5) lack of postdischarge feedback and clinical responsibility.
| Theme: Competing priorities of timeliness and thoroughness |
| Supporting codes |
| Professional or hospital norms about discharge |
| Time pressures including early discharge rules |
| Balancing multiple priorities or responsibilities |
| Duty hours and off hours including weekends and cross‐cover |
| Theme: Lack of coordination within multidisciplinary discharge team members |
| Supporting codes |
| Teamwork including individual roles, communication and coordination between team members |
| Clinical complexity or specific complexities of the healthcare system |
| Specific difficulties arranging for follow‐up care |
| Theme: Uncertainty about provider roles and patient readiness for discharge |
| Supporting codes |
| Uncertainty about provider roles or discharge timing |
| Readmissions and bounce‐backs |
| Clinical complexity or specific complexities of the healthcare system |
| Theme: Lack of standardization in discharge procedures |
| Supporting codes |
| Teamwork |
| Readmissions and bounce‐backs |
| Patient safety including the concept of safe discharge and mistakes or errors |
| Clinical complexity or specific complexities of the healthcare system |
| Checklists or other specific procedures/aids or clever systems to improve quality |
| Discharge documentation |
| Theme: Poor patient communication and postdischarge continuity of care |
| Supporting codes |
| Lack of continuity of care after discharge |
| Specific difficulties arranging for follow‐up care |
| Information technology including electronic medical records |
| Patient communication, education, or understanding |
| Discharge documentation |
Competing Priorities in the Discharge Process
Housestaff uniformly asserted the importance of consistently performing high‐quality discharge; however, they identified several competing priorities that turned their attention elsewhere. Housestaff noted that the pressure to discharge early in the day was palpable, even if this compromised the thoroughness of the discharge process. Illustrating this theme, one participant said:
One thing that I found very frustrating here is the goal for 11:00 AM discharge . It's more important to get the patient out than it is to be thorough in the discharge is how it feels a lot of the time. [PGY‐1, Program B, Interview #3]
In addition to competing institutional priorities, housestaff also articulated tensions between their roles as learners and providers. Although educational duties, such as noon conference, contributed to general time constraints, they highlighted other patient care responsibilities as the primary competing priority to a high‐quality discharge:
The worst part in discharging is that it takes a lot of time and you're often limited by having to admit new patients . I don't think people realize how much time it takes often a lot longer than doing an admission. [PGY‐1, Program A, Interview #27]
Participants also described competing priorities in the context of transfers of care or sign‐out from the post‐call team to the on‐call team. Because discharges frequently occurred around the same time as these sign‐outs, housestaff described conflicting institutional priorities that created ambiguity about post‐call discharge responsibilities:
When you're post‐call, the hospital administration wants you to be out by 12:00, but then they're also saying do all the [discharge] stuff. So, which one do you want me to do? They kind of endorse both and that's confusing. [PGY‐1, Program B, Interview #7]
Although housestaff articulated patient safety as an essential goal of discharge care, the net effect of these competing individual and institutional priorities was an inconsistent focus on the discharge process and an unspoken or hidden message that discharge care was not of top‐level importance.
Inadequate Coordination Within Multidisciplinary Discharge Teams
Housestaff described difficulties in coordination and communication with multidisciplinary staff involved with the discharge process beyond the physician team. They felt their engagement with other team members was constrained by professional hierarchy and insufficient contact among team members, both of which directly affected hospital efficiency and patient safety:
On the hospital floor, it still feels like a hierarchy and it's very difficult to fit communication with nurses into our daily rounds . If we worked together more as a team, we could discharge patients faster and safer. [PGY‐3, Program B, Interview #1]
Housestaff also noted that discharge team experiences were diverse. Some discharge teams were described as cohesive, while others were described as fragmented and characterized by last‐minute problem solving and lack of cooperation among team members:
A low‐quality discharge is a rushed discharge for whatever reason, you don't really know that you're discharging the patient until that day. Those are the ones that are really hard. You're pushing social work to get things set up. They're pushing back at you. [PGY‐2, Program B, Interview #6]
Housestaff concerns about inadequate discharge planning were exacerbated by role confusion and uncertainty about which components of discharge care were to be performed by other team members. Even when housestaff articulated clear ownership for a particular task such as documenting plans in a discharge summary, they were uncertain how these documents would be used by other team members to communicate these plans to patients:
Half the time, I'm not sure if the patient gets the discharge summary, because I enter it but I don't actually know what the nurse does with it. I know she goes over their meds with them and gives them appointments, but if she actually gives them the discharge summary, I have no idea. [PGY‐1, Program A, Interview #18]
Thus, although housestaff described multidisciplinary teamwork as important, they often did not know how to lead or function effectively within the team, leading to conflict, misunderstanding, delays, and inefficiency. Moreover, uncertainty about roles for team members often led to wide variation in discharge practices observed at their institutions.
Lack of Standards for Discharge Procedures
Housestaff described an overall lack of standardization for the discharge process; a high degree of variation in practices was apparent at several levels. Housestaff noted differences in approaches to arranging follow‐up care depending on the hospital where they were rotating:
At this hospital, making follow‐up appointments is intermittent because there are some rotations that have someone help you with that, and others that don't. That is something that I feel should be standardized everywhere. [PGY‐1, Program B, Interview #7]
Housestaff also noted differences in approaches to discharge planning across different services within a single hospital, including examples of units that stood out for their ability to consistently provide high‐quality discharge care:
Coordinating with social work is very team‐dependent. On the Chest service and Virology services, we've got very good social workers who focus on those conditions so they know the issues in and out, and it just flows much more smoothly. [PGY‐3, Program A, Interview #20]
Lastly, variation was also noted in individual physician practices, especially with respect to attending physician involvement with the discharge team and teaching or supervision of housestaff discharge care:
The role of the attending totally varies. This month, I don't even think my attending looked at the prescriptions. She just stamped, stamped, signed whatever. But last month my attending was very involved; she double‐checked every prescription. [PGY‐1, Program A, Interview #21]
Overall, lack of standardization limited efforts to coordinate discharge procedures and set the stage for poor communication practices between discharge team members and patients and their families.
Poor Patient and Family Communication
Housestaff described practices for communicating with patients and families, at the time of discharge, as problematic. Although housestaff articulated this communication as critically important, they also recognized that time allocated to achieving this goal was not always commensurate:
I think, in a perfect world, I would have time to sit down with every single patient and say take these meds in the morning, these in the evening, and these are the reasons you're taking all of them, but I don't think that you have time to do all of that and I find that frustrating. [PGY‐2, Program A, Interview #27]
In addition to direct patient communication, housestaff identified problems with information in printed discharge materials. Although problems could stem from inadequate details in documentation given to patients, information overload was also a concern:
The discharge packet is like a book. I think there's too much extraneous information in it, and it's overwhelming to be discharged with this book of information. [PGY‐1, Program A, Interview #18]
Further, housestaff described the execution of discharge communication as perfunctory and lacking in attention to signs of adequate patient understanding:
Often, all patients get is a handshake and a stack of paperwork. Many of them don't know why they were in the hospital and what was done. [PGY‐2, Program B, Interview #2]
Overall, housestaff described patient understanding as a goal for the entire discharge team, but lacked individual accountability for patient and family communication. Housestaff also indicated that responsibilities to assess patient readiness to navigate the transition from hospital to post‐hospital care were not clearly defined.
Lack of Postdischarge Feedback and Clinical Responsibility
Housestaff described that the norms and culture of being on service focused on the hospital portion of care, and underemphasized post‐hospitalization care. With the extensive workload on inpatient services, housestaff commonly expressed their lack of involvement with a patient's care after discharge:
So often when you're on service once the patient is out of sight, they're out of mind. Once they leave our service, we are not the doctor anymore. That's the mentality. [PGY‐2, Program A, Interview #19]
Additionally, housestaff indicated that they rarely received feedback concerning postdischarge patient outcomes, and that the only mechanism for learning about outcomes of discharge care was patient readmission:
There's a lot of uncertainty at the time of discharge which is frustrating. I hope that I sent them out on the right doses, the right medication, to the right sorts of facilities with the right follow‐up providers, but I never know. The only way I'll find out if it's wrong is they come back to the hospital. [PGY‐1, Program B, Interview #4]
Housestaff also conceded that they could not follow patients postdischarge, given the demands of high turnover on inpatient rotations, and needed to limit their obligations to discharged patients to focus on newly admitted patients:
It's hard to keep track because sometimes we're discharging 10 patients a day, admitting 10 patients a day . So, once they leave, you did a good job and they're okay. [PGY‐3, Program A, Interview #26]
Furthermore, for patients readmitted to the hospital, housestaff described an approach to workup and management that focused on events during the prior admission, rather than events in the postdischarge period:
So if I'm admitting someone who's just been discharged, I think, Is this a new problem? Did we do this to the person? and if it's the same problem, Well, what did we do about it last time? Did we do anything? [PGY‐2, Program B, Interview #13]
Thus, although readmissions were described as problematic and undesirable, housestaff described a limited ability to follow up with patients or learn about the impact of the discharge practices on subsequent patient outcomes. More specifically, housestaff portrayed a limited ability to address the root causes for poor outcomes, such as readmission.
DISCUSSION
Housestaff physicians experienced 5 quality‐limiting factors that collectively created and reinforced a practice environment in which patients and patient outcomes after discharge remain largely out of sight, out of mind. In this environment, discharge was often viewed as a summative event that signaled the conclusion of care in one setting rather than a transition in care from one setting to another. Paradoxically, this environment was apparent despite the values and goals participants described for providing high‐quality discharge care, working within multidisciplinary discharge teams, and reducing readmissions.
The degree to which housestaff were focused on the hospital portion of patients' care, and viewed postdischarge care as beyond their scope or responsibility, was striking. The tight boundary they drew between hospital and post‐hospital care reflected the demanding workload in the hospital, the lack of data feedback about patients post‐hospitalization, and professional norms and expectations about housestaff responsibilities. Downstream effects of this tight boundary may result in confusion for patients and family about who to contact in case of postdischarge complications, and may ultimately catalyze higher emergency department use and readmissions.26 Efforts to redefine inpatient physician responsibilities, as providing patient care until management has been successfully transferred to a community‐based provider, may be necessary to ensure adequate postdischarge continuity of care.27
We also found that housestaff physicians reported marked variation in discharge practices across different hospitals and training settings, across different teams within hospitals, and across individual attending physicians. Although guidelines for discharge care currently endorsed by the National Quality Forum28 and others4, 27, 29 provide excellent templates, our findings suggest that the implementation of these standards at the hospital and physician level is limited. Furthermore, while existing single‐site interventions to standardize various discharge practices provide a foundational evidence base for high‐quality discharge care,2932 our study adds insight into the individual and institutional barriers that prevent diffusion of these practices to other hospitals.
Finally, the lack of coordination within discharge teams, described by housestaff physicians in our study, also suggests a need for improved leadership in the hospital overall and at the level of the discharge team. Studies of high‐performing hospitals have shown that top‐level institutional support is a necessary substrate for the creation and maintenance of high‐performance teamwork.33 At the level of the discharge team, creating a culture of high‐quality discharge care will require greater focus on defining team‐member roles and responsibilities. At the individual level, changes in physician training to provide discharge care are critical, especially since practice patterns learned in residency may predict quality of care over physicians' careers.34 Recent examples of curricular innovations for discharge care are encouraging,35 but more research on how physicians learn about discharge care and related systems‐based practice, learning, and improvement is needed to enable changes on a national scale.
Our findings should be interpreted in light of several limitations. First, we recruited housestaff from 1 specialty at 2 large training programs; experiences of housestaff in other specialties and other training programs may differ. Second, we cannot quantify the frequency of specific discharge procedures or outcomes described by our participants, as this was beyond the scope of our qualitative approach. Nevertheless, our aim was to explore the range of quality‐limiting factors, rather than their prevalence, and this in‐depth analysis has extended previous work by identifying factors that may influence the quality of discharge care. Third, social desirability bias36 could have led participants to exaggerate or minimize aspects of quality‐limiting factors identified in this study. To minimize this potential bias, we included specific prompts for both negative and positive aspects of providing discharge care in our interview guide. Finally, our analytic decisions to over‐sample for interns, and to not include physicians who have completed training (eg, hospitalists), may introduce bias towards inexperience; however, our objective was to study the culture of discharge care at teaching hospitals, and our sample reflects the distribution of labor for tasks of discharge care at such institutions. Future research should address important questions raised by this study about the role of attending physicians in discharge care at teaching and non‐teaching hospitals.
Improving the quality of discharge care is an important step to improving overall outcomes of hospitalization, including reduced adverse events and unnecessary admissions. Our study suggests important quality‐limiting factors embedded in the norms for discharge care at teaching hospitals. These factors are unlikely to change without interventions at multiple levels of hospitals, discharge teams, and individual providers. Targeted interventions to change these practices will be necessary to achieve higher overall quality of care for hospitalized patients at teaching hospitals.
- ,,.Rehospitalizations among patients in the Medicare fee‐for‐service program.N Engl J Med.2009;360:1418–1428.
- ,.Hospital readmission as an accountability measure.JAMA.2011;305(5):504–505.
- Hospital to Home (H2H) Initiative. Available at: http://www.h2hquality.org/. Accessed May 15,2011.
- Better Outcomes for Older adults through Safe Transitions (Project BOOST). Available at: http://www.hospitalmedicine.org/boost. Accessed May 18,2011.
- ,,,,.The association between the quality of inpatient care and early readmission.Ann Intern Med.1995;122(6):415–421.
- ,,,,.The association between the quality of inpatient care and early readmission: a meta‐analysis of the evidence.Med Care.1997;35(10):1044–1059.
- ,.Hospital readmissions as a measure of quality of health care: advantages and limitations.Arch Intern Med.2000;160(8):1074–1081.
- ,,.The hospital discharge: a review of a high risk care transition with highlights of a reengineered discharge process.J Patient Saf.2007;3:97–106.
- ,,, et al.Transitional care of older adults hospitalized with heart failure: a randomized, controlled trial.J Am Geriatr Soc.2004;52(5):675–684.
- ,,,,,.Comprehensive discharge planning with postdischarge support for older patients with congestive heart failure: a meta‐analysis.JAMA.2004;291:1358–1367.
- ,,,,,.Improving the quality of discharge communication with an educational intervention.Pediatrics.2010;126(4):734–739.
- ,,, et al.Improving transitions of care at hospital discharge—implications for pediatric hospitalists and primary care providers.J Healthc Qual.2010;32(5):51–60.
- ,,, et al.Deficits in communication and information transfer between hospital‐based and primary care physicians: implications for patient safety and continuity of care.JAMA.2007;297:831–841.
- ,,, et al.The impact of resident duty hour reform on hospital readmission rates among Medicare beneficiaries.J Gen Intern Med.2011;26(4):405–411.
- American Association of Medical Colleges. What Roles Do Teaching Hospitals Fullfill? Available at: http://www.aamc.org/about/teachhosp_facts1.pdf. Accessed December 15,2009.
- ,,.Qualitative data analysis for health services research: developing taxonomy, themes, and theory.Health Serv Res.2007;42(4):1758–1772.
- ,.Reaching the parts other methods cannot reach: an introduction to qualitative methods in health and health services research.BMJ.1995;311(6996):42–45.
- .Qualitative Research and Evaluation Methods.Thousand Oaks, CA:Sage Publications;2002.
- ,,,,.Consequences of inadequate sign‐out for patient care.Arch Intern Med.2008;168(16):1755–1760.
- ,,, et al.What are covering doctors told about their patients? Analysis of sign‐out among internal medicine house staff.Qual Saf Health Care.2009;18:248–255.
- .,,,,.Getting by: underuse of interpreters by resident physicians.J Gen Intern Med.2008;24(2):256–262.
- .The significance of saturation.Qual Health Res.1995;5(2):147–149.
- ,.The Discovery of Grounded Theory: Strategies for Qualitative Research.Chicago, IL:Aldine;1967.
- ,, eds.Doing Qualitative Research (Research Methods for Primary Care).Thousand Oaks, CA: Sage;1999:33–46.
- ,.Qualitative Data Analysis.2nd ed.Thousand Oaks, CA: Sage;1994.
- ,,, et al.Reduction of 30‐day post‐discharge hospital readmission or ED visit rates in high‐risk elderly medical patients through delivery of a targeted care bundle.J Hosp Med.2009;4:211–218.
- ,,, et al.Transitions of Care Consensus Policy Statement American College of Physicians–Society of General Internal Medicine–Society of Hospital Medicine–American Geriatrics Society–American College of Emergency Physicians–Society of Academic Emergency Medicine.J Gen Intern Med.2009;24(8):971–976.
- .Reengineering hospital discharge: a protocol to improve patient safety, reduce costs, and boost patient satisfaction.Am J Med Qual.2009;24(4):344–346.
- ,,.Assessing the quality of preparation for post‐hospital care from the patient's perspective: the care transitions measure.Med Care.2005;43(3):246–255.
- ,,, et al.Hospital discharge documentation and risk of rehospitalisation.BMJ Qual Saf.2011;20(9):773–778.
- ,,,,.Effect of standardized electronic discharge instructions on post‐discharge hospital utilization.J Gen Intern Med.2011;26(7):718–723.
- ,,, et al.Patient safety concerns arising from test results that return after hospital discharge.Ann Intern Med.2005;143(2):121–128.
- ,,, et al.What distinguishes top‐performing hospitals in acute myocardial infarction mortality rates? A qualitative study.Ann Intern Med.2011;154(6):384–390.
- ,,,,.Evaluating obstetrical residency programs using patient outcomes.JAMA.2009;302(12):1277–1283.
- ,,, et al.Creating a better discharge summary: improvement in quality and timeliness using an electronic discharge summary.J Hosp Med.2009;4:219–225.
- ,,.Thinking About Answers: The Application of Cognitive Processes to Survey Methodology.San Francisco, CA:Jossey‐Bass;1996.
- ,,.Rehospitalizations among patients in the Medicare fee‐for‐service program.N Engl J Med.2009;360:1418–1428.
- ,.Hospital readmission as an accountability measure.JAMA.2011;305(5):504–505.
- Hospital to Home (H2H) Initiative. Available at: http://www.h2hquality.org/. Accessed May 15,2011.
- Better Outcomes for Older adults through Safe Transitions (Project BOOST). Available at: http://www.hospitalmedicine.org/boost. Accessed May 18,2011.
- ,,,,.The association between the quality of inpatient care and early readmission.Ann Intern Med.1995;122(6):415–421.
- ,,,,.The association between the quality of inpatient care and early readmission: a meta‐analysis of the evidence.Med Care.1997;35(10):1044–1059.
- ,.Hospital readmissions as a measure of quality of health care: advantages and limitations.Arch Intern Med.2000;160(8):1074–1081.
- ,,.The hospital discharge: a review of a high risk care transition with highlights of a reengineered discharge process.J Patient Saf.2007;3:97–106.
- ,,, et al.Transitional care of older adults hospitalized with heart failure: a randomized, controlled trial.J Am Geriatr Soc.2004;52(5):675–684.
- ,,,,,.Comprehensive discharge planning with postdischarge support for older patients with congestive heart failure: a meta‐analysis.JAMA.2004;291:1358–1367.
- ,,,,,.Improving the quality of discharge communication with an educational intervention.Pediatrics.2010;126(4):734–739.
- ,,, et al.Improving transitions of care at hospital discharge—implications for pediatric hospitalists and primary care providers.J Healthc Qual.2010;32(5):51–60.
- ,,, et al.Deficits in communication and information transfer between hospital‐based and primary care physicians: implications for patient safety and continuity of care.JAMA.2007;297:831–841.
- ,,, et al.The impact of resident duty hour reform on hospital readmission rates among Medicare beneficiaries.J Gen Intern Med.2011;26(4):405–411.
- American Association of Medical Colleges. What Roles Do Teaching Hospitals Fullfill? Available at: http://www.aamc.org/about/teachhosp_facts1.pdf. Accessed December 15,2009.
- ,,.Qualitative data analysis for health services research: developing taxonomy, themes, and theory.Health Serv Res.2007;42(4):1758–1772.
- ,.Reaching the parts other methods cannot reach: an introduction to qualitative methods in health and health services research.BMJ.1995;311(6996):42–45.
- .Qualitative Research and Evaluation Methods.Thousand Oaks, CA:Sage Publications;2002.
- ,,,,.Consequences of inadequate sign‐out for patient care.Arch Intern Med.2008;168(16):1755–1760.
- ,,, et al.What are covering doctors told about their patients? Analysis of sign‐out among internal medicine house staff.Qual Saf Health Care.2009;18:248–255.
- .,,,,.Getting by: underuse of interpreters by resident physicians.J Gen Intern Med.2008;24(2):256–262.
- .The significance of saturation.Qual Health Res.1995;5(2):147–149.
- ,.The Discovery of Grounded Theory: Strategies for Qualitative Research.Chicago, IL:Aldine;1967.
- ,, eds.Doing Qualitative Research (Research Methods for Primary Care).Thousand Oaks, CA: Sage;1999:33–46.
- ,.Qualitative Data Analysis.2nd ed.Thousand Oaks, CA: Sage;1994.
- ,,, et al.Reduction of 30‐day post‐discharge hospital readmission or ED visit rates in high‐risk elderly medical patients through delivery of a targeted care bundle.J Hosp Med.2009;4:211–218.
- ,,, et al.Transitions of Care Consensus Policy Statement American College of Physicians–Society of General Internal Medicine–Society of Hospital Medicine–American Geriatrics Society–American College of Emergency Physicians–Society of Academic Emergency Medicine.J Gen Intern Med.2009;24(8):971–976.
- .Reengineering hospital discharge: a protocol to improve patient safety, reduce costs, and boost patient satisfaction.Am J Med Qual.2009;24(4):344–346.
- ,,.Assessing the quality of preparation for post‐hospital care from the patient's perspective: the care transitions measure.Med Care.2005;43(3):246–255.
- ,,, et al.Hospital discharge documentation and risk of rehospitalisation.BMJ Qual Saf.2011;20(9):773–778.
- ,,,,.Effect of standardized electronic discharge instructions on post‐discharge hospital utilization.J Gen Intern Med.2011;26(7):718–723.
- ,,, et al.Patient safety concerns arising from test results that return after hospital discharge.Ann Intern Med.2005;143(2):121–128.
- ,,, et al.What distinguishes top‐performing hospitals in acute myocardial infarction mortality rates? A qualitative study.Ann Intern Med.2011;154(6):384–390.
- ,,,,.Evaluating obstetrical residency programs using patient outcomes.JAMA.2009;302(12):1277–1283.
- ,,, et al.Creating a better discharge summary: improvement in quality and timeliness using an electronic discharge summary.J Hosp Med.2009;4:219–225.
- ,,.Thinking About Answers: The Application of Cognitive Processes to Survey Methodology.San Francisco, CA:Jossey‐Bass;1996.
Copyright © 2012 Society of Hospital Medicine
Memory Changes, Hyperglycemia Prompt Statin Label Changes
Physicians can anticipate three key safety changes to the labels of several cholesterol-lowering drugs, according to a Food and Drug Administration announcement on Feb. 28.
The changes affect the following drugs: Lipitor (atorvastatin), Lescol (fluvastatin), Mevacor (lovastatin), Altoprev (lovastatin extended-release), Livalo (pitavastatin), Pravachol (pravastatin), Crestor (rosuvastatin), and Zocor (simvastatin). Three combination products are also included: Advicor (lovastatin/niacin extended-release), Simcor (simvastatin/niacin extended-release), and Vytorin (simvastatin/ezetimibe).
The safety information on the labels will reflect changes with regard to the monitoring of liver enzymes, reports of certain cognitive effects, and reports of hyperglycemia with statin use.
The agency no longer recommends periodic monitoring of liver enzymes. "FDA has concluded that serious liver injury with statins is rare and unpredictable in individual patients, and that routine periodic monitoring of liver enzymes does not appear to be effective in detecting or preventing this rare side effect," according to a press statement. Instead, the agency now recommends that liver enzyme tests be performed before starting statin therapy, and as clinically indicated thereafter.
In addition, labels will now include information about some patients who have experienced memory loss and confusion. The agency noted that these reports generally have not been serious and the patients’ symptoms were reversed by stopping use of the statin. In addition, there have been studies showing that patients being treated with statins may have a small increased risk of increased blood sugar levels and of type 2 diabetes diagnosis. The labels will now warn health care professionals and patients of this potential risk.
More extensive safety changes have been made to the lovastatin label. The changes will note that some medicines may interact with lovastatin, thereby increasing the risk for muscle injury (myopathy/rhabdomyolysis). For example, the use of certain medicines is contraindicated with Mevacor (lovastatin), including drugs used to treat HIV (protease inhibitors) and drugs used to treat certain bacterial and fungal infections.
Health care professionals and patients can report adverse events or side effects related to the use of these products to the FDA’s MedWatch Safety Information and Adverse Event Reporting Program online or by downloading a form, or by calling 1-800-332-1088 to request a reporting form, and then completing and returning it to the address on the preaddressed form or submitting it by fax to 1-800-FDA-0178.
For more information on the changes, visit www.fda.gov/Drugs/DrugSafety/ucm293101.htm.
Physicians can anticipate three key safety changes to the labels of several cholesterol-lowering drugs, according to a Food and Drug Administration announcement on Feb. 28.
The changes affect the following drugs: Lipitor (atorvastatin), Lescol (fluvastatin), Mevacor (lovastatin), Altoprev (lovastatin extended-release), Livalo (pitavastatin), Pravachol (pravastatin), Crestor (rosuvastatin), and Zocor (simvastatin). Three combination products are also included: Advicor (lovastatin/niacin extended-release), Simcor (simvastatin/niacin extended-release), and Vytorin (simvastatin/ezetimibe).
The safety information on the labels will reflect changes with regard to the monitoring of liver enzymes, reports of certain cognitive effects, and reports of hyperglycemia with statin use.
The agency no longer recommends periodic monitoring of liver enzymes. "FDA has concluded that serious liver injury with statins is rare and unpredictable in individual patients, and that routine periodic monitoring of liver enzymes does not appear to be effective in detecting or preventing this rare side effect," according to a press statement. Instead, the agency now recommends that liver enzyme tests be performed before starting statin therapy, and as clinically indicated thereafter.
In addition, labels will now include information about some patients who have experienced memory loss and confusion. The agency noted that these reports generally have not been serious and the patients’ symptoms were reversed by stopping use of the statin. In addition, there have been studies showing that patients being treated with statins may have a small increased risk of increased blood sugar levels and of type 2 diabetes diagnosis. The labels will now warn health care professionals and patients of this potential risk.
More extensive safety changes have been made to the lovastatin label. The changes will note that some medicines may interact with lovastatin, thereby increasing the risk for muscle injury (myopathy/rhabdomyolysis). For example, the use of certain medicines is contraindicated with Mevacor (lovastatin), including drugs used to treat HIV (protease inhibitors) and drugs used to treat certain bacterial and fungal infections.
Health care professionals and patients can report adverse events or side effects related to the use of these products to the FDA’s MedWatch Safety Information and Adverse Event Reporting Program online or by downloading a form, or by calling 1-800-332-1088 to request a reporting form, and then completing and returning it to the address on the preaddressed form or submitting it by fax to 1-800-FDA-0178.
For more information on the changes, visit www.fda.gov/Drugs/DrugSafety/ucm293101.htm.
Physicians can anticipate three key safety changes to the labels of several cholesterol-lowering drugs, according to a Food and Drug Administration announcement on Feb. 28.
The changes affect the following drugs: Lipitor (atorvastatin), Lescol (fluvastatin), Mevacor (lovastatin), Altoprev (lovastatin extended-release), Livalo (pitavastatin), Pravachol (pravastatin), Crestor (rosuvastatin), and Zocor (simvastatin). Three combination products are also included: Advicor (lovastatin/niacin extended-release), Simcor (simvastatin/niacin extended-release), and Vytorin (simvastatin/ezetimibe).
The safety information on the labels will reflect changes with regard to the monitoring of liver enzymes, reports of certain cognitive effects, and reports of hyperglycemia with statin use.
The agency no longer recommends periodic monitoring of liver enzymes. "FDA has concluded that serious liver injury with statins is rare and unpredictable in individual patients, and that routine periodic monitoring of liver enzymes does not appear to be effective in detecting or preventing this rare side effect," according to a press statement. Instead, the agency now recommends that liver enzyme tests be performed before starting statin therapy, and as clinically indicated thereafter.
In addition, labels will now include information about some patients who have experienced memory loss and confusion. The agency noted that these reports generally have not been serious and the patients’ symptoms were reversed by stopping use of the statin. In addition, there have been studies showing that patients being treated with statins may have a small increased risk of increased blood sugar levels and of type 2 diabetes diagnosis. The labels will now warn health care professionals and patients of this potential risk.
More extensive safety changes have been made to the lovastatin label. The changes will note that some medicines may interact with lovastatin, thereby increasing the risk for muscle injury (myopathy/rhabdomyolysis). For example, the use of certain medicines is contraindicated with Mevacor (lovastatin), including drugs used to treat HIV (protease inhibitors) and drugs used to treat certain bacterial and fungal infections.
Health care professionals and patients can report adverse events or side effects related to the use of these products to the FDA’s MedWatch Safety Information and Adverse Event Reporting Program online or by downloading a form, or by calling 1-800-332-1088 to request a reporting form, and then completing and returning it to the address on the preaddressed form or submitting it by fax to 1-800-FDA-0178.
For more information on the changes, visit www.fda.gov/Drugs/DrugSafety/ucm293101.htm.
Severity of Symptoms
The frequency and severity of symptoms among older hospitalized patients with chronic illnesses can have a profound negative impact on their quality of life.1, 2 Nonetheless, research examining the prevalence and management of symptoms has focused predominantly on cancer patients.3 Few studies have included patients with other serious conditions such as heart failure (HF) and chronic obstructive pulmonary disease (COPD),3, 4 which are very common and are major causes of morbidity and mortality in the United States.5 One longitudinal assessment of symptom severity among a group of community‐based older adults diagnosed with COPD and HF reported high rates of moderate‐to‐severe pain, dyspnea, and anxiety at baseline and follow‐up, as long as 22 months later.6 Persistent symptoms over time can have an adverse effect on an individual's physical and emotional well‐being, and highlight opportunities to improve care.3, 7 Understanding patterns of symptom change over time is a key first step in developing systems to improve quality of care for people with chronic illness.
Among hospitalized patients, pain, dyspnea, anxiety, and depression cause the greatest symptom burden, accounting for 67% of all symptoms classified as moderate to severe.8 While assessment and management of symptoms may be the reason for admission to the hospital and the focus of inpatient care, this focus may not persist after discharge, leaving patients with significant symptoms that can diminish quality of life and contribute to readmission.9 We studied a cohort of older inpatients with serious illness over time in order to determine the prevalence, severity, burden, and predictors of symptoms during the course of hospitalization and at 2 weeks after discharge.
METHODS
Setting
The study was undertaken at a large academic medical center in San Francisco.
Subjects
Participants were patients 65 years or older admitted to the medicine or cardiology services with a primary diagnosis of cancer, COPD, or HF. Participants were required to be fully oriented and English‐speaking. Patients gave written informed consent to participate. The Committee on Human Research at the University of California, San Francisco, approved this study (H8695‐35172‐01).
Data Collection
Data collection was undertaken from March 2001 to December 2003. This study was part of a prospective, clinical trial that compared a proactive palliative medicine consultation with usual hospital care, and has been previously described.10 Upon study enrollment, all patients completed the Inpatient Care Survey. The survey asked participants about demographic information such as date of birth, sex, education level, race, and marital status. The survey instruments also included the Instrumental Activities of Daily Living (IADL) index and the Geriatric Depression Scale (GDS‐15). Each weekday during hospitalization, a trained research assistant asked patients to report their worst symptom level for pain, dyspnea, and anxiety in the past 24 hours using a 010 numeric rating scale, where 0 was none and 10 was the worst you can imagine. We further characterized scores into categories such that 0 was defined as none, 13 as mild, 46 as moderate, and 710 as severe. A follow‐up telephone survey, 2 weeks after discharge, reassessed patients' worst symptom levels in the past 24 hours for pain, dyspnea, and anxiety.
We also generated a composite score of symptoms to report a symptom burden score for these 3 symptoms. Using the categories of symptom severity, we assigned a score of 0 for none, 1 for mild, 2 for moderate, and 3 for severe. We summed the assigned scores for all 3 symptoms for each subject to generate a symptom burden score as follows: no symptom burden (0), mild symptom burden (13), moderate symptom burden (46), and severe symptom burden (79). In this scale, a moderate symptom burden would mean that a subject reported having at least 1 symptom at a moderate or severe level, with at least 1 other symptom present. A severe symptom burden would require the presence of all 3 symptoms, with at least 1 at a severe level.
We reviewed patient charts to assess severity of patient illness upon admission. For cancer, we recorded type; for COPD, we noted forced expiratory volume in 1 second (FEV1); and for HF, we recorded the ejection fraction. We also queried the National Death Index to get vital statistics on all subjects.
Data Preparation
The IADL asks patients to report whether they can perform 13 daily living skills without help, with some help, or were unable to complete tasks.11 Subjects who reported needing at least some help with any of the 13 items were categorized as dependent. The GDS‐15 is a widely used, validated 15‐item scale for assessing depressive mood in the elderly.12 Scores for the GDS‐15 range from 0 to 15, with higher scores indicating more depressive symptoms. Based on previous research, we categorized patients as either not depressed (05) or having probable depression (6 or more).12
Statistical Analysis
Because our clinical trial had no impact on care or symptoms, we combined intervention and usual care patients for this analysis of symptom severity. Descriptive statistics, such as frequencies, means, standard deviations (SDs), and 95% confidence intervals (CIs) were used to examine the distribution of measures. Chi‐square (2) analysis was undertaken to examine bivariate associations between categorical variables. Analysis of variance (ANOVA) was undertaken to examine associations between categorical and continuous variables. Multivariate logistic regression was used to examine predictors of symptom burden at follow‐up, including patient characteristics that were significant to P 0.10 in bivariate analysis. We used KaplanMeier survival curves to examine the relationship between primary diagnosis and mortality, and assessed statistical significance using log‐rank tests (MantelCox).13 The Statistical Package for the Social Sciences (SPSS) for Mac (version 17; SPSS Inc, Chicago, IL; March 11, 2009) was used to analyze these data.
RESULTS
Patient Characteristics
A total of 150 patients enrolled in the study. The mean length of stay was 5.4 days (SD: 5.6; range: 147 days). HF was the most common primary diagnosis (46.7%, n = 70) with 48% (n = 34) having an ejection fraction of 45% or less (mean = 43%; SD: 22); followed by cancer (30%, n = 45) with the most common type being prostate (18%, n = 8), lung (13%, n = 6), and breast (13%, n = 6); and COPD (23%, n = 35) with an average FEV1 of 1.5 L (SD: 0.94; range: 0.503.9). The mean age was 77 years (SD: 7.9; range: 6596 years). The majority of participants were men (56%, n = 83) and white (73%, n = 108), with the most being either married/partnered (43%, n = 64) or divorced/widowed (44%, n = 66). The IADL identified almost two‐thirds of participants as dependent (62%, n = 94). The GDS‐15 categorized three‐quarters of participants (n = 118) as not depressed. The only significant association between participant characteristics and their primary diagnosis was for the IADL index (Table 1), with significantly more (2 = 6.3; P = 0.04) patients with HF categorized as being dependent (72%).
| Characteristics | Primary Diagnosis | P | |||
|---|---|---|---|---|---|
| Cancer n = 44 | HF n = 70 | COPD n = 35 | |||
| |||||
| Length of stay | (Mean days) | 5.4 | 4.7 | 6.5 | 0.3 |
| Age | (Mean years) | 76 | 78 | 76 | 0.3 |
| Sex | |||||
| Female | 47% | 37% | 57% | 0.1 | |
| Marital status | 0.2 | ||||
| Single | 16 | 9 | 17 | ||
| Married/partnered | 51 | 45 | 29 | ||
| Divorced/widowed | 33 | 46 | 54 | ||
| Race | |||||
| White | 89 | 64 | 69 | 0.1 | |
| Black/African American | 7 | 21 | 23 | ||
| Asian or Pacific Islander | 5 | 10 | 9 | ||
| Other | 0 | 4 | 0 | ||
| IADL | |||||
| Dependent | 49 | 72 | 60 | 0.04 | |
| GDS‐15 | |||||
| Probable depression | 18 | 22 | 21 | 0.9 | |
Frequency and Severity of Symptoms
On average, the postdischarge follow‐up assessment was undertaken 24 days (median = 21.0; SD: 17.9; range: 7140 days) after the baseline assessment and 20 days after discharge (median = 15; SD: 17.0; range: 4139). At baseline, a large proportion of participants reported symptoms at a moderate‐to‐severe level for pain (54%, n = 81), dyspnea (53%, n = 79), and anxiety (63%, n = 94). The majority of patients (64%, n = 96) reported having 2 or more symptoms at a moderate‐to‐severe level and one quarter (27%, n = 41) had 3 symptoms at a moderate‐to‐severe level. While the frequency of moderate‐to‐severe symptoms decreased at the 24‐hour hospital assessment (pain = 42%, dyspnea = 45%, anxiety = 55%) and again at 2‐week follow‐up (pain = 28%, dyspnea = 27%, anxiety = 25%), a substantial symptom burden persisted with 30% (n = 36) of patients having moderate‐to‐severe levels at 2‐week follow‐up. Overall there were no differences between primary diagnosis and the frequency of symptoms at baseline or 24‐hour hospital assessment (Figure 1). However at follow‐up, those diagnosed with COPD were more likely to report moderate/severe pain (54%; 2 = 22.0; P < 0.001), dyspnea (45%; 2 = 9.3; P = 0.05), and overall symptom burden (55%; 2 = 25.9; P < 0.001) than those with cancer (pain = 22%, dyspnea = 16%, symptom burden = 16%) or HF (pain = 25%, dyspnea = 24%, symptom burden = 28%).
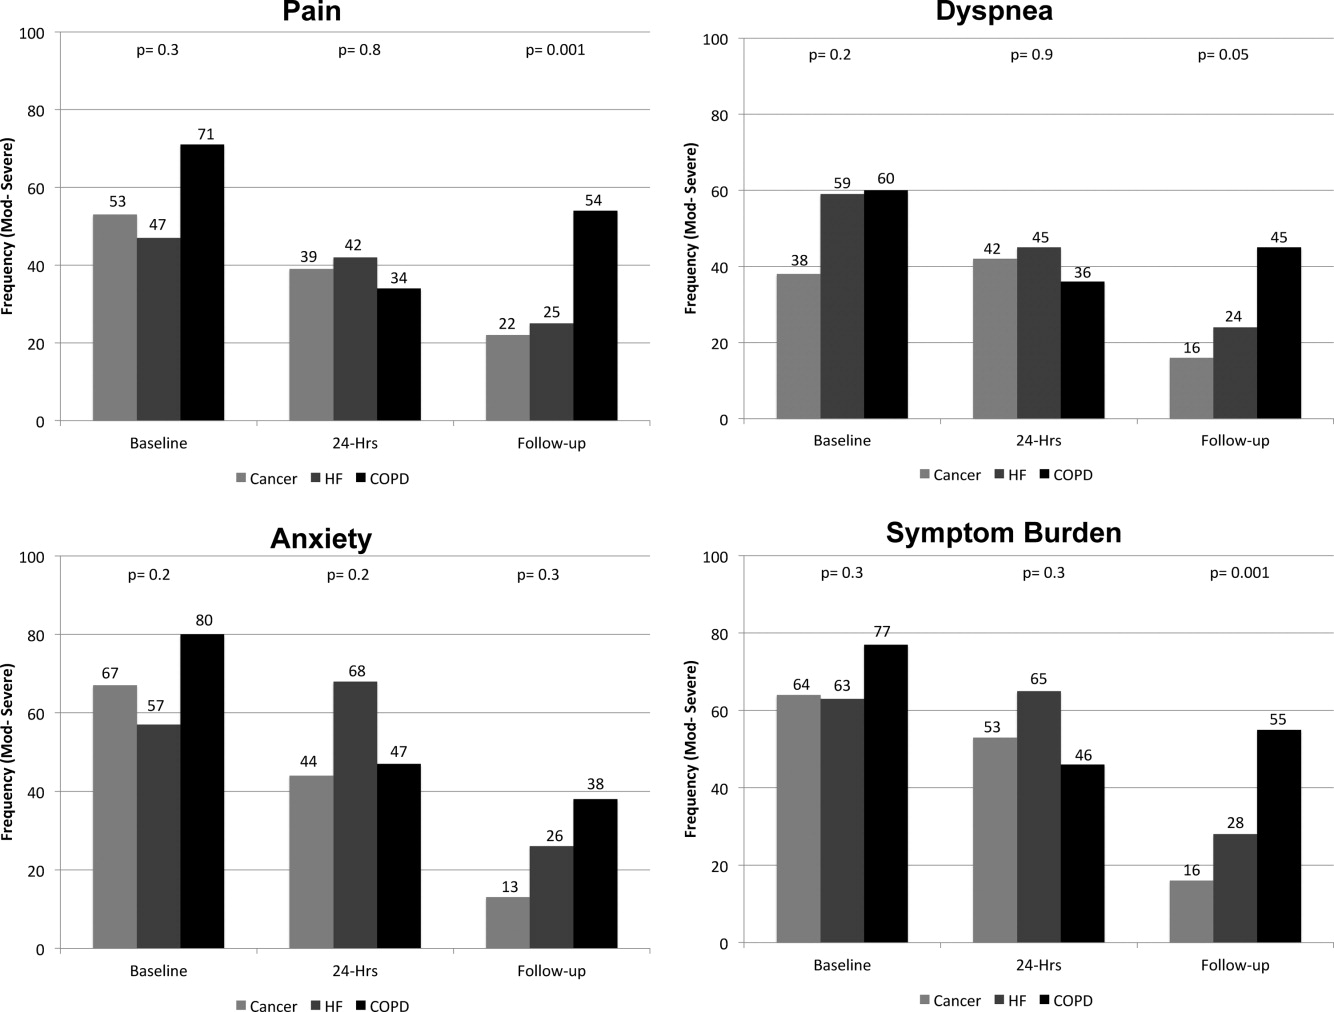
As symptom burden was our composite score for pain, dyspnea, and anxiety, we were interested in identifying variables in addition to primary diagnosis that might be associated with symptom burden at follow‐up. Bivariate analysis revealed that there was no significant association between symptom burden and age (2 = 1.5; P = 0.5), gender (2 = 1.3; P = 0.3), length of stay (2 = 0.4; P = 0.8), and (IADL) level of independence (2 = 0.3; P = 0.6). However, those with probable depression were more likely (2 = 11.9; P = 0.001) to have a moderate/severe symptom burden (62%, n = 13), compared to those with no depression (24%, n = 23). After adjusting for severity of symptom burden at baseline, multivariate logistic regression revealed that primary diagnosis (P = 0.01) and probable depression (OR = 4.9; 95% CI = 1.6, 14.9; P = 0.005) were associated with symptom severity. Patients with COPD had greater odds (OR = 7.0; 95% CI = 1.9, 26.2; P = 0.002) of moderate/severe symptom burden than those with cancer, while those with HF did not (OR = 2.3; 95% CI = 0.7, 7.7; P = 0.16). There was significant interaction between primary diagnosis and depression (P = 0.2).
Primary Diagnosis, Symptom Burden, and Survival Time
A total of 75% of patients were identified by the National Death Index to have died between hospital discharge and December 2007, of which 47% had died within 12 months after discharge. KaplanMeier survival curves (Figure 2) revealed a significant difference (MantelCox: 2 = 19.3; df = 1; P = 0.0001) in survival time, with patients diagnosed with COPD (median = 19.0 months; 95% CI = 6.5, 31.5) and HF (median = 20.0 months; 95% CI = 12.5, 27.5) having a longer survival than those with cancer (median = 8.0 months; 95% CI = 4.1, 11.9).
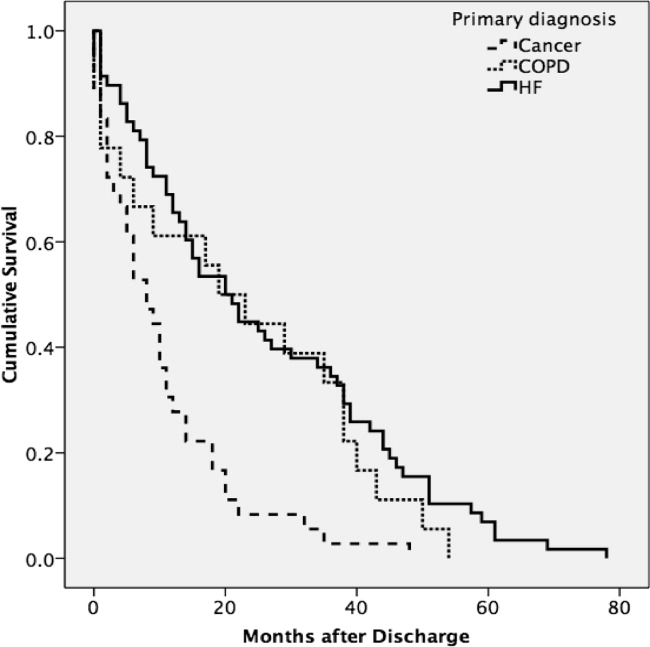
We also examined the relationship between symptom burden and survival time. KaplanMeier survival curves revealed no significant difference (MantelCox: 2 = 0.2; P = 0.6) in the survival time of patients classified with a symptom burden of none/moderate (median = 15.0 months; 95% CI = 8.8, 21.2) or moderate/severe (median = 14.0 months; 95% CI = 2.6, 25.4).
DISCUSSION
In our sample of older inpatients diagnosed with cancer, HF, and COPD, a large proportion reported moderate‐to‐severe levels of pain, dyspnea, and anxiety at baseline and follow‐up. When combined, these levels represent a considerable symptom burden, with over three‐quarters of participants reporting 2 to 3 symptoms at a moderate/severe level at baseline. While symptom scores decreased at 24‐hours and 2‐week follow‐up, symptom burden remained high, with almost half of the participants reporting 23 symptoms at a moderate‐to‐severe level at 24‐hour assessment and a large minority reporting moderate‐to‐severe symptoms at follow‐up. A higher percentage of patients with COPD reported moderate‐to‐severe pain, dyspnea, and overall symptom burden at follow‐up than participants with cancer or HF who reported a similar symptom burden. We also found that patients with probable depression were more likely to have a significant symptom burden at follow‐up. These findings highlight the need to routinely assess and treat symptoms over time, including depression, and especially in patients with COPD. While we found that hospital care was seemingly effective in improving symptoms, they persist at distressing levels in many patients.
Few studies have assessed the severity of symptoms over time. One study that did, examined symptom severity among community‐based elders diagnosed with HF and COPD.6 At baseline, these participants had a lower prevalence of moderate‐to‐severe symptoms than the hospitalized patients enrolled in our study, a finding that would be anticipated, as they may not have been as ill. However, symptom severity persisted in the community‐based subjects and, in some cases, worsened over the 22‐month assessment period for pain (HF = 20% vs 42%; COPD = 27% vs 20%), dyspnea (HF = 19% vs 29%; COPD = 66% vs 76%), and anxiety (HF = 2% vs 12%; COPD = 32% vs 23%).6 In contrast, while our subjects with a primary diagnosis of HF and COPD had a higher prevalence of moderate‐to‐severe symptoms at baseline, they did experience an improvement in the severity of pain, dyspnea, and anxiety at the 2‐week follow‐up assessment. However, despite a decrease in the prevalence of moderate‐to‐severe symptoms from baseline to follow‐up, a high symptom burden persisted for many patients, particularly for those diagnosed with COPD and those with probable depression at baseline. The severity of a patient's symptoms can have a profound negative effect on health status and quality of life.14 Findings from these studies suggest that symptoms are currently not being adequately managed, and highlight an urgent need to develop coordinated strategies and systems that focus on improving the management of symptoms, including depression, over time.6
We also found that subjects recruited for this study had advanced disease, evidenced by the fact that nearly half died within 12 months. We did not use specific prognostic indices or severity of illness criteria for recruiting subjects and simply approached patients admitted with one of the target diagnoses. Our study suggests that targeting these patients for routine symptom assessment and management, including for palliative care, would be a reasonable approach given the high symptom burden and relatively high mortality at 1 year.
Interpretation of these findings should be mitigated by the following limitations. Because of our setting, our findings may not be generalizable to all patients with cancer, HF, and COPD. However, our subjects were admitted to general medical and cardiology services, and had common conditions, and therefore are likely similar to those presenting to other hospitals. We relied on self‐report measures to assess severity of symptoms. Patient self‐report, while potentially subject to imprecision due to poor recall and social demand biases, is considered the gold standard for symptom assessment.15 Finally, 2‐week follow‐up is relatively short, and it is possible that symptoms may have improved had we assessed them over a longer period. The longitudinal study of elders in the community that followed subjects over 22 months found that, for many patients, symptoms worsened over time and nearly half of our subjects died at 12 months, suggesting that longer follow‐up would have been unlikely to show improvement in symptoms.6
A significant minority of participants reported a substantial, persistent symptom burden, yet all symptoms assessed in our study are potentially modifiable. Recognizing and treating symptoms can be achieved through the use of targeted interventions.6 Because symptoms can occur in clusters, successful treatment of 1 symptom may also help to improve other symptoms.1 The large number of participants reporting moderate‐to‐severe levels of symptom burden at 2 weeks after discharge highlights an unmet need for improved symptom control in the outpatient setting. Unfortunately, while evidence exists for managing pain in patients with cancer, such evidence‐based practices are lacking for the management of pain and other symptoms in patients with HF and COPD. Some symptoms may require specific, disease‐oriented management. However, many symptoms may be due to common comorbidities, such as pain from degenerative joint disease, that may likely respond to proven treatments.16
Our study confirmed the significant burden of symptoms experienced by patients with serious illness and demonstrated that patients with COPD report as much symptom burden as patients with cancer and HF, if not more. While symptom severity improved over the course of the hospitalization and follow‐up, a large percentage of patients reported significant symptom burden at follow‐up. Depression was also common in these patients. Because these symptoms diminish quality of life, routine assessment and management of these symptoms is critical for improving the quality of care provided to these patients. Additional research on the best approaches to manage symptoms, including medications, interventions, and structures of care, could further improve care.
Acknowledgements
The authors thank all the patients who participated in this study. They thank Joanne Batt, Wren Levenberg, and Emily Philipps for their expert help as research assistants. They also thank Harold Collard, MD, for providing valuable feedback on the manuscript. Data obtained from the National Death Index assisted us in meeting our study objectives. Steven Pantilat had full access to all of the data in the study and takes responsibility for the integrity of the data and the accuracy of the data analysis.
- ,,.Symptom clusters: the new frontier in symptom management research.J Natl Cancer Inst Monogr.2004(32):17–21.
- .Symptom burden: multiple symptoms and their impact as patient‐reported outcomes.J Natl Cancer Inst Monogr.2007(37):16–21.
- ,,.A comparison of symptom prevalence in far advanced cancer, AIDS, heart disease, chronic obstructive pulmonary disease and renal disease.J Pain Symptom Manage.2006;31(1):58–69.
- ,,, et al.Comparing three life‐limiting diseases: does diagnosis matter or is sick, sick?J Pain Symptom Manage.2011;42(3):331–341.
- ,,,,,.Deaths: final data for 2006.Natl Vital Stat Rep.2009;57(14):1–134.
- ,,,,,.Range and severity of symptoms over time among older adults with chronic obstructive pulmonary disease and heart failure.Arch Intern Med.2007;167(22):2503–2508.
- ,,,.Living with chronic obstructive pulmonary disease: a survey of patients' knowledge and attitudes.Respir Med.2009;103(7):1004–1012.
- ,,,,.The symptom burden of seriously ill hospitalized patients. SUPPORT Investigators. Study to Understand Prognoses and Preferences for Outcome and Risks of Treatment.J Pain Symptom Manage.1999;17(4):248–255.
- ,,, et al.Relationship between early physician follow‐up and 30‐day readmission among Medicare beneficiaries hospitalized for heart failure.JAMA.2010;303(17):1716–1722.
- ,,,.Hospital‐based palliative medicine consultation: a randomized controlled trial.Arch Intern Med.2010;170(22):2038–2040.
- ,,,,.Studies of illness in the aged. The Index of ADL: a standardized measure of biological and psychosocial function.JAMA.1963;185:914–919.
- ,,,.Screening for late life depression: cut‐off scores for the Geriatric Depression Scale and the Cornell Scale for Depression in Dementia among Japanese subjects.Int J Geriatr Psychiatry.2003;18(6):498–505.
- ,.Nonparametric estimation from incomplete observations.J Am Stat Assoc.1958;53(282):457–481.
- ,,.End stage chronic obstructive pulmonary disease.Pneumonol Alergol Pol.2009;77(2):173–179.
- ,,,.Relationship between social desirability and self‐report in chronic pain patients.Clin J Pain.1995;11(3):189–193.
- ,,,.Etiology and severity of pain among outpatients living with HF.J Card Fail.2010;16(8):S88.
The frequency and severity of symptoms among older hospitalized patients with chronic illnesses can have a profound negative impact on their quality of life.1, 2 Nonetheless, research examining the prevalence and management of symptoms has focused predominantly on cancer patients.3 Few studies have included patients with other serious conditions such as heart failure (HF) and chronic obstructive pulmonary disease (COPD),3, 4 which are very common and are major causes of morbidity and mortality in the United States.5 One longitudinal assessment of symptom severity among a group of community‐based older adults diagnosed with COPD and HF reported high rates of moderate‐to‐severe pain, dyspnea, and anxiety at baseline and follow‐up, as long as 22 months later.6 Persistent symptoms over time can have an adverse effect on an individual's physical and emotional well‐being, and highlight opportunities to improve care.3, 7 Understanding patterns of symptom change over time is a key first step in developing systems to improve quality of care for people with chronic illness.
Among hospitalized patients, pain, dyspnea, anxiety, and depression cause the greatest symptom burden, accounting for 67% of all symptoms classified as moderate to severe.8 While assessment and management of symptoms may be the reason for admission to the hospital and the focus of inpatient care, this focus may not persist after discharge, leaving patients with significant symptoms that can diminish quality of life and contribute to readmission.9 We studied a cohort of older inpatients with serious illness over time in order to determine the prevalence, severity, burden, and predictors of symptoms during the course of hospitalization and at 2 weeks after discharge.
METHODS
Setting
The study was undertaken at a large academic medical center in San Francisco.
Subjects
Participants were patients 65 years or older admitted to the medicine or cardiology services with a primary diagnosis of cancer, COPD, or HF. Participants were required to be fully oriented and English‐speaking. Patients gave written informed consent to participate. The Committee on Human Research at the University of California, San Francisco, approved this study (H8695‐35172‐01).
Data Collection
Data collection was undertaken from March 2001 to December 2003. This study was part of a prospective, clinical trial that compared a proactive palliative medicine consultation with usual hospital care, and has been previously described.10 Upon study enrollment, all patients completed the Inpatient Care Survey. The survey asked participants about demographic information such as date of birth, sex, education level, race, and marital status. The survey instruments also included the Instrumental Activities of Daily Living (IADL) index and the Geriatric Depression Scale (GDS‐15). Each weekday during hospitalization, a trained research assistant asked patients to report their worst symptom level for pain, dyspnea, and anxiety in the past 24 hours using a 010 numeric rating scale, where 0 was none and 10 was the worst you can imagine. We further characterized scores into categories such that 0 was defined as none, 13 as mild, 46 as moderate, and 710 as severe. A follow‐up telephone survey, 2 weeks after discharge, reassessed patients' worst symptom levels in the past 24 hours for pain, dyspnea, and anxiety.
We also generated a composite score of symptoms to report a symptom burden score for these 3 symptoms. Using the categories of symptom severity, we assigned a score of 0 for none, 1 for mild, 2 for moderate, and 3 for severe. We summed the assigned scores for all 3 symptoms for each subject to generate a symptom burden score as follows: no symptom burden (0), mild symptom burden (13), moderate symptom burden (46), and severe symptom burden (79). In this scale, a moderate symptom burden would mean that a subject reported having at least 1 symptom at a moderate or severe level, with at least 1 other symptom present. A severe symptom burden would require the presence of all 3 symptoms, with at least 1 at a severe level.
We reviewed patient charts to assess severity of patient illness upon admission. For cancer, we recorded type; for COPD, we noted forced expiratory volume in 1 second (FEV1); and for HF, we recorded the ejection fraction. We also queried the National Death Index to get vital statistics on all subjects.
Data Preparation
The IADL asks patients to report whether they can perform 13 daily living skills without help, with some help, or were unable to complete tasks.11 Subjects who reported needing at least some help with any of the 13 items were categorized as dependent. The GDS‐15 is a widely used, validated 15‐item scale for assessing depressive mood in the elderly.12 Scores for the GDS‐15 range from 0 to 15, with higher scores indicating more depressive symptoms. Based on previous research, we categorized patients as either not depressed (05) or having probable depression (6 or more).12
Statistical Analysis
Because our clinical trial had no impact on care or symptoms, we combined intervention and usual care patients for this analysis of symptom severity. Descriptive statistics, such as frequencies, means, standard deviations (SDs), and 95% confidence intervals (CIs) were used to examine the distribution of measures. Chi‐square (2) analysis was undertaken to examine bivariate associations between categorical variables. Analysis of variance (ANOVA) was undertaken to examine associations between categorical and continuous variables. Multivariate logistic regression was used to examine predictors of symptom burden at follow‐up, including patient characteristics that were significant to P 0.10 in bivariate analysis. We used KaplanMeier survival curves to examine the relationship between primary diagnosis and mortality, and assessed statistical significance using log‐rank tests (MantelCox).13 The Statistical Package for the Social Sciences (SPSS) for Mac (version 17; SPSS Inc, Chicago, IL; March 11, 2009) was used to analyze these data.
RESULTS
Patient Characteristics
A total of 150 patients enrolled in the study. The mean length of stay was 5.4 days (SD: 5.6; range: 147 days). HF was the most common primary diagnosis (46.7%, n = 70) with 48% (n = 34) having an ejection fraction of 45% or less (mean = 43%; SD: 22); followed by cancer (30%, n = 45) with the most common type being prostate (18%, n = 8), lung (13%, n = 6), and breast (13%, n = 6); and COPD (23%, n = 35) with an average FEV1 of 1.5 L (SD: 0.94; range: 0.503.9). The mean age was 77 years (SD: 7.9; range: 6596 years). The majority of participants were men (56%, n = 83) and white (73%, n = 108), with the most being either married/partnered (43%, n = 64) or divorced/widowed (44%, n = 66). The IADL identified almost two‐thirds of participants as dependent (62%, n = 94). The GDS‐15 categorized three‐quarters of participants (n = 118) as not depressed. The only significant association between participant characteristics and their primary diagnosis was for the IADL index (Table 1), with significantly more (2 = 6.3; P = 0.04) patients with HF categorized as being dependent (72%).
| Characteristics | Primary Diagnosis | P | |||
|---|---|---|---|---|---|
| Cancer n = 44 | HF n = 70 | COPD n = 35 | |||
| |||||
| Length of stay | (Mean days) | 5.4 | 4.7 | 6.5 | 0.3 |
| Age | (Mean years) | 76 | 78 | 76 | 0.3 |
| Sex | |||||
| Female | 47% | 37% | 57% | 0.1 | |
| Marital status | 0.2 | ||||
| Single | 16 | 9 | 17 | ||
| Married/partnered | 51 | 45 | 29 | ||
| Divorced/widowed | 33 | 46 | 54 | ||
| Race | |||||
| White | 89 | 64 | 69 | 0.1 | |
| Black/African American | 7 | 21 | 23 | ||
| Asian or Pacific Islander | 5 | 10 | 9 | ||
| Other | 0 | 4 | 0 | ||
| IADL | |||||
| Dependent | 49 | 72 | 60 | 0.04 | |
| GDS‐15 | |||||
| Probable depression | 18 | 22 | 21 | 0.9 | |
Frequency and Severity of Symptoms
On average, the postdischarge follow‐up assessment was undertaken 24 days (median = 21.0; SD: 17.9; range: 7140 days) after the baseline assessment and 20 days after discharge (median = 15; SD: 17.0; range: 4139). At baseline, a large proportion of participants reported symptoms at a moderate‐to‐severe level for pain (54%, n = 81), dyspnea (53%, n = 79), and anxiety (63%, n = 94). The majority of patients (64%, n = 96) reported having 2 or more symptoms at a moderate‐to‐severe level and one quarter (27%, n = 41) had 3 symptoms at a moderate‐to‐severe level. While the frequency of moderate‐to‐severe symptoms decreased at the 24‐hour hospital assessment (pain = 42%, dyspnea = 45%, anxiety = 55%) and again at 2‐week follow‐up (pain = 28%, dyspnea = 27%, anxiety = 25%), a substantial symptom burden persisted with 30% (n = 36) of patients having moderate‐to‐severe levels at 2‐week follow‐up. Overall there were no differences between primary diagnosis and the frequency of symptoms at baseline or 24‐hour hospital assessment (Figure 1). However at follow‐up, those diagnosed with COPD were more likely to report moderate/severe pain (54%; 2 = 22.0; P < 0.001), dyspnea (45%; 2 = 9.3; P = 0.05), and overall symptom burden (55%; 2 = 25.9; P < 0.001) than those with cancer (pain = 22%, dyspnea = 16%, symptom burden = 16%) or HF (pain = 25%, dyspnea = 24%, symptom burden = 28%).
As symptom burden was our composite score for pain, dyspnea, and anxiety, we were interested in identifying variables in addition to primary diagnosis that might be associated with symptom burden at follow‐up. Bivariate analysis revealed that there was no significant association between symptom burden and age (2 = 1.5; P = 0.5), gender (2 = 1.3; P = 0.3), length of stay (2 = 0.4; P = 0.8), and (IADL) level of independence (2 = 0.3; P = 0.6). However, those with probable depression were more likely (2 = 11.9; P = 0.001) to have a moderate/severe symptom burden (62%, n = 13), compared to those with no depression (24%, n = 23). After adjusting for severity of symptom burden at baseline, multivariate logistic regression revealed that primary diagnosis (P = 0.01) and probable depression (OR = 4.9; 95% CI = 1.6, 14.9; P = 0.005) were associated with symptom severity. Patients with COPD had greater odds (OR = 7.0; 95% CI = 1.9, 26.2; P = 0.002) of moderate/severe symptom burden than those with cancer, while those with HF did not (OR = 2.3; 95% CI = 0.7, 7.7; P = 0.16). There was significant interaction between primary diagnosis and depression (P = 0.2).
Primary Diagnosis, Symptom Burden, and Survival Time
A total of 75% of patients were identified by the National Death Index to have died between hospital discharge and December 2007, of which 47% had died within 12 months after discharge. KaplanMeier survival curves (Figure 2) revealed a significant difference (MantelCox: 2 = 19.3; df = 1; P = 0.0001) in survival time, with patients diagnosed with COPD (median = 19.0 months; 95% CI = 6.5, 31.5) and HF (median = 20.0 months; 95% CI = 12.5, 27.5) having a longer survival than those with cancer (median = 8.0 months; 95% CI = 4.1, 11.9).
We also examined the relationship between symptom burden and survival time. KaplanMeier survival curves revealed no significant difference (MantelCox: 2 = 0.2; P = 0.6) in the survival time of patients classified with a symptom burden of none/moderate (median = 15.0 months; 95% CI = 8.8, 21.2) or moderate/severe (median = 14.0 months; 95% CI = 2.6, 25.4).
DISCUSSION
In our sample of older inpatients diagnosed with cancer, HF, and COPD, a large proportion reported moderate‐to‐severe levels of pain, dyspnea, and anxiety at baseline and follow‐up. When combined, these levels represent a considerable symptom burden, with over three‐quarters of participants reporting 2 to 3 symptoms at a moderate/severe level at baseline. While symptom scores decreased at 24‐hours and 2‐week follow‐up, symptom burden remained high, with almost half of the participants reporting 23 symptoms at a moderate‐to‐severe level at 24‐hour assessment and a large minority reporting moderate‐to‐severe symptoms at follow‐up. A higher percentage of patients with COPD reported moderate‐to‐severe pain, dyspnea, and overall symptom burden at follow‐up than participants with cancer or HF who reported a similar symptom burden. We also found that patients with probable depression were more likely to have a significant symptom burden at follow‐up. These findings highlight the need to routinely assess and treat symptoms over time, including depression, and especially in patients with COPD. While we found that hospital care was seemingly effective in improving symptoms, they persist at distressing levels in many patients.
Few studies have assessed the severity of symptoms over time. One study that did, examined symptom severity among community‐based elders diagnosed with HF and COPD.6 At baseline, these participants had a lower prevalence of moderate‐to‐severe symptoms than the hospitalized patients enrolled in our study, a finding that would be anticipated, as they may not have been as ill. However, symptom severity persisted in the community‐based subjects and, in some cases, worsened over the 22‐month assessment period for pain (HF = 20% vs 42%; COPD = 27% vs 20%), dyspnea (HF = 19% vs 29%; COPD = 66% vs 76%), and anxiety (HF = 2% vs 12%; COPD = 32% vs 23%).6 In contrast, while our subjects with a primary diagnosis of HF and COPD had a higher prevalence of moderate‐to‐severe symptoms at baseline, they did experience an improvement in the severity of pain, dyspnea, and anxiety at the 2‐week follow‐up assessment. However, despite a decrease in the prevalence of moderate‐to‐severe symptoms from baseline to follow‐up, a high symptom burden persisted for many patients, particularly for those diagnosed with COPD and those with probable depression at baseline. The severity of a patient's symptoms can have a profound negative effect on health status and quality of life.14 Findings from these studies suggest that symptoms are currently not being adequately managed, and highlight an urgent need to develop coordinated strategies and systems that focus on improving the management of symptoms, including depression, over time.6
We also found that subjects recruited for this study had advanced disease, evidenced by the fact that nearly half died within 12 months. We did not use specific prognostic indices or severity of illness criteria for recruiting subjects and simply approached patients admitted with one of the target diagnoses. Our study suggests that targeting these patients for routine symptom assessment and management, including for palliative care, would be a reasonable approach given the high symptom burden and relatively high mortality at 1 year.
Interpretation of these findings should be mitigated by the following limitations. Because of our setting, our findings may not be generalizable to all patients with cancer, HF, and COPD. However, our subjects were admitted to general medical and cardiology services, and had common conditions, and therefore are likely similar to those presenting to other hospitals. We relied on self‐report measures to assess severity of symptoms. Patient self‐report, while potentially subject to imprecision due to poor recall and social demand biases, is considered the gold standard for symptom assessment.15 Finally, 2‐week follow‐up is relatively short, and it is possible that symptoms may have improved had we assessed them over a longer period. The longitudinal study of elders in the community that followed subjects over 22 months found that, for many patients, symptoms worsened over time and nearly half of our subjects died at 12 months, suggesting that longer follow‐up would have been unlikely to show improvement in symptoms.6
A significant minority of participants reported a substantial, persistent symptom burden, yet all symptoms assessed in our study are potentially modifiable. Recognizing and treating symptoms can be achieved through the use of targeted interventions.6 Because symptoms can occur in clusters, successful treatment of 1 symptom may also help to improve other symptoms.1 The large number of participants reporting moderate‐to‐severe levels of symptom burden at 2 weeks after discharge highlights an unmet need for improved symptom control in the outpatient setting. Unfortunately, while evidence exists for managing pain in patients with cancer, such evidence‐based practices are lacking for the management of pain and other symptoms in patients with HF and COPD. Some symptoms may require specific, disease‐oriented management. However, many symptoms may be due to common comorbidities, such as pain from degenerative joint disease, that may likely respond to proven treatments.16
Our study confirmed the significant burden of symptoms experienced by patients with serious illness and demonstrated that patients with COPD report as much symptom burden as patients with cancer and HF, if not more. While symptom severity improved over the course of the hospitalization and follow‐up, a large percentage of patients reported significant symptom burden at follow‐up. Depression was also common in these patients. Because these symptoms diminish quality of life, routine assessment and management of these symptoms is critical for improving the quality of care provided to these patients. Additional research on the best approaches to manage symptoms, including medications, interventions, and structures of care, could further improve care.
Acknowledgements
The authors thank all the patients who participated in this study. They thank Joanne Batt, Wren Levenberg, and Emily Philipps for their expert help as research assistants. They also thank Harold Collard, MD, for providing valuable feedback on the manuscript. Data obtained from the National Death Index assisted us in meeting our study objectives. Steven Pantilat had full access to all of the data in the study and takes responsibility for the integrity of the data and the accuracy of the data analysis.
The frequency and severity of symptoms among older hospitalized patients with chronic illnesses can have a profound negative impact on their quality of life.1, 2 Nonetheless, research examining the prevalence and management of symptoms has focused predominantly on cancer patients.3 Few studies have included patients with other serious conditions such as heart failure (HF) and chronic obstructive pulmonary disease (COPD),3, 4 which are very common and are major causes of morbidity and mortality in the United States.5 One longitudinal assessment of symptom severity among a group of community‐based older adults diagnosed with COPD and HF reported high rates of moderate‐to‐severe pain, dyspnea, and anxiety at baseline and follow‐up, as long as 22 months later.6 Persistent symptoms over time can have an adverse effect on an individual's physical and emotional well‐being, and highlight opportunities to improve care.3, 7 Understanding patterns of symptom change over time is a key first step in developing systems to improve quality of care for people with chronic illness.
Among hospitalized patients, pain, dyspnea, anxiety, and depression cause the greatest symptom burden, accounting for 67% of all symptoms classified as moderate to severe.8 While assessment and management of symptoms may be the reason for admission to the hospital and the focus of inpatient care, this focus may not persist after discharge, leaving patients with significant symptoms that can diminish quality of life and contribute to readmission.9 We studied a cohort of older inpatients with serious illness over time in order to determine the prevalence, severity, burden, and predictors of symptoms during the course of hospitalization and at 2 weeks after discharge.
METHODS
Setting
The study was undertaken at a large academic medical center in San Francisco.
Subjects
Participants were patients 65 years or older admitted to the medicine or cardiology services with a primary diagnosis of cancer, COPD, or HF. Participants were required to be fully oriented and English‐speaking. Patients gave written informed consent to participate. The Committee on Human Research at the University of California, San Francisco, approved this study (H8695‐35172‐01).
Data Collection
Data collection was undertaken from March 2001 to December 2003. This study was part of a prospective, clinical trial that compared a proactive palliative medicine consultation with usual hospital care, and has been previously described.10 Upon study enrollment, all patients completed the Inpatient Care Survey. The survey asked participants about demographic information such as date of birth, sex, education level, race, and marital status. The survey instruments also included the Instrumental Activities of Daily Living (IADL) index and the Geriatric Depression Scale (GDS‐15). Each weekday during hospitalization, a trained research assistant asked patients to report their worst symptom level for pain, dyspnea, and anxiety in the past 24 hours using a 010 numeric rating scale, where 0 was none and 10 was the worst you can imagine. We further characterized scores into categories such that 0 was defined as none, 13 as mild, 46 as moderate, and 710 as severe. A follow‐up telephone survey, 2 weeks after discharge, reassessed patients' worst symptom levels in the past 24 hours for pain, dyspnea, and anxiety.
We also generated a composite score of symptoms to report a symptom burden score for these 3 symptoms. Using the categories of symptom severity, we assigned a score of 0 for none, 1 for mild, 2 for moderate, and 3 for severe. We summed the assigned scores for all 3 symptoms for each subject to generate a symptom burden score as follows: no symptom burden (0), mild symptom burden (13), moderate symptom burden (46), and severe symptom burden (79). In this scale, a moderate symptom burden would mean that a subject reported having at least 1 symptom at a moderate or severe level, with at least 1 other symptom present. A severe symptom burden would require the presence of all 3 symptoms, with at least 1 at a severe level.
We reviewed patient charts to assess severity of patient illness upon admission. For cancer, we recorded type; for COPD, we noted forced expiratory volume in 1 second (FEV1); and for HF, we recorded the ejection fraction. We also queried the National Death Index to get vital statistics on all subjects.
Data Preparation
The IADL asks patients to report whether they can perform 13 daily living skills without help, with some help, or were unable to complete tasks.11 Subjects who reported needing at least some help with any of the 13 items were categorized as dependent. The GDS‐15 is a widely used, validated 15‐item scale for assessing depressive mood in the elderly.12 Scores for the GDS‐15 range from 0 to 15, with higher scores indicating more depressive symptoms. Based on previous research, we categorized patients as either not depressed (05) or having probable depression (6 or more).12
Statistical Analysis
Because our clinical trial had no impact on care or symptoms, we combined intervention and usual care patients for this analysis of symptom severity. Descriptive statistics, such as frequencies, means, standard deviations (SDs), and 95% confidence intervals (CIs) were used to examine the distribution of measures. Chi‐square (2) analysis was undertaken to examine bivariate associations between categorical variables. Analysis of variance (ANOVA) was undertaken to examine associations between categorical and continuous variables. Multivariate logistic regression was used to examine predictors of symptom burden at follow‐up, including patient characteristics that were significant to P 0.10 in bivariate analysis. We used KaplanMeier survival curves to examine the relationship between primary diagnosis and mortality, and assessed statistical significance using log‐rank tests (MantelCox).13 The Statistical Package for the Social Sciences (SPSS) for Mac (version 17; SPSS Inc, Chicago, IL; March 11, 2009) was used to analyze these data.
RESULTS
Patient Characteristics
A total of 150 patients enrolled in the study. The mean length of stay was 5.4 days (SD: 5.6; range: 147 days). HF was the most common primary diagnosis (46.7%, n = 70) with 48% (n = 34) having an ejection fraction of 45% or less (mean = 43%; SD: 22); followed by cancer (30%, n = 45) with the most common type being prostate (18%, n = 8), lung (13%, n = 6), and breast (13%, n = 6); and COPD (23%, n = 35) with an average FEV1 of 1.5 L (SD: 0.94; range: 0.503.9). The mean age was 77 years (SD: 7.9; range: 6596 years). The majority of participants were men (56%, n = 83) and white (73%, n = 108), with the most being either married/partnered (43%, n = 64) or divorced/widowed (44%, n = 66). The IADL identified almost two‐thirds of participants as dependent (62%, n = 94). The GDS‐15 categorized three‐quarters of participants (n = 118) as not depressed. The only significant association between participant characteristics and their primary diagnosis was for the IADL index (Table 1), with significantly more (2 = 6.3; P = 0.04) patients with HF categorized as being dependent (72%).
| Characteristics | Primary Diagnosis | P | |||
|---|---|---|---|---|---|
| Cancer n = 44 | HF n = 70 | COPD n = 35 | |||
| |||||
| Length of stay | (Mean days) | 5.4 | 4.7 | 6.5 | 0.3 |
| Age | (Mean years) | 76 | 78 | 76 | 0.3 |
| Sex | |||||
| Female | 47% | 37% | 57% | 0.1 | |
| Marital status | 0.2 | ||||
| Single | 16 | 9 | 17 | ||
| Married/partnered | 51 | 45 | 29 | ||
| Divorced/widowed | 33 | 46 | 54 | ||
| Race | |||||
| White | 89 | 64 | 69 | 0.1 | |
| Black/African American | 7 | 21 | 23 | ||
| Asian or Pacific Islander | 5 | 10 | 9 | ||
| Other | 0 | 4 | 0 | ||
| IADL | |||||
| Dependent | 49 | 72 | 60 | 0.04 | |
| GDS‐15 | |||||
| Probable depression | 18 | 22 | 21 | 0.9 | |
Frequency and Severity of Symptoms
On average, the postdischarge follow‐up assessment was undertaken 24 days (median = 21.0; SD: 17.9; range: 7140 days) after the baseline assessment and 20 days after discharge (median = 15; SD: 17.0; range: 4139). At baseline, a large proportion of participants reported symptoms at a moderate‐to‐severe level for pain (54%, n = 81), dyspnea (53%, n = 79), and anxiety (63%, n = 94). The majority of patients (64%, n = 96) reported having 2 or more symptoms at a moderate‐to‐severe level and one quarter (27%, n = 41) had 3 symptoms at a moderate‐to‐severe level. While the frequency of moderate‐to‐severe symptoms decreased at the 24‐hour hospital assessment (pain = 42%, dyspnea = 45%, anxiety = 55%) and again at 2‐week follow‐up (pain = 28%, dyspnea = 27%, anxiety = 25%), a substantial symptom burden persisted with 30% (n = 36) of patients having moderate‐to‐severe levels at 2‐week follow‐up. Overall there were no differences between primary diagnosis and the frequency of symptoms at baseline or 24‐hour hospital assessment (Figure 1). However at follow‐up, those diagnosed with COPD were more likely to report moderate/severe pain (54%; 2 = 22.0; P < 0.001), dyspnea (45%; 2 = 9.3; P = 0.05), and overall symptom burden (55%; 2 = 25.9; P < 0.001) than those with cancer (pain = 22%, dyspnea = 16%, symptom burden = 16%) or HF (pain = 25%, dyspnea = 24%, symptom burden = 28%).
As symptom burden was our composite score for pain, dyspnea, and anxiety, we were interested in identifying variables in addition to primary diagnosis that might be associated with symptom burden at follow‐up. Bivariate analysis revealed that there was no significant association between symptom burden and age (2 = 1.5; P = 0.5), gender (2 = 1.3; P = 0.3), length of stay (2 = 0.4; P = 0.8), and (IADL) level of independence (2 = 0.3; P = 0.6). However, those with probable depression were more likely (2 = 11.9; P = 0.001) to have a moderate/severe symptom burden (62%, n = 13), compared to those with no depression (24%, n = 23). After adjusting for severity of symptom burden at baseline, multivariate logistic regression revealed that primary diagnosis (P = 0.01) and probable depression (OR = 4.9; 95% CI = 1.6, 14.9; P = 0.005) were associated with symptom severity. Patients with COPD had greater odds (OR = 7.0; 95% CI = 1.9, 26.2; P = 0.002) of moderate/severe symptom burden than those with cancer, while those with HF did not (OR = 2.3; 95% CI = 0.7, 7.7; P = 0.16). There was significant interaction between primary diagnosis and depression (P = 0.2).
Primary Diagnosis, Symptom Burden, and Survival Time
A total of 75% of patients were identified by the National Death Index to have died between hospital discharge and December 2007, of which 47% had died within 12 months after discharge. KaplanMeier survival curves (Figure 2) revealed a significant difference (MantelCox: 2 = 19.3; df = 1; P = 0.0001) in survival time, with patients diagnosed with COPD (median = 19.0 months; 95% CI = 6.5, 31.5) and HF (median = 20.0 months; 95% CI = 12.5, 27.5) having a longer survival than those with cancer (median = 8.0 months; 95% CI = 4.1, 11.9).
We also examined the relationship between symptom burden and survival time. KaplanMeier survival curves revealed no significant difference (MantelCox: 2 = 0.2; P = 0.6) in the survival time of patients classified with a symptom burden of none/moderate (median = 15.0 months; 95% CI = 8.8, 21.2) or moderate/severe (median = 14.0 months; 95% CI = 2.6, 25.4).
DISCUSSION
In our sample of older inpatients diagnosed with cancer, HF, and COPD, a large proportion reported moderate‐to‐severe levels of pain, dyspnea, and anxiety at baseline and follow‐up. When combined, these levels represent a considerable symptom burden, with over three‐quarters of participants reporting 2 to 3 symptoms at a moderate/severe level at baseline. While symptom scores decreased at 24‐hours and 2‐week follow‐up, symptom burden remained high, with almost half of the participants reporting 23 symptoms at a moderate‐to‐severe level at 24‐hour assessment and a large minority reporting moderate‐to‐severe symptoms at follow‐up. A higher percentage of patients with COPD reported moderate‐to‐severe pain, dyspnea, and overall symptom burden at follow‐up than participants with cancer or HF who reported a similar symptom burden. We also found that patients with probable depression were more likely to have a significant symptom burden at follow‐up. These findings highlight the need to routinely assess and treat symptoms over time, including depression, and especially in patients with COPD. While we found that hospital care was seemingly effective in improving symptoms, they persist at distressing levels in many patients.
Few studies have assessed the severity of symptoms over time. One study that did, examined symptom severity among community‐based elders diagnosed with HF and COPD.6 At baseline, these participants had a lower prevalence of moderate‐to‐severe symptoms than the hospitalized patients enrolled in our study, a finding that would be anticipated, as they may not have been as ill. However, symptom severity persisted in the community‐based subjects and, in some cases, worsened over the 22‐month assessment period for pain (HF = 20% vs 42%; COPD = 27% vs 20%), dyspnea (HF = 19% vs 29%; COPD = 66% vs 76%), and anxiety (HF = 2% vs 12%; COPD = 32% vs 23%).6 In contrast, while our subjects with a primary diagnosis of HF and COPD had a higher prevalence of moderate‐to‐severe symptoms at baseline, they did experience an improvement in the severity of pain, dyspnea, and anxiety at the 2‐week follow‐up assessment. However, despite a decrease in the prevalence of moderate‐to‐severe symptoms from baseline to follow‐up, a high symptom burden persisted for many patients, particularly for those diagnosed with COPD and those with probable depression at baseline. The severity of a patient's symptoms can have a profound negative effect on health status and quality of life.14 Findings from these studies suggest that symptoms are currently not being adequately managed, and highlight an urgent need to develop coordinated strategies and systems that focus on improving the management of symptoms, including depression, over time.6
We also found that subjects recruited for this study had advanced disease, evidenced by the fact that nearly half died within 12 months. We did not use specific prognostic indices or severity of illness criteria for recruiting subjects and simply approached patients admitted with one of the target diagnoses. Our study suggests that targeting these patients for routine symptom assessment and management, including for palliative care, would be a reasonable approach given the high symptom burden and relatively high mortality at 1 year.
Interpretation of these findings should be mitigated by the following limitations. Because of our setting, our findings may not be generalizable to all patients with cancer, HF, and COPD. However, our subjects were admitted to general medical and cardiology services, and had common conditions, and therefore are likely similar to those presenting to other hospitals. We relied on self‐report measures to assess severity of symptoms. Patient self‐report, while potentially subject to imprecision due to poor recall and social demand biases, is considered the gold standard for symptom assessment.15 Finally, 2‐week follow‐up is relatively short, and it is possible that symptoms may have improved had we assessed them over a longer period. The longitudinal study of elders in the community that followed subjects over 22 months found that, for many patients, symptoms worsened over time and nearly half of our subjects died at 12 months, suggesting that longer follow‐up would have been unlikely to show improvement in symptoms.6
A significant minority of participants reported a substantial, persistent symptom burden, yet all symptoms assessed in our study are potentially modifiable. Recognizing and treating symptoms can be achieved through the use of targeted interventions.6 Because symptoms can occur in clusters, successful treatment of 1 symptom may also help to improve other symptoms.1 The large number of participants reporting moderate‐to‐severe levels of symptom burden at 2 weeks after discharge highlights an unmet need for improved symptom control in the outpatient setting. Unfortunately, while evidence exists for managing pain in patients with cancer, such evidence‐based practices are lacking for the management of pain and other symptoms in patients with HF and COPD. Some symptoms may require specific, disease‐oriented management. However, many symptoms may be due to common comorbidities, such as pain from degenerative joint disease, that may likely respond to proven treatments.16
Our study confirmed the significant burden of symptoms experienced by patients with serious illness and demonstrated that patients with COPD report as much symptom burden as patients with cancer and HF, if not more. While symptom severity improved over the course of the hospitalization and follow‐up, a large percentage of patients reported significant symptom burden at follow‐up. Depression was also common in these patients. Because these symptoms diminish quality of life, routine assessment and management of these symptoms is critical for improving the quality of care provided to these patients. Additional research on the best approaches to manage symptoms, including medications, interventions, and structures of care, could further improve care.
Acknowledgements
The authors thank all the patients who participated in this study. They thank Joanne Batt, Wren Levenberg, and Emily Philipps for their expert help as research assistants. They also thank Harold Collard, MD, for providing valuable feedback on the manuscript. Data obtained from the National Death Index assisted us in meeting our study objectives. Steven Pantilat had full access to all of the data in the study and takes responsibility for the integrity of the data and the accuracy of the data analysis.
- ,,.Symptom clusters: the new frontier in symptom management research.J Natl Cancer Inst Monogr.2004(32):17–21.
- .Symptom burden: multiple symptoms and their impact as patient‐reported outcomes.J Natl Cancer Inst Monogr.2007(37):16–21.
- ,,.A comparison of symptom prevalence in far advanced cancer, AIDS, heart disease, chronic obstructive pulmonary disease and renal disease.J Pain Symptom Manage.2006;31(1):58–69.
- ,,, et al.Comparing three life‐limiting diseases: does diagnosis matter or is sick, sick?J Pain Symptom Manage.2011;42(3):331–341.
- ,,,,,.Deaths: final data for 2006.Natl Vital Stat Rep.2009;57(14):1–134.
- ,,,,,.Range and severity of symptoms over time among older adults with chronic obstructive pulmonary disease and heart failure.Arch Intern Med.2007;167(22):2503–2508.
- ,,,.Living with chronic obstructive pulmonary disease: a survey of patients' knowledge and attitudes.Respir Med.2009;103(7):1004–1012.
- ,,,,.The symptom burden of seriously ill hospitalized patients. SUPPORT Investigators. Study to Understand Prognoses and Preferences for Outcome and Risks of Treatment.J Pain Symptom Manage.1999;17(4):248–255.
- ,,, et al.Relationship between early physician follow‐up and 30‐day readmission among Medicare beneficiaries hospitalized for heart failure.JAMA.2010;303(17):1716–1722.
- ,,,.Hospital‐based palliative medicine consultation: a randomized controlled trial.Arch Intern Med.2010;170(22):2038–2040.
- ,,,,.Studies of illness in the aged. The Index of ADL: a standardized measure of biological and psychosocial function.JAMA.1963;185:914–919.
- ,,,.Screening for late life depression: cut‐off scores for the Geriatric Depression Scale and the Cornell Scale for Depression in Dementia among Japanese subjects.Int J Geriatr Psychiatry.2003;18(6):498–505.
- ,.Nonparametric estimation from incomplete observations.J Am Stat Assoc.1958;53(282):457–481.
- ,,.End stage chronic obstructive pulmonary disease.Pneumonol Alergol Pol.2009;77(2):173–179.
- ,,,.Relationship between social desirability and self‐report in chronic pain patients.Clin J Pain.1995;11(3):189–193.
- ,,,.Etiology and severity of pain among outpatients living with HF.J Card Fail.2010;16(8):S88.
- ,,.Symptom clusters: the new frontier in symptom management research.J Natl Cancer Inst Monogr.2004(32):17–21.
- .Symptom burden: multiple symptoms and their impact as patient‐reported outcomes.J Natl Cancer Inst Monogr.2007(37):16–21.
- ,,.A comparison of symptom prevalence in far advanced cancer, AIDS, heart disease, chronic obstructive pulmonary disease and renal disease.J Pain Symptom Manage.2006;31(1):58–69.
- ,,, et al.Comparing three life‐limiting diseases: does diagnosis matter or is sick, sick?J Pain Symptom Manage.2011;42(3):331–341.
- ,,,,,.Deaths: final data for 2006.Natl Vital Stat Rep.2009;57(14):1–134.
- ,,,,,.Range and severity of symptoms over time among older adults with chronic obstructive pulmonary disease and heart failure.Arch Intern Med.2007;167(22):2503–2508.
- ,,,.Living with chronic obstructive pulmonary disease: a survey of patients' knowledge and attitudes.Respir Med.2009;103(7):1004–1012.
- ,,,,.The symptom burden of seriously ill hospitalized patients. SUPPORT Investigators. Study to Understand Prognoses and Preferences for Outcome and Risks of Treatment.J Pain Symptom Manage.1999;17(4):248–255.
- ,,, et al.Relationship between early physician follow‐up and 30‐day readmission among Medicare beneficiaries hospitalized for heart failure.JAMA.2010;303(17):1716–1722.
- ,,,.Hospital‐based palliative medicine consultation: a randomized controlled trial.Arch Intern Med.2010;170(22):2038–2040.
- ,,,,.Studies of illness in the aged. The Index of ADL: a standardized measure of biological and psychosocial function.JAMA.1963;185:914–919.
- ,,,.Screening for late life depression: cut‐off scores for the Geriatric Depression Scale and the Cornell Scale for Depression in Dementia among Japanese subjects.Int J Geriatr Psychiatry.2003;18(6):498–505.
- ,.Nonparametric estimation from incomplete observations.J Am Stat Assoc.1958;53(282):457–481.
- ,,.End stage chronic obstructive pulmonary disease.Pneumonol Alergol Pol.2009;77(2):173–179.
- ,,,.Relationship between social desirability and self‐report in chronic pain patients.Clin J Pain.1995;11(3):189–193.
- ,,,.Etiology and severity of pain among outpatients living with HF.J Card Fail.2010;16(8):S88.
Copyright © 2012 Society of Hospital Medicine
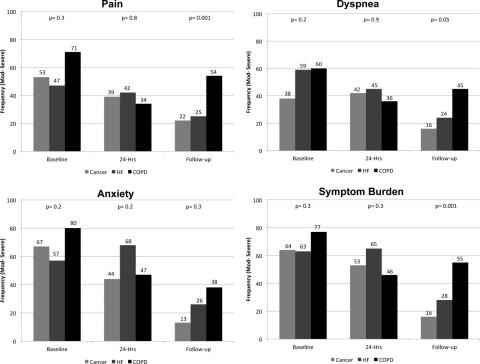
Pediatric Observation Status Stays
In recent decades, hospital lengths of stay have decreased and there has been a shift toward outpatient management for many pediatric conditions. In 2003, one‐third of all children admitted to US hospitals experienced 1‐day inpatient stays, an increase from 19% in 1993.1 Some hospitals have developed dedicated observation units for the care of children, with select diagnoses, who are expected to respond to less than 24 hours of treatment.26 Expansion of observation services has been suggested as an approach to lessen emergency department (ED) crowding7 and alleviate high‐capacity conditions within hospital inpatient units.8
In contrast to care delivered in a dedicated observation unit, observation status is an administrative label applied to patients who do not meet inpatient criteria as defined by third parties such as InterQual. While the decision to admit a patient is ultimately at the discretion of the ordering physician, many hospitals use predetermined criteria to assign observation status to patients admitted to observation and inpatient units.9 Treatment provided under observation status is designated by hospitals and payers as outpatient care, even when delivered in an inpatient bed.10 As outpatient‐designated care, observation cases do not enter publicly available administrative datasets of hospital discharges that have traditionally been used to understand hospital resource utilization, including the National Hospital Discharge Survey and the Kid's Inpatient Database.11, 12
We hypothesize that there has been an increase in observation status care delivered to children in recent years, and that the majority of children under observation were discharged home without converting to inpatient status. To determine trends in pediatric observation status care, we conducted the first longitudinal, multicenter evaluation of observation status code utilization following ED treatment in a sample of US freestanding children's hospitals. In addition, we focused on the most recent year of data among top ranking diagnoses to assess the current state of observation status stay outcomes (including conversion to inpatient status and return visits).
METHODS
Data Source
Data for this multicenter retrospective cohort study were obtained from the Pediatric Health Information System (PHIS). Freestanding children's hospital's participating in PHIS account for approximately 20% of all US tertiary care children's hospitals. The PHIS hospitals provide resource utilization data including patient demographics, International Classification of Diseases, Ninth Revision (ICD‐9) diagnosis and procedure codes, and charges applied to each stay, including room and nursing charges. Data were de‐identified prior to inclusion in the database, however encrypted identification numbers allowed for tracking individual patients across admissions. Data quality and reliability were assured through a joint effort between the Child Health Corporation of America (CHCA; Shawnee Mission, KS) and participating hospitals as described previously.13, 14 In accordance with the Common Rule (45 CFR 46.102(f)) and the policies of The Children's Hospital of Philadelphia Institutional Review Board, this research, using a de‐identified dataset, was considered exempt from review.
Hospital Selection
Each year from 2004 to 2009, there were 18 hospitals participating in PHIS that reported data from both inpatient discharges and outpatient visits (including observation status discharges). To assess data quality for observation status stays, we evaluated observation status discharges for the presence of associated observation billing codes applied to charge records reported to PHIS including: 1) observation per hour, 2) ED observation time, or 3) other codes mentioning observation in the hospital charge master description document. The 16 hospitals with observation charges assigned to at least 90% of observation status discharges in each study year were selected for analysis.
Visit Identification
Within the 16 study hospitals, we identified all visits between January 1, 2004 and December 31, 2009 with ED facility charges. From these ED visits, we included any stays designated by the hospital as observation or inpatient status, excluding transfers and ED discharges.
Variable Definitions
Hospitals submitting records to PHIS assigned a single patient type to the episode of care. The Observation patient type was assigned to patients discharged from observation status. Although the duration of observation is often less than 24 hours, hospitals may allow a patient to remain under observation for longer durations.15, 16 Duration of stay is not defined precisely enough within PHIS to determine hours of inpatient care. Therefore, length of stay (LOS) was not used to determine observation status stays.
The Inpatient patient type was assigned to patients who were discharged from inpatient status, including those patients admitted to inpatient care from the ED and also those who converted to inpatient status from observation. Patients who converted from observation status to inpatient status during the episode of care could be identified through the presence of observation charge codes as described above.
Given the potential for differences in the application of observation status, we also identified 1‐Day Stays where discharge occurred on the day of, or the day following, an inpatient status admission. These 1‐Day Stays represent hospitalizations that may, by their duration, be suitable for care in an observation unit. We considered discharges in the Observation and 1‐Day Stay categories to be Short‐Stays.
DATA ANALYSIS
For each of the 6 years of study, we calculated the following proportions to determine trends over time: 1) the number of Observation Status admissions from the ED as a proportion of the total number of ED visits resulting in Observation or Inpatient admission, and 2) the number of 1‐Day Stays admitted from the ED as a proportion of the total number of ED visits resulting in Observation or Inpatient admissions. Trends were analyzed using linear regression. Trends were also calculated for the total volume of admissions from the ED and the case‐mix index (CMI). CMI was assessed to evaluate for changes in the severity of illness for children admitted from the ED over the study period. Each hospital's CMI was calculated as an average of their Observation and Inpatient Status discharges' charge weights during the study period. Charge weights were calculated at the All Patient Refined Diagnosis Related Groups (APR‐DRG)/severity of illness level (3M Health Information Systems, St Paul, MN) and were normalized national average charges derived by Thomson‐Reuters from their Pediatric Projected National Database. Weights were then assigned to each discharge based on the discharge's APR‐DRG and severity level assignment.
To assess the current outcomes for observation, we analyzed stays with associated observation billing codes from the most recent year of available data (2009). Stays with Observation patient type were considered to have been discharged from observation, while those with an Inpatient Status patient type were considered to have converted to an inpatient admission during the observation period.
Using the 2009 data, we calculated descriptive statistics for patient characteristics (eg, age, gender, payer) comparing Observation Stays, 1‐Day Stays, and longer‐duration Inpatient admissions using chi‐square statistics. Age was categorized using the American Academy of Pediatrics groupings: <30 days, 30 days1 year, 12 years, 34 years, 512 years, 1317 years, >18 years. Designated payer was categorized into government, private, and other, including self‐pay and uninsured groups.
We used the Severity Classification Systems (SCS) developed for pediatric emergency care to estimate severity of illness for the visit.17 In this 5‐level system, each ICD‐9 diagnosis code is associated with a score related to the intensity of ED resources needed to care for a child with that diagnosis. In our analyses, each case was assigned the maximal SCS category based on the highest severity ICD‐9 code associated with the stay. Within the SCS, a score of 1 indicates minor illness (eg, diaper dermatitis) and 5 indicates major illness (eg, septic shock). The proportions of visits within categorical SCS scores were compared for Observation Stays, 1‐Day Stays, and longer‐duration Inpatient admissions using chi‐square statistics.
We determined the top 10 ranking diagnoses for which children were admitted from the ED in 2009 using the Diagnosis Grouping System (DGS).18 The DGS was designed specifically to categorize pediatric ED visits into clinically meaningful groups. The ICD‐9 code for the principal discharge diagnosis was used to assign records to 1 of the 77 DGS subgroups. Within each of the top ranking DGS subgroups, we determined the proportion of Observation Stays, 1‐Day Stays, and longer‐duration Inpatient admissions.
To provide clinically relevant outcomes of Observation Stays for common conditions, we selected stays with observation charges from within the top 10 ranking observation stay DGS subgroups in 2009. Outcomes for observation included: 1) immediate outcome of the observation stay (ie, discharge or conversion to inpatient status), 2) return visits to the ED in the 3 days following observation, and 3) readmissions to the hospital in the 3 and 30 days following observation. Bivariate comparisons of return visits and readmissions for Observation versus 1‐Day Stays within DGS subgroups were analyzed using chi‐square tests. Multivariate analyses of return visits and readmissions were conducted using Generalized Estimating Equations adjusting for severity of illness by SCS score and clustering by hospital. To account for local practice patterns, we also adjusted for a grouped treatment variable that included the site level proportion of children admitted to Observation Status, 1‐Day‐Stays, and longer Inpatient admissions. All statistical analyses were performed using SAS (version 9.2, SAS Institute, Inc, Cary, NC); P values <0.05 were considered statistically significant.
RESULTS
Trends in Short‐Stays
An increase in proportion of Observation Stays was mirrored by a decrease in proportion of 1‐Day Stays over the study period (Figure 1). In 2009, there were 1.4 times more Observation Stays than 1‐Day Stays (25,653 vs 18,425) compared with 14,242 and 20,747, respectively, in 2004. This shift toward more Observation Stays occurred as hospitals faced a 16% increase in the total number of admissions from the ED (91,318 to 108,217) and change in CMI from 1.48 to 1.51. Over the study period, roughly 40% of all admissions from the ED were Short‐Stays (Observation and 1‐Day Stays). Median LOS for Observation Status stays was 1 day (interquartile range [IQR]: 11).
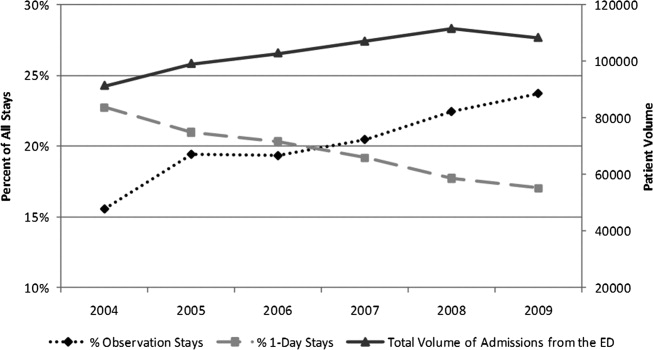
Patient Characteristics in 2009
Table 1 presents comparisons between Observation, 1‐Day Stays, and longer‐duration Inpatient admissions. Of potential clinical significance, children under Observation Status were slightly younger (median, 4.0 years; IQR: 1.310.0) when compared with children admitted for 1‐Day Stays (median, 5.0 years; IQR: 1.411.4; P < 0.001) and longer‐duration Inpatient stays (median, 4.7 years; IQR: 0.912.2; P < 0.001). Nearly two‐thirds of Observation Status stays had SCS scores of 3 or lower compared with less than half of 1‐Day Stays and longer‐duration Inpatient admissions.
| Short‐Stays | LOS >1 Day | |||||
|---|---|---|---|---|---|---|
| Observation | 1‐Day Stay | Longer Admission | ||||
| N = 25,653* (24%) | N = 18,425* (17%) | P Value Comparing Observation to 1‐Day Stay | N = 64,139* (59%) | P Value Comparing Short‐Stays to LOS >1 Day | ||
| ||||||
| Sex | Male | 14,586 (57) | 10,474 (57) | P = 0.663 | 34,696 (54) | P < 0.001 |
| Female | 11,000 (43) | 7,940 (43) | 29,403 (46) | |||
| Payer | Government | 13,247 (58) | 8,944 (55) | P < 0.001 | 35,475 (61) | P < 0.001 |
| Private | 7,123 (31) | 5,105 (32) | 16,507 (28) | |||
| Other | 2,443 (11) | 2,087 (13) | 6,157 (11) | |||
| Age | <30 days | 793 (3) | 687 (4) | P < 0.001 | 3,932 (6) | P < 0.001 |
| 30 days1 yr | 4,499 (17) | 2,930 (16) | 13,139 (21) | |||
| 12 yr | 5,793 (23) | 3,566 (19) | 10,229 (16) | |||
| 34 yr | 3,040 (12) | 2,056 (11) | 5,551 (9) | |||
| 512 yr | 7,427 (29) | 5,570 (30) | 17,057 (27) | |||
| 1317 yr | 3,560 (14) | 3,136 (17) | 11,860 (18) | |||
| >17 yr | 541 (2) | 480 (3) | 2,371 (4) | |||
| Race | White | 17,249 (70) | 12,123 (70) | P < 0.001 | 40,779 (67) | P <0.001 |
| Black | 6,298 (25) | 4,216 (25) | 16,855 (28) | |||
| Asian | 277 (1) | 295 (2) | 995 (2) | |||
| Other | 885 (4) | 589 (3) | 2,011 (3) | |||
| SCS | 1 Minor illness | 64 (<1) | 37 (<1) | P < 0.001 | 84 (<1) | P < 0.001 |
| 2 | 1,190 (5) | 658 (4) | 1,461 (2) | |||
| 3 | 14,553 (57) | 7,617 (42) | 20,760 (33) | |||
| 4 | 8,994 (36) | 9,317 (51) | 35,632 (56) | |||
| 5 Major illness | 490 (2) | 579 (3) | 5,689 (9) | |||
In 2009, the top 10 DGS subgroups accounted for half of all admissions from the ED. The majority of admissions for extremity fractures, head trauma, dehydration, and asthma were Short‐Stays, as were roughly 50% of admissions for seizures, appendicitis, and gastroenteritis (Table 2). Respiratory infections and asthma were the top 1 and 2 ranking DGS subgroups for Observation Stays, 1‐Day Stays, and longer‐duration Inpatient admissions. While rank order differed, 9 of the 10 top ranking Observation Stay DGS subgroups were also top ranking DGS subgroups for 1‐Day Stays. Gastroenteritis ranked 10th among Observation Stays and 11th among 1‐Day Stays. Diabetes mellitus ranked 26th among Observation Stays compared with 8th among 1‐Day Stays.
| Short‐Stays | LOS >1 Day | ||
|---|---|---|---|
| % Observation | % 1‐Day Stay | % Longer Admission | |
| |||
| All admissions from the ED | 23.7 | 17.0 | 59.3 |
| n = 108,217 | |||
| Respiratory infections | 22.3 | 15.3 | 62.4 |
| n = 14,455 (13%) | |||
| Asthma | 32.0 | 23.8 | 44.2 |
| n = 8,853 (8%) | |||
| Other GI diseases | 24.1 | 16.2 | 59.7 |
| n = 6,519 (6%) | |||
| Appendicitis | 21.0 | 29.5 | 49.5 |
| n = 4,480 (4%) | |||
| Skin infections | 20.7 | 14.3 | 65.0 |
| n = 4,743 (4%) | |||
| Seizures | 29.5 | 22 | 48.5 |
| n = 4,088 (4%) | |||
| Extremity fractures | 49.4 | 20.5 | 30.1 |
| n = 3,681 (3%) | |||
| Dehydration | 37.8 | 19.0 | 43.2 |
| n = 2,773 (3%) | |||
| Gastroenteritis | 30.3 | 18.7 | 50.9 |
| n = 2,603 (2%) | |||
| Head trauma | 44.1 | 43.9 | 32.0 |
| n = 2,153 (2%) | |||
Average maximum SCS scores were clinically comparable for Observation and 1‐Day Stays and generally lower than for longer‐duration Inpatient admissions within the top 10 most common DGS subgroups. Average maximum SCS scores were statistically lower for Observation Stays compared with 1‐Day Stays for respiratory infections (3.2 vs 3.4), asthma (3.4 vs 3.6), diabetes (3.5 vs 3.8), gastroenteritis (3.0 vs 3.1), other gastrointestinal diseases (3.2 vs 3.4), head trauma (3.3 vs 3.5), and extremity fractures (3.2 vs 3.4) (P < 0.01). There were no differences in SCS scores for skin infections (SCS = 3.0) and appendicitis (SCS = 4.0) when comparing Observation and 1‐Day Stays.
Outcomes for Observation Stays in 2009
Within 6 of the top 10 DGS subgroups for Observation Stays, >75% of patients were discharged home from Observation Status (Table 3). Mean LOS for stays that converted from Observation to Inpatient Status ranged from 2.85 days for extremity fractures to 4.66 days for appendicitis.
| Return to ED in 3 Days n = 421 (1.6%) | Hospital Readmissions in 3 Days n = 247 (1.0%) | Hospital Readmissions in 30 Days n = 819 (3.2%) | ||
|---|---|---|---|---|
| DGS subgroup | % Discharged From Observation | Adjusted* Odds Ratio (95% CI) | Adjusted* Odds Ratio (95% CI) | Adjusted* Odds Ratio (95% CI) |
| ||||
| Respiratory infections | 72 | 1.1 (0.71.8) | 0.8 (0.51.3) | 0.9 (0.71.3) |
| Asthma | 80 | 1.3 (0.63.0) | 1.0 (0.61.8) | 0.5 (0.31.0) |
| Other GI diseases | 74 | 0.8 (0.51.3) | 2.2 (1.33.8) | 1.0 (0.71.5) |
| Appendicitis | 82 | NE | NE | NE |
| Skin infections | 68 | 1.8 (0.84.4) | 1.4 (0.45.3) | 0.9 (0.61.6) |
| Seizures | 79 | 0.8 (0.41.6) | 0.8 (0.31.8) | 0.7 (0.51.0) |
| Extremity fractures | 92 | 0.9 (0.42.1) | 0.2 (01.3) | 1.2 (0.53.2) |
| Dehydration | 81 | 0.9 (0.61.4) | 0.8 (0.31.9) | 0.7 (0.41.1) |
| Gastroenteritis | 74 | 0.9 (0.42.0) | 0.6 (0.41.2) | 0.6 (0.41) |
| Head trauma | 92 | 0.6 (0.21.7) | 0.3 (02.1) | 1.0 (0.42.8) |
Among children with Observation Stays for 1 of the top 10 DGS subgroups, adjusted return ED visit rates were <3% and readmission rates were <1.6% within 3 days following the index stay. Thirty‐day readmission rates were highest following observation for other GI illnesses and seizures. In unadjusted analysis, Observation Stays for asthma, respiratory infections, and skin infections were associated with greater proportions of return ED visits when compared with 1‐Day Stays. Differences were no longer statistically significant after adjusting for SCS score, clustering by hospital, and the grouped treatment variable. Adjusted odds of readmission were significantly higher at 3 days following observation for other GI illnesses and lower at 30 days following observation for seizures when compared with 1‐Day Stays (Table 3).
DISCUSSION
In this first, multicenter longitudinal study of pediatric observation following an ED visit, we found that Observation Status code utilization has increased steadily over the past 6 years and, in 2007, the proportion of children admitted to observation status surpassed the proportion of children experiencing a 1‐day inpatient admission. Taken together, Short‐Stays made up more than 40% of the hospital‐based care delivered to children admitted from an ED. Stable trends in CMI over time suggest that observation status may be replacing inpatient status designated care for pediatric Short‐Stays in these hospitals. Our findings suggest the lines between outpatient observation and short‐stay inpatient care are becoming increasingly blurred. These trends have occurred in the setting of changing policies for hospital reimbursement, requirements for patients to meet criteria to qualify for inpatient admissions, and efforts to avoid stays deemed unnecessary or inappropriate by their brief duration.19 Therefore there is a growing need to understand the impact of children under observation on the structure, delivery, and financing of acute hospital care for children.
Our results also have implications for pediatric health services research that relies on hospital administrative databases that do not contain observation stays. Currently, observation stays are systematically excluded from many inpatient administrative datasets.11, 12 Analyses of datasets that do not account for observation stays likely result in underestimation of hospitalization rates and hospital resource utilization for children. This may be particularly important for high‐volume conditions, such as asthma and acute infections, for which children commonly require brief periods of hospital‐based care beyond an ED encounter. Data from pediatric observation status admissions should be consistently included in hospital administrative datasets to allow for more comprehensive analyses of hospital resource utilization among children.
Prior research has shown that the diagnoses commonly treated in pediatric observation units overlap with the diagnoses for which children experience 1‐Day Stays.1, 20 We found a similar pattern of conditions for which children were under Observation Status and 1‐Day Stays with comparable severity of illness between the groups in terms of SCS scores. Our findings imply a need to determine how and why hospitals differentiate Observation Status from 1‐Day‐Stay groups in order to improve the assignment of observation status. Assuming continued pressures from payers to provide more care in outpatient or observation settings, there is potential for expansion of dedicated observation services for children in the US. Without designated observation units or processes to group patients with lower severity conditions, there may be limited opportunities to realize more efficient hospital care simply through the application of the label of observation status.
For more than 30 years, observation services have been provided to children who require a period of monitoring to determine their response to therapy and the need for acute inpatient admission from the ED.21While we were not able to determine the location of care for observation status patients in this study, we know that few children's hospitals have dedicated observation units and, even when an observation unit is present, not all observation status patients are cared for in dedicated observation units.9 This, in essence, means that most children under observation status are cared for in virtual observation by inpatient teams using inpatient beds. If observation patients are treated in inpatient beds and consume the same resources as inpatients, then cost‐savings based on reimbursement contracts with payers may not reflect an actual reduction in services. Pediatric institutions will need to closely monitor the financial implications of observation status given the historical differences in payment for observation and inpatient care.
With more than 70% of children being discharged home following observation, our results are comparable to the published literature2, 5, 6, 22, 23 and guidelines for observation unit operations.24 Similar to prior studies,4, 15, 2530 our results also indicate that return visits and readmissions following observation are uncommon events. Our findings can serve as initial benchmarks for condition‐specific outcomes for pediatric observation care. Studies are needed both to identify the clinical characteristics predictive of successful discharge home from observation and to explore the hospital‐to‐hospital variability in outcomes for observation. Such studies are necessary to identify the most successful healthcare delivery models for pediatric observation stays.
LIMITATIONS
The primary limitation to our results is that data from a subset of freestanding children's hospitals may not reflect observation stays at other children's hospitals or the community hospitals that care for children across the US. Only 18 of 42 current PHIS member hospitals have provided both outpatient visit and inpatient stay data for each year of the study period and were considered eligible. In an effort to ensure the quality of observation stay data, we included the 16 hospitals that assigned observation charges to at least 90% of their observation status stays in the PHIS database. The exclusion of the 2 hospitals where <90% of observation status patients were assigned observation charges likely resulted in an underestimation of the utilization of observation status.
Second, there is potential for misclassification of patient type given institutional variations in the assignment of patient status. The PHIS database does not contain information about the factors that were considered in the assignment of observation status. At the time of admission from the ED, observation or inpatient status is assigned. While this decision is clearly reserved for the admitting physician, the process is not standardized across hospitals.9 Some institutions have Utilization Managers on site to help guide decision‐making, while others allow the assignment to be made by physicians without specific guidance. As a result, some patients may be assigned to observation status at admission and reassigned to inpatient status following Utilization Review, which may bias our results toward overestimation of the number of observation stays that converted to inpatient status.
The third limitation to our results relates to return visits. An accurate assessment of return visits is subject to the patient returning to the same hospital. If children do not return to the same hospital, our results would underestimate return visits and readmissions. In addition, we did not assess the reason for return visit as there was no way to verify if the return visit was truly related to the index visit without detailed chart review. Assuming children return to the same hospital for different reasons, our results would overestimate return visits associated with observation stays. We suspect that many 3‐day return visits result from the progression of acute illness or failure to respond to initial treatment, and 30‐day readmissions reflect recurrent hospital care needs related to chronic illnesses.
Lastly, severity classification is difficult when analyzing administrative datasets without physiologic patient data, and the SCS may not provide enough detail to reveal clinically important differences between patient groups.
CONCLUSIONS
Short‐stay hospitalizations following ED visits are common among children, and the majority of pediatric short‐stays are under observation status. Analyses of inpatient administrative databases that exclude observation stays likely result in an underestimation of hospital resource utilization for children. Efforts are needed to ensure that patients under observation status are accounted for in hospital administrative datasets used for pediatric health services research, and healthcare resource allocation, as it relates to hospital‐based care. While the clinical outcomes for observation patients appear favorable in terms of conversion to inpatient admissions and return visits, the financial implications of observation status care within children's hospitals are currently unknown.
- ,,,,,.Trends in high‐turnover stays among children hospitalized in the United States, 1993–2003.Pediatrics.2009;123(3):996–1002.
- ,,,,.Utilization and unexpected hospitalization rates of a pediatric emergency department 23‐hour observation unit.Pediatr Emerg Care.2008;24(9):589–594.
- ,,.When the patient requires observation not hospitalization.J Nurs Admin.1988;18(10):20–23.
- ,,,.Pediatric observation status beds on an inpatient unit: an integrated care model.Pediatr Emerg Care.2004;20(1):17–21.
- ,,.Use of an observation unit by a pediatric emergency department for common pediatric illnesses.Pediatr Emerg Care.2001;17(5):321–323.
- ,,.The pediatric hybrid observation unit: an analysis of 6477 consecutive patient encounters.Pediatrics.2005;115(5):e535–e542.
- ACEP. Emergency Department Crowding: High‐Impact Solutions. Task Force Report on Boarding.2008. Available at: http://www.acep.org/WorkArea/downloadasset.aspx?id=37960. Accessed July 21, 2010.
- ,,, et al.Children's hospitals do not acutely respond to high occupancy.Pediatrics.2010;125(5):974–981.
- ,,, et al.Differences in observation care practices in US freestanding children's hospitals: are they virtual or real?J Hosp Med.2011. Available at: http://www.cms.gov/transmittals/downloads/R770HO.pdf. Accessed January 10, 2011.
- CMS.Medicare Hospital Manual, Section 455.Department of Health and Human Services, Centers for Medicare and Medicaid Services;2001. Available at: http://www.hcup‐us.ahrq.gov/reports/methods/FinalReportonObservationStatus_v2Final.pdf. Accessed on May 3, 2007.
- HCUP.Methods Series Report #2002–3. Observation Status Related to U.S. Hospital Records. Healthcare Cost and Utilization Project.Rockville, MD:Agency for Healthcare Research and Quality;2002.
- ,.Design and operation of the National Hospital Discharge Survey: 1988 redesign.Vital Health Stat.2000;1(39):1–43.
- ,,,.Corticosteroids and mortality in children with bacterial meningitis.JAMA.2008;299(17):2048–2055.
- ,,,,.Intravenous immunoglobulin in children with streptococcal toxic shock syndrome.Clin Infect Dis.2009;49(9):1369–1376.
- ,,,.Impact of a short stay unit on asthma patients admitted to a tertiary pediatric hospital.Qual Manag Health Care.1997;6(1):14–22.
- ,,.An observation unit in a pediatric emergency department: one children's hospital's experience.J Emerg Nurs.2002;28(5):407–413.
- ,,,.Developing a diagnosis‐based severity classification system for use in emergency medical systems for children. Pediatric Academic Societies' Annual Meeting, Platform Presentation; Toronto, Canada;2007.
- ,,,,.A new diagnosis grouping system for child emergency department visits.Acad Emerg Med.2010;17(2):204–213.
- .Observation medicine: the healthcare system's tincture of time. In: Graff LG, ed.Principles of Observation Medicine.American College of Emergency Physicians;2010. Available at: http://www. acep.org/content.aspx?id=46142. Accessed February 18, 2011.
- ,,,,.High turnover stays for pediatric asthma in the United States: analysis of the 2006 Kids' Inpatient Database.Med Care.2010;48(9):827–833.
- ,,,,.Pediatric observation units in the United States: a systematic review.J Hosp Med.2010;5(3):172–182.
- ,.Observation unit in childrens hospital—adjunct to delivery and teaching of ambulatory pediatric care.N Y State J Med.1980;80(11):1684–1686.
- ,,.Short stay in an outpatient department. An alternative to hospitalization.Am J Dis Child.1972;123(2):128–132.
- ACEP.Practice Management Committee, American College of Emergency Physicians. Management of Observation Units.Irving, TX:American College of Emergency Physicians;1994.
- ,,,,.Return visits to a pediatric emergency department.Pediatr Emerg Care.2004;20(3):166–171.
- ,.Postreduction management of intussusception in a children's hospital emergency department.Pediatrics.2003;112(6 pt 1):1302–1307.
- ,,,,.Pediatric closed head injuries treated in an observation unit.Pediatr Emerg Care.2005;21(10):639–644.
- ,,,.Use of pediatric observation unit for treatment of children with dehydration caused by gastroenteritis.Pediatr Emerg Care.2006;22(1):1–6.
- ,,,.Children with asthma admitted to a pediatric observation unit.Pediatr Emerg Care.2005;21(10):645–649.
- ,,, et al.How well can hospital readmission be predicted in a cohort of hospitalized children? A retrospective, multicenter study.Pediatrics.2009;123(1):286–293.
In recent decades, hospital lengths of stay have decreased and there has been a shift toward outpatient management for many pediatric conditions. In 2003, one‐third of all children admitted to US hospitals experienced 1‐day inpatient stays, an increase from 19% in 1993.1 Some hospitals have developed dedicated observation units for the care of children, with select diagnoses, who are expected to respond to less than 24 hours of treatment.26 Expansion of observation services has been suggested as an approach to lessen emergency department (ED) crowding7 and alleviate high‐capacity conditions within hospital inpatient units.8
In contrast to care delivered in a dedicated observation unit, observation status is an administrative label applied to patients who do not meet inpatient criteria as defined by third parties such as InterQual. While the decision to admit a patient is ultimately at the discretion of the ordering physician, many hospitals use predetermined criteria to assign observation status to patients admitted to observation and inpatient units.9 Treatment provided under observation status is designated by hospitals and payers as outpatient care, even when delivered in an inpatient bed.10 As outpatient‐designated care, observation cases do not enter publicly available administrative datasets of hospital discharges that have traditionally been used to understand hospital resource utilization, including the National Hospital Discharge Survey and the Kid's Inpatient Database.11, 12
We hypothesize that there has been an increase in observation status care delivered to children in recent years, and that the majority of children under observation were discharged home without converting to inpatient status. To determine trends in pediatric observation status care, we conducted the first longitudinal, multicenter evaluation of observation status code utilization following ED treatment in a sample of US freestanding children's hospitals. In addition, we focused on the most recent year of data among top ranking diagnoses to assess the current state of observation status stay outcomes (including conversion to inpatient status and return visits).
METHODS
Data Source
Data for this multicenter retrospective cohort study were obtained from the Pediatric Health Information System (PHIS). Freestanding children's hospital's participating in PHIS account for approximately 20% of all US tertiary care children's hospitals. The PHIS hospitals provide resource utilization data including patient demographics, International Classification of Diseases, Ninth Revision (ICD‐9) diagnosis and procedure codes, and charges applied to each stay, including room and nursing charges. Data were de‐identified prior to inclusion in the database, however encrypted identification numbers allowed for tracking individual patients across admissions. Data quality and reliability were assured through a joint effort between the Child Health Corporation of America (CHCA; Shawnee Mission, KS) and participating hospitals as described previously.13, 14 In accordance with the Common Rule (45 CFR 46.102(f)) and the policies of The Children's Hospital of Philadelphia Institutional Review Board, this research, using a de‐identified dataset, was considered exempt from review.
Hospital Selection
Each year from 2004 to 2009, there were 18 hospitals participating in PHIS that reported data from both inpatient discharges and outpatient visits (including observation status discharges). To assess data quality for observation status stays, we evaluated observation status discharges for the presence of associated observation billing codes applied to charge records reported to PHIS including: 1) observation per hour, 2) ED observation time, or 3) other codes mentioning observation in the hospital charge master description document. The 16 hospitals with observation charges assigned to at least 90% of observation status discharges in each study year were selected for analysis.
Visit Identification
Within the 16 study hospitals, we identified all visits between January 1, 2004 and December 31, 2009 with ED facility charges. From these ED visits, we included any stays designated by the hospital as observation or inpatient status, excluding transfers and ED discharges.
Variable Definitions
Hospitals submitting records to PHIS assigned a single patient type to the episode of care. The Observation patient type was assigned to patients discharged from observation status. Although the duration of observation is often less than 24 hours, hospitals may allow a patient to remain under observation for longer durations.15, 16 Duration of stay is not defined precisely enough within PHIS to determine hours of inpatient care. Therefore, length of stay (LOS) was not used to determine observation status stays.
The Inpatient patient type was assigned to patients who were discharged from inpatient status, including those patients admitted to inpatient care from the ED and also those who converted to inpatient status from observation. Patients who converted from observation status to inpatient status during the episode of care could be identified through the presence of observation charge codes as described above.
Given the potential for differences in the application of observation status, we also identified 1‐Day Stays where discharge occurred on the day of, or the day following, an inpatient status admission. These 1‐Day Stays represent hospitalizations that may, by their duration, be suitable for care in an observation unit. We considered discharges in the Observation and 1‐Day Stay categories to be Short‐Stays.
DATA ANALYSIS
For each of the 6 years of study, we calculated the following proportions to determine trends over time: 1) the number of Observation Status admissions from the ED as a proportion of the total number of ED visits resulting in Observation or Inpatient admission, and 2) the number of 1‐Day Stays admitted from the ED as a proportion of the total number of ED visits resulting in Observation or Inpatient admissions. Trends were analyzed using linear regression. Trends were also calculated for the total volume of admissions from the ED and the case‐mix index (CMI). CMI was assessed to evaluate for changes in the severity of illness for children admitted from the ED over the study period. Each hospital's CMI was calculated as an average of their Observation and Inpatient Status discharges' charge weights during the study period. Charge weights were calculated at the All Patient Refined Diagnosis Related Groups (APR‐DRG)/severity of illness level (3M Health Information Systems, St Paul, MN) and were normalized national average charges derived by Thomson‐Reuters from their Pediatric Projected National Database. Weights were then assigned to each discharge based on the discharge's APR‐DRG and severity level assignment.
To assess the current outcomes for observation, we analyzed stays with associated observation billing codes from the most recent year of available data (2009). Stays with Observation patient type were considered to have been discharged from observation, while those with an Inpatient Status patient type were considered to have converted to an inpatient admission during the observation period.
Using the 2009 data, we calculated descriptive statistics for patient characteristics (eg, age, gender, payer) comparing Observation Stays, 1‐Day Stays, and longer‐duration Inpatient admissions using chi‐square statistics. Age was categorized using the American Academy of Pediatrics groupings: <30 days, 30 days1 year, 12 years, 34 years, 512 years, 1317 years, >18 years. Designated payer was categorized into government, private, and other, including self‐pay and uninsured groups.
We used the Severity Classification Systems (SCS) developed for pediatric emergency care to estimate severity of illness for the visit.17 In this 5‐level system, each ICD‐9 diagnosis code is associated with a score related to the intensity of ED resources needed to care for a child with that diagnosis. In our analyses, each case was assigned the maximal SCS category based on the highest severity ICD‐9 code associated with the stay. Within the SCS, a score of 1 indicates minor illness (eg, diaper dermatitis) and 5 indicates major illness (eg, septic shock). The proportions of visits within categorical SCS scores were compared for Observation Stays, 1‐Day Stays, and longer‐duration Inpatient admissions using chi‐square statistics.
We determined the top 10 ranking diagnoses for which children were admitted from the ED in 2009 using the Diagnosis Grouping System (DGS).18 The DGS was designed specifically to categorize pediatric ED visits into clinically meaningful groups. The ICD‐9 code for the principal discharge diagnosis was used to assign records to 1 of the 77 DGS subgroups. Within each of the top ranking DGS subgroups, we determined the proportion of Observation Stays, 1‐Day Stays, and longer‐duration Inpatient admissions.
To provide clinically relevant outcomes of Observation Stays for common conditions, we selected stays with observation charges from within the top 10 ranking observation stay DGS subgroups in 2009. Outcomes for observation included: 1) immediate outcome of the observation stay (ie, discharge or conversion to inpatient status), 2) return visits to the ED in the 3 days following observation, and 3) readmissions to the hospital in the 3 and 30 days following observation. Bivariate comparisons of return visits and readmissions for Observation versus 1‐Day Stays within DGS subgroups were analyzed using chi‐square tests. Multivariate analyses of return visits and readmissions were conducted using Generalized Estimating Equations adjusting for severity of illness by SCS score and clustering by hospital. To account for local practice patterns, we also adjusted for a grouped treatment variable that included the site level proportion of children admitted to Observation Status, 1‐Day‐Stays, and longer Inpatient admissions. All statistical analyses were performed using SAS (version 9.2, SAS Institute, Inc, Cary, NC); P values <0.05 were considered statistically significant.
RESULTS
Trends in Short‐Stays
An increase in proportion of Observation Stays was mirrored by a decrease in proportion of 1‐Day Stays over the study period (Figure 1). In 2009, there were 1.4 times more Observation Stays than 1‐Day Stays (25,653 vs 18,425) compared with 14,242 and 20,747, respectively, in 2004. This shift toward more Observation Stays occurred as hospitals faced a 16% increase in the total number of admissions from the ED (91,318 to 108,217) and change in CMI from 1.48 to 1.51. Over the study period, roughly 40% of all admissions from the ED were Short‐Stays (Observation and 1‐Day Stays). Median LOS for Observation Status stays was 1 day (interquartile range [IQR]: 11).
Patient Characteristics in 2009
Table 1 presents comparisons between Observation, 1‐Day Stays, and longer‐duration Inpatient admissions. Of potential clinical significance, children under Observation Status were slightly younger (median, 4.0 years; IQR: 1.310.0) when compared with children admitted for 1‐Day Stays (median, 5.0 years; IQR: 1.411.4; P < 0.001) and longer‐duration Inpatient stays (median, 4.7 years; IQR: 0.912.2; P < 0.001). Nearly two‐thirds of Observation Status stays had SCS scores of 3 or lower compared with less than half of 1‐Day Stays and longer‐duration Inpatient admissions.
| Short‐Stays | LOS >1 Day | |||||
|---|---|---|---|---|---|---|
| Observation | 1‐Day Stay | Longer Admission | ||||
| N = 25,653* (24%) | N = 18,425* (17%) | P Value Comparing Observation to 1‐Day Stay | N = 64,139* (59%) | P Value Comparing Short‐Stays to LOS >1 Day | ||
| ||||||
| Sex | Male | 14,586 (57) | 10,474 (57) | P = 0.663 | 34,696 (54) | P < 0.001 |
| Female | 11,000 (43) | 7,940 (43) | 29,403 (46) | |||
| Payer | Government | 13,247 (58) | 8,944 (55) | P < 0.001 | 35,475 (61) | P < 0.001 |
| Private | 7,123 (31) | 5,105 (32) | 16,507 (28) | |||
| Other | 2,443 (11) | 2,087 (13) | 6,157 (11) | |||
| Age | <30 days | 793 (3) | 687 (4) | P < 0.001 | 3,932 (6) | P < 0.001 |
| 30 days1 yr | 4,499 (17) | 2,930 (16) | 13,139 (21) | |||
| 12 yr | 5,793 (23) | 3,566 (19) | 10,229 (16) | |||
| 34 yr | 3,040 (12) | 2,056 (11) | 5,551 (9) | |||
| 512 yr | 7,427 (29) | 5,570 (30) | 17,057 (27) | |||
| 1317 yr | 3,560 (14) | 3,136 (17) | 11,860 (18) | |||
| >17 yr | 541 (2) | 480 (3) | 2,371 (4) | |||
| Race | White | 17,249 (70) | 12,123 (70) | P < 0.001 | 40,779 (67) | P <0.001 |
| Black | 6,298 (25) | 4,216 (25) | 16,855 (28) | |||
| Asian | 277 (1) | 295 (2) | 995 (2) | |||
| Other | 885 (4) | 589 (3) | 2,011 (3) | |||
| SCS | 1 Minor illness | 64 (<1) | 37 (<1) | P < 0.001 | 84 (<1) | P < 0.001 |
| 2 | 1,190 (5) | 658 (4) | 1,461 (2) | |||
| 3 | 14,553 (57) | 7,617 (42) | 20,760 (33) | |||
| 4 | 8,994 (36) | 9,317 (51) | 35,632 (56) | |||
| 5 Major illness | 490 (2) | 579 (3) | 5,689 (9) | |||
In 2009, the top 10 DGS subgroups accounted for half of all admissions from the ED. The majority of admissions for extremity fractures, head trauma, dehydration, and asthma were Short‐Stays, as were roughly 50% of admissions for seizures, appendicitis, and gastroenteritis (Table 2). Respiratory infections and asthma were the top 1 and 2 ranking DGS subgroups for Observation Stays, 1‐Day Stays, and longer‐duration Inpatient admissions. While rank order differed, 9 of the 10 top ranking Observation Stay DGS subgroups were also top ranking DGS subgroups for 1‐Day Stays. Gastroenteritis ranked 10th among Observation Stays and 11th among 1‐Day Stays. Diabetes mellitus ranked 26th among Observation Stays compared with 8th among 1‐Day Stays.
| Short‐Stays | LOS >1 Day | ||
|---|---|---|---|
| % Observation | % 1‐Day Stay | % Longer Admission | |
| |||
| All admissions from the ED | 23.7 | 17.0 | 59.3 |
| n = 108,217 | |||
| Respiratory infections | 22.3 | 15.3 | 62.4 |
| n = 14,455 (13%) | |||
| Asthma | 32.0 | 23.8 | 44.2 |
| n = 8,853 (8%) | |||
| Other GI diseases | 24.1 | 16.2 | 59.7 |
| n = 6,519 (6%) | |||
| Appendicitis | 21.0 | 29.5 | 49.5 |
| n = 4,480 (4%) | |||
| Skin infections | 20.7 | 14.3 | 65.0 |
| n = 4,743 (4%) | |||
| Seizures | 29.5 | 22 | 48.5 |
| n = 4,088 (4%) | |||
| Extremity fractures | 49.4 | 20.5 | 30.1 |
| n = 3,681 (3%) | |||
| Dehydration | 37.8 | 19.0 | 43.2 |
| n = 2,773 (3%) | |||
| Gastroenteritis | 30.3 | 18.7 | 50.9 |
| n = 2,603 (2%) | |||
| Head trauma | 44.1 | 43.9 | 32.0 |
| n = 2,153 (2%) | |||
Average maximum SCS scores were clinically comparable for Observation and 1‐Day Stays and generally lower than for longer‐duration Inpatient admissions within the top 10 most common DGS subgroups. Average maximum SCS scores were statistically lower for Observation Stays compared with 1‐Day Stays for respiratory infections (3.2 vs 3.4), asthma (3.4 vs 3.6), diabetes (3.5 vs 3.8), gastroenteritis (3.0 vs 3.1), other gastrointestinal diseases (3.2 vs 3.4), head trauma (3.3 vs 3.5), and extremity fractures (3.2 vs 3.4) (P < 0.01). There were no differences in SCS scores for skin infections (SCS = 3.0) and appendicitis (SCS = 4.0) when comparing Observation and 1‐Day Stays.
Outcomes for Observation Stays in 2009
Within 6 of the top 10 DGS subgroups for Observation Stays, >75% of patients were discharged home from Observation Status (Table 3). Mean LOS for stays that converted from Observation to Inpatient Status ranged from 2.85 days for extremity fractures to 4.66 days for appendicitis.
| Return to ED in 3 Days n = 421 (1.6%) | Hospital Readmissions in 3 Days n = 247 (1.0%) | Hospital Readmissions in 30 Days n = 819 (3.2%) | ||
|---|---|---|---|---|
| DGS subgroup | % Discharged From Observation | Adjusted* Odds Ratio (95% CI) | Adjusted* Odds Ratio (95% CI) | Adjusted* Odds Ratio (95% CI) |
| ||||
| Respiratory infections | 72 | 1.1 (0.71.8) | 0.8 (0.51.3) | 0.9 (0.71.3) |
| Asthma | 80 | 1.3 (0.63.0) | 1.0 (0.61.8) | 0.5 (0.31.0) |
| Other GI diseases | 74 | 0.8 (0.51.3) | 2.2 (1.33.8) | 1.0 (0.71.5) |
| Appendicitis | 82 | NE | NE | NE |
| Skin infections | 68 | 1.8 (0.84.4) | 1.4 (0.45.3) | 0.9 (0.61.6) |
| Seizures | 79 | 0.8 (0.41.6) | 0.8 (0.31.8) | 0.7 (0.51.0) |
| Extremity fractures | 92 | 0.9 (0.42.1) | 0.2 (01.3) | 1.2 (0.53.2) |
| Dehydration | 81 | 0.9 (0.61.4) | 0.8 (0.31.9) | 0.7 (0.41.1) |
| Gastroenteritis | 74 | 0.9 (0.42.0) | 0.6 (0.41.2) | 0.6 (0.41) |
| Head trauma | 92 | 0.6 (0.21.7) | 0.3 (02.1) | 1.0 (0.42.8) |
Among children with Observation Stays for 1 of the top 10 DGS subgroups, adjusted return ED visit rates were <3% and readmission rates were <1.6% within 3 days following the index stay. Thirty‐day readmission rates were highest following observation for other GI illnesses and seizures. In unadjusted analysis, Observation Stays for asthma, respiratory infections, and skin infections were associated with greater proportions of return ED visits when compared with 1‐Day Stays. Differences were no longer statistically significant after adjusting for SCS score, clustering by hospital, and the grouped treatment variable. Adjusted odds of readmission were significantly higher at 3 days following observation for other GI illnesses and lower at 30 days following observation for seizures when compared with 1‐Day Stays (Table 3).
DISCUSSION
In this first, multicenter longitudinal study of pediatric observation following an ED visit, we found that Observation Status code utilization has increased steadily over the past 6 years and, in 2007, the proportion of children admitted to observation status surpassed the proportion of children experiencing a 1‐day inpatient admission. Taken together, Short‐Stays made up more than 40% of the hospital‐based care delivered to children admitted from an ED. Stable trends in CMI over time suggest that observation status may be replacing inpatient status designated care for pediatric Short‐Stays in these hospitals. Our findings suggest the lines between outpatient observation and short‐stay inpatient care are becoming increasingly blurred. These trends have occurred in the setting of changing policies for hospital reimbursement, requirements for patients to meet criteria to qualify for inpatient admissions, and efforts to avoid stays deemed unnecessary or inappropriate by their brief duration.19 Therefore there is a growing need to understand the impact of children under observation on the structure, delivery, and financing of acute hospital care for children.
Our results also have implications for pediatric health services research that relies on hospital administrative databases that do not contain observation stays. Currently, observation stays are systematically excluded from many inpatient administrative datasets.11, 12 Analyses of datasets that do not account for observation stays likely result in underestimation of hospitalization rates and hospital resource utilization for children. This may be particularly important for high‐volume conditions, such as asthma and acute infections, for which children commonly require brief periods of hospital‐based care beyond an ED encounter. Data from pediatric observation status admissions should be consistently included in hospital administrative datasets to allow for more comprehensive analyses of hospital resource utilization among children.
Prior research has shown that the diagnoses commonly treated in pediatric observation units overlap with the diagnoses for which children experience 1‐Day Stays.1, 20 We found a similar pattern of conditions for which children were under Observation Status and 1‐Day Stays with comparable severity of illness between the groups in terms of SCS scores. Our findings imply a need to determine how and why hospitals differentiate Observation Status from 1‐Day‐Stay groups in order to improve the assignment of observation status. Assuming continued pressures from payers to provide more care in outpatient or observation settings, there is potential for expansion of dedicated observation services for children in the US. Without designated observation units or processes to group patients with lower severity conditions, there may be limited opportunities to realize more efficient hospital care simply through the application of the label of observation status.
For more than 30 years, observation services have been provided to children who require a period of monitoring to determine their response to therapy and the need for acute inpatient admission from the ED.21While we were not able to determine the location of care for observation status patients in this study, we know that few children's hospitals have dedicated observation units and, even when an observation unit is present, not all observation status patients are cared for in dedicated observation units.9 This, in essence, means that most children under observation status are cared for in virtual observation by inpatient teams using inpatient beds. If observation patients are treated in inpatient beds and consume the same resources as inpatients, then cost‐savings based on reimbursement contracts with payers may not reflect an actual reduction in services. Pediatric institutions will need to closely monitor the financial implications of observation status given the historical differences in payment for observation and inpatient care.
With more than 70% of children being discharged home following observation, our results are comparable to the published literature2, 5, 6, 22, 23 and guidelines for observation unit operations.24 Similar to prior studies,4, 15, 2530 our results also indicate that return visits and readmissions following observation are uncommon events. Our findings can serve as initial benchmarks for condition‐specific outcomes for pediatric observation care. Studies are needed both to identify the clinical characteristics predictive of successful discharge home from observation and to explore the hospital‐to‐hospital variability in outcomes for observation. Such studies are necessary to identify the most successful healthcare delivery models for pediatric observation stays.
LIMITATIONS
The primary limitation to our results is that data from a subset of freestanding children's hospitals may not reflect observation stays at other children's hospitals or the community hospitals that care for children across the US. Only 18 of 42 current PHIS member hospitals have provided both outpatient visit and inpatient stay data for each year of the study period and were considered eligible. In an effort to ensure the quality of observation stay data, we included the 16 hospitals that assigned observation charges to at least 90% of their observation status stays in the PHIS database. The exclusion of the 2 hospitals where <90% of observation status patients were assigned observation charges likely resulted in an underestimation of the utilization of observation status.
Second, there is potential for misclassification of patient type given institutional variations in the assignment of patient status. The PHIS database does not contain information about the factors that were considered in the assignment of observation status. At the time of admission from the ED, observation or inpatient status is assigned. While this decision is clearly reserved for the admitting physician, the process is not standardized across hospitals.9 Some institutions have Utilization Managers on site to help guide decision‐making, while others allow the assignment to be made by physicians without specific guidance. As a result, some patients may be assigned to observation status at admission and reassigned to inpatient status following Utilization Review, which may bias our results toward overestimation of the number of observation stays that converted to inpatient status.
The third limitation to our results relates to return visits. An accurate assessment of return visits is subject to the patient returning to the same hospital. If children do not return to the same hospital, our results would underestimate return visits and readmissions. In addition, we did not assess the reason for return visit as there was no way to verify if the return visit was truly related to the index visit without detailed chart review. Assuming children return to the same hospital for different reasons, our results would overestimate return visits associated with observation stays. We suspect that many 3‐day return visits result from the progression of acute illness or failure to respond to initial treatment, and 30‐day readmissions reflect recurrent hospital care needs related to chronic illnesses.
Lastly, severity classification is difficult when analyzing administrative datasets without physiologic patient data, and the SCS may not provide enough detail to reveal clinically important differences between patient groups.
CONCLUSIONS
Short‐stay hospitalizations following ED visits are common among children, and the majority of pediatric short‐stays are under observation status. Analyses of inpatient administrative databases that exclude observation stays likely result in an underestimation of hospital resource utilization for children. Efforts are needed to ensure that patients under observation status are accounted for in hospital administrative datasets used for pediatric health services research, and healthcare resource allocation, as it relates to hospital‐based care. While the clinical outcomes for observation patients appear favorable in terms of conversion to inpatient admissions and return visits, the financial implications of observation status care within children's hospitals are currently unknown.
In recent decades, hospital lengths of stay have decreased and there has been a shift toward outpatient management for many pediatric conditions. In 2003, one‐third of all children admitted to US hospitals experienced 1‐day inpatient stays, an increase from 19% in 1993.1 Some hospitals have developed dedicated observation units for the care of children, with select diagnoses, who are expected to respond to less than 24 hours of treatment.26 Expansion of observation services has been suggested as an approach to lessen emergency department (ED) crowding7 and alleviate high‐capacity conditions within hospital inpatient units.8
In contrast to care delivered in a dedicated observation unit, observation status is an administrative label applied to patients who do not meet inpatient criteria as defined by third parties such as InterQual. While the decision to admit a patient is ultimately at the discretion of the ordering physician, many hospitals use predetermined criteria to assign observation status to patients admitted to observation and inpatient units.9 Treatment provided under observation status is designated by hospitals and payers as outpatient care, even when delivered in an inpatient bed.10 As outpatient‐designated care, observation cases do not enter publicly available administrative datasets of hospital discharges that have traditionally been used to understand hospital resource utilization, including the National Hospital Discharge Survey and the Kid's Inpatient Database.11, 12
We hypothesize that there has been an increase in observation status care delivered to children in recent years, and that the majority of children under observation were discharged home without converting to inpatient status. To determine trends in pediatric observation status care, we conducted the first longitudinal, multicenter evaluation of observation status code utilization following ED treatment in a sample of US freestanding children's hospitals. In addition, we focused on the most recent year of data among top ranking diagnoses to assess the current state of observation status stay outcomes (including conversion to inpatient status and return visits).
METHODS
Data Source
Data for this multicenter retrospective cohort study were obtained from the Pediatric Health Information System (PHIS). Freestanding children's hospital's participating in PHIS account for approximately 20% of all US tertiary care children's hospitals. The PHIS hospitals provide resource utilization data including patient demographics, International Classification of Diseases, Ninth Revision (ICD‐9) diagnosis and procedure codes, and charges applied to each stay, including room and nursing charges. Data were de‐identified prior to inclusion in the database, however encrypted identification numbers allowed for tracking individual patients across admissions. Data quality and reliability were assured through a joint effort between the Child Health Corporation of America (CHCA; Shawnee Mission, KS) and participating hospitals as described previously.13, 14 In accordance with the Common Rule (45 CFR 46.102(f)) and the policies of The Children's Hospital of Philadelphia Institutional Review Board, this research, using a de‐identified dataset, was considered exempt from review.
Hospital Selection
Each year from 2004 to 2009, there were 18 hospitals participating in PHIS that reported data from both inpatient discharges and outpatient visits (including observation status discharges). To assess data quality for observation status stays, we evaluated observation status discharges for the presence of associated observation billing codes applied to charge records reported to PHIS including: 1) observation per hour, 2) ED observation time, or 3) other codes mentioning observation in the hospital charge master description document. The 16 hospitals with observation charges assigned to at least 90% of observation status discharges in each study year were selected for analysis.
Visit Identification
Within the 16 study hospitals, we identified all visits between January 1, 2004 and December 31, 2009 with ED facility charges. From these ED visits, we included any stays designated by the hospital as observation or inpatient status, excluding transfers and ED discharges.
Variable Definitions
Hospitals submitting records to PHIS assigned a single patient type to the episode of care. The Observation patient type was assigned to patients discharged from observation status. Although the duration of observation is often less than 24 hours, hospitals may allow a patient to remain under observation for longer durations.15, 16 Duration of stay is not defined precisely enough within PHIS to determine hours of inpatient care. Therefore, length of stay (LOS) was not used to determine observation status stays.
The Inpatient patient type was assigned to patients who were discharged from inpatient status, including those patients admitted to inpatient care from the ED and also those who converted to inpatient status from observation. Patients who converted from observation status to inpatient status during the episode of care could be identified through the presence of observation charge codes as described above.
Given the potential for differences in the application of observation status, we also identified 1‐Day Stays where discharge occurred on the day of, or the day following, an inpatient status admission. These 1‐Day Stays represent hospitalizations that may, by their duration, be suitable for care in an observation unit. We considered discharges in the Observation and 1‐Day Stay categories to be Short‐Stays.
DATA ANALYSIS
For each of the 6 years of study, we calculated the following proportions to determine trends over time: 1) the number of Observation Status admissions from the ED as a proportion of the total number of ED visits resulting in Observation or Inpatient admission, and 2) the number of 1‐Day Stays admitted from the ED as a proportion of the total number of ED visits resulting in Observation or Inpatient admissions. Trends were analyzed using linear regression. Trends were also calculated for the total volume of admissions from the ED and the case‐mix index (CMI). CMI was assessed to evaluate for changes in the severity of illness for children admitted from the ED over the study period. Each hospital's CMI was calculated as an average of their Observation and Inpatient Status discharges' charge weights during the study period. Charge weights were calculated at the All Patient Refined Diagnosis Related Groups (APR‐DRG)/severity of illness level (3M Health Information Systems, St Paul, MN) and were normalized national average charges derived by Thomson‐Reuters from their Pediatric Projected National Database. Weights were then assigned to each discharge based on the discharge's APR‐DRG and severity level assignment.
To assess the current outcomes for observation, we analyzed stays with associated observation billing codes from the most recent year of available data (2009). Stays with Observation patient type were considered to have been discharged from observation, while those with an Inpatient Status patient type were considered to have converted to an inpatient admission during the observation period.
Using the 2009 data, we calculated descriptive statistics for patient characteristics (eg, age, gender, payer) comparing Observation Stays, 1‐Day Stays, and longer‐duration Inpatient admissions using chi‐square statistics. Age was categorized using the American Academy of Pediatrics groupings: <30 days, 30 days1 year, 12 years, 34 years, 512 years, 1317 years, >18 years. Designated payer was categorized into government, private, and other, including self‐pay and uninsured groups.
We used the Severity Classification Systems (SCS) developed for pediatric emergency care to estimate severity of illness for the visit.17 In this 5‐level system, each ICD‐9 diagnosis code is associated with a score related to the intensity of ED resources needed to care for a child with that diagnosis. In our analyses, each case was assigned the maximal SCS category based on the highest severity ICD‐9 code associated with the stay. Within the SCS, a score of 1 indicates minor illness (eg, diaper dermatitis) and 5 indicates major illness (eg, septic shock). The proportions of visits within categorical SCS scores were compared for Observation Stays, 1‐Day Stays, and longer‐duration Inpatient admissions using chi‐square statistics.
We determined the top 10 ranking diagnoses for which children were admitted from the ED in 2009 using the Diagnosis Grouping System (DGS).18 The DGS was designed specifically to categorize pediatric ED visits into clinically meaningful groups. The ICD‐9 code for the principal discharge diagnosis was used to assign records to 1 of the 77 DGS subgroups. Within each of the top ranking DGS subgroups, we determined the proportion of Observation Stays, 1‐Day Stays, and longer‐duration Inpatient admissions.
To provide clinically relevant outcomes of Observation Stays for common conditions, we selected stays with observation charges from within the top 10 ranking observation stay DGS subgroups in 2009. Outcomes for observation included: 1) immediate outcome of the observation stay (ie, discharge or conversion to inpatient status), 2) return visits to the ED in the 3 days following observation, and 3) readmissions to the hospital in the 3 and 30 days following observation. Bivariate comparisons of return visits and readmissions for Observation versus 1‐Day Stays within DGS subgroups were analyzed using chi‐square tests. Multivariate analyses of return visits and readmissions were conducted using Generalized Estimating Equations adjusting for severity of illness by SCS score and clustering by hospital. To account for local practice patterns, we also adjusted for a grouped treatment variable that included the site level proportion of children admitted to Observation Status, 1‐Day‐Stays, and longer Inpatient admissions. All statistical analyses were performed using SAS (version 9.2, SAS Institute, Inc, Cary, NC); P values <0.05 were considered statistically significant.
RESULTS
Trends in Short‐Stays
An increase in proportion of Observation Stays was mirrored by a decrease in proportion of 1‐Day Stays over the study period (Figure 1). In 2009, there were 1.4 times more Observation Stays than 1‐Day Stays (25,653 vs 18,425) compared with 14,242 and 20,747, respectively, in 2004. This shift toward more Observation Stays occurred as hospitals faced a 16% increase in the total number of admissions from the ED (91,318 to 108,217) and change in CMI from 1.48 to 1.51. Over the study period, roughly 40% of all admissions from the ED were Short‐Stays (Observation and 1‐Day Stays). Median LOS for Observation Status stays was 1 day (interquartile range [IQR]: 11).
Patient Characteristics in 2009
Table 1 presents comparisons between Observation, 1‐Day Stays, and longer‐duration Inpatient admissions. Of potential clinical significance, children under Observation Status were slightly younger (median, 4.0 years; IQR: 1.310.0) when compared with children admitted for 1‐Day Stays (median, 5.0 years; IQR: 1.411.4; P < 0.001) and longer‐duration Inpatient stays (median, 4.7 years; IQR: 0.912.2; P < 0.001). Nearly two‐thirds of Observation Status stays had SCS scores of 3 or lower compared with less than half of 1‐Day Stays and longer‐duration Inpatient admissions.
| Short‐Stays | LOS >1 Day | |||||
|---|---|---|---|---|---|---|
| Observation | 1‐Day Stay | Longer Admission | ||||
| N = 25,653* (24%) | N = 18,425* (17%) | P Value Comparing Observation to 1‐Day Stay | N = 64,139* (59%) | P Value Comparing Short‐Stays to LOS >1 Day | ||
| ||||||
| Sex | Male | 14,586 (57) | 10,474 (57) | P = 0.663 | 34,696 (54) | P < 0.001 |
| Female | 11,000 (43) | 7,940 (43) | 29,403 (46) | |||
| Payer | Government | 13,247 (58) | 8,944 (55) | P < 0.001 | 35,475 (61) | P < 0.001 |
| Private | 7,123 (31) | 5,105 (32) | 16,507 (28) | |||
| Other | 2,443 (11) | 2,087 (13) | 6,157 (11) | |||
| Age | <30 days | 793 (3) | 687 (4) | P < 0.001 | 3,932 (6) | P < 0.001 |
| 30 days1 yr | 4,499 (17) | 2,930 (16) | 13,139 (21) | |||
| 12 yr | 5,793 (23) | 3,566 (19) | 10,229 (16) | |||
| 34 yr | 3,040 (12) | 2,056 (11) | 5,551 (9) | |||
| 512 yr | 7,427 (29) | 5,570 (30) | 17,057 (27) | |||
| 1317 yr | 3,560 (14) | 3,136 (17) | 11,860 (18) | |||
| >17 yr | 541 (2) | 480 (3) | 2,371 (4) | |||
| Race | White | 17,249 (70) | 12,123 (70) | P < 0.001 | 40,779 (67) | P <0.001 |
| Black | 6,298 (25) | 4,216 (25) | 16,855 (28) | |||
| Asian | 277 (1) | 295 (2) | 995 (2) | |||
| Other | 885 (4) | 589 (3) | 2,011 (3) | |||
| SCS | 1 Minor illness | 64 (<1) | 37 (<1) | P < 0.001 | 84 (<1) | P < 0.001 |
| 2 | 1,190 (5) | 658 (4) | 1,461 (2) | |||
| 3 | 14,553 (57) | 7,617 (42) | 20,760 (33) | |||
| 4 | 8,994 (36) | 9,317 (51) | 35,632 (56) | |||
| 5 Major illness | 490 (2) | 579 (3) | 5,689 (9) | |||
In 2009, the top 10 DGS subgroups accounted for half of all admissions from the ED. The majority of admissions for extremity fractures, head trauma, dehydration, and asthma were Short‐Stays, as were roughly 50% of admissions for seizures, appendicitis, and gastroenteritis (Table 2). Respiratory infections and asthma were the top 1 and 2 ranking DGS subgroups for Observation Stays, 1‐Day Stays, and longer‐duration Inpatient admissions. While rank order differed, 9 of the 10 top ranking Observation Stay DGS subgroups were also top ranking DGS subgroups for 1‐Day Stays. Gastroenteritis ranked 10th among Observation Stays and 11th among 1‐Day Stays. Diabetes mellitus ranked 26th among Observation Stays compared with 8th among 1‐Day Stays.
| Short‐Stays | LOS >1 Day | ||
|---|---|---|---|
| % Observation | % 1‐Day Stay | % Longer Admission | |
| |||
| All admissions from the ED | 23.7 | 17.0 | 59.3 |
| n = 108,217 | |||
| Respiratory infections | 22.3 | 15.3 | 62.4 |
| n = 14,455 (13%) | |||
| Asthma | 32.0 | 23.8 | 44.2 |
| n = 8,853 (8%) | |||
| Other GI diseases | 24.1 | 16.2 | 59.7 |
| n = 6,519 (6%) | |||
| Appendicitis | 21.0 | 29.5 | 49.5 |
| n = 4,480 (4%) | |||
| Skin infections | 20.7 | 14.3 | 65.0 |
| n = 4,743 (4%) | |||
| Seizures | 29.5 | 22 | 48.5 |
| n = 4,088 (4%) | |||
| Extremity fractures | 49.4 | 20.5 | 30.1 |
| n = 3,681 (3%) | |||
| Dehydration | 37.8 | 19.0 | 43.2 |
| n = 2,773 (3%) | |||
| Gastroenteritis | 30.3 | 18.7 | 50.9 |
| n = 2,603 (2%) | |||
| Head trauma | 44.1 | 43.9 | 32.0 |
| n = 2,153 (2%) | |||
Average maximum SCS scores were clinically comparable for Observation and 1‐Day Stays and generally lower than for longer‐duration Inpatient admissions within the top 10 most common DGS subgroups. Average maximum SCS scores were statistically lower for Observation Stays compared with 1‐Day Stays for respiratory infections (3.2 vs 3.4), asthma (3.4 vs 3.6), diabetes (3.5 vs 3.8), gastroenteritis (3.0 vs 3.1), other gastrointestinal diseases (3.2 vs 3.4), head trauma (3.3 vs 3.5), and extremity fractures (3.2 vs 3.4) (P < 0.01). There were no differences in SCS scores for skin infections (SCS = 3.0) and appendicitis (SCS = 4.0) when comparing Observation and 1‐Day Stays.
Outcomes for Observation Stays in 2009
Within 6 of the top 10 DGS subgroups for Observation Stays, >75% of patients were discharged home from Observation Status (Table 3). Mean LOS for stays that converted from Observation to Inpatient Status ranged from 2.85 days for extremity fractures to 4.66 days for appendicitis.
| Return to ED in 3 Days n = 421 (1.6%) | Hospital Readmissions in 3 Days n = 247 (1.0%) | Hospital Readmissions in 30 Days n = 819 (3.2%) | ||
|---|---|---|---|---|
| DGS subgroup | % Discharged From Observation | Adjusted* Odds Ratio (95% CI) | Adjusted* Odds Ratio (95% CI) | Adjusted* Odds Ratio (95% CI) |
| ||||
| Respiratory infections | 72 | 1.1 (0.71.8) | 0.8 (0.51.3) | 0.9 (0.71.3) |
| Asthma | 80 | 1.3 (0.63.0) | 1.0 (0.61.8) | 0.5 (0.31.0) |
| Other GI diseases | 74 | 0.8 (0.51.3) | 2.2 (1.33.8) | 1.0 (0.71.5) |
| Appendicitis | 82 | NE | NE | NE |
| Skin infections | 68 | 1.8 (0.84.4) | 1.4 (0.45.3) | 0.9 (0.61.6) |
| Seizures | 79 | 0.8 (0.41.6) | 0.8 (0.31.8) | 0.7 (0.51.0) |
| Extremity fractures | 92 | 0.9 (0.42.1) | 0.2 (01.3) | 1.2 (0.53.2) |
| Dehydration | 81 | 0.9 (0.61.4) | 0.8 (0.31.9) | 0.7 (0.41.1) |
| Gastroenteritis | 74 | 0.9 (0.42.0) | 0.6 (0.41.2) | 0.6 (0.41) |
| Head trauma | 92 | 0.6 (0.21.7) | 0.3 (02.1) | 1.0 (0.42.8) |
Among children with Observation Stays for 1 of the top 10 DGS subgroups, adjusted return ED visit rates were <3% and readmission rates were <1.6% within 3 days following the index stay. Thirty‐day readmission rates were highest following observation for other GI illnesses and seizures. In unadjusted analysis, Observation Stays for asthma, respiratory infections, and skin infections were associated with greater proportions of return ED visits when compared with 1‐Day Stays. Differences were no longer statistically significant after adjusting for SCS score, clustering by hospital, and the grouped treatment variable. Adjusted odds of readmission were significantly higher at 3 days following observation for other GI illnesses and lower at 30 days following observation for seizures when compared with 1‐Day Stays (Table 3).
DISCUSSION
In this first, multicenter longitudinal study of pediatric observation following an ED visit, we found that Observation Status code utilization has increased steadily over the past 6 years and, in 2007, the proportion of children admitted to observation status surpassed the proportion of children experiencing a 1‐day inpatient admission. Taken together, Short‐Stays made up more than 40% of the hospital‐based care delivered to children admitted from an ED. Stable trends in CMI over time suggest that observation status may be replacing inpatient status designated care for pediatric Short‐Stays in these hospitals. Our findings suggest the lines between outpatient observation and short‐stay inpatient care are becoming increasingly blurred. These trends have occurred in the setting of changing policies for hospital reimbursement, requirements for patients to meet criteria to qualify for inpatient admissions, and efforts to avoid stays deemed unnecessary or inappropriate by their brief duration.19 Therefore there is a growing need to understand the impact of children under observation on the structure, delivery, and financing of acute hospital care for children.
Our results also have implications for pediatric health services research that relies on hospital administrative databases that do not contain observation stays. Currently, observation stays are systematically excluded from many inpatient administrative datasets.11, 12 Analyses of datasets that do not account for observation stays likely result in underestimation of hospitalization rates and hospital resource utilization for children. This may be particularly important for high‐volume conditions, such as asthma and acute infections, for which children commonly require brief periods of hospital‐based care beyond an ED encounter. Data from pediatric observation status admissions should be consistently included in hospital administrative datasets to allow for more comprehensive analyses of hospital resource utilization among children.
Prior research has shown that the diagnoses commonly treated in pediatric observation units overlap with the diagnoses for which children experience 1‐Day Stays.1, 20 We found a similar pattern of conditions for which children were under Observation Status and 1‐Day Stays with comparable severity of illness between the groups in terms of SCS scores. Our findings imply a need to determine how and why hospitals differentiate Observation Status from 1‐Day‐Stay groups in order to improve the assignment of observation status. Assuming continued pressures from payers to provide more care in outpatient or observation settings, there is potential for expansion of dedicated observation services for children in the US. Without designated observation units or processes to group patients with lower severity conditions, there may be limited opportunities to realize more efficient hospital care simply through the application of the label of observation status.
For more than 30 years, observation services have been provided to children who require a period of monitoring to determine their response to therapy and the need for acute inpatient admission from the ED.21While we were not able to determine the location of care for observation status patients in this study, we know that few children's hospitals have dedicated observation units and, even when an observation unit is present, not all observation status patients are cared for in dedicated observation units.9 This, in essence, means that most children under observation status are cared for in virtual observation by inpatient teams using inpatient beds. If observation patients are treated in inpatient beds and consume the same resources as inpatients, then cost‐savings based on reimbursement contracts with payers may not reflect an actual reduction in services. Pediatric institutions will need to closely monitor the financial implications of observation status given the historical differences in payment for observation and inpatient care.
With more than 70% of children being discharged home following observation, our results are comparable to the published literature2, 5, 6, 22, 23 and guidelines for observation unit operations.24 Similar to prior studies,4, 15, 2530 our results also indicate that return visits and readmissions following observation are uncommon events. Our findings can serve as initial benchmarks for condition‐specific outcomes for pediatric observation care. Studies are needed both to identify the clinical characteristics predictive of successful discharge home from observation and to explore the hospital‐to‐hospital variability in outcomes for observation. Such studies are necessary to identify the most successful healthcare delivery models for pediatric observation stays.
LIMITATIONS
The primary limitation to our results is that data from a subset of freestanding children's hospitals may not reflect observation stays at other children's hospitals or the community hospitals that care for children across the US. Only 18 of 42 current PHIS member hospitals have provided both outpatient visit and inpatient stay data for each year of the study period and were considered eligible. In an effort to ensure the quality of observation stay data, we included the 16 hospitals that assigned observation charges to at least 90% of their observation status stays in the PHIS database. The exclusion of the 2 hospitals where <90% of observation status patients were assigned observation charges likely resulted in an underestimation of the utilization of observation status.
Second, there is potential for misclassification of patient type given institutional variations in the assignment of patient status. The PHIS database does not contain information about the factors that were considered in the assignment of observation status. At the time of admission from the ED, observation or inpatient status is assigned. While this decision is clearly reserved for the admitting physician, the process is not standardized across hospitals.9 Some institutions have Utilization Managers on site to help guide decision‐making, while others allow the assignment to be made by physicians without specific guidance. As a result, some patients may be assigned to observation status at admission and reassigned to inpatient status following Utilization Review, which may bias our results toward overestimation of the number of observation stays that converted to inpatient status.
The third limitation to our results relates to return visits. An accurate assessment of return visits is subject to the patient returning to the same hospital. If children do not return to the same hospital, our results would underestimate return visits and readmissions. In addition, we did not assess the reason for return visit as there was no way to verify if the return visit was truly related to the index visit without detailed chart review. Assuming children return to the same hospital for different reasons, our results would overestimate return visits associated with observation stays. We suspect that many 3‐day return visits result from the progression of acute illness or failure to respond to initial treatment, and 30‐day readmissions reflect recurrent hospital care needs related to chronic illnesses.
Lastly, severity classification is difficult when analyzing administrative datasets without physiologic patient data, and the SCS may not provide enough detail to reveal clinically important differences between patient groups.
CONCLUSIONS
Short‐stay hospitalizations following ED visits are common among children, and the majority of pediatric short‐stays are under observation status. Analyses of inpatient administrative databases that exclude observation stays likely result in an underestimation of hospital resource utilization for children. Efforts are needed to ensure that patients under observation status are accounted for in hospital administrative datasets used for pediatric health services research, and healthcare resource allocation, as it relates to hospital‐based care. While the clinical outcomes for observation patients appear favorable in terms of conversion to inpatient admissions and return visits, the financial implications of observation status care within children's hospitals are currently unknown.
- ,,,,,.Trends in high‐turnover stays among children hospitalized in the United States, 1993–2003.Pediatrics.2009;123(3):996–1002.
- ,,,,.Utilization and unexpected hospitalization rates of a pediatric emergency department 23‐hour observation unit.Pediatr Emerg Care.2008;24(9):589–594.
- ,,.When the patient requires observation not hospitalization.J Nurs Admin.1988;18(10):20–23.
- ,,,.Pediatric observation status beds on an inpatient unit: an integrated care model.Pediatr Emerg Care.2004;20(1):17–21.
- ,,.Use of an observation unit by a pediatric emergency department for common pediatric illnesses.Pediatr Emerg Care.2001;17(5):321–323.
- ,,.The pediatric hybrid observation unit: an analysis of 6477 consecutive patient encounters.Pediatrics.2005;115(5):e535–e542.
- ACEP. Emergency Department Crowding: High‐Impact Solutions. Task Force Report on Boarding.2008. Available at: http://www.acep.org/WorkArea/downloadasset.aspx?id=37960. Accessed July 21, 2010.
- ,,, et al.Children's hospitals do not acutely respond to high occupancy.Pediatrics.2010;125(5):974–981.
- ,,, et al.Differences in observation care practices in US freestanding children's hospitals: are they virtual or real?J Hosp Med.2011. Available at: http://www.cms.gov/transmittals/downloads/R770HO.pdf. Accessed January 10, 2011.
- CMS.Medicare Hospital Manual, Section 455.Department of Health and Human Services, Centers for Medicare and Medicaid Services;2001. Available at: http://www.hcup‐us.ahrq.gov/reports/methods/FinalReportonObservationStatus_v2Final.pdf. Accessed on May 3, 2007.
- HCUP.Methods Series Report #2002–3. Observation Status Related to U.S. Hospital Records. Healthcare Cost and Utilization Project.Rockville, MD:Agency for Healthcare Research and Quality;2002.
- ,.Design and operation of the National Hospital Discharge Survey: 1988 redesign.Vital Health Stat.2000;1(39):1–43.
- ,,,.Corticosteroids and mortality in children with bacterial meningitis.JAMA.2008;299(17):2048–2055.
- ,,,,.Intravenous immunoglobulin in children with streptococcal toxic shock syndrome.Clin Infect Dis.2009;49(9):1369–1376.
- ,,,.Impact of a short stay unit on asthma patients admitted to a tertiary pediatric hospital.Qual Manag Health Care.1997;6(1):14–22.
- ,,.An observation unit in a pediatric emergency department: one children's hospital's experience.J Emerg Nurs.2002;28(5):407–413.
- ,,,.Developing a diagnosis‐based severity classification system for use in emergency medical systems for children. Pediatric Academic Societies' Annual Meeting, Platform Presentation; Toronto, Canada;2007.
- ,,,,.A new diagnosis grouping system for child emergency department visits.Acad Emerg Med.2010;17(2):204–213.
- .Observation medicine: the healthcare system's tincture of time. In: Graff LG, ed.Principles of Observation Medicine.American College of Emergency Physicians;2010. Available at: http://www. acep.org/content.aspx?id=46142. Accessed February 18, 2011.
- ,,,,.High turnover stays for pediatric asthma in the United States: analysis of the 2006 Kids' Inpatient Database.Med Care.2010;48(9):827–833.
- ,,,,.Pediatric observation units in the United States: a systematic review.J Hosp Med.2010;5(3):172–182.
- ,.Observation unit in childrens hospital—adjunct to delivery and teaching of ambulatory pediatric care.N Y State J Med.1980;80(11):1684–1686.
- ,,.Short stay in an outpatient department. An alternative to hospitalization.Am J Dis Child.1972;123(2):128–132.
- ACEP.Practice Management Committee, American College of Emergency Physicians. Management of Observation Units.Irving, TX:American College of Emergency Physicians;1994.
- ,,,,.Return visits to a pediatric emergency department.Pediatr Emerg Care.2004;20(3):166–171.
- ,.Postreduction management of intussusception in a children's hospital emergency department.Pediatrics.2003;112(6 pt 1):1302–1307.
- ,,,,.Pediatric closed head injuries treated in an observation unit.Pediatr Emerg Care.2005;21(10):639–644.
- ,,,.Use of pediatric observation unit for treatment of children with dehydration caused by gastroenteritis.Pediatr Emerg Care.2006;22(1):1–6.
- ,,,.Children with asthma admitted to a pediatric observation unit.Pediatr Emerg Care.2005;21(10):645–649.
- ,,, et al.How well can hospital readmission be predicted in a cohort of hospitalized children? A retrospective, multicenter study.Pediatrics.2009;123(1):286–293.
- ,,,,,.Trends in high‐turnover stays among children hospitalized in the United States, 1993–2003.Pediatrics.2009;123(3):996–1002.
- ,,,,.Utilization and unexpected hospitalization rates of a pediatric emergency department 23‐hour observation unit.Pediatr Emerg Care.2008;24(9):589–594.
- ,,.When the patient requires observation not hospitalization.J Nurs Admin.1988;18(10):20–23.
- ,,,.Pediatric observation status beds on an inpatient unit: an integrated care model.Pediatr Emerg Care.2004;20(1):17–21.
- ,,.Use of an observation unit by a pediatric emergency department for common pediatric illnesses.Pediatr Emerg Care.2001;17(5):321–323.
- ,,.The pediatric hybrid observation unit: an analysis of 6477 consecutive patient encounters.Pediatrics.2005;115(5):e535–e542.
- ACEP. Emergency Department Crowding: High‐Impact Solutions. Task Force Report on Boarding.2008. Available at: http://www.acep.org/WorkArea/downloadasset.aspx?id=37960. Accessed July 21, 2010.
- ,,, et al.Children's hospitals do not acutely respond to high occupancy.Pediatrics.2010;125(5):974–981.
- ,,, et al.Differences in observation care practices in US freestanding children's hospitals: are they virtual or real?J Hosp Med.2011. Available at: http://www.cms.gov/transmittals/downloads/R770HO.pdf. Accessed January 10, 2011.
- CMS.Medicare Hospital Manual, Section 455.Department of Health and Human Services, Centers for Medicare and Medicaid Services;2001. Available at: http://www.hcup‐us.ahrq.gov/reports/methods/FinalReportonObservationStatus_v2Final.pdf. Accessed on May 3, 2007.
- HCUP.Methods Series Report #2002–3. Observation Status Related to U.S. Hospital Records. Healthcare Cost and Utilization Project.Rockville, MD:Agency for Healthcare Research and Quality;2002.
- ,.Design and operation of the National Hospital Discharge Survey: 1988 redesign.Vital Health Stat.2000;1(39):1–43.
- ,,,.Corticosteroids and mortality in children with bacterial meningitis.JAMA.2008;299(17):2048–2055.
- ,,,,.Intravenous immunoglobulin in children with streptococcal toxic shock syndrome.Clin Infect Dis.2009;49(9):1369–1376.
- ,,,.Impact of a short stay unit on asthma patients admitted to a tertiary pediatric hospital.Qual Manag Health Care.1997;6(1):14–22.
- ,,.An observation unit in a pediatric emergency department: one children's hospital's experience.J Emerg Nurs.2002;28(5):407–413.
- ,,,.Developing a diagnosis‐based severity classification system for use in emergency medical systems for children. Pediatric Academic Societies' Annual Meeting, Platform Presentation; Toronto, Canada;2007.
- ,,,,.A new diagnosis grouping system for child emergency department visits.Acad Emerg Med.2010;17(2):204–213.
- .Observation medicine: the healthcare system's tincture of time. In: Graff LG, ed.Principles of Observation Medicine.American College of Emergency Physicians;2010. Available at: http://www. acep.org/content.aspx?id=46142. Accessed February 18, 2011.
- ,,,,.High turnover stays for pediatric asthma in the United States: analysis of the 2006 Kids' Inpatient Database.Med Care.2010;48(9):827–833.
- ,,,,.Pediatric observation units in the United States: a systematic review.J Hosp Med.2010;5(3):172–182.
- ,.Observation unit in childrens hospital—adjunct to delivery and teaching of ambulatory pediatric care.N Y State J Med.1980;80(11):1684–1686.
- ,,.Short stay in an outpatient department. An alternative to hospitalization.Am J Dis Child.1972;123(2):128–132.
- ACEP.Practice Management Committee, American College of Emergency Physicians. Management of Observation Units.Irving, TX:American College of Emergency Physicians;1994.
- ,,,,.Return visits to a pediatric emergency department.Pediatr Emerg Care.2004;20(3):166–171.
- ,.Postreduction management of intussusception in a children's hospital emergency department.Pediatrics.2003;112(6 pt 1):1302–1307.
- ,,,,.Pediatric closed head injuries treated in an observation unit.Pediatr Emerg Care.2005;21(10):639–644.
- ,,,.Use of pediatric observation unit for treatment of children with dehydration caused by gastroenteritis.Pediatr Emerg Care.2006;22(1):1–6.
- ,,,.Children with asthma admitted to a pediatric observation unit.Pediatr Emerg Care.2005;21(10):645–649.
- ,,, et al.How well can hospital readmission be predicted in a cohort of hospitalized children? A retrospective, multicenter study.Pediatrics.2009;123(1):286–293.
Copyright © 2012 Society of Hospital Medicine
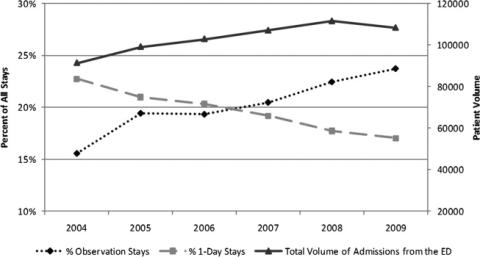
Fall Prevention Strategies
Inpatient falls are the most common type of inpatient adverse event,1 persist as a significant problem nationally, and result in patient injury, increased length of stay, healthcare costs, and litigation.27 Inpatient falls remain a main focus of patient safety and a measure of quality in this era of healthcare reform and quality improvement.8 Inpatient fall rates per 1000 patient‐days range from 1.4 to 18.2.4, 9 The absolute percentage of inpatients that fall ranges from 1.3% to 7%.4, 5, 9, 10 Of inpatient falls, almost all data suggest that roughly one‐third result in some type of injury while 3%‐8% result in serious injury or death.9, 1113
Fall prevention interventions have largely been aimed at modifiable risk factors such as getting out of bed with bed alarms, toileting needs with bedside commodes, and reducing delirium through reorientation techniques. There have been several attempts at decreasing fall rates in hospitals surrounding a multidisciplinary, team‐based approach. Two Cochrane reviews and 2 meta‐analyses have partially examined this issue with mixed results.1417 However, none of these reviews focused on the acute care inpatient population. In fact, the majority of the data analyzed for inpatients was from rehabilitation wards and long‐term care wards. Additionally, there exists almost no data examining fall prevention with single interventions in the acute inpatient population, likely due to the belief that falls are multifactorial in etiology and require more comprehensive interventions.
The aim of this article is to determine the impact of team‐based, multidisciplinary quality improvement efforts to reduce inpatient falls in acute care inpatient hospitals and identify key features that determine their effectiveness.
METHODS
Data Sources and Searches
A search of MEDLINE, CINAHL, EMBASE, and the Cochrane Library was done using the medical subject heading (MeSH) terms accidental falls, accident prevention, inpatients, and prevention and control. Non‐English language publications were included in the search. The search encompassed all published literature through December 1, 2011. In addition, reference lists of all systematic reviews and meta‐analyses were searched to identify all possible studies available.1416
Study Selection
Only primary research studies relating to acute care inpatient hospital fall prevention were included. Data generated exclusively or partially from psychiatric wards, rehabilitation units, subacute facilities, and long‐term facilities were excluded from the review.
Data Extraction and Quality Assessment
Each selected study was carefully hand searched by 2 authors for the purposes of data extraction. Data were collected for the following study characteristics and outcome measures: details of the fall prevention intervention used (allowing for all interventions used to be recorded in Table 3), markers of study quality, study period, study population, mean age of participants, sample size (in 1000 patient‐days), and fall rates (in 1000 patient‐days). In certain cases, sample size was converted to patient‐days using reported data points of total number of patients and average length of stay.
Two authors with experience in fall literature discussed methodological quality and reached a consensus regarding scores using a 20‐point scale previously described in fall literature for all studies included.14, 15 Ten individual criteria were scored on a 0‐2 point scale. No points were awarded when the criteria were not met, not clearly mentioned, or not mentioned at all. One point was awarded when the criterion was partially met, and both points awarded when it was fully met.
Data Synthesis and Analysis
Fall rate per 1000‐patient days was derived from reported data in both intervention and non‐intervention groups within each study. Effect sizes (odds ratios [OR]) and 95% confidence intervals (CI) were derived for individual studies and then combined across research reports using an inverse weighted random‐effects meta‐analysis.18 Random effects methodology was chosen to account for within‐study and between‐study variation. Statistical heterogeneity between trials was assessed using the Cochrane Q statistic and reported as I2, which estimates the percentage of variability across studies that is not due to chance.19 Due to the low number of included studies in our analysis, a formal statistical test on publication bias was not meaningful.20 Statistical significance was defined as P 0.05. Data analyses were done using Comprehensive Meta‐Analysis, Version 2 (Biostat, Englewood, NJ).
RESULTS
Selected Studies
Electronic search produced 259 results on MEDLINE, 2 results from the Cochrane Library, 94 from CINAHL, and 4 from EMBASE. Each result was hand searched to exclude duplicates, and irrelevant studies. Once such data were excluded, the above inclusion and exclusion criteria identified 6 primary articles for review.9, 2125 Additionally, a cluster randomized fall prevention trial in a mixed inpatient population was published by Cumming et al26 in 2008. The study was excluded, as the participants were pooled between rehabilitation wards and acute inpatient wards, and only incomplete data were reported separately for the acute inpatient wards. We were unsuccessful at obtaining necessary data to analyze the acute inpatient wards.
Study Quality
The quality assessment results scores ranged from 11 to 14 out of a possible 20 (Table 1). None of the studies explicitly used an intention‐to‐treat statistical model, as the nature of inpatient care largely prevents drop‐out or crossover, and all patients were included in individual study results.
| Included Study | Clearly Defined Inclusion and Exclusion Criteria | Randomization | Comparable Treatment Groups at Entry | Identical Standard Program for Both Groups | Fall Incident Clearly Defined and Staff Trained in Definition | Blinded Treatment Providers | Blinded Outcome Assessors | Blinded Patients | Identical Appraisal of Outcomes* | Intention‐to‐ Treat Analysis | Total Score (0‐20) |
|---|---|---|---|---|---|---|---|---|---|---|---|
| |||||||||||
| Dykes et al22 | 2 | 2 | 2 | 2 | 2 | 0 | 0 | 0 | 2 | 2 | 14 |
| Krauss et al23 | 2 | 0 | 2 | 2 | 2 | 0 | 0 | 0 | 2 | 2 | 12 |
| Brandis21 | 1 | 0 | 1 | 2 | 2 | 0 | 0 | 0 | 2 | 2 | 10 |
| Mitchell and Jones25 | 2 | 0 | 1 | 2 | 2 | 0 | 0 | 0 | 2 | 2 | 11 |
| Schwendimann et al9 | 2 | 0 | 1 | 2 | 2 | 0 | 0 | 0 | 2 | 2 | 11 |
| Williams et al24 | 2 | 0 | 1 | 2 | 2 | 0 | 0 | 0 | 2 | 2 | 11 |
Study Characteristics
The available data are skewed towards elderly patients being hospitalized in general medicine or geriatric units (Table 2). All but 1 study had a large sample size, with 1000‐patient days ranging from 11.1 to 160.3.9, 2124
| Included Study | Study Design | Study Period | Study Wards | Mean Age | Sample Size With Intervention (1000 Patient‐Days) | Sample Size in Control (1000 Patient‐Days) | Fall Rate With Intervention (Falls per 1000 Patient‐Days) | Fall Rate in Control (Falls per 1000 Patient‐Days) |
|---|---|---|---|---|---|---|---|---|
| ||||||||
| Dykes et al22 | RCT | 6 mo | 2 Medical units | 50% 65‐17% 65‐74 33% 75 | 24.1 | 24.1 | 4.18 | 4.64 |
| Krauss et al23 | Quasi‐experimental | 9 mo | General Medicine wards | 65.5 | 11.2 | 11.39 | 5.09 | 6.85 |
| Brandis21 | Pre/post | 12 mo | 500‐Bed acute care hospital | Not reported | 160.3 | 155.2 | 1.61 | 1.74 |
| Mitchell and Jones25 | Pre/post | 6 mo | Acute care hospital | 76.23 (Pre) 72.1 (Post) | 4.3 | 5 | 4.42 | 7.77 |
| Schwendimann et al9 | Pre/post | 4 yr | Internal Med, Surgery, and Geriatrics | 67.3 | 46.8 | 41.9 | 8.6 | 9.1 |
| Williams et al24 | Pre/post | 6 mo | 3 Medical wards and a Geriatrics ward | 79 | 15.88 | 12.53 | 8 | 9.5 |
Components of the Intervention
Multidisciplinary interventions were complex, and formulated based on available evidence for individual interventions and modifiable fall risk factors (Table 3). Each study reviewed included a fall risk assessment to risk‐stratify participants and modulate intervention according to risk.9, 2125
| Included Study | Fall Risk Assessment Used | Mobility Assessment and Assistance if Necessary | Mobility Aid Provided if Necessary | Medication Modification | Education About Risk Factors | Fall Risk Sign/Warning in Chart | Bedside Interventions (eg, Bed Alarm, Rail Adjustment, Bed Location/ Position, etc) | Toileting Schedule | Exercise Program | Other(s) |
|---|---|---|---|---|---|---|---|---|---|---|
| ||||||||||
| Dykes et al22* | + | + | + | + | + | + | + | + | Frequent bed checks, documented fall prevention plan | |
| Krauss et al23 | + | + | + | + | + | + | + | + | Use of bedside interventions was done based on discretion on a case‐by‐case basis | |
| Brandis21 | + | + | + | Ward modifications after OT assessment of patient rooms and bathrooms; hip protectors | ||||||
| Mitchell and Jones25 | + | + | + | + | Introduced detailed system to track fall details; used other preventive actions not specified | |||||
| Schwendimann et al9 | + | + | + | + | + | + | + | + | + | Reassessment of patients who did fall; hip protectors |
| Williams et al24 | + | + | + | + | + | + | Possible sitter | |||
Each study implemented fall prevention programs in a slightly different way. Krauss et al23 used nurses to complete a Morse Fall Scale and subsequently implement several standard interventions based on risk. Staff was then authorized to employ bedside interventions as necessary without systematic data collection. Schwendimann et al9 had nurses complete a simple fall risk assessment (based on history of falls, impaired mobility, and impaired cognition) that prompted the examination by a physician if risk was determined to be high. A subsequent team‐based intervention was employed with nursing, physiotherapy, and the physician. Brandis21 employed a team of nurses and the aid of the Director of Occupational Therapy to assess risk (using an undisclosed system) and carry out an intervention. Dykes et al22 examined an electronic fall prevention tool kit (FPTK) using the electronic medical record (EMR). This intervention began with the Morse Fall Score, which triggered automatically ordered interventions that did not require personal oversight. In fact, the multidisciplinary interventions in the intervention group were also used in the control arm. The difference was the automatic nature in which the interventions were ordered in the interventions arm. Williams et al24 used nurses and physiotherapists, who were specifically trained for the study, to carry out study interventions. The Mitchell and Jones25 study focused on nursing care alone to carry out intervention and used a novel risk assessment tool.
Fall Rates
Dykes et al22 and Williams et al24 found a statistically significant reduction in fall rate with falls reduced by 1.16 per 1000‐patient days and 1.5 per 1000‐patient days, respectively. Mitchell and Jones25 demonstrated a large fall reduction but had an extremely small sample size. Brandis21 found an extremely small reduction in fall rates and failed to report a P‐value. Krauss et al23 showed a trend towards reducing falls, and even showed a statistically significant reduction over the first 5 months of the study, but lost significance in the final 4 months. Similarly, Schwendimann et al9 saw more impressive fall reductions in the first year of the study that dissipated in the final 3 years of data collection.
Results from the meta‐analysis of the 6 studies comparing odds ratios are displayed quantitatively and as a forest plot in Figure 1. The figure shows results with 95% CI for each individual study and overall. There was no statistical evidence of heterogeneity between the studies or study designs. Although, due to the small number of studies included, there is poor power to detect true heterogeneity among studies. The magnitude of boxes shown is a relative sample size indicator. Using the random‐effects model, the summary odds ratio is 0.90 (95% CI, 0.83 to 0.99) (P = 0.02) (I2 = 0%).27
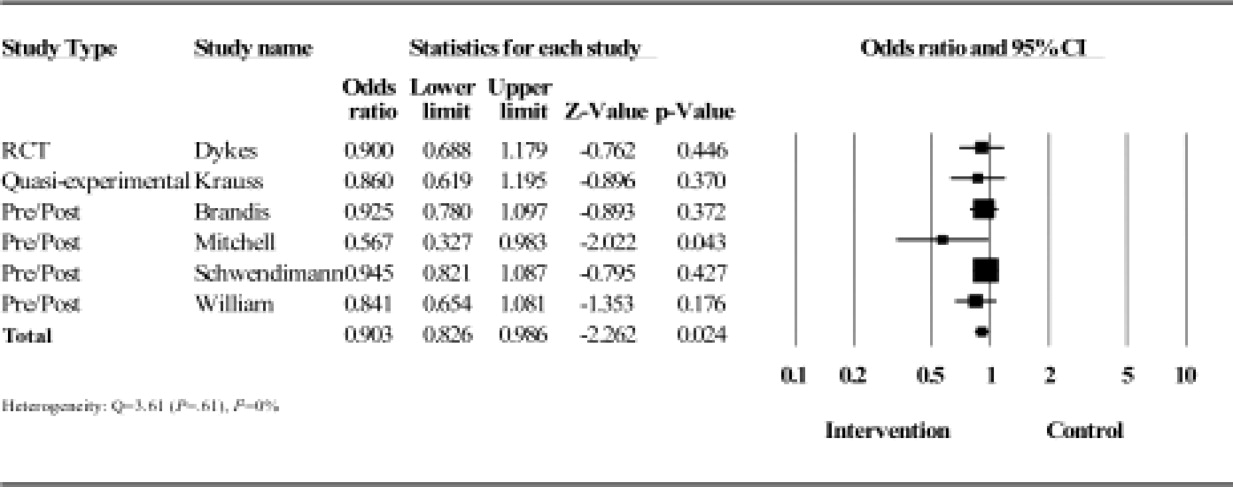
DISCUSSION
The frequency and morbidity associated with inpatient falls is well established, based on reproduced epidemiologic data. Reducing these adverse events could reduce morbidity, mortality, and healthcare costs, and has become the focus of most hospitals quality and patient safety initiatives. The focus of this review was to examine multidisciplinary efforts to reduce falls in acute care inpatient hospitals. Despite the importance and scope of the problem, there is a paucity of research available on this topic, with a wide literature search yielding only 6 primary research studies.
Our major finding is that multidisciplinary fall prevention strategies have a statistically significant impact on fall rates with a combined OR of 0.90. While this review demonstrates a significant benefit to multidisciplinary fall prevention strategies in the acute inpatient population, the clinical impact of these efforts may be limited. Based on rates ranging from 1.7 to 9.5 falls per 1000‐patient days, multidisciplinary interventions would reduce falls by 1 to 10 falls per 10,000‐patient days using the combined OR calculated of 0.9. Using other available incidence data regarding inpatient falls,4, 9 a reasonable baseline frequency to consider would be 8 falls per 1000 patient‐days. Assuming that prevalence, the number needed to treat (NNT) to prevent a single inpatient fall is 1250 patient days. Furthermore, based on available data, only approximately one‐third of these falls result in injury and only a minor fraction of these results in serious injury.9, 1113 The magnitude of this apparent benefit in the context of fall incidence rates raises some concerns about cost‐effectiveness given the high staffing and systems needs that multidisciplinary prevention programs require. This also suggests that there are limitations when using inpatient falls as a measure of healthcare quality given the absence of high‐quality evidence demonstrating a viable solution to the problem. At present, the Center for Medicare and Medicaid services limit reimbursement for fall‐related injuries if they occur during an acute inpatient hospitalization.28
The complexity of the interventions used may help explain the limited impact. Krauss et al23 examined compliance to their interventions and found less than ideal results. They found only 36.4% of intervention floor patients had maintained a toileting schedule compared to 24.6% on control floors. Additionally, a greater proportion of patients on control floors had a physical or occupational therapy consult, and only 1.8% more patients on intervention floors had walking aids provided. These were all strategies emphasized on the intervention floors. Similarly, Schwendimann et al9 questioned their staff's adherence to protocol after fall prevention committee audits. This may help explain why a potential benefit lost statistical significance with time, based on a natural tendency towards more participation at the beginning of a new policy. Williams et al24 reported only a 64% compliance rate with fall care plan forms and 77% rate of missing information on fall care plans. A multidisciplinary fall prevention study that did not meet inclusion criteria (based on study population) yielded strongly positive results for which the authors commented mostly on changing of the hospital culture surrounding fall prevention as a key to their success.29 Adoptability of a multidisciplinary intervention will clearly impact adherence and the intervention's ultimate effectiveness.
Single intervention strategies, not analyzed in this review, are simpler to execute and adhere to. While these types of interventions may be superior, there is extremely limited data supporting or refuting patient fall benefits in the acute care inpatient population when using simple single interventions. However, some data generated partially on acute care geriatrics wards targeting patient education only showed benefit.30
Dykes et al22 was able to improve compliance rates by removing steps in the process of executing interventions with the FPTK built into the EMR. Importantly, the FPTK was compared against very similar fall prevention strategies, the difference being that patients randomized to the FPTK arm had the assessment and interventions automatically prompted on admission in the EMR. Adherence was measured through Morse Fall Scale completion rates (81% in control units versus 94% in intervention units).22 In many ways, the utility of this study was displaying a fall risk reduction by simply enhancing compliance using health information technology with automated alerts. Additionally, both arms of the study reported low fall rates compared to previously reported data, and there may have been larger benefit seen if the FPTK was compared against no fall prevention strategy. This diminishing of effect size may have been present in all studies reviewed, as usual hospital care commonly includes basic patient safety measures.
Another potential problem with the multidisciplinary fall prevention programs included in the meta‐analysis is the inability to target interventions. Each study employed a fall risk score in an attempt to focus resources on a select group of high‐risk patients. This method is problematic given that countless risk factors for inpatient falls have been identified in the literature. Factors that have been described range from clinical characteristics to laboratory tests.31 The most consistently reproducible patient‐related risks are altered mental status (including cognitive impairment and depression), altered mobility (particularly lower limb weakness), a history of falls, and toileting needs.13, 3236 Less consistency is seen with other traditional risk factors such as age, sedating medication, and length of stay.5, 13, 32, 3638 Attempting to risk‐stratify patients using simple and accurate assessment tools developed from these risk factors has proven to be very difficult. Many tools have been developed based on identified risk factors, but perform very poorly when trying to identify patients who will fall with reasonable specificity and positive predictive value.34, 3944 In fact, it has been demonstrated that using a nurse's judgment, a physician's opinion based on a patient's likelihood to wander or a simple 2‐question tool have all performed better than sophisticated risk calculators.33, 45, 46 Therefore, it is possible that interventions could benefit from including all patients, with de‐emphasis on unproven risk stratification tools.
In contrast to our findings, a modest risk reduction has been demonstrated in several primary articles and meta‐analyses in the subacute, rehabilitation, and long‐term care populations.15, 16, 4750 Additionally, a recent study has described a 63.9% risk reduction in a population that included medical, surgical, psychiatric, and rehabilitation wards.29 One important difference between these settings and the acute inpatient populations may be the amount of time and energy that can be dedicated to fall prevention and overall care planning. Another likely factor is the added challenge of preventing falls in patients with more active medical illnesses. In the acute care setting, a patient's chief complaint may not be completely addressed at the time of first mobilization and ambulation. This may be most relevant in patients who are admitted with syncope, seizure, vertigo, and dehydration.
Our study has several limitations; most notably, the available evidence is limited in quality and quantity. Furthermore, omission of unpublished data may also lead to effect bias, though this would likely be in the direction of ineffective interventions supporting a conclusion that multidisciplinary efforts have had only a small impact on fall rates. Ideally, future studies can limit confounding variables through randomization. However, it is difficult to adequately blind when studying a multidisciplinary fall intervention that depends on patient and provider participation. As a result, none of the papers reviewed met criteria for high quality. However, almost all available data examined in this review came from large sample sizes in which thoughtful interventions were used. Since an inpatient fall will not affect the majority of patients, it was crucial for these studies to recruit a large sample size to have adequate power to detect a difference in fall rates. However, each study used risk assessment tools, which are poor indicators of who will and will not fall in the hospital.34, 39, 42 This may suggest a need for improved risk assessment tools, or be further evidence to include all patients in fall prevention regardless of risk. Quantitative synthesis of multidisciplinary fall interventions has the added limitation of comparing complex, multifaceted treatments that are not perfectly uniform. It is our opinion that interventions are semi‐standardized using the grouping methods employed in Table 3.
Preventing inpatient falls remains a difficult issue to address while convincing data is lacking. Based on current evidence, multidisciplinary fall prevention efforts on acutely ill inpatients show a possible small benefit and should be explored from a cost‐effectiveness standpoint to ensure they garner appropriate investment. Many resources are required to run such teams including nursing staff, equipment, physical and occupational therapy staff, pharmacists, and specialized staff training. We are unaware of any such cost‐effectiveness data available. Effective interventions may be those that maximize compliance through health information technology, maintain staff dedication, increase staff availability, improve risk assessment, or include all patients regardless of calculated fall risk, and take the patient's chief complaint into account in the fall prevention strategy. Where resources are limited, it appears most reasonable to focus on major risk factors for inpatient falls that have independently been shown to be detrimental to outcomes, such as delirium.51 Additionally, using inpatient fall rates as a hospital quality measure may be premature, given the lack of proven efforts to lower fall rates. Multidisciplinary fall prevention efforts on acutely ill inpatients should be further studied using high‐quality, randomized trials. It remains to be seen whether these large programs are cost‐effective, or on balance clinically effective.
- ,,.Patient accidents in hospital: incidence, documentation and significance.Br J Clin Pract.1994;48(2):63–66.
- ,,,.Serious falls in hospitalized patients: correlates and resource utilization.Am J Med.1995;99(2):137–143.
- ,,,.Hospital falls: a persistent problem.Am J Public Health.1985;75(7):775–777.
- ,,.Falls in the acute hospital setting—impact on resource utilisation.Aust Health Rev.2007;31(3):471–477.
- ,,.Incidence and risk factors for inpatient falls in an academic acute‐care hospital.J Nippon Med Sch.2006;73(5):265–270.
- ,,,.Do falls and falls‐injuries in hospital indicate negligent care—and how big is the risk? A retrospective analysis of the NHS Litigation Authority Database of clinical negligence claims, resulting from falls in hospitals in England 1995 to 2006.Qual Saf Health Care.2008;17(6):431–436.
- ,,,.Hospital falls: development of a predictive model for clinical practice.Appl Nurs Res.1995;8(3):129–139.
- ,.Centers for Medicare and Medicaid Services' “never events”: an analysis and recommendations to hospitals.Health Care Manag (Frederick).2008;27(4):338–349.
- ,,,.Falls and consequent injuries in hospitalized patients: effects of an interdisciplinary falls prevention program.BMC Health Serv Res.2006;6:69.
- .Immobility and falls.Clin Geriatr Med.1998;14(4):699–726.
- ,,.A case control study of falls in the hospital setting.J Gerontol Nurs.1998;24(12):7–15.
- ,,,.A retrospective analysis of patient falls.Can J Public Health.1985;76(2):116–118.
- ,,, et al.Characteristics and circumstances of falls in a hospital setting: a prospective analysis.J Gen Intern Med.2004;19(7):732–739.
- ,,, et al.Interventions for preventing falls in older people in nursing care facilities and hospitals.Cochrane Database Syst Rev.2010(1):CD005465.
- , L,,,,.Interventions for preventing falls in acute‐ and chronic‐care hospitals: a systematic review and meta‐analysis.J Am Geriatr Soc.2008;56(1):29–36.
- ,,, et al.Strategies to prevent falls and fractures in hospitals and care homes and effect of cognitive impairment: systematic review and meta‐analyses.BMJ.2007;334(7584):82.
- ,,,,,.Interventions for preventing falls in elderly people.Cochrane Database Syst Rev.2003(4):CD000340.
- ,,,.Introduction to Meta‐Analysis.Chichester, UK:John Wiley 2009.
- ,.Quantifying heterogeneity in a meta‐analysis.Stat Med.2002;21(11):1539–1558.
- .The power of the standard test for the presence of heterogeneity in meta‐analysis.Stat Med.2006;25(15):2688–2699.
- .A collaborative occupational therapy and nursing approach to falls prevention in hospital inpatients.J Qual Clin Pract.1999;19(4):215–220.
- ,,, et al.Fall prevention in acute care hospitals: a randomized trial.JAMA.2010;304(17):1912–1918.
- ,,,,,.Intervention to prevent falls on the medical service in a teaching hospital.Infect Control Hosp Epidemiol.2008;29(6):539–545.
- ,,, et al.Evaluation of a falls prevention programme in an acute tertiary care hospital.J Clin Nurs.2007;16(2):316–324.
- ,.Striving to prevent falls in an acute care setting—action to enhance quality.J Clin Nurs.1996;5(4):213–220.
- ,,, et al.Cluster randomised trial of a targeted multifactorial intervention to prevent falls among older people in hospital.BMJ.2008;336(7647):758–760.
- ,.Graphical displays for meta‐analysis: an overview with suggestions for practice.Res Syn Meth.2010(1):66–80.
- Centers for Medicare 37(7):317–325.
- ,‐M,, et al.Patient education to prevent falls among older hospital inpatients: a randomized controlled trial.Arch Intern Med.2011;117:516–524.
- ,.The relationship between patient blood pathology values and patient falls in an acute‐care setting: a retrospective analysis.Int J Nurs Pract.2005;11(4):161–168.
- ,,,.Falls risk factors in the hospital setting: a systematic review.Int J Nurs Pract.2001;7(1):38–45.
- ,,.A simplified fall‐risk assessment tool for patients hospitalized in medical wards.Isr Med Assoc J.2008;10(2):125–129.
- ,,,.Risk factors and risk assessment tools for falls in hospital in‐patients: a systematic review.Age Ageing.2004;33(2):122–130.
- ,,, et al.Circumstances of patient falls and injuries in 9 hospitals in a midwestern healthcare system.Infect Control Hosp Epidemiol.2007;28(5):544–550.
- ,,, et al.A case‐control study of patient, medication, and care‐related risk factors for inpatient falls.J Gen Intern Med.2005;20(2):116–122.
- .The experience of a community hospital in quantifying and reducing patient falls.J Nurs Care Qual.2000;14(3):43–53.
- ,,,.Characteristics of hospital inpatient falls across clinical departments.Gerontology.2008;54(6):342–348.
- ,.Falls risk prediction tools for hospital inpatients: do they work?Nurs Times.2009;105(7):18–21.
- ,,,.Accidental falls in hospital inpatients: evaluation of sensitivity and specificity of two risk assessment tools.J Adv Nurs.2010;66(3):690–696.
- ,,,,,.A systematic review and meta‐analysis of studies using the STRATIFY tool for prediction of falls in hospital patients: how well does it work?Age Ageing.2008;37(6):621–627.
- .Falls risk‐prediction tools for hospital inpatients. Time to put them to bed?Age Ageing.2008;37(3):248–250.
- ,,,,.Evaluation of three fall‐risk assessment tools in an acute care setting.J Adv Nurs.2007;60(4):427–435.
- ,,, et al.Fall prediction in inpatients by bedside nurses using the St. Thomas's Risk Assessment Tool in Falling Elderly Inpatients (STRATIFY) instrument: a multicenter study.J Am Geriatr Soc.2007;55(5):725–733.
- ,,,.Comparison of a fall risk assessment tool with nurses' judgement alone: a cluster‐randomised controlled trial.Age Ageing.2009;38(4):417–423.
- ,,,,.Fall risk‐assessment tools compared with clinical judgment: an evaluation in a rehabilitation ward.Age Ageing.2008;37(3):277–281.
- ,.Incidence of in‐hospital falls in geriatric patients before and after the introduction of an interdisciplinary team‐based fall‐prevention intervention.J Am Geriatr Soc.2007;55(12):2068–2074.
- ,,,.Sustained reduction in serious fall‐related injuries in older people in hospital.Med J Aust.2006;184(8):379–382.
- ,,, et al.The effect of changing practice on fall prevention in a rehabilitative hospital: the Hospital Injury Prevention Study.J Am Geriatr Soc.2004;52(3):335–339.
- ,,,.Effectiveness of targeted falls prevention programme in subacute hospital setting: randomised controlled trial.BMJ.2004;328(7441):676.
- ,,,,.Does delirium contribute to poor hospital outcomes? A three‐site epidemiologic study.J Gen Intern Med.1998;13(4):234–242.
Inpatient falls are the most common type of inpatient adverse event,1 persist as a significant problem nationally, and result in patient injury, increased length of stay, healthcare costs, and litigation.27 Inpatient falls remain a main focus of patient safety and a measure of quality in this era of healthcare reform and quality improvement.8 Inpatient fall rates per 1000 patient‐days range from 1.4 to 18.2.4, 9 The absolute percentage of inpatients that fall ranges from 1.3% to 7%.4, 5, 9, 10 Of inpatient falls, almost all data suggest that roughly one‐third result in some type of injury while 3%‐8% result in serious injury or death.9, 1113
Fall prevention interventions have largely been aimed at modifiable risk factors such as getting out of bed with bed alarms, toileting needs with bedside commodes, and reducing delirium through reorientation techniques. There have been several attempts at decreasing fall rates in hospitals surrounding a multidisciplinary, team‐based approach. Two Cochrane reviews and 2 meta‐analyses have partially examined this issue with mixed results.1417 However, none of these reviews focused on the acute care inpatient population. In fact, the majority of the data analyzed for inpatients was from rehabilitation wards and long‐term care wards. Additionally, there exists almost no data examining fall prevention with single interventions in the acute inpatient population, likely due to the belief that falls are multifactorial in etiology and require more comprehensive interventions.
The aim of this article is to determine the impact of team‐based, multidisciplinary quality improvement efforts to reduce inpatient falls in acute care inpatient hospitals and identify key features that determine their effectiveness.
METHODS
Data Sources and Searches
A search of MEDLINE, CINAHL, EMBASE, and the Cochrane Library was done using the medical subject heading (MeSH) terms accidental falls, accident prevention, inpatients, and prevention and control. Non‐English language publications were included in the search. The search encompassed all published literature through December 1, 2011. In addition, reference lists of all systematic reviews and meta‐analyses were searched to identify all possible studies available.1416
Study Selection
Only primary research studies relating to acute care inpatient hospital fall prevention were included. Data generated exclusively or partially from psychiatric wards, rehabilitation units, subacute facilities, and long‐term facilities were excluded from the review.
Data Extraction and Quality Assessment
Each selected study was carefully hand searched by 2 authors for the purposes of data extraction. Data were collected for the following study characteristics and outcome measures: details of the fall prevention intervention used (allowing for all interventions used to be recorded in Table 3), markers of study quality, study period, study population, mean age of participants, sample size (in 1000 patient‐days), and fall rates (in 1000 patient‐days). In certain cases, sample size was converted to patient‐days using reported data points of total number of patients and average length of stay.
Two authors with experience in fall literature discussed methodological quality and reached a consensus regarding scores using a 20‐point scale previously described in fall literature for all studies included.14, 15 Ten individual criteria were scored on a 0‐2 point scale. No points were awarded when the criteria were not met, not clearly mentioned, or not mentioned at all. One point was awarded when the criterion was partially met, and both points awarded when it was fully met.
Data Synthesis and Analysis
Fall rate per 1000‐patient days was derived from reported data in both intervention and non‐intervention groups within each study. Effect sizes (odds ratios [OR]) and 95% confidence intervals (CI) were derived for individual studies and then combined across research reports using an inverse weighted random‐effects meta‐analysis.18 Random effects methodology was chosen to account for within‐study and between‐study variation. Statistical heterogeneity between trials was assessed using the Cochrane Q statistic and reported as I2, which estimates the percentage of variability across studies that is not due to chance.19 Due to the low number of included studies in our analysis, a formal statistical test on publication bias was not meaningful.20 Statistical significance was defined as P 0.05. Data analyses were done using Comprehensive Meta‐Analysis, Version 2 (Biostat, Englewood, NJ).
RESULTS
Selected Studies
Electronic search produced 259 results on MEDLINE, 2 results from the Cochrane Library, 94 from CINAHL, and 4 from EMBASE. Each result was hand searched to exclude duplicates, and irrelevant studies. Once such data were excluded, the above inclusion and exclusion criteria identified 6 primary articles for review.9, 2125 Additionally, a cluster randomized fall prevention trial in a mixed inpatient population was published by Cumming et al26 in 2008. The study was excluded, as the participants were pooled between rehabilitation wards and acute inpatient wards, and only incomplete data were reported separately for the acute inpatient wards. We were unsuccessful at obtaining necessary data to analyze the acute inpatient wards.
Study Quality
The quality assessment results scores ranged from 11 to 14 out of a possible 20 (Table 1). None of the studies explicitly used an intention‐to‐treat statistical model, as the nature of inpatient care largely prevents drop‐out or crossover, and all patients were included in individual study results.
| Included Study | Clearly Defined Inclusion and Exclusion Criteria | Randomization | Comparable Treatment Groups at Entry | Identical Standard Program for Both Groups | Fall Incident Clearly Defined and Staff Trained in Definition | Blinded Treatment Providers | Blinded Outcome Assessors | Blinded Patients | Identical Appraisal of Outcomes* | Intention‐to‐ Treat Analysis | Total Score (0‐20) |
|---|---|---|---|---|---|---|---|---|---|---|---|
| |||||||||||
| Dykes et al22 | 2 | 2 | 2 | 2 | 2 | 0 | 0 | 0 | 2 | 2 | 14 |
| Krauss et al23 | 2 | 0 | 2 | 2 | 2 | 0 | 0 | 0 | 2 | 2 | 12 |
| Brandis21 | 1 | 0 | 1 | 2 | 2 | 0 | 0 | 0 | 2 | 2 | 10 |
| Mitchell and Jones25 | 2 | 0 | 1 | 2 | 2 | 0 | 0 | 0 | 2 | 2 | 11 |
| Schwendimann et al9 | 2 | 0 | 1 | 2 | 2 | 0 | 0 | 0 | 2 | 2 | 11 |
| Williams et al24 | 2 | 0 | 1 | 2 | 2 | 0 | 0 | 0 | 2 | 2 | 11 |
Study Characteristics
The available data are skewed towards elderly patients being hospitalized in general medicine or geriatric units (Table 2). All but 1 study had a large sample size, with 1000‐patient days ranging from 11.1 to 160.3.9, 2124
| Included Study | Study Design | Study Period | Study Wards | Mean Age | Sample Size With Intervention (1000 Patient‐Days) | Sample Size in Control (1000 Patient‐Days) | Fall Rate With Intervention (Falls per 1000 Patient‐Days) | Fall Rate in Control (Falls per 1000 Patient‐Days) |
|---|---|---|---|---|---|---|---|---|
| ||||||||
| Dykes et al22 | RCT | 6 mo | 2 Medical units | 50% 65‐17% 65‐74 33% 75 | 24.1 | 24.1 | 4.18 | 4.64 |
| Krauss et al23 | Quasi‐experimental | 9 mo | General Medicine wards | 65.5 | 11.2 | 11.39 | 5.09 | 6.85 |
| Brandis21 | Pre/post | 12 mo | 500‐Bed acute care hospital | Not reported | 160.3 | 155.2 | 1.61 | 1.74 |
| Mitchell and Jones25 | Pre/post | 6 mo | Acute care hospital | 76.23 (Pre) 72.1 (Post) | 4.3 | 5 | 4.42 | 7.77 |
| Schwendimann et al9 | Pre/post | 4 yr | Internal Med, Surgery, and Geriatrics | 67.3 | 46.8 | 41.9 | 8.6 | 9.1 |
| Williams et al24 | Pre/post | 6 mo | 3 Medical wards and a Geriatrics ward | 79 | 15.88 | 12.53 | 8 | 9.5 |
Components of the Intervention
Multidisciplinary interventions were complex, and formulated based on available evidence for individual interventions and modifiable fall risk factors (Table 3). Each study reviewed included a fall risk assessment to risk‐stratify participants and modulate intervention according to risk.9, 2125
| Included Study | Fall Risk Assessment Used | Mobility Assessment and Assistance if Necessary | Mobility Aid Provided if Necessary | Medication Modification | Education About Risk Factors | Fall Risk Sign/Warning in Chart | Bedside Interventions (eg, Bed Alarm, Rail Adjustment, Bed Location/ Position, etc) | Toileting Schedule | Exercise Program | Other(s) |
|---|---|---|---|---|---|---|---|---|---|---|
| ||||||||||
| Dykes et al22* | + | + | + | + | + | + | + | + | Frequent bed checks, documented fall prevention plan | |
| Krauss et al23 | + | + | + | + | + | + | + | + | Use of bedside interventions was done based on discretion on a case‐by‐case basis | |
| Brandis21 | + | + | + | Ward modifications after OT assessment of patient rooms and bathrooms; hip protectors | ||||||
| Mitchell and Jones25 | + | + | + | + | Introduced detailed system to track fall details; used other preventive actions not specified | |||||
| Schwendimann et al9 | + | + | + | + | + | + | + | + | + | Reassessment of patients who did fall; hip protectors |
| Williams et al24 | + | + | + | + | + | + | Possible sitter | |||
Each study implemented fall prevention programs in a slightly different way. Krauss et al23 used nurses to complete a Morse Fall Scale and subsequently implement several standard interventions based on risk. Staff was then authorized to employ bedside interventions as necessary without systematic data collection. Schwendimann et al9 had nurses complete a simple fall risk assessment (based on history of falls, impaired mobility, and impaired cognition) that prompted the examination by a physician if risk was determined to be high. A subsequent team‐based intervention was employed with nursing, physiotherapy, and the physician. Brandis21 employed a team of nurses and the aid of the Director of Occupational Therapy to assess risk (using an undisclosed system) and carry out an intervention. Dykes et al22 examined an electronic fall prevention tool kit (FPTK) using the electronic medical record (EMR). This intervention began with the Morse Fall Score, which triggered automatically ordered interventions that did not require personal oversight. In fact, the multidisciplinary interventions in the intervention group were also used in the control arm. The difference was the automatic nature in which the interventions were ordered in the interventions arm. Williams et al24 used nurses and physiotherapists, who were specifically trained for the study, to carry out study interventions. The Mitchell and Jones25 study focused on nursing care alone to carry out intervention and used a novel risk assessment tool.
Fall Rates
Dykes et al22 and Williams et al24 found a statistically significant reduction in fall rate with falls reduced by 1.16 per 1000‐patient days and 1.5 per 1000‐patient days, respectively. Mitchell and Jones25 demonstrated a large fall reduction but had an extremely small sample size. Brandis21 found an extremely small reduction in fall rates and failed to report a P‐value. Krauss et al23 showed a trend towards reducing falls, and even showed a statistically significant reduction over the first 5 months of the study, but lost significance in the final 4 months. Similarly, Schwendimann et al9 saw more impressive fall reductions in the first year of the study that dissipated in the final 3 years of data collection.
Results from the meta‐analysis of the 6 studies comparing odds ratios are displayed quantitatively and as a forest plot in Figure 1. The figure shows results with 95% CI for each individual study and overall. There was no statistical evidence of heterogeneity between the studies or study designs. Although, due to the small number of studies included, there is poor power to detect true heterogeneity among studies. The magnitude of boxes shown is a relative sample size indicator. Using the random‐effects model, the summary odds ratio is 0.90 (95% CI, 0.83 to 0.99) (P = 0.02) (I2 = 0%).27
DISCUSSION
The frequency and morbidity associated with inpatient falls is well established, based on reproduced epidemiologic data. Reducing these adverse events could reduce morbidity, mortality, and healthcare costs, and has become the focus of most hospitals quality and patient safety initiatives. The focus of this review was to examine multidisciplinary efforts to reduce falls in acute care inpatient hospitals. Despite the importance and scope of the problem, there is a paucity of research available on this topic, with a wide literature search yielding only 6 primary research studies.
Our major finding is that multidisciplinary fall prevention strategies have a statistically significant impact on fall rates with a combined OR of 0.90. While this review demonstrates a significant benefit to multidisciplinary fall prevention strategies in the acute inpatient population, the clinical impact of these efforts may be limited. Based on rates ranging from 1.7 to 9.5 falls per 1000‐patient days, multidisciplinary interventions would reduce falls by 1 to 10 falls per 10,000‐patient days using the combined OR calculated of 0.9. Using other available incidence data regarding inpatient falls,4, 9 a reasonable baseline frequency to consider would be 8 falls per 1000 patient‐days. Assuming that prevalence, the number needed to treat (NNT) to prevent a single inpatient fall is 1250 patient days. Furthermore, based on available data, only approximately one‐third of these falls result in injury and only a minor fraction of these results in serious injury.9, 1113 The magnitude of this apparent benefit in the context of fall incidence rates raises some concerns about cost‐effectiveness given the high staffing and systems needs that multidisciplinary prevention programs require. This also suggests that there are limitations when using inpatient falls as a measure of healthcare quality given the absence of high‐quality evidence demonstrating a viable solution to the problem. At present, the Center for Medicare and Medicaid services limit reimbursement for fall‐related injuries if they occur during an acute inpatient hospitalization.28
The complexity of the interventions used may help explain the limited impact. Krauss et al23 examined compliance to their interventions and found less than ideal results. They found only 36.4% of intervention floor patients had maintained a toileting schedule compared to 24.6% on control floors. Additionally, a greater proportion of patients on control floors had a physical or occupational therapy consult, and only 1.8% more patients on intervention floors had walking aids provided. These were all strategies emphasized on the intervention floors. Similarly, Schwendimann et al9 questioned their staff's adherence to protocol after fall prevention committee audits. This may help explain why a potential benefit lost statistical significance with time, based on a natural tendency towards more participation at the beginning of a new policy. Williams et al24 reported only a 64% compliance rate with fall care plan forms and 77% rate of missing information on fall care plans. A multidisciplinary fall prevention study that did not meet inclusion criteria (based on study population) yielded strongly positive results for which the authors commented mostly on changing of the hospital culture surrounding fall prevention as a key to their success.29 Adoptability of a multidisciplinary intervention will clearly impact adherence and the intervention's ultimate effectiveness.
Single intervention strategies, not analyzed in this review, are simpler to execute and adhere to. While these types of interventions may be superior, there is extremely limited data supporting or refuting patient fall benefits in the acute care inpatient population when using simple single interventions. However, some data generated partially on acute care geriatrics wards targeting patient education only showed benefit.30
Dykes et al22 was able to improve compliance rates by removing steps in the process of executing interventions with the FPTK built into the EMR. Importantly, the FPTK was compared against very similar fall prevention strategies, the difference being that patients randomized to the FPTK arm had the assessment and interventions automatically prompted on admission in the EMR. Adherence was measured through Morse Fall Scale completion rates (81% in control units versus 94% in intervention units).22 In many ways, the utility of this study was displaying a fall risk reduction by simply enhancing compliance using health information technology with automated alerts. Additionally, both arms of the study reported low fall rates compared to previously reported data, and there may have been larger benefit seen if the FPTK was compared against no fall prevention strategy. This diminishing of effect size may have been present in all studies reviewed, as usual hospital care commonly includes basic patient safety measures.
Another potential problem with the multidisciplinary fall prevention programs included in the meta‐analysis is the inability to target interventions. Each study employed a fall risk score in an attempt to focus resources on a select group of high‐risk patients. This method is problematic given that countless risk factors for inpatient falls have been identified in the literature. Factors that have been described range from clinical characteristics to laboratory tests.31 The most consistently reproducible patient‐related risks are altered mental status (including cognitive impairment and depression), altered mobility (particularly lower limb weakness), a history of falls, and toileting needs.13, 3236 Less consistency is seen with other traditional risk factors such as age, sedating medication, and length of stay.5, 13, 32, 3638 Attempting to risk‐stratify patients using simple and accurate assessment tools developed from these risk factors has proven to be very difficult. Many tools have been developed based on identified risk factors, but perform very poorly when trying to identify patients who will fall with reasonable specificity and positive predictive value.34, 3944 In fact, it has been demonstrated that using a nurse's judgment, a physician's opinion based on a patient's likelihood to wander or a simple 2‐question tool have all performed better than sophisticated risk calculators.33, 45, 46 Therefore, it is possible that interventions could benefit from including all patients, with de‐emphasis on unproven risk stratification tools.
In contrast to our findings, a modest risk reduction has been demonstrated in several primary articles and meta‐analyses in the subacute, rehabilitation, and long‐term care populations.15, 16, 4750 Additionally, a recent study has described a 63.9% risk reduction in a population that included medical, surgical, psychiatric, and rehabilitation wards.29 One important difference between these settings and the acute inpatient populations may be the amount of time and energy that can be dedicated to fall prevention and overall care planning. Another likely factor is the added challenge of preventing falls in patients with more active medical illnesses. In the acute care setting, a patient's chief complaint may not be completely addressed at the time of first mobilization and ambulation. This may be most relevant in patients who are admitted with syncope, seizure, vertigo, and dehydration.
Our study has several limitations; most notably, the available evidence is limited in quality and quantity. Furthermore, omission of unpublished data may also lead to effect bias, though this would likely be in the direction of ineffective interventions supporting a conclusion that multidisciplinary efforts have had only a small impact on fall rates. Ideally, future studies can limit confounding variables through randomization. However, it is difficult to adequately blind when studying a multidisciplinary fall intervention that depends on patient and provider participation. As a result, none of the papers reviewed met criteria for high quality. However, almost all available data examined in this review came from large sample sizes in which thoughtful interventions were used. Since an inpatient fall will not affect the majority of patients, it was crucial for these studies to recruit a large sample size to have adequate power to detect a difference in fall rates. However, each study used risk assessment tools, which are poor indicators of who will and will not fall in the hospital.34, 39, 42 This may suggest a need for improved risk assessment tools, or be further evidence to include all patients in fall prevention regardless of risk. Quantitative synthesis of multidisciplinary fall interventions has the added limitation of comparing complex, multifaceted treatments that are not perfectly uniform. It is our opinion that interventions are semi‐standardized using the grouping methods employed in Table 3.
Preventing inpatient falls remains a difficult issue to address while convincing data is lacking. Based on current evidence, multidisciplinary fall prevention efforts on acutely ill inpatients show a possible small benefit and should be explored from a cost‐effectiveness standpoint to ensure they garner appropriate investment. Many resources are required to run such teams including nursing staff, equipment, physical and occupational therapy staff, pharmacists, and specialized staff training. We are unaware of any such cost‐effectiveness data available. Effective interventions may be those that maximize compliance through health information technology, maintain staff dedication, increase staff availability, improve risk assessment, or include all patients regardless of calculated fall risk, and take the patient's chief complaint into account in the fall prevention strategy. Where resources are limited, it appears most reasonable to focus on major risk factors for inpatient falls that have independently been shown to be detrimental to outcomes, such as delirium.51 Additionally, using inpatient fall rates as a hospital quality measure may be premature, given the lack of proven efforts to lower fall rates. Multidisciplinary fall prevention efforts on acutely ill inpatients should be further studied using high‐quality, randomized trials. It remains to be seen whether these large programs are cost‐effective, or on balance clinically effective.
Inpatient falls are the most common type of inpatient adverse event,1 persist as a significant problem nationally, and result in patient injury, increased length of stay, healthcare costs, and litigation.27 Inpatient falls remain a main focus of patient safety and a measure of quality in this era of healthcare reform and quality improvement.8 Inpatient fall rates per 1000 patient‐days range from 1.4 to 18.2.4, 9 The absolute percentage of inpatients that fall ranges from 1.3% to 7%.4, 5, 9, 10 Of inpatient falls, almost all data suggest that roughly one‐third result in some type of injury while 3%‐8% result in serious injury or death.9, 1113
Fall prevention interventions have largely been aimed at modifiable risk factors such as getting out of bed with bed alarms, toileting needs with bedside commodes, and reducing delirium through reorientation techniques. There have been several attempts at decreasing fall rates in hospitals surrounding a multidisciplinary, team‐based approach. Two Cochrane reviews and 2 meta‐analyses have partially examined this issue with mixed results.1417 However, none of these reviews focused on the acute care inpatient population. In fact, the majority of the data analyzed for inpatients was from rehabilitation wards and long‐term care wards. Additionally, there exists almost no data examining fall prevention with single interventions in the acute inpatient population, likely due to the belief that falls are multifactorial in etiology and require more comprehensive interventions.
The aim of this article is to determine the impact of team‐based, multidisciplinary quality improvement efforts to reduce inpatient falls in acute care inpatient hospitals and identify key features that determine their effectiveness.
METHODS
Data Sources and Searches
A search of MEDLINE, CINAHL, EMBASE, and the Cochrane Library was done using the medical subject heading (MeSH) terms accidental falls, accident prevention, inpatients, and prevention and control. Non‐English language publications were included in the search. The search encompassed all published literature through December 1, 2011. In addition, reference lists of all systematic reviews and meta‐analyses were searched to identify all possible studies available.1416
Study Selection
Only primary research studies relating to acute care inpatient hospital fall prevention were included. Data generated exclusively or partially from psychiatric wards, rehabilitation units, subacute facilities, and long‐term facilities were excluded from the review.
Data Extraction and Quality Assessment
Each selected study was carefully hand searched by 2 authors for the purposes of data extraction. Data were collected for the following study characteristics and outcome measures: details of the fall prevention intervention used (allowing for all interventions used to be recorded in Table 3), markers of study quality, study period, study population, mean age of participants, sample size (in 1000 patient‐days), and fall rates (in 1000 patient‐days). In certain cases, sample size was converted to patient‐days using reported data points of total number of patients and average length of stay.
Two authors with experience in fall literature discussed methodological quality and reached a consensus regarding scores using a 20‐point scale previously described in fall literature for all studies included.14, 15 Ten individual criteria were scored on a 0‐2 point scale. No points were awarded when the criteria were not met, not clearly mentioned, or not mentioned at all. One point was awarded when the criterion was partially met, and both points awarded when it was fully met.
Data Synthesis and Analysis
Fall rate per 1000‐patient days was derived from reported data in both intervention and non‐intervention groups within each study. Effect sizes (odds ratios [OR]) and 95% confidence intervals (CI) were derived for individual studies and then combined across research reports using an inverse weighted random‐effects meta‐analysis.18 Random effects methodology was chosen to account for within‐study and between‐study variation. Statistical heterogeneity between trials was assessed using the Cochrane Q statistic and reported as I2, which estimates the percentage of variability across studies that is not due to chance.19 Due to the low number of included studies in our analysis, a formal statistical test on publication bias was not meaningful.20 Statistical significance was defined as P 0.05. Data analyses were done using Comprehensive Meta‐Analysis, Version 2 (Biostat, Englewood, NJ).
RESULTS
Selected Studies
Electronic search produced 259 results on MEDLINE, 2 results from the Cochrane Library, 94 from CINAHL, and 4 from EMBASE. Each result was hand searched to exclude duplicates, and irrelevant studies. Once such data were excluded, the above inclusion and exclusion criteria identified 6 primary articles for review.9, 2125 Additionally, a cluster randomized fall prevention trial in a mixed inpatient population was published by Cumming et al26 in 2008. The study was excluded, as the participants were pooled between rehabilitation wards and acute inpatient wards, and only incomplete data were reported separately for the acute inpatient wards. We were unsuccessful at obtaining necessary data to analyze the acute inpatient wards.
Study Quality
The quality assessment results scores ranged from 11 to 14 out of a possible 20 (Table 1). None of the studies explicitly used an intention‐to‐treat statistical model, as the nature of inpatient care largely prevents drop‐out or crossover, and all patients were included in individual study results.
| Included Study | Clearly Defined Inclusion and Exclusion Criteria | Randomization | Comparable Treatment Groups at Entry | Identical Standard Program for Both Groups | Fall Incident Clearly Defined and Staff Trained in Definition | Blinded Treatment Providers | Blinded Outcome Assessors | Blinded Patients | Identical Appraisal of Outcomes* | Intention‐to‐ Treat Analysis | Total Score (0‐20) |
|---|---|---|---|---|---|---|---|---|---|---|---|
| |||||||||||
| Dykes et al22 | 2 | 2 | 2 | 2 | 2 | 0 | 0 | 0 | 2 | 2 | 14 |
| Krauss et al23 | 2 | 0 | 2 | 2 | 2 | 0 | 0 | 0 | 2 | 2 | 12 |
| Brandis21 | 1 | 0 | 1 | 2 | 2 | 0 | 0 | 0 | 2 | 2 | 10 |
| Mitchell and Jones25 | 2 | 0 | 1 | 2 | 2 | 0 | 0 | 0 | 2 | 2 | 11 |
| Schwendimann et al9 | 2 | 0 | 1 | 2 | 2 | 0 | 0 | 0 | 2 | 2 | 11 |
| Williams et al24 | 2 | 0 | 1 | 2 | 2 | 0 | 0 | 0 | 2 | 2 | 11 |
Study Characteristics
The available data are skewed towards elderly patients being hospitalized in general medicine or geriatric units (Table 2). All but 1 study had a large sample size, with 1000‐patient days ranging from 11.1 to 160.3.9, 2124
| Included Study | Study Design | Study Period | Study Wards | Mean Age | Sample Size With Intervention (1000 Patient‐Days) | Sample Size in Control (1000 Patient‐Days) | Fall Rate With Intervention (Falls per 1000 Patient‐Days) | Fall Rate in Control (Falls per 1000 Patient‐Days) |
|---|---|---|---|---|---|---|---|---|
| ||||||||
| Dykes et al22 | RCT | 6 mo | 2 Medical units | 50% 65‐17% 65‐74 33% 75 | 24.1 | 24.1 | 4.18 | 4.64 |
| Krauss et al23 | Quasi‐experimental | 9 mo | General Medicine wards | 65.5 | 11.2 | 11.39 | 5.09 | 6.85 |
| Brandis21 | Pre/post | 12 mo | 500‐Bed acute care hospital | Not reported | 160.3 | 155.2 | 1.61 | 1.74 |
| Mitchell and Jones25 | Pre/post | 6 mo | Acute care hospital | 76.23 (Pre) 72.1 (Post) | 4.3 | 5 | 4.42 | 7.77 |
| Schwendimann et al9 | Pre/post | 4 yr | Internal Med, Surgery, and Geriatrics | 67.3 | 46.8 | 41.9 | 8.6 | 9.1 |
| Williams et al24 | Pre/post | 6 mo | 3 Medical wards and a Geriatrics ward | 79 | 15.88 | 12.53 | 8 | 9.5 |
Components of the Intervention
Multidisciplinary interventions were complex, and formulated based on available evidence for individual interventions and modifiable fall risk factors (Table 3). Each study reviewed included a fall risk assessment to risk‐stratify participants and modulate intervention according to risk.9, 2125
| Included Study | Fall Risk Assessment Used | Mobility Assessment and Assistance if Necessary | Mobility Aid Provided if Necessary | Medication Modification | Education About Risk Factors | Fall Risk Sign/Warning in Chart | Bedside Interventions (eg, Bed Alarm, Rail Adjustment, Bed Location/ Position, etc) | Toileting Schedule | Exercise Program | Other(s) |
|---|---|---|---|---|---|---|---|---|---|---|
| ||||||||||
| Dykes et al22* | + | + | + | + | + | + | + | + | Frequent bed checks, documented fall prevention plan | |
| Krauss et al23 | + | + | + | + | + | + | + | + | Use of bedside interventions was done based on discretion on a case‐by‐case basis | |
| Brandis21 | + | + | + | Ward modifications after OT assessment of patient rooms and bathrooms; hip protectors | ||||||
| Mitchell and Jones25 | + | + | + | + | Introduced detailed system to track fall details; used other preventive actions not specified | |||||
| Schwendimann et al9 | + | + | + | + | + | + | + | + | + | Reassessment of patients who did fall; hip protectors |
| Williams et al24 | + | + | + | + | + | + | Possible sitter | |||
Each study implemented fall prevention programs in a slightly different way. Krauss et al23 used nurses to complete a Morse Fall Scale and subsequently implement several standard interventions based on risk. Staff was then authorized to employ bedside interventions as necessary without systematic data collection. Schwendimann et al9 had nurses complete a simple fall risk assessment (based on history of falls, impaired mobility, and impaired cognition) that prompted the examination by a physician if risk was determined to be high. A subsequent team‐based intervention was employed with nursing, physiotherapy, and the physician. Brandis21 employed a team of nurses and the aid of the Director of Occupational Therapy to assess risk (using an undisclosed system) and carry out an intervention. Dykes et al22 examined an electronic fall prevention tool kit (FPTK) using the electronic medical record (EMR). This intervention began with the Morse Fall Score, which triggered automatically ordered interventions that did not require personal oversight. In fact, the multidisciplinary interventions in the intervention group were also used in the control arm. The difference was the automatic nature in which the interventions were ordered in the interventions arm. Williams et al24 used nurses and physiotherapists, who were specifically trained for the study, to carry out study interventions. The Mitchell and Jones25 study focused on nursing care alone to carry out intervention and used a novel risk assessment tool.
Fall Rates
Dykes et al22 and Williams et al24 found a statistically significant reduction in fall rate with falls reduced by 1.16 per 1000‐patient days and 1.5 per 1000‐patient days, respectively. Mitchell and Jones25 demonstrated a large fall reduction but had an extremely small sample size. Brandis21 found an extremely small reduction in fall rates and failed to report a P‐value. Krauss et al23 showed a trend towards reducing falls, and even showed a statistically significant reduction over the first 5 months of the study, but lost significance in the final 4 months. Similarly, Schwendimann et al9 saw more impressive fall reductions in the first year of the study that dissipated in the final 3 years of data collection.
Results from the meta‐analysis of the 6 studies comparing odds ratios are displayed quantitatively and as a forest plot in Figure 1. The figure shows results with 95% CI for each individual study and overall. There was no statistical evidence of heterogeneity between the studies or study designs. Although, due to the small number of studies included, there is poor power to detect true heterogeneity among studies. The magnitude of boxes shown is a relative sample size indicator. Using the random‐effects model, the summary odds ratio is 0.90 (95% CI, 0.83 to 0.99) (P = 0.02) (I2 = 0%).27
DISCUSSION
The frequency and morbidity associated with inpatient falls is well established, based on reproduced epidemiologic data. Reducing these adverse events could reduce morbidity, mortality, and healthcare costs, and has become the focus of most hospitals quality and patient safety initiatives. The focus of this review was to examine multidisciplinary efforts to reduce falls in acute care inpatient hospitals. Despite the importance and scope of the problem, there is a paucity of research available on this topic, with a wide literature search yielding only 6 primary research studies.
Our major finding is that multidisciplinary fall prevention strategies have a statistically significant impact on fall rates with a combined OR of 0.90. While this review demonstrates a significant benefit to multidisciplinary fall prevention strategies in the acute inpatient population, the clinical impact of these efforts may be limited. Based on rates ranging from 1.7 to 9.5 falls per 1000‐patient days, multidisciplinary interventions would reduce falls by 1 to 10 falls per 10,000‐patient days using the combined OR calculated of 0.9. Using other available incidence data regarding inpatient falls,4, 9 a reasonable baseline frequency to consider would be 8 falls per 1000 patient‐days. Assuming that prevalence, the number needed to treat (NNT) to prevent a single inpatient fall is 1250 patient days. Furthermore, based on available data, only approximately one‐third of these falls result in injury and only a minor fraction of these results in serious injury.9, 1113 The magnitude of this apparent benefit in the context of fall incidence rates raises some concerns about cost‐effectiveness given the high staffing and systems needs that multidisciplinary prevention programs require. This also suggests that there are limitations when using inpatient falls as a measure of healthcare quality given the absence of high‐quality evidence demonstrating a viable solution to the problem. At present, the Center for Medicare and Medicaid services limit reimbursement for fall‐related injuries if they occur during an acute inpatient hospitalization.28
The complexity of the interventions used may help explain the limited impact. Krauss et al23 examined compliance to their interventions and found less than ideal results. They found only 36.4% of intervention floor patients had maintained a toileting schedule compared to 24.6% on control floors. Additionally, a greater proportion of patients on control floors had a physical or occupational therapy consult, and only 1.8% more patients on intervention floors had walking aids provided. These were all strategies emphasized on the intervention floors. Similarly, Schwendimann et al9 questioned their staff's adherence to protocol after fall prevention committee audits. This may help explain why a potential benefit lost statistical significance with time, based on a natural tendency towards more participation at the beginning of a new policy. Williams et al24 reported only a 64% compliance rate with fall care plan forms and 77% rate of missing information on fall care plans. A multidisciplinary fall prevention study that did not meet inclusion criteria (based on study population) yielded strongly positive results for which the authors commented mostly on changing of the hospital culture surrounding fall prevention as a key to their success.29 Adoptability of a multidisciplinary intervention will clearly impact adherence and the intervention's ultimate effectiveness.
Single intervention strategies, not analyzed in this review, are simpler to execute and adhere to. While these types of interventions may be superior, there is extremely limited data supporting or refuting patient fall benefits in the acute care inpatient population when using simple single interventions. However, some data generated partially on acute care geriatrics wards targeting patient education only showed benefit.30
Dykes et al22 was able to improve compliance rates by removing steps in the process of executing interventions with the FPTK built into the EMR. Importantly, the FPTK was compared against very similar fall prevention strategies, the difference being that patients randomized to the FPTK arm had the assessment and interventions automatically prompted on admission in the EMR. Adherence was measured through Morse Fall Scale completion rates (81% in control units versus 94% in intervention units).22 In many ways, the utility of this study was displaying a fall risk reduction by simply enhancing compliance using health information technology with automated alerts. Additionally, both arms of the study reported low fall rates compared to previously reported data, and there may have been larger benefit seen if the FPTK was compared against no fall prevention strategy. This diminishing of effect size may have been present in all studies reviewed, as usual hospital care commonly includes basic patient safety measures.
Another potential problem with the multidisciplinary fall prevention programs included in the meta‐analysis is the inability to target interventions. Each study employed a fall risk score in an attempt to focus resources on a select group of high‐risk patients. This method is problematic given that countless risk factors for inpatient falls have been identified in the literature. Factors that have been described range from clinical characteristics to laboratory tests.31 The most consistently reproducible patient‐related risks are altered mental status (including cognitive impairment and depression), altered mobility (particularly lower limb weakness), a history of falls, and toileting needs.13, 3236 Less consistency is seen with other traditional risk factors such as age, sedating medication, and length of stay.5, 13, 32, 3638 Attempting to risk‐stratify patients using simple and accurate assessment tools developed from these risk factors has proven to be very difficult. Many tools have been developed based on identified risk factors, but perform very poorly when trying to identify patients who will fall with reasonable specificity and positive predictive value.34, 3944 In fact, it has been demonstrated that using a nurse's judgment, a physician's opinion based on a patient's likelihood to wander or a simple 2‐question tool have all performed better than sophisticated risk calculators.33, 45, 46 Therefore, it is possible that interventions could benefit from including all patients, with de‐emphasis on unproven risk stratification tools.
In contrast to our findings, a modest risk reduction has been demonstrated in several primary articles and meta‐analyses in the subacute, rehabilitation, and long‐term care populations.15, 16, 4750 Additionally, a recent study has described a 63.9% risk reduction in a population that included medical, surgical, psychiatric, and rehabilitation wards.29 One important difference between these settings and the acute inpatient populations may be the amount of time and energy that can be dedicated to fall prevention and overall care planning. Another likely factor is the added challenge of preventing falls in patients with more active medical illnesses. In the acute care setting, a patient's chief complaint may not be completely addressed at the time of first mobilization and ambulation. This may be most relevant in patients who are admitted with syncope, seizure, vertigo, and dehydration.
Our study has several limitations; most notably, the available evidence is limited in quality and quantity. Furthermore, omission of unpublished data may also lead to effect bias, though this would likely be in the direction of ineffective interventions supporting a conclusion that multidisciplinary efforts have had only a small impact on fall rates. Ideally, future studies can limit confounding variables through randomization. However, it is difficult to adequately blind when studying a multidisciplinary fall intervention that depends on patient and provider participation. As a result, none of the papers reviewed met criteria for high quality. However, almost all available data examined in this review came from large sample sizes in which thoughtful interventions were used. Since an inpatient fall will not affect the majority of patients, it was crucial for these studies to recruit a large sample size to have adequate power to detect a difference in fall rates. However, each study used risk assessment tools, which are poor indicators of who will and will not fall in the hospital.34, 39, 42 This may suggest a need for improved risk assessment tools, or be further evidence to include all patients in fall prevention regardless of risk. Quantitative synthesis of multidisciplinary fall interventions has the added limitation of comparing complex, multifaceted treatments that are not perfectly uniform. It is our opinion that interventions are semi‐standardized using the grouping methods employed in Table 3.
Preventing inpatient falls remains a difficult issue to address while convincing data is lacking. Based on current evidence, multidisciplinary fall prevention efforts on acutely ill inpatients show a possible small benefit and should be explored from a cost‐effectiveness standpoint to ensure they garner appropriate investment. Many resources are required to run such teams including nursing staff, equipment, physical and occupational therapy staff, pharmacists, and specialized staff training. We are unaware of any such cost‐effectiveness data available. Effective interventions may be those that maximize compliance through health information technology, maintain staff dedication, increase staff availability, improve risk assessment, or include all patients regardless of calculated fall risk, and take the patient's chief complaint into account in the fall prevention strategy. Where resources are limited, it appears most reasonable to focus on major risk factors for inpatient falls that have independently been shown to be detrimental to outcomes, such as delirium.51 Additionally, using inpatient fall rates as a hospital quality measure may be premature, given the lack of proven efforts to lower fall rates. Multidisciplinary fall prevention efforts on acutely ill inpatients should be further studied using high‐quality, randomized trials. It remains to be seen whether these large programs are cost‐effective, or on balance clinically effective.
- ,,.Patient accidents in hospital: incidence, documentation and significance.Br J Clin Pract.1994;48(2):63–66.
- ,,,.Serious falls in hospitalized patients: correlates and resource utilization.Am J Med.1995;99(2):137–143.
- ,,,.Hospital falls: a persistent problem.Am J Public Health.1985;75(7):775–777.
- ,,.Falls in the acute hospital setting—impact on resource utilisation.Aust Health Rev.2007;31(3):471–477.
- ,,.Incidence and risk factors for inpatient falls in an academic acute‐care hospital.J Nippon Med Sch.2006;73(5):265–270.
- ,,,.Do falls and falls‐injuries in hospital indicate negligent care—and how big is the risk? A retrospective analysis of the NHS Litigation Authority Database of clinical negligence claims, resulting from falls in hospitals in England 1995 to 2006.Qual Saf Health Care.2008;17(6):431–436.
- ,,,.Hospital falls: development of a predictive model for clinical practice.Appl Nurs Res.1995;8(3):129–139.
- ,.Centers for Medicare and Medicaid Services' “never events”: an analysis and recommendations to hospitals.Health Care Manag (Frederick).2008;27(4):338–349.
- ,,,.Falls and consequent injuries in hospitalized patients: effects of an interdisciplinary falls prevention program.BMC Health Serv Res.2006;6:69.
- .Immobility and falls.Clin Geriatr Med.1998;14(4):699–726.
- ,,.A case control study of falls in the hospital setting.J Gerontol Nurs.1998;24(12):7–15.
- ,,,.A retrospective analysis of patient falls.Can J Public Health.1985;76(2):116–118.
- ,,, et al.Characteristics and circumstances of falls in a hospital setting: a prospective analysis.J Gen Intern Med.2004;19(7):732–739.
- ,,, et al.Interventions for preventing falls in older people in nursing care facilities and hospitals.Cochrane Database Syst Rev.2010(1):CD005465.
- , L,,,,.Interventions for preventing falls in acute‐ and chronic‐care hospitals: a systematic review and meta‐analysis.J Am Geriatr Soc.2008;56(1):29–36.
- ,,, et al.Strategies to prevent falls and fractures in hospitals and care homes and effect of cognitive impairment: systematic review and meta‐analyses.BMJ.2007;334(7584):82.
- ,,,,,.Interventions for preventing falls in elderly people.Cochrane Database Syst Rev.2003(4):CD000340.
- ,,,.Introduction to Meta‐Analysis.Chichester, UK:John Wiley 2009.
- ,.Quantifying heterogeneity in a meta‐analysis.Stat Med.2002;21(11):1539–1558.
- .The power of the standard test for the presence of heterogeneity in meta‐analysis.Stat Med.2006;25(15):2688–2699.
- .A collaborative occupational therapy and nursing approach to falls prevention in hospital inpatients.J Qual Clin Pract.1999;19(4):215–220.
- ,,, et al.Fall prevention in acute care hospitals: a randomized trial.JAMA.2010;304(17):1912–1918.
- ,,,,,.Intervention to prevent falls on the medical service in a teaching hospital.Infect Control Hosp Epidemiol.2008;29(6):539–545.
- ,,, et al.Evaluation of a falls prevention programme in an acute tertiary care hospital.J Clin Nurs.2007;16(2):316–324.
- ,.Striving to prevent falls in an acute care setting—action to enhance quality.J Clin Nurs.1996;5(4):213–220.
- ,,, et al.Cluster randomised trial of a targeted multifactorial intervention to prevent falls among older people in hospital.BMJ.2008;336(7647):758–760.
- ,.Graphical displays for meta‐analysis: an overview with suggestions for practice.Res Syn Meth.2010(1):66–80.
- Centers for Medicare 37(7):317–325.
- ,‐M,, et al.Patient education to prevent falls among older hospital inpatients: a randomized controlled trial.Arch Intern Med.2011;117:516–524.
- ,.The relationship between patient blood pathology values and patient falls in an acute‐care setting: a retrospective analysis.Int J Nurs Pract.2005;11(4):161–168.
- ,,,.Falls risk factors in the hospital setting: a systematic review.Int J Nurs Pract.2001;7(1):38–45.
- ,,.A simplified fall‐risk assessment tool for patients hospitalized in medical wards.Isr Med Assoc J.2008;10(2):125–129.
- ,,,.Risk factors and risk assessment tools for falls in hospital in‐patients: a systematic review.Age Ageing.2004;33(2):122–130.
- ,,, et al.Circumstances of patient falls and injuries in 9 hospitals in a midwestern healthcare system.Infect Control Hosp Epidemiol.2007;28(5):544–550.
- ,,, et al.A case‐control study of patient, medication, and care‐related risk factors for inpatient falls.J Gen Intern Med.2005;20(2):116–122.
- .The experience of a community hospital in quantifying and reducing patient falls.J Nurs Care Qual.2000;14(3):43–53.
- ,,,.Characteristics of hospital inpatient falls across clinical departments.Gerontology.2008;54(6):342–348.
- ,.Falls risk prediction tools for hospital inpatients: do they work?Nurs Times.2009;105(7):18–21.
- ,,,.Accidental falls in hospital inpatients: evaluation of sensitivity and specificity of two risk assessment tools.J Adv Nurs.2010;66(3):690–696.
- ,,,,,.A systematic review and meta‐analysis of studies using the STRATIFY tool for prediction of falls in hospital patients: how well does it work?Age Ageing.2008;37(6):621–627.
- .Falls risk‐prediction tools for hospital inpatients. Time to put them to bed?Age Ageing.2008;37(3):248–250.
- ,,,,.Evaluation of three fall‐risk assessment tools in an acute care setting.J Adv Nurs.2007;60(4):427–435.
- ,,, et al.Fall prediction in inpatients by bedside nurses using the St. Thomas's Risk Assessment Tool in Falling Elderly Inpatients (STRATIFY) instrument: a multicenter study.J Am Geriatr Soc.2007;55(5):725–733.
- ,,,.Comparison of a fall risk assessment tool with nurses' judgement alone: a cluster‐randomised controlled trial.Age Ageing.2009;38(4):417–423.
- ,,,,.Fall risk‐assessment tools compared with clinical judgment: an evaluation in a rehabilitation ward.Age Ageing.2008;37(3):277–281.
- ,.Incidence of in‐hospital falls in geriatric patients before and after the introduction of an interdisciplinary team‐based fall‐prevention intervention.J Am Geriatr Soc.2007;55(12):2068–2074.
- ,,,.Sustained reduction in serious fall‐related injuries in older people in hospital.Med J Aust.2006;184(8):379–382.
- ,,, et al.The effect of changing practice on fall prevention in a rehabilitative hospital: the Hospital Injury Prevention Study.J Am Geriatr Soc.2004;52(3):335–339.
- ,,,.Effectiveness of targeted falls prevention programme in subacute hospital setting: randomised controlled trial.BMJ.2004;328(7441):676.
- ,,,,.Does delirium contribute to poor hospital outcomes? A three‐site epidemiologic study.J Gen Intern Med.1998;13(4):234–242.
- ,,.Patient accidents in hospital: incidence, documentation and significance.Br J Clin Pract.1994;48(2):63–66.
- ,,,.Serious falls in hospitalized patients: correlates and resource utilization.Am J Med.1995;99(2):137–143.
- ,,,.Hospital falls: a persistent problem.Am J Public Health.1985;75(7):775–777.
- ,,.Falls in the acute hospital setting—impact on resource utilisation.Aust Health Rev.2007;31(3):471–477.
- ,,.Incidence and risk factors for inpatient falls in an academic acute‐care hospital.J Nippon Med Sch.2006;73(5):265–270.
- ,,,.Do falls and falls‐injuries in hospital indicate negligent care—and how big is the risk? A retrospective analysis of the NHS Litigation Authority Database of clinical negligence claims, resulting from falls in hospitals in England 1995 to 2006.Qual Saf Health Care.2008;17(6):431–436.
- ,,,.Hospital falls: development of a predictive model for clinical practice.Appl Nurs Res.1995;8(3):129–139.
- ,.Centers for Medicare and Medicaid Services' “never events”: an analysis and recommendations to hospitals.Health Care Manag (Frederick).2008;27(4):338–349.
- ,,,.Falls and consequent injuries in hospitalized patients: effects of an interdisciplinary falls prevention program.BMC Health Serv Res.2006;6:69.
- .Immobility and falls.Clin Geriatr Med.1998;14(4):699–726.
- ,,.A case control study of falls in the hospital setting.J Gerontol Nurs.1998;24(12):7–15.
- ,,,.A retrospective analysis of patient falls.Can J Public Health.1985;76(2):116–118.
- ,,, et al.Characteristics and circumstances of falls in a hospital setting: a prospective analysis.J Gen Intern Med.2004;19(7):732–739.
- ,,, et al.Interventions for preventing falls in older people in nursing care facilities and hospitals.Cochrane Database Syst Rev.2010(1):CD005465.
- , L,,,,.Interventions for preventing falls in acute‐ and chronic‐care hospitals: a systematic review and meta‐analysis.J Am Geriatr Soc.2008;56(1):29–36.
- ,,, et al.Strategies to prevent falls and fractures in hospitals and care homes and effect of cognitive impairment: systematic review and meta‐analyses.BMJ.2007;334(7584):82.
- ,,,,,.Interventions for preventing falls in elderly people.Cochrane Database Syst Rev.2003(4):CD000340.
- ,,,.Introduction to Meta‐Analysis.Chichester, UK:John Wiley 2009.
- ,.Quantifying heterogeneity in a meta‐analysis.Stat Med.2002;21(11):1539–1558.
- .The power of the standard test for the presence of heterogeneity in meta‐analysis.Stat Med.2006;25(15):2688–2699.
- .A collaborative occupational therapy and nursing approach to falls prevention in hospital inpatients.J Qual Clin Pract.1999;19(4):215–220.
- ,,, et al.Fall prevention in acute care hospitals: a randomized trial.JAMA.2010;304(17):1912–1918.
- ,,,,,.Intervention to prevent falls on the medical service in a teaching hospital.Infect Control Hosp Epidemiol.2008;29(6):539–545.
- ,,, et al.Evaluation of a falls prevention programme in an acute tertiary care hospital.J Clin Nurs.2007;16(2):316–324.
- ,.Striving to prevent falls in an acute care setting—action to enhance quality.J Clin Nurs.1996;5(4):213–220.
- ,,, et al.Cluster randomised trial of a targeted multifactorial intervention to prevent falls among older people in hospital.BMJ.2008;336(7647):758–760.
- ,.Graphical displays for meta‐analysis: an overview with suggestions for practice.Res Syn Meth.2010(1):66–80.
- Centers for Medicare 37(7):317–325.
- ,‐M,, et al.Patient education to prevent falls among older hospital inpatients: a randomized controlled trial.Arch Intern Med.2011;117:516–524.
- ,.The relationship between patient blood pathology values and patient falls in an acute‐care setting: a retrospective analysis.Int J Nurs Pract.2005;11(4):161–168.
- ,,,.Falls risk factors in the hospital setting: a systematic review.Int J Nurs Pract.2001;7(1):38–45.
- ,,.A simplified fall‐risk assessment tool for patients hospitalized in medical wards.Isr Med Assoc J.2008;10(2):125–129.
- ,,,.Risk factors and risk assessment tools for falls in hospital in‐patients: a systematic review.Age Ageing.2004;33(2):122–130.
- ,,, et al.Circumstances of patient falls and injuries in 9 hospitals in a midwestern healthcare system.Infect Control Hosp Epidemiol.2007;28(5):544–550.
- ,,, et al.A case‐control study of patient, medication, and care‐related risk factors for inpatient falls.J Gen Intern Med.2005;20(2):116–122.
- .The experience of a community hospital in quantifying and reducing patient falls.J Nurs Care Qual.2000;14(3):43–53.
- ,,,.Characteristics of hospital inpatient falls across clinical departments.Gerontology.2008;54(6):342–348.
- ,.Falls risk prediction tools for hospital inpatients: do they work?Nurs Times.2009;105(7):18–21.
- ,,,.Accidental falls in hospital inpatients: evaluation of sensitivity and specificity of two risk assessment tools.J Adv Nurs.2010;66(3):690–696.
- ,,,,,.A systematic review and meta‐analysis of studies using the STRATIFY tool for prediction of falls in hospital patients: how well does it work?Age Ageing.2008;37(6):621–627.
- .Falls risk‐prediction tools for hospital inpatients. Time to put them to bed?Age Ageing.2008;37(3):248–250.
- ,,,,.Evaluation of three fall‐risk assessment tools in an acute care setting.J Adv Nurs.2007;60(4):427–435.
- ,,, et al.Fall prediction in inpatients by bedside nurses using the St. Thomas's Risk Assessment Tool in Falling Elderly Inpatients (STRATIFY) instrument: a multicenter study.J Am Geriatr Soc.2007;55(5):725–733.
- ,,,.Comparison of a fall risk assessment tool with nurses' judgement alone: a cluster‐randomised controlled trial.Age Ageing.2009;38(4):417–423.
- ,,,,.Fall risk‐assessment tools compared with clinical judgment: an evaluation in a rehabilitation ward.Age Ageing.2008;37(3):277–281.
- ,.Incidence of in‐hospital falls in geriatric patients before and after the introduction of an interdisciplinary team‐based fall‐prevention intervention.J Am Geriatr Soc.2007;55(12):2068–2074.
- ,,,.Sustained reduction in serious fall‐related injuries in older people in hospital.Med J Aust.2006;184(8):379–382.
- ,,, et al.The effect of changing practice on fall prevention in a rehabilitative hospital: the Hospital Injury Prevention Study.J Am Geriatr Soc.2004;52(3):335–339.
- ,,,.Effectiveness of targeted falls prevention programme in subacute hospital setting: randomised controlled trial.BMJ.2004;328(7441):676.
- ,,,,.Does delirium contribute to poor hospital outcomes? A three‐site epidemiologic study.J Gen Intern Med.1998;13(4):234–242.