User login
Treatment of Diabetes in Emergency Dept.
Current consensus guidelines from the American Diabetes Association and the American Association of Clinical Endocrinologists recommend the use of insulin‐based treatment protocols for most hospitalized patients with hyperglycemia.1 For noncritically ill patients, it is recommended to target a fasting blood glucose (BG) < 140 mg/dL and a random BG < 180‐200 mg/dL, without excess hypoglycemia. Prior studies recommended using a basal‐bolus insulin protocol that specifies starting doses and parameters for dose adjustment, applied by well‐educated teams of physicians and nurses.27 We have shown that insulin detemir given as a once‐daily basal injection coupled with rapid‐acting insulin aspart with meals is an effective regimen for managing hyperglycemia in hospitalized patients with type 2 diabetes.7 We and others have shown that once‐daily basal insulin mealtime rapid‐acting insulin is significantly more effective than sliding‐scale regular insulin in the hospital setting.6, 8
The majority of patients admitted to general medical units are first evaluated in the emergency department (ED), and significant hyperglycemia is not uncommon in ED patients. However, protocols for the treatment of hyperglycemia in the ED have not been widely implemented. Ginde et al studied 160 ED patients with a history of diabetes and BG > 200 mg/dL and found that although 73% were admitted to the hospital, only 31% were treated with insulin, and only 18% had a diagnosis of diabetes charted.9 A recent survey of 152 residents and attendings in 3 academic EDs found that only 32% would give insulin for a BG > 200 mg/dL, 59% for a BG > 250 mg/dL, and 91% for a BG > 300 mg/dL to ED patients with known diabetes.10 We completed a preliminary study of a novel protocol for the administration of subcutaneous insulin aspart in the ED at Rush University in 2008.11 We found that the mean BG was significantly lowered during an ED stay, from 333 to 158 mg/dL, and that the protocol was easily adopted by ED staff, with a low rate of hypoglycemia. Historically, only 35% of hyperglycemic patients with diabetes received insulin in our ED.11 Reasons for limited ED management of hyperglycemia may include presence of more critical issues, time and resource restriction, unfamiliarity with glycemic targets, and concerns regarding hypoglycemia.9, 10
In the current study we focused on 3 questions:
Could we further reduce the risk of hypoglycemia by modifying our original Rush ED insulin protocol? We reduced insulin aspart from 0.1 to 0.05 units/kg for BG 200‐299 mg/dL, from 0.15 to 0.1 units/kg for BG 300‐399 mg/dL, and from 0.2 to 0.15 units/kg for BG 400 mg/dL.
Could we couple our ED insulin aspart protocol with prompt initiation of a detemir‐aspart protocol in those patients who were subsequently admitted to general medical units from the ED?
Would the hospital length of stay, mean BG, and incidence of hypoglycemia be improved by the use of 2 back‐to‐back subcutaneous insulin protocols in a randomized clinical trial compared with the usual care provided in the ED and general medical inpatient units?
Research Design and Methods
From May 2008 through June 2009, patients presenting to the Rush University Medical Center ED with a history of type 2 diabetes and an initial point‐of‐care BG 200 mg/dL were randomized to an intervention group (INT) or to a usual care group (UC) after giving informed consent. Inclusion criteria for the study were: ages 18‐80 years, history of type 2 diabetes for at least 3 months, and prior therapy with dietary management, oral agents, or insulin. Patients were excluded if subsequently found to have diabetic ketoacidosis, hyperosmolar nonketotic syndrome, or critical illness requiring intensive care unit admission/direct surgical intervention. Other exclusion criteria included a positive pregnancy test or an inability to give informed consent secondary to acute drug or alcohol intoxication or active mental illness. Patients with clinically significant liver disease, with ALT or AST > 3 times the upper limit of normal, or with a history of end‐stage renal disease requiring dialysis were also excluded because of their increased risk of hypoglycemia, as they have required a more conservative insulin regimen. Similarly, we excluded patients with a history of type 1 diabetes because our aspart algorithm for the ED had only been tested in a type 2 diabetes population, and we did not want to disrupt the insulin regimen of type 1 diabetes patients, usually glargine‐based or an insulin pump.
The study consisted of 2 phases. Patients randomized to INT or UC in phase 1 stayed in their respective groups through phase 2. After informed consent was obtained by the study staff, implementation of the protocol was carried out by the ED staff. ED nurses were trained in the study protocol. During phase 1, INT patients received subcutaneous aspart every 2 hours while in the ED if BG was > 200 mg/dL. Aspart dosing per protocol was limited to 2 doses. Uncommonly, when a third dose of aspart was needed, physician input was requested. Aspart dosing was weight‐ and BG level based (0.05 units/kg for BG 200‐299 mg/dL, 0.1 units/kg for BG 300‐399 mg/dL, or 0.15 units/kg for BG 400mg/dL; see Supporting Appendix Fig. 1). Regardless of BG level, the ED aspart protocol was discontinued on patient discharge home or admission to the hospital. UC patients received treatment for hyperglycemia at the discretion of their ED physicians. INT subjects who required hospital admission were transitioned to basal‐bolus insulin therapy with detemir and aspart, receiving their first dose of detemir in the ED. Detemir dosing was weight‐based (0.3 units/kg) if the patient was not on home insulin or based on the patient's home dose of insulin (same dose for detemir, unit‐for‐unit conversion from glargine to detemir, or 80% of total NPH dose). If a patient received basal insulin prior to arrival, the first dose of detemir was held until 12 hours after the last dose of NPH or until 20 hours after the last dose of glargine or detemir. We found from our preliminary study that inadvertent overlaps in long‐acting insulin were one cause of hypoglycemia. We compared differences between groups in the final ED BG level, frequency of hypoglycemia, and ED length of stay (LOS).
Patients subsequently admitted to the hospital entered phase 2. During phase 2, INT patients had detemir and premeal aspart titrated by study staff using a predefined protocol (see Supporting Appendix Fig. 2). Detemir was given once daily, 24 hours after the initial ED dose. UC patients had their diabetes managed by medical house staff teams. House staff members have been educated on the Rush inpatient insulin protocol on which the INT protocol was based. The Rush inpatient diabetes protocol is implemented via a single computerized order set in which all patients should receive mealtime insulin using aspart and a basal insulin (glargine or detemir or NPH). We compared differences between groups in the mean admission BG level, mean daily BG level, mean BG level before each meal, hospital LOS, and frequency of hypoglycemic events. Moderate hypoglycemia was defined as a BG between 50 and 69 mg/dL, and severe hypoglycemia was defined as a BG < 50 mg/dL. We also compared the frequency of BG < 60 mg/dL.
The Rush University Medical Center institutional review board approved the study. Statistical analysis was done using SPSS version 11.0. The Student t test was used to determine any significant difference in BG means between the INT and UC groups. The Fisher's exact test or the chi‐square test was used to determine any difference in proportions of hypoglycemic events between INT and UC patients.
Results
Phase 1: Emergency Department
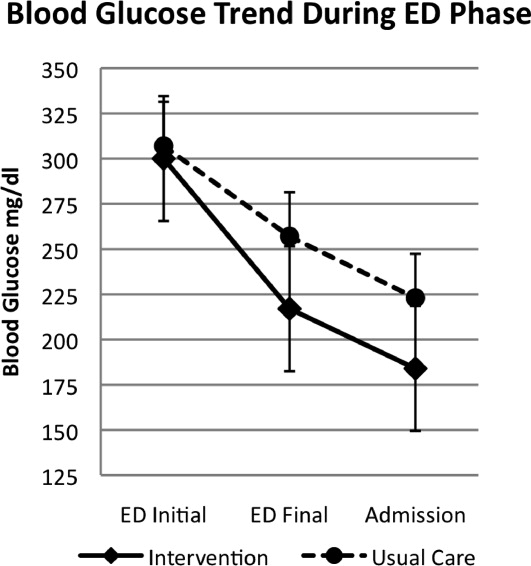
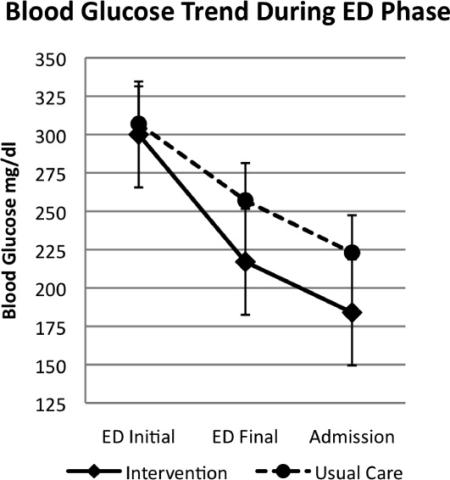
A total of 176 patients were randomized: 87 to the INT group and 89 to the UC group. Baseline characteristics were similar between groups (Table 1). Mean initial ED BG was similar: 300 70 mg/dL for INT patients and 307 82 mg/dL for UC patients. During phase 1, all INT patients were treated with aspart every 2 hours if BG > 200 mg/dL until discharge home or admission to the hospital. They received an initial mean insulin dose of 0.08 0.04 units/kg of subscutaneous aspart. Twenty‐five percent of INT patients received a second dose of aspart, and 3% received a third dose. For UC patients, only 55% received insulin therapy. Aspart was used for all UC patients who received insulin. Of those in the UC group who received insulin, 11% received a second dose for persistent hyperglycemia; none received a third dose. The mean initial ED BG for UC patients who received insulin was 358 73 mg/dL, and they received an initial mean dose of 0.11 0.05 units/kg. UC patients who did not receive insulin had a lower mean initial ED BG, 241 35 mg/dL. The mean final ED BG was 217 71 mg/dL for the INT group and 257 89 mg/dL for the UC group (P < .01; Fig. 1). The mean ED LOS was 30 minutes longer in the INT group (P = .06; Table 1). Sixty INT patients (69%) and 61 UC patients (69%) were admitted to the hospital. Fifty‐six percent of INT patients received the first dose of detemir based on their home insulin dose, and 44% received a weight‐based dose per protocol.
| Intervention (n = 87) | Usual Care (n = 89) | Significance | |
|---|---|---|---|
| |||
| Age (y) | 55 13 | 55 13 | |
| Sex (% male) | 48 | 39 | |
| BMI (kg/m2) | 34 9 | 33 9 | |
| Ethnicity (%) | |||
| African American | 58 | 66 | |
| Hispanic | 24 | 19 | |
| White | 15 | 11 | |
| Other | 3 | 4 | |
| Duration of diabetes (y) | 13 9 | 12 10 | |
| HA1C | 10.4 2.2 | 9.8 2.6 | |
| Insulin treatment at home (%) | 56 | 62 | |
| Presenting complaint/diagnosis (%) | |||
| Cardiac | 20 | 23 | |
| Gastrointestinal | 30 | 23 | |
| Hyperglycemia | 13 | 18 | |
| Infection | 9 | 11 | |
| Initial ED blood glucose (mg/dL) | 300 70 | 307 82 | |
| Final ED blood glucose (mg/dL) | 217 71 | 256 89 | P < .01 |
| ED length of stay (h) | 5.4 1.7 | 4.9 1.9 | P = .06 |
| Patients treated with insulin in ED (%) | 100 | 54 | |
| Initial dose of SQ aspart (units) | 7.9 4.2 | 9.5 4 | |
| ED patients admitted (%) | 69 | 69 | |
| Admission blood glucose (mg/dL) | 184 70 | 224 93 | P < .01 |
| Treatment of hyperglycemia in hospital (%) | |||
| Detemir aspart insulin | 100 | 7 | |
| Glargine aspart insulin | 0 | 36 | |
| NPH aspart insulin | 0 | 34 | |
| Oral agents | 0 | 8 | |
| None | 0 | 15 | |
| Hospital length of stay (days) | 2.7 2.0 | 3.1 1.9 | P = .58 |
Phase 2: Inpatient Setting
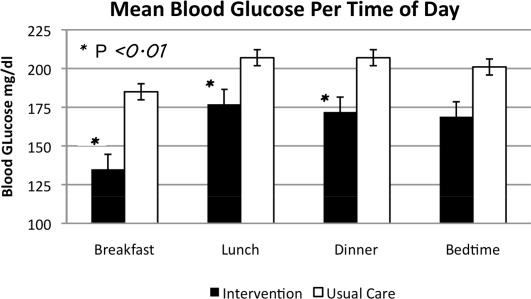
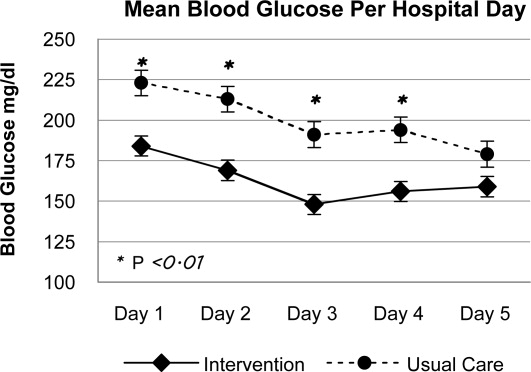
In phase 2, mean admission BG was significantly lower in the INT group (184 70 mg/dL) than in the UC group (223 93 mg/dL), P < .01, as a result of aspart given in the ED. The day 1 mean fasting BG for INT patients was 148 54 mg/dL, significantly lower than the day 1 mean fasting BG for UC patients: 212 81 mg/dL (P < .01). The mean fasting BG for the entire hospitalization was significantly lower for INT patients, 135 48 mg/dL, than for UC patients, 185 72 mg/dL (P < .01). During phase 2, all INT patients had detemir and aspart titrated daily per protocol. Treatment of UC patients was as follows: 78.5% with insulin, 8.2% with oral agents, and 11.5% did not receive medication for hyperglycemia. Of those in the UC group who received insulin, 36.0% were treated with lantus/aspart or detemir/aspart, 34.4% with NPH/aspart, 6.5% with lantus or detemir alone, and 1.6% with aspart alone. Overall, 76.9% of UC received basal insulin, and 70.4% received nutritional insulin. Only 47% of UC patients had insulin adjusted on a daily basis despite persistent hyperglycemia. Significant differences were also seen between INT and UC patients in mean prelunch and predinner BG levels, but not in mean bedtime BG level (Fig. 2). Mean daily BG levels for the initial 5 days of inpatient stay were significantly lower in the INT group (P < .01), except for day 5, when only 21 patients remained in the study (Fig. 3). Patient‐day weighted mean glucose was 163 39 mg/dL for INT patients versus 202 39 mg/dL for UC patients (P < .01). On admission, day 1 mean insulin total daily dose (TDD) was 0.65 0.26 units/kg for INT patients and 0.52 0.29 units/kg for UC patients. The final mean TDD was 0.75 0.35 units/kg for INT patients and 0.61 0.38 units/kg for UC patients. Mean hospital LOS was 9.6 hours shorter for INT patients (2.7 2 days) than for UC patients (3.1 1.9 days), P = .58.
Patient Safety: Frequency of Hypoglycemia
The frequency of hypoglycemia is shown in Table 2. During the ED phase, 3 UC patients (3.4%) had a BG < 50 mg/dL, and 2 INT patients (2.3%) had a BG of 67 mg/dL.
| Blood Glucose | Emergency Department (Number of Episodes) | Significance | Inpatient Phase (Patient Stays) | Significance | ||
|---|---|---|---|---|---|---|
| Usual Care | Intervention | Usual Care | Intervention | |||
| < 50 mg/dL | 3 | 0 | P = .50 | 6 | 1 | P = .11 |
| < 60 mg/dL | 3 | 0 | P = .50 | 7 | 8 | P = .98 |
| 5069 mg/dL | 0 | 2 | P = .23 | 6 | 12 | P = .20 |
During the hospital phase, INT patients had 4.3% of patient‐days and UC had 4.5% of patient‐days with any BG < 70 mg/dL. During 12 patient‐stays (20%) in the INT group there was an episode of moderate hypoglycemia, and during 1 patient‐stay (1.7%) there was an episode of severe hypoglycemia. During 6 patient‐stays (9.8%) in the UC group there was an episode of moderate hypoglycemia, and during 6 patient‐stays (9.8%) there was an episode of severe hypoglycemia (Table 2). The odds ratio (OR) for moderate hypoglycemia in the INT group compared with the UC group was 1.93 (95% CI, 0.7‐5.29), but for severe hypoglycemia the OR was 0.15 (95% CI, 0.018‐1.33). Moderate and severe hypoglycemic events in the UC group were split evenly between patients treated with glargine/detemir‐aspart and those treated with NPH‐aspart.
Discussion
This is the first randomized trial comparing the Rush Emergency Department Hyperglycemia Intervention (REDHI) protocol with usual care for the treatment of hyperglycemia in the ED. We believe this may be the first trial to initiate subcutaneous basal insulin therapy in the ED at the time of hospital admission. Initiation of our protocol for type 2 diabetic patients with BG > 200 mg/dL resulted in lower final ED and admission BGs compared with those in the UC group. Although a higher mean initial ED BG of 358 73 mg/dL was required to prompt initiation of insulin therapy for UC patients, 3 experienced severe hypoglycemia. By following the REDHI protocol, ED nurses avoided BG < 50 mg/dL in INT patients. Our first version of the REDHI protocol dosed more insulin than our current version, and we saw excess hypoglycemia.11 With a reduced dosing formula, there was less lowering of BG, but we eliminated all BG < 60 mg/dL. There was a trend toward an increased ED LOS in INT patients compared with UC patients. This may be because of delays in the administration of insulin or the requirement for a final BG check prior to discharge from the ED for INT patients. However, we did not receive feedback from ED nursing that either factor was a significant issue.
During phase 2, we observed improved glycemic control in INT, likely due to two factors: early initiation of basal insulin and protocol driven daily titration of both basal and mealtime insulin. We achieved a mean fasting BG of 148 54 mg/dL in INT the morning after the ED dose of detemir. BG levels in both groups continued to improve each day, but since the admission BG for INT was lower, this group maintained significantly lower BG levels throughout most of the hospitalization. There were also significant differences between groups at different times of day. Basal doses for INT patients were adjusted daily per fasting BG. Scheduled mealtime doses were based on the basal dose; each mealtime aspart dose was a third of the basal detemir dose. Therefore, patients who required larger doses for certain meals may have received less aspart than needed. This may explain why fasting BG control was better than BG control later in the day.
Current Rush guidelines recommend the same insulin doses as those that our intervention used, but patients in the UC group were less likely to have insulin titrated daily. Cook et al found that clinical inertia, or failure of health care providers to initiate or intensify therapy when indicated, is a common problem among medical residents treating inpatients with insulin.15 Reasons for clinical inertia may include unawareness of inpatient glycemic targets, lack of training or confidence in titrating insulin, and concerns regarding hypoglycemia. Our study shows that this is still an operative issue, even after residents have participated in multiple small‐group educational sessions. Details of the Rush inpatient insulin protocol are also on pocket cards distributed to residents. However, fewer than half of UC patients had insulin adjusted appropriately for persistent hyperglycemia. This may be one explanation for the improved control seen in the INT group and underscores the importance of daily dose titrations based on a uniform protocol.
During phase 2, despite improved glycemic control in INT, there was no significant difference in rates of hypoglycemia between the groups. The number of patient‐stays with moderate hypoglycemia was more in the INT group than in the UC group, 12 versus 6, respectively, but not statistically different (P = .20). There was a trend toward fewer patient‐stays with severe hypoglycemia in the INT group than in the UC group, 1 versus 6, respectively (P = .11).
Other studies have described improved inpatient glycemic control without excess hypoglycemia. In the RABBIT 2 trial, institution of a glargine‐glulisine insulin protocol, TTD of 0.4‐5 units/kg, among insulin‐naive inpatients resulted in a mean fasting BG of 147 36 mg/dL and a mean hospital BG of 166 32 mg/dL, with 3% of patient‐stays having a BG < 60 mg/dL.6 In a second trial, detemir‐aspart was compared with NPH‐aspart TTD of 0.4‐5 units/kg.7 Both groups achieved a similar mean fasting BG of 146 mg/dL and a mean hospital BG of 157 mg/dL. However, the rate of hypoglycemia was higher: 29% of patient‐stays overall. In our study, we achieved a mean fasting BG of 135 48 mg/dL and a mean hospital BG of 163 40 mg/dL in the INT group, using a mean initial TTD of 0.65 0.23 units/kg. The frequency of hypoglycemia in this trial, 22% of INT patient‐stays and 20% of UC patient‐stays, was less than that in Umpierrez et al,7 despite a lower mean fasting BG in our current trial. Maynard et al found 16% of patient‐stays and 3% of patient‐days had an episode of BG < 60 mg/dL in a trial of glarginerapid‐acting insulin (0.4‐5 units/kg TTD).12 Schnipper et al found that 6.1% of patient‐days had an episode of BG < 60 mg/dL using either glargine or NPH and a rapid‐acting insulin, TTD 0.6 units/kg.13 Our hypoglycemia rates were higher; however, we defined hypoglycemia as BG < 70 mg/dL, as suggested by the ADA workgroup.14 If we use a cutoff of < 60 mg/dL for hypoglycemia, it occurred in 13.3% of patient‐stays and 4.3% of patient‐days in the INT group, comparable to that in previous studies.
Our study has several limitations. First, this was a single‐center study, and our ED protocol should be tested in other ED settings, both academic and community. Second, although there were trends toward lower rates of severe hypoglycemia in the INT group, the study was underpowered to detect possible significant differences. Third, although ED nurses implemented the study protocol, study staff closely monitored nurses to ensure adherence. Therefore, it is difficult to speculate on protocol adherence under normal circumstances. Successful implementation requires ongoing nursing and medical staff education. A fourth limitation is the absence of patients with type 1 diabetes.
In conclusion we demonstrated that weight‐based subcutaneous aspart insulin therapy begun in the ED, coupled with prompt initiation of a detemir‐aspart insulin protocol, results in rapid correction of hyperglycemia and improved inpatient glycemic control without increasing hypoglycemia. Diabetes is a common comorbidity in patients presenting to the ED that is not uniformly addressed. These patients may present with uncontrolled hyperglycemia or diabetes‐related infections, and prompt, efficacious glucose control is important. The nurse‐driven Rush ED hyperglycemia protocol ensures that hyperglycemia is safely addressed, allowing the ED physician to address more critical issues. By initiating basal insulin in the ED, our protocol allows for a prompt and smooth transition to a basal‐bolus insulin regimen for the inpatient setting.
- ,,, et al.American Association of Clinical Endocrinologists and American Diabetes Association Consensus Statement on Inpatient Glycemic Control.Diabetes Care.2009;32:1119–1131.
- ,,, et al.Management of diabetes and hyperglycemia in hospitals.Diabetes Care.2004;27:553–591.
- ,,,Eliminating inpatient sliding scale insulin: a re‐education project with medical house staff.Diabetes Care.2008;28:1008–1011.
- ,,, et al.Reduction of surgical mortality and morbidity in diabetic patients undergoing cardiac surgery with a combined intravenous and subcutaneous insulin glucose management strategy.Diabetes Care.2007;30:823–828.
- ,,.Comparison of once daily glargine insulin with twice‐daily NPH/Regular insulin for control of hyperglycemia in inpatients after cardiovascular surgery.Diabetes Technol Ther.2006;8:609–616.
- ,,, et al.Randomized study of basal‐bolus insulin therapy in the inpatient management of patients with type 2 diabetes (RABBIT 2 trial).Diabetes Care.2007;30:2181–2186.
- ,,, et al.Comparison of inpatient insulin regimens with detemir plus aspart versus neutral protamine Hagedorn plus regular in medical patients with type 2 diabetes.J Clin Endocrinol Metab.2009;94:564–569.
- ,,,.Once daily insulin glargine vs. six hourly sliding scale regular insulin for control of hyperglycemia after bariatric surgery: a randomized clinical trial.Endocr Pract.2007;13:225–231.
- ,,.Limited communication and management of emergency department hyperglycemia in hospitalized patients.J Hosp Med.2009;4:44–49.
- ,,,.Multicenter survey of emergency physician management and referral for hyperglycemia.J Emerg Med.2010;38:264–272.
- ,,,,Impact of a nurse‐driven subcutaneous insulin protocol: Rush Emergency Department Hyperglycemia Intervention (REDHI).J Emerg Med.2008 [Epub ahead of print].
- ,,,,.Improved inpatient use of basal insulin, reduced hypoglycemia, and improved glycemic control: effect of structured subcutaneous insulin orders and an insulin management algorithm.J Hosp Med.2009;4:3–15.
- ,,,.Effects of a subcutaneous insulin protocol, clinical education, and computerized order set on the quality of inpatient management of hyperglycemia: results of a clinical trial.J Hosp Med.2009;4:16–27.
- ADA Workgroup on Hypoglycemia.Defining and reporting hypoglycemia in diabetes.Diabetes Care.2005;28:1245–1249.
- ,, et al.Diabetes care in hospitalized noncritically ill patients: More evidence for clinical inertia and negative therapeutic momentum.J Hosp Med.2007;2:203–211.
Current consensus guidelines from the American Diabetes Association and the American Association of Clinical Endocrinologists recommend the use of insulin‐based treatment protocols for most hospitalized patients with hyperglycemia.1 For noncritically ill patients, it is recommended to target a fasting blood glucose (BG) < 140 mg/dL and a random BG < 180‐200 mg/dL, without excess hypoglycemia. Prior studies recommended using a basal‐bolus insulin protocol that specifies starting doses and parameters for dose adjustment, applied by well‐educated teams of physicians and nurses.27 We have shown that insulin detemir given as a once‐daily basal injection coupled with rapid‐acting insulin aspart with meals is an effective regimen for managing hyperglycemia in hospitalized patients with type 2 diabetes.7 We and others have shown that once‐daily basal insulin mealtime rapid‐acting insulin is significantly more effective than sliding‐scale regular insulin in the hospital setting.6, 8
The majority of patients admitted to general medical units are first evaluated in the emergency department (ED), and significant hyperglycemia is not uncommon in ED patients. However, protocols for the treatment of hyperglycemia in the ED have not been widely implemented. Ginde et al studied 160 ED patients with a history of diabetes and BG > 200 mg/dL and found that although 73% were admitted to the hospital, only 31% were treated with insulin, and only 18% had a diagnosis of diabetes charted.9 A recent survey of 152 residents and attendings in 3 academic EDs found that only 32% would give insulin for a BG > 200 mg/dL, 59% for a BG > 250 mg/dL, and 91% for a BG > 300 mg/dL to ED patients with known diabetes.10 We completed a preliminary study of a novel protocol for the administration of subcutaneous insulin aspart in the ED at Rush University in 2008.11 We found that the mean BG was significantly lowered during an ED stay, from 333 to 158 mg/dL, and that the protocol was easily adopted by ED staff, with a low rate of hypoglycemia. Historically, only 35% of hyperglycemic patients with diabetes received insulin in our ED.11 Reasons for limited ED management of hyperglycemia may include presence of more critical issues, time and resource restriction, unfamiliarity with glycemic targets, and concerns regarding hypoglycemia.9, 10
In the current study we focused on 3 questions:
Could we further reduce the risk of hypoglycemia by modifying our original Rush ED insulin protocol? We reduced insulin aspart from 0.1 to 0.05 units/kg for BG 200‐299 mg/dL, from 0.15 to 0.1 units/kg for BG 300‐399 mg/dL, and from 0.2 to 0.15 units/kg for BG 400 mg/dL.
Could we couple our ED insulin aspart protocol with prompt initiation of a detemir‐aspart protocol in those patients who were subsequently admitted to general medical units from the ED?
Would the hospital length of stay, mean BG, and incidence of hypoglycemia be improved by the use of 2 back‐to‐back subcutaneous insulin protocols in a randomized clinical trial compared with the usual care provided in the ED and general medical inpatient units?
Research Design and Methods
From May 2008 through June 2009, patients presenting to the Rush University Medical Center ED with a history of type 2 diabetes and an initial point‐of‐care BG 200 mg/dL were randomized to an intervention group (INT) or to a usual care group (UC) after giving informed consent. Inclusion criteria for the study were: ages 18‐80 years, history of type 2 diabetes for at least 3 months, and prior therapy with dietary management, oral agents, or insulin. Patients were excluded if subsequently found to have diabetic ketoacidosis, hyperosmolar nonketotic syndrome, or critical illness requiring intensive care unit admission/direct surgical intervention. Other exclusion criteria included a positive pregnancy test or an inability to give informed consent secondary to acute drug or alcohol intoxication or active mental illness. Patients with clinically significant liver disease, with ALT or AST > 3 times the upper limit of normal, or with a history of end‐stage renal disease requiring dialysis were also excluded because of their increased risk of hypoglycemia, as they have required a more conservative insulin regimen. Similarly, we excluded patients with a history of type 1 diabetes because our aspart algorithm for the ED had only been tested in a type 2 diabetes population, and we did not want to disrupt the insulin regimen of type 1 diabetes patients, usually glargine‐based or an insulin pump.
The study consisted of 2 phases. Patients randomized to INT or UC in phase 1 stayed in their respective groups through phase 2. After informed consent was obtained by the study staff, implementation of the protocol was carried out by the ED staff. ED nurses were trained in the study protocol. During phase 1, INT patients received subcutaneous aspart every 2 hours while in the ED if BG was > 200 mg/dL. Aspart dosing per protocol was limited to 2 doses. Uncommonly, when a third dose of aspart was needed, physician input was requested. Aspart dosing was weight‐ and BG level based (0.05 units/kg for BG 200‐299 mg/dL, 0.1 units/kg for BG 300‐399 mg/dL, or 0.15 units/kg for BG 400mg/dL; see Supporting Appendix Fig. 1). Regardless of BG level, the ED aspart protocol was discontinued on patient discharge home or admission to the hospital. UC patients received treatment for hyperglycemia at the discretion of their ED physicians. INT subjects who required hospital admission were transitioned to basal‐bolus insulin therapy with detemir and aspart, receiving their first dose of detemir in the ED. Detemir dosing was weight‐based (0.3 units/kg) if the patient was not on home insulin or based on the patient's home dose of insulin (same dose for detemir, unit‐for‐unit conversion from glargine to detemir, or 80% of total NPH dose). If a patient received basal insulin prior to arrival, the first dose of detemir was held until 12 hours after the last dose of NPH or until 20 hours after the last dose of glargine or detemir. We found from our preliminary study that inadvertent overlaps in long‐acting insulin were one cause of hypoglycemia. We compared differences between groups in the final ED BG level, frequency of hypoglycemia, and ED length of stay (LOS).
Patients subsequently admitted to the hospital entered phase 2. During phase 2, INT patients had detemir and premeal aspart titrated by study staff using a predefined protocol (see Supporting Appendix Fig. 2). Detemir was given once daily, 24 hours after the initial ED dose. UC patients had their diabetes managed by medical house staff teams. House staff members have been educated on the Rush inpatient insulin protocol on which the INT protocol was based. The Rush inpatient diabetes protocol is implemented via a single computerized order set in which all patients should receive mealtime insulin using aspart and a basal insulin (glargine or detemir or NPH). We compared differences between groups in the mean admission BG level, mean daily BG level, mean BG level before each meal, hospital LOS, and frequency of hypoglycemic events. Moderate hypoglycemia was defined as a BG between 50 and 69 mg/dL, and severe hypoglycemia was defined as a BG < 50 mg/dL. We also compared the frequency of BG < 60 mg/dL.
The Rush University Medical Center institutional review board approved the study. Statistical analysis was done using SPSS version 11.0. The Student t test was used to determine any significant difference in BG means between the INT and UC groups. The Fisher's exact test or the chi‐square test was used to determine any difference in proportions of hypoglycemic events between INT and UC patients.
Results
Phase 1: Emergency Department
A total of 176 patients were randomized: 87 to the INT group and 89 to the UC group. Baseline characteristics were similar between groups (Table 1). Mean initial ED BG was similar: 300 70 mg/dL for INT patients and 307 82 mg/dL for UC patients. During phase 1, all INT patients were treated with aspart every 2 hours if BG > 200 mg/dL until discharge home or admission to the hospital. They received an initial mean insulin dose of 0.08 0.04 units/kg of subscutaneous aspart. Twenty‐five percent of INT patients received a second dose of aspart, and 3% received a third dose. For UC patients, only 55% received insulin therapy. Aspart was used for all UC patients who received insulin. Of those in the UC group who received insulin, 11% received a second dose for persistent hyperglycemia; none received a third dose. The mean initial ED BG for UC patients who received insulin was 358 73 mg/dL, and they received an initial mean dose of 0.11 0.05 units/kg. UC patients who did not receive insulin had a lower mean initial ED BG, 241 35 mg/dL. The mean final ED BG was 217 71 mg/dL for the INT group and 257 89 mg/dL for the UC group (P < .01; Fig. 1). The mean ED LOS was 30 minutes longer in the INT group (P = .06; Table 1). Sixty INT patients (69%) and 61 UC patients (69%) were admitted to the hospital. Fifty‐six percent of INT patients received the first dose of detemir based on their home insulin dose, and 44% received a weight‐based dose per protocol.
| Intervention (n = 87) | Usual Care (n = 89) | Significance | |
|---|---|---|---|
| |||
| Age (y) | 55 13 | 55 13 | |
| Sex (% male) | 48 | 39 | |
| BMI (kg/m2) | 34 9 | 33 9 | |
| Ethnicity (%) | |||
| African American | 58 | 66 | |
| Hispanic | 24 | 19 | |
| White | 15 | 11 | |
| Other | 3 | 4 | |
| Duration of diabetes (y) | 13 9 | 12 10 | |
| HA1C | 10.4 2.2 | 9.8 2.6 | |
| Insulin treatment at home (%) | 56 | 62 | |
| Presenting complaint/diagnosis (%) | |||
| Cardiac | 20 | 23 | |
| Gastrointestinal | 30 | 23 | |
| Hyperglycemia | 13 | 18 | |
| Infection | 9 | 11 | |
| Initial ED blood glucose (mg/dL) | 300 70 | 307 82 | |
| Final ED blood glucose (mg/dL) | 217 71 | 256 89 | P < .01 |
| ED length of stay (h) | 5.4 1.7 | 4.9 1.9 | P = .06 |
| Patients treated with insulin in ED (%) | 100 | 54 | |
| Initial dose of SQ aspart (units) | 7.9 4.2 | 9.5 4 | |
| ED patients admitted (%) | 69 | 69 | |
| Admission blood glucose (mg/dL) | 184 70 | 224 93 | P < .01 |
| Treatment of hyperglycemia in hospital (%) | |||
| Detemir aspart insulin | 100 | 7 | |
| Glargine aspart insulin | 0 | 36 | |
| NPH aspart insulin | 0 | 34 | |
| Oral agents | 0 | 8 | |
| None | 0 | 15 | |
| Hospital length of stay (days) | 2.7 2.0 | 3.1 1.9 | P = .58 |
Phase 2: Inpatient Setting
In phase 2, mean admission BG was significantly lower in the INT group (184 70 mg/dL) than in the UC group (223 93 mg/dL), P < .01, as a result of aspart given in the ED. The day 1 mean fasting BG for INT patients was 148 54 mg/dL, significantly lower than the day 1 mean fasting BG for UC patients: 212 81 mg/dL (P < .01). The mean fasting BG for the entire hospitalization was significantly lower for INT patients, 135 48 mg/dL, than for UC patients, 185 72 mg/dL (P < .01). During phase 2, all INT patients had detemir and aspart titrated daily per protocol. Treatment of UC patients was as follows: 78.5% with insulin, 8.2% with oral agents, and 11.5% did not receive medication for hyperglycemia. Of those in the UC group who received insulin, 36.0% were treated with lantus/aspart or detemir/aspart, 34.4% with NPH/aspart, 6.5% with lantus or detemir alone, and 1.6% with aspart alone. Overall, 76.9% of UC received basal insulin, and 70.4% received nutritional insulin. Only 47% of UC patients had insulin adjusted on a daily basis despite persistent hyperglycemia. Significant differences were also seen between INT and UC patients in mean prelunch and predinner BG levels, but not in mean bedtime BG level (Fig. 2). Mean daily BG levels for the initial 5 days of inpatient stay were significantly lower in the INT group (P < .01), except for day 5, when only 21 patients remained in the study (Fig. 3). Patient‐day weighted mean glucose was 163 39 mg/dL for INT patients versus 202 39 mg/dL for UC patients (P < .01). On admission, day 1 mean insulin total daily dose (TDD) was 0.65 0.26 units/kg for INT patients and 0.52 0.29 units/kg for UC patients. The final mean TDD was 0.75 0.35 units/kg for INT patients and 0.61 0.38 units/kg for UC patients. Mean hospital LOS was 9.6 hours shorter for INT patients (2.7 2 days) than for UC patients (3.1 1.9 days), P = .58.
Patient Safety: Frequency of Hypoglycemia
The frequency of hypoglycemia is shown in Table 2. During the ED phase, 3 UC patients (3.4%) had a BG < 50 mg/dL, and 2 INT patients (2.3%) had a BG of 67 mg/dL.
| Blood Glucose | Emergency Department (Number of Episodes) | Significance | Inpatient Phase (Patient Stays) | Significance | ||
|---|---|---|---|---|---|---|
| Usual Care | Intervention | Usual Care | Intervention | |||
| < 50 mg/dL | 3 | 0 | P = .50 | 6 | 1 | P = .11 |
| < 60 mg/dL | 3 | 0 | P = .50 | 7 | 8 | P = .98 |
| 5069 mg/dL | 0 | 2 | P = .23 | 6 | 12 | P = .20 |
During the hospital phase, INT patients had 4.3% of patient‐days and UC had 4.5% of patient‐days with any BG < 70 mg/dL. During 12 patient‐stays (20%) in the INT group there was an episode of moderate hypoglycemia, and during 1 patient‐stay (1.7%) there was an episode of severe hypoglycemia. During 6 patient‐stays (9.8%) in the UC group there was an episode of moderate hypoglycemia, and during 6 patient‐stays (9.8%) there was an episode of severe hypoglycemia (Table 2). The odds ratio (OR) for moderate hypoglycemia in the INT group compared with the UC group was 1.93 (95% CI, 0.7‐5.29), but for severe hypoglycemia the OR was 0.15 (95% CI, 0.018‐1.33). Moderate and severe hypoglycemic events in the UC group were split evenly between patients treated with glargine/detemir‐aspart and those treated with NPH‐aspart.
Discussion
This is the first randomized trial comparing the Rush Emergency Department Hyperglycemia Intervention (REDHI) protocol with usual care for the treatment of hyperglycemia in the ED. We believe this may be the first trial to initiate subcutaneous basal insulin therapy in the ED at the time of hospital admission. Initiation of our protocol for type 2 diabetic patients with BG > 200 mg/dL resulted in lower final ED and admission BGs compared with those in the UC group. Although a higher mean initial ED BG of 358 73 mg/dL was required to prompt initiation of insulin therapy for UC patients, 3 experienced severe hypoglycemia. By following the REDHI protocol, ED nurses avoided BG < 50 mg/dL in INT patients. Our first version of the REDHI protocol dosed more insulin than our current version, and we saw excess hypoglycemia.11 With a reduced dosing formula, there was less lowering of BG, but we eliminated all BG < 60 mg/dL. There was a trend toward an increased ED LOS in INT patients compared with UC patients. This may be because of delays in the administration of insulin or the requirement for a final BG check prior to discharge from the ED for INT patients. However, we did not receive feedback from ED nursing that either factor was a significant issue.
During phase 2, we observed improved glycemic control in INT, likely due to two factors: early initiation of basal insulin and protocol driven daily titration of both basal and mealtime insulin. We achieved a mean fasting BG of 148 54 mg/dL in INT the morning after the ED dose of detemir. BG levels in both groups continued to improve each day, but since the admission BG for INT was lower, this group maintained significantly lower BG levels throughout most of the hospitalization. There were also significant differences between groups at different times of day. Basal doses for INT patients were adjusted daily per fasting BG. Scheduled mealtime doses were based on the basal dose; each mealtime aspart dose was a third of the basal detemir dose. Therefore, patients who required larger doses for certain meals may have received less aspart than needed. This may explain why fasting BG control was better than BG control later in the day.
Current Rush guidelines recommend the same insulin doses as those that our intervention used, but patients in the UC group were less likely to have insulin titrated daily. Cook et al found that clinical inertia, or failure of health care providers to initiate or intensify therapy when indicated, is a common problem among medical residents treating inpatients with insulin.15 Reasons for clinical inertia may include unawareness of inpatient glycemic targets, lack of training or confidence in titrating insulin, and concerns regarding hypoglycemia. Our study shows that this is still an operative issue, even after residents have participated in multiple small‐group educational sessions. Details of the Rush inpatient insulin protocol are also on pocket cards distributed to residents. However, fewer than half of UC patients had insulin adjusted appropriately for persistent hyperglycemia. This may be one explanation for the improved control seen in the INT group and underscores the importance of daily dose titrations based on a uniform protocol.
During phase 2, despite improved glycemic control in INT, there was no significant difference in rates of hypoglycemia between the groups. The number of patient‐stays with moderate hypoglycemia was more in the INT group than in the UC group, 12 versus 6, respectively, but not statistically different (P = .20). There was a trend toward fewer patient‐stays with severe hypoglycemia in the INT group than in the UC group, 1 versus 6, respectively (P = .11).
Other studies have described improved inpatient glycemic control without excess hypoglycemia. In the RABBIT 2 trial, institution of a glargine‐glulisine insulin protocol, TTD of 0.4‐5 units/kg, among insulin‐naive inpatients resulted in a mean fasting BG of 147 36 mg/dL and a mean hospital BG of 166 32 mg/dL, with 3% of patient‐stays having a BG < 60 mg/dL.6 In a second trial, detemir‐aspart was compared with NPH‐aspart TTD of 0.4‐5 units/kg.7 Both groups achieved a similar mean fasting BG of 146 mg/dL and a mean hospital BG of 157 mg/dL. However, the rate of hypoglycemia was higher: 29% of patient‐stays overall. In our study, we achieved a mean fasting BG of 135 48 mg/dL and a mean hospital BG of 163 40 mg/dL in the INT group, using a mean initial TTD of 0.65 0.23 units/kg. The frequency of hypoglycemia in this trial, 22% of INT patient‐stays and 20% of UC patient‐stays, was less than that in Umpierrez et al,7 despite a lower mean fasting BG in our current trial. Maynard et al found 16% of patient‐stays and 3% of patient‐days had an episode of BG < 60 mg/dL in a trial of glarginerapid‐acting insulin (0.4‐5 units/kg TTD).12 Schnipper et al found that 6.1% of patient‐days had an episode of BG < 60 mg/dL using either glargine or NPH and a rapid‐acting insulin, TTD 0.6 units/kg.13 Our hypoglycemia rates were higher; however, we defined hypoglycemia as BG < 70 mg/dL, as suggested by the ADA workgroup.14 If we use a cutoff of < 60 mg/dL for hypoglycemia, it occurred in 13.3% of patient‐stays and 4.3% of patient‐days in the INT group, comparable to that in previous studies.
Our study has several limitations. First, this was a single‐center study, and our ED protocol should be tested in other ED settings, both academic and community. Second, although there were trends toward lower rates of severe hypoglycemia in the INT group, the study was underpowered to detect possible significant differences. Third, although ED nurses implemented the study protocol, study staff closely monitored nurses to ensure adherence. Therefore, it is difficult to speculate on protocol adherence under normal circumstances. Successful implementation requires ongoing nursing and medical staff education. A fourth limitation is the absence of patients with type 1 diabetes.
In conclusion we demonstrated that weight‐based subcutaneous aspart insulin therapy begun in the ED, coupled with prompt initiation of a detemir‐aspart insulin protocol, results in rapid correction of hyperglycemia and improved inpatient glycemic control without increasing hypoglycemia. Diabetes is a common comorbidity in patients presenting to the ED that is not uniformly addressed. These patients may present with uncontrolled hyperglycemia or diabetes‐related infections, and prompt, efficacious glucose control is important. The nurse‐driven Rush ED hyperglycemia protocol ensures that hyperglycemia is safely addressed, allowing the ED physician to address more critical issues. By initiating basal insulin in the ED, our protocol allows for a prompt and smooth transition to a basal‐bolus insulin regimen for the inpatient setting.
Current consensus guidelines from the American Diabetes Association and the American Association of Clinical Endocrinologists recommend the use of insulin‐based treatment protocols for most hospitalized patients with hyperglycemia.1 For noncritically ill patients, it is recommended to target a fasting blood glucose (BG) < 140 mg/dL and a random BG < 180‐200 mg/dL, without excess hypoglycemia. Prior studies recommended using a basal‐bolus insulin protocol that specifies starting doses and parameters for dose adjustment, applied by well‐educated teams of physicians and nurses.27 We have shown that insulin detemir given as a once‐daily basal injection coupled with rapid‐acting insulin aspart with meals is an effective regimen for managing hyperglycemia in hospitalized patients with type 2 diabetes.7 We and others have shown that once‐daily basal insulin mealtime rapid‐acting insulin is significantly more effective than sliding‐scale regular insulin in the hospital setting.6, 8
The majority of patients admitted to general medical units are first evaluated in the emergency department (ED), and significant hyperglycemia is not uncommon in ED patients. However, protocols for the treatment of hyperglycemia in the ED have not been widely implemented. Ginde et al studied 160 ED patients with a history of diabetes and BG > 200 mg/dL and found that although 73% were admitted to the hospital, only 31% were treated with insulin, and only 18% had a diagnosis of diabetes charted.9 A recent survey of 152 residents and attendings in 3 academic EDs found that only 32% would give insulin for a BG > 200 mg/dL, 59% for a BG > 250 mg/dL, and 91% for a BG > 300 mg/dL to ED patients with known diabetes.10 We completed a preliminary study of a novel protocol for the administration of subcutaneous insulin aspart in the ED at Rush University in 2008.11 We found that the mean BG was significantly lowered during an ED stay, from 333 to 158 mg/dL, and that the protocol was easily adopted by ED staff, with a low rate of hypoglycemia. Historically, only 35% of hyperglycemic patients with diabetes received insulin in our ED.11 Reasons for limited ED management of hyperglycemia may include presence of more critical issues, time and resource restriction, unfamiliarity with glycemic targets, and concerns regarding hypoglycemia.9, 10
In the current study we focused on 3 questions:
Could we further reduce the risk of hypoglycemia by modifying our original Rush ED insulin protocol? We reduced insulin aspart from 0.1 to 0.05 units/kg for BG 200‐299 mg/dL, from 0.15 to 0.1 units/kg for BG 300‐399 mg/dL, and from 0.2 to 0.15 units/kg for BG 400 mg/dL.
Could we couple our ED insulin aspart protocol with prompt initiation of a detemir‐aspart protocol in those patients who were subsequently admitted to general medical units from the ED?
Would the hospital length of stay, mean BG, and incidence of hypoglycemia be improved by the use of 2 back‐to‐back subcutaneous insulin protocols in a randomized clinical trial compared with the usual care provided in the ED and general medical inpatient units?
Research Design and Methods
From May 2008 through June 2009, patients presenting to the Rush University Medical Center ED with a history of type 2 diabetes and an initial point‐of‐care BG 200 mg/dL were randomized to an intervention group (INT) or to a usual care group (UC) after giving informed consent. Inclusion criteria for the study were: ages 18‐80 years, history of type 2 diabetes for at least 3 months, and prior therapy with dietary management, oral agents, or insulin. Patients were excluded if subsequently found to have diabetic ketoacidosis, hyperosmolar nonketotic syndrome, or critical illness requiring intensive care unit admission/direct surgical intervention. Other exclusion criteria included a positive pregnancy test or an inability to give informed consent secondary to acute drug or alcohol intoxication or active mental illness. Patients with clinically significant liver disease, with ALT or AST > 3 times the upper limit of normal, or with a history of end‐stage renal disease requiring dialysis were also excluded because of their increased risk of hypoglycemia, as they have required a more conservative insulin regimen. Similarly, we excluded patients with a history of type 1 diabetes because our aspart algorithm for the ED had only been tested in a type 2 diabetes population, and we did not want to disrupt the insulin regimen of type 1 diabetes patients, usually glargine‐based or an insulin pump.
The study consisted of 2 phases. Patients randomized to INT or UC in phase 1 stayed in their respective groups through phase 2. After informed consent was obtained by the study staff, implementation of the protocol was carried out by the ED staff. ED nurses were trained in the study protocol. During phase 1, INT patients received subcutaneous aspart every 2 hours while in the ED if BG was > 200 mg/dL. Aspart dosing per protocol was limited to 2 doses. Uncommonly, when a third dose of aspart was needed, physician input was requested. Aspart dosing was weight‐ and BG level based (0.05 units/kg for BG 200‐299 mg/dL, 0.1 units/kg for BG 300‐399 mg/dL, or 0.15 units/kg for BG 400mg/dL; see Supporting Appendix Fig. 1). Regardless of BG level, the ED aspart protocol was discontinued on patient discharge home or admission to the hospital. UC patients received treatment for hyperglycemia at the discretion of their ED physicians. INT subjects who required hospital admission were transitioned to basal‐bolus insulin therapy with detemir and aspart, receiving their first dose of detemir in the ED. Detemir dosing was weight‐based (0.3 units/kg) if the patient was not on home insulin or based on the patient's home dose of insulin (same dose for detemir, unit‐for‐unit conversion from glargine to detemir, or 80% of total NPH dose). If a patient received basal insulin prior to arrival, the first dose of detemir was held until 12 hours after the last dose of NPH or until 20 hours after the last dose of glargine or detemir. We found from our preliminary study that inadvertent overlaps in long‐acting insulin were one cause of hypoglycemia. We compared differences between groups in the final ED BG level, frequency of hypoglycemia, and ED length of stay (LOS).
Patients subsequently admitted to the hospital entered phase 2. During phase 2, INT patients had detemir and premeal aspart titrated by study staff using a predefined protocol (see Supporting Appendix Fig. 2). Detemir was given once daily, 24 hours after the initial ED dose. UC patients had their diabetes managed by medical house staff teams. House staff members have been educated on the Rush inpatient insulin protocol on which the INT protocol was based. The Rush inpatient diabetes protocol is implemented via a single computerized order set in which all patients should receive mealtime insulin using aspart and a basal insulin (glargine or detemir or NPH). We compared differences between groups in the mean admission BG level, mean daily BG level, mean BG level before each meal, hospital LOS, and frequency of hypoglycemic events. Moderate hypoglycemia was defined as a BG between 50 and 69 mg/dL, and severe hypoglycemia was defined as a BG < 50 mg/dL. We also compared the frequency of BG < 60 mg/dL.
The Rush University Medical Center institutional review board approved the study. Statistical analysis was done using SPSS version 11.0. The Student t test was used to determine any significant difference in BG means between the INT and UC groups. The Fisher's exact test or the chi‐square test was used to determine any difference in proportions of hypoglycemic events between INT and UC patients.
Results
Phase 1: Emergency Department
A total of 176 patients were randomized: 87 to the INT group and 89 to the UC group. Baseline characteristics were similar between groups (Table 1). Mean initial ED BG was similar: 300 70 mg/dL for INT patients and 307 82 mg/dL for UC patients. During phase 1, all INT patients were treated with aspart every 2 hours if BG > 200 mg/dL until discharge home or admission to the hospital. They received an initial mean insulin dose of 0.08 0.04 units/kg of subscutaneous aspart. Twenty‐five percent of INT patients received a second dose of aspart, and 3% received a third dose. For UC patients, only 55% received insulin therapy. Aspart was used for all UC patients who received insulin. Of those in the UC group who received insulin, 11% received a second dose for persistent hyperglycemia; none received a third dose. The mean initial ED BG for UC patients who received insulin was 358 73 mg/dL, and they received an initial mean dose of 0.11 0.05 units/kg. UC patients who did not receive insulin had a lower mean initial ED BG, 241 35 mg/dL. The mean final ED BG was 217 71 mg/dL for the INT group and 257 89 mg/dL for the UC group (P < .01; Fig. 1). The mean ED LOS was 30 minutes longer in the INT group (P = .06; Table 1). Sixty INT patients (69%) and 61 UC patients (69%) were admitted to the hospital. Fifty‐six percent of INT patients received the first dose of detemir based on their home insulin dose, and 44% received a weight‐based dose per protocol.
| Intervention (n = 87) | Usual Care (n = 89) | Significance | |
|---|---|---|---|
| |||
| Age (y) | 55 13 | 55 13 | |
| Sex (% male) | 48 | 39 | |
| BMI (kg/m2) | 34 9 | 33 9 | |
| Ethnicity (%) | |||
| African American | 58 | 66 | |
| Hispanic | 24 | 19 | |
| White | 15 | 11 | |
| Other | 3 | 4 | |
| Duration of diabetes (y) | 13 9 | 12 10 | |
| HA1C | 10.4 2.2 | 9.8 2.6 | |
| Insulin treatment at home (%) | 56 | 62 | |
| Presenting complaint/diagnosis (%) | |||
| Cardiac | 20 | 23 | |
| Gastrointestinal | 30 | 23 | |
| Hyperglycemia | 13 | 18 | |
| Infection | 9 | 11 | |
| Initial ED blood glucose (mg/dL) | 300 70 | 307 82 | |
| Final ED blood glucose (mg/dL) | 217 71 | 256 89 | P < .01 |
| ED length of stay (h) | 5.4 1.7 | 4.9 1.9 | P = .06 |
| Patients treated with insulin in ED (%) | 100 | 54 | |
| Initial dose of SQ aspart (units) | 7.9 4.2 | 9.5 4 | |
| ED patients admitted (%) | 69 | 69 | |
| Admission blood glucose (mg/dL) | 184 70 | 224 93 | P < .01 |
| Treatment of hyperglycemia in hospital (%) | |||
| Detemir aspart insulin | 100 | 7 | |
| Glargine aspart insulin | 0 | 36 | |
| NPH aspart insulin | 0 | 34 | |
| Oral agents | 0 | 8 | |
| None | 0 | 15 | |
| Hospital length of stay (days) | 2.7 2.0 | 3.1 1.9 | P = .58 |
Phase 2: Inpatient Setting
In phase 2, mean admission BG was significantly lower in the INT group (184 70 mg/dL) than in the UC group (223 93 mg/dL), P < .01, as a result of aspart given in the ED. The day 1 mean fasting BG for INT patients was 148 54 mg/dL, significantly lower than the day 1 mean fasting BG for UC patients: 212 81 mg/dL (P < .01). The mean fasting BG for the entire hospitalization was significantly lower for INT patients, 135 48 mg/dL, than for UC patients, 185 72 mg/dL (P < .01). During phase 2, all INT patients had detemir and aspart titrated daily per protocol. Treatment of UC patients was as follows: 78.5% with insulin, 8.2% with oral agents, and 11.5% did not receive medication for hyperglycemia. Of those in the UC group who received insulin, 36.0% were treated with lantus/aspart or detemir/aspart, 34.4% with NPH/aspart, 6.5% with lantus or detemir alone, and 1.6% with aspart alone. Overall, 76.9% of UC received basal insulin, and 70.4% received nutritional insulin. Only 47% of UC patients had insulin adjusted on a daily basis despite persistent hyperglycemia. Significant differences were also seen between INT and UC patients in mean prelunch and predinner BG levels, but not in mean bedtime BG level (Fig. 2). Mean daily BG levels for the initial 5 days of inpatient stay were significantly lower in the INT group (P < .01), except for day 5, when only 21 patients remained in the study (Fig. 3). Patient‐day weighted mean glucose was 163 39 mg/dL for INT patients versus 202 39 mg/dL for UC patients (P < .01). On admission, day 1 mean insulin total daily dose (TDD) was 0.65 0.26 units/kg for INT patients and 0.52 0.29 units/kg for UC patients. The final mean TDD was 0.75 0.35 units/kg for INT patients and 0.61 0.38 units/kg for UC patients. Mean hospital LOS was 9.6 hours shorter for INT patients (2.7 2 days) than for UC patients (3.1 1.9 days), P = .58.
Patient Safety: Frequency of Hypoglycemia
The frequency of hypoglycemia is shown in Table 2. During the ED phase, 3 UC patients (3.4%) had a BG < 50 mg/dL, and 2 INT patients (2.3%) had a BG of 67 mg/dL.
| Blood Glucose | Emergency Department (Number of Episodes) | Significance | Inpatient Phase (Patient Stays) | Significance | ||
|---|---|---|---|---|---|---|
| Usual Care | Intervention | Usual Care | Intervention | |||
| < 50 mg/dL | 3 | 0 | P = .50 | 6 | 1 | P = .11 |
| < 60 mg/dL | 3 | 0 | P = .50 | 7 | 8 | P = .98 |
| 5069 mg/dL | 0 | 2 | P = .23 | 6 | 12 | P = .20 |
During the hospital phase, INT patients had 4.3% of patient‐days and UC had 4.5% of patient‐days with any BG < 70 mg/dL. During 12 patient‐stays (20%) in the INT group there was an episode of moderate hypoglycemia, and during 1 patient‐stay (1.7%) there was an episode of severe hypoglycemia. During 6 patient‐stays (9.8%) in the UC group there was an episode of moderate hypoglycemia, and during 6 patient‐stays (9.8%) there was an episode of severe hypoglycemia (Table 2). The odds ratio (OR) for moderate hypoglycemia in the INT group compared with the UC group was 1.93 (95% CI, 0.7‐5.29), but for severe hypoglycemia the OR was 0.15 (95% CI, 0.018‐1.33). Moderate and severe hypoglycemic events in the UC group were split evenly between patients treated with glargine/detemir‐aspart and those treated with NPH‐aspart.
Discussion
This is the first randomized trial comparing the Rush Emergency Department Hyperglycemia Intervention (REDHI) protocol with usual care for the treatment of hyperglycemia in the ED. We believe this may be the first trial to initiate subcutaneous basal insulin therapy in the ED at the time of hospital admission. Initiation of our protocol for type 2 diabetic patients with BG > 200 mg/dL resulted in lower final ED and admission BGs compared with those in the UC group. Although a higher mean initial ED BG of 358 73 mg/dL was required to prompt initiation of insulin therapy for UC patients, 3 experienced severe hypoglycemia. By following the REDHI protocol, ED nurses avoided BG < 50 mg/dL in INT patients. Our first version of the REDHI protocol dosed more insulin than our current version, and we saw excess hypoglycemia.11 With a reduced dosing formula, there was less lowering of BG, but we eliminated all BG < 60 mg/dL. There was a trend toward an increased ED LOS in INT patients compared with UC patients. This may be because of delays in the administration of insulin or the requirement for a final BG check prior to discharge from the ED for INT patients. However, we did not receive feedback from ED nursing that either factor was a significant issue.
During phase 2, we observed improved glycemic control in INT, likely due to two factors: early initiation of basal insulin and protocol driven daily titration of both basal and mealtime insulin. We achieved a mean fasting BG of 148 54 mg/dL in INT the morning after the ED dose of detemir. BG levels in both groups continued to improve each day, but since the admission BG for INT was lower, this group maintained significantly lower BG levels throughout most of the hospitalization. There were also significant differences between groups at different times of day. Basal doses for INT patients were adjusted daily per fasting BG. Scheduled mealtime doses were based on the basal dose; each mealtime aspart dose was a third of the basal detemir dose. Therefore, patients who required larger doses for certain meals may have received less aspart than needed. This may explain why fasting BG control was better than BG control later in the day.
Current Rush guidelines recommend the same insulin doses as those that our intervention used, but patients in the UC group were less likely to have insulin titrated daily. Cook et al found that clinical inertia, or failure of health care providers to initiate or intensify therapy when indicated, is a common problem among medical residents treating inpatients with insulin.15 Reasons for clinical inertia may include unawareness of inpatient glycemic targets, lack of training or confidence in titrating insulin, and concerns regarding hypoglycemia. Our study shows that this is still an operative issue, even after residents have participated in multiple small‐group educational sessions. Details of the Rush inpatient insulin protocol are also on pocket cards distributed to residents. However, fewer than half of UC patients had insulin adjusted appropriately for persistent hyperglycemia. This may be one explanation for the improved control seen in the INT group and underscores the importance of daily dose titrations based on a uniform protocol.
During phase 2, despite improved glycemic control in INT, there was no significant difference in rates of hypoglycemia between the groups. The number of patient‐stays with moderate hypoglycemia was more in the INT group than in the UC group, 12 versus 6, respectively, but not statistically different (P = .20). There was a trend toward fewer patient‐stays with severe hypoglycemia in the INT group than in the UC group, 1 versus 6, respectively (P = .11).
Other studies have described improved inpatient glycemic control without excess hypoglycemia. In the RABBIT 2 trial, institution of a glargine‐glulisine insulin protocol, TTD of 0.4‐5 units/kg, among insulin‐naive inpatients resulted in a mean fasting BG of 147 36 mg/dL and a mean hospital BG of 166 32 mg/dL, with 3% of patient‐stays having a BG < 60 mg/dL.6 In a second trial, detemir‐aspart was compared with NPH‐aspart TTD of 0.4‐5 units/kg.7 Both groups achieved a similar mean fasting BG of 146 mg/dL and a mean hospital BG of 157 mg/dL. However, the rate of hypoglycemia was higher: 29% of patient‐stays overall. In our study, we achieved a mean fasting BG of 135 48 mg/dL and a mean hospital BG of 163 40 mg/dL in the INT group, using a mean initial TTD of 0.65 0.23 units/kg. The frequency of hypoglycemia in this trial, 22% of INT patient‐stays and 20% of UC patient‐stays, was less than that in Umpierrez et al,7 despite a lower mean fasting BG in our current trial. Maynard et al found 16% of patient‐stays and 3% of patient‐days had an episode of BG < 60 mg/dL in a trial of glarginerapid‐acting insulin (0.4‐5 units/kg TTD).12 Schnipper et al found that 6.1% of patient‐days had an episode of BG < 60 mg/dL using either glargine or NPH and a rapid‐acting insulin, TTD 0.6 units/kg.13 Our hypoglycemia rates were higher; however, we defined hypoglycemia as BG < 70 mg/dL, as suggested by the ADA workgroup.14 If we use a cutoff of < 60 mg/dL for hypoglycemia, it occurred in 13.3% of patient‐stays and 4.3% of patient‐days in the INT group, comparable to that in previous studies.
Our study has several limitations. First, this was a single‐center study, and our ED protocol should be tested in other ED settings, both academic and community. Second, although there were trends toward lower rates of severe hypoglycemia in the INT group, the study was underpowered to detect possible significant differences. Third, although ED nurses implemented the study protocol, study staff closely monitored nurses to ensure adherence. Therefore, it is difficult to speculate on protocol adherence under normal circumstances. Successful implementation requires ongoing nursing and medical staff education. A fourth limitation is the absence of patients with type 1 diabetes.
In conclusion we demonstrated that weight‐based subcutaneous aspart insulin therapy begun in the ED, coupled with prompt initiation of a detemir‐aspart insulin protocol, results in rapid correction of hyperglycemia and improved inpatient glycemic control without increasing hypoglycemia. Diabetes is a common comorbidity in patients presenting to the ED that is not uniformly addressed. These patients may present with uncontrolled hyperglycemia or diabetes‐related infections, and prompt, efficacious glucose control is important. The nurse‐driven Rush ED hyperglycemia protocol ensures that hyperglycemia is safely addressed, allowing the ED physician to address more critical issues. By initiating basal insulin in the ED, our protocol allows for a prompt and smooth transition to a basal‐bolus insulin regimen for the inpatient setting.
- ,,, et al.American Association of Clinical Endocrinologists and American Diabetes Association Consensus Statement on Inpatient Glycemic Control.Diabetes Care.2009;32:1119–1131.
- ,,, et al.Management of diabetes and hyperglycemia in hospitals.Diabetes Care.2004;27:553–591.
- ,,,Eliminating inpatient sliding scale insulin: a re‐education project with medical house staff.Diabetes Care.2008;28:1008–1011.
- ,,, et al.Reduction of surgical mortality and morbidity in diabetic patients undergoing cardiac surgery with a combined intravenous and subcutaneous insulin glucose management strategy.Diabetes Care.2007;30:823–828.
- ,,.Comparison of once daily glargine insulin with twice‐daily NPH/Regular insulin for control of hyperglycemia in inpatients after cardiovascular surgery.Diabetes Technol Ther.2006;8:609–616.
- ,,, et al.Randomized study of basal‐bolus insulin therapy in the inpatient management of patients with type 2 diabetes (RABBIT 2 trial).Diabetes Care.2007;30:2181–2186.
- ,,, et al.Comparison of inpatient insulin regimens with detemir plus aspart versus neutral protamine Hagedorn plus regular in medical patients with type 2 diabetes.J Clin Endocrinol Metab.2009;94:564–569.
- ,,,.Once daily insulin glargine vs. six hourly sliding scale regular insulin for control of hyperglycemia after bariatric surgery: a randomized clinical trial.Endocr Pract.2007;13:225–231.
- ,,.Limited communication and management of emergency department hyperglycemia in hospitalized patients.J Hosp Med.2009;4:44–49.
- ,,,.Multicenter survey of emergency physician management and referral for hyperglycemia.J Emerg Med.2010;38:264–272.
- ,,,,Impact of a nurse‐driven subcutaneous insulin protocol: Rush Emergency Department Hyperglycemia Intervention (REDHI).J Emerg Med.2008 [Epub ahead of print].
- ,,,,.Improved inpatient use of basal insulin, reduced hypoglycemia, and improved glycemic control: effect of structured subcutaneous insulin orders and an insulin management algorithm.J Hosp Med.2009;4:3–15.
- ,,,.Effects of a subcutaneous insulin protocol, clinical education, and computerized order set on the quality of inpatient management of hyperglycemia: results of a clinical trial.J Hosp Med.2009;4:16–27.
- ADA Workgroup on Hypoglycemia.Defining and reporting hypoglycemia in diabetes.Diabetes Care.2005;28:1245–1249.
- ,, et al.Diabetes care in hospitalized noncritically ill patients: More evidence for clinical inertia and negative therapeutic momentum.J Hosp Med.2007;2:203–211.
- ,,, et al.American Association of Clinical Endocrinologists and American Diabetes Association Consensus Statement on Inpatient Glycemic Control.Diabetes Care.2009;32:1119–1131.
- ,,, et al.Management of diabetes and hyperglycemia in hospitals.Diabetes Care.2004;27:553–591.
- ,,,Eliminating inpatient sliding scale insulin: a re‐education project with medical house staff.Diabetes Care.2008;28:1008–1011.
- ,,, et al.Reduction of surgical mortality and morbidity in diabetic patients undergoing cardiac surgery with a combined intravenous and subcutaneous insulin glucose management strategy.Diabetes Care.2007;30:823–828.
- ,,.Comparison of once daily glargine insulin with twice‐daily NPH/Regular insulin for control of hyperglycemia in inpatients after cardiovascular surgery.Diabetes Technol Ther.2006;8:609–616.
- ,,, et al.Randomized study of basal‐bolus insulin therapy in the inpatient management of patients with type 2 diabetes (RABBIT 2 trial).Diabetes Care.2007;30:2181–2186.
- ,,, et al.Comparison of inpatient insulin regimens with detemir plus aspart versus neutral protamine Hagedorn plus regular in medical patients with type 2 diabetes.J Clin Endocrinol Metab.2009;94:564–569.
- ,,,.Once daily insulin glargine vs. six hourly sliding scale regular insulin for control of hyperglycemia after bariatric surgery: a randomized clinical trial.Endocr Pract.2007;13:225–231.
- ,,.Limited communication and management of emergency department hyperglycemia in hospitalized patients.J Hosp Med.2009;4:44–49.
- ,,,.Multicenter survey of emergency physician management and referral for hyperglycemia.J Emerg Med.2010;38:264–272.
- ,,,,Impact of a nurse‐driven subcutaneous insulin protocol: Rush Emergency Department Hyperglycemia Intervention (REDHI).J Emerg Med.2008 [Epub ahead of print].
- ,,,,.Improved inpatient use of basal insulin, reduced hypoglycemia, and improved glycemic control: effect of structured subcutaneous insulin orders and an insulin management algorithm.J Hosp Med.2009;4:3–15.
- ,,,.Effects of a subcutaneous insulin protocol, clinical education, and computerized order set on the quality of inpatient management of hyperglycemia: results of a clinical trial.J Hosp Med.2009;4:16–27.
- ADA Workgroup on Hypoglycemia.Defining and reporting hypoglycemia in diabetes.Diabetes Care.2005;28:1245–1249.
- ,, et al.Diabetes care in hospitalized noncritically ill patients: More evidence for clinical inertia and negative therapeutic momentum.J Hosp Med.2007;2:203–211.
Copyright © 2010 Society of Hospital Medicine
ECG Score as Embolism Predictor
The clinical outcome of patients with pulmonary embolism (PE) has a wide spectrum, ranging from a benign course, with early resolution of symptoms, to death. Prognostic stratification of patients with PE is therefore essential to guide therapy. Currently, this stratification is primarily based on blood pressure on admission. Hemodynamic instability or shock carries a bad prognosis, and is associated with a 3‐fold to 7‐fold increase in mortality.1 Thrombolytic therapy is warranted in these cases.2 There is a subset of patients that, despite normal blood pressure on presentation, can subsequently suffer hemodynamic deterioration and death.3
Echocardiography has been proposed as a useful tool to identify a subset of patients at a higher risk. It has been suggested that the finding of right ventricle dysfunction (RVD) in echocardiography predicts a worse prognosis, even in patients with normal blood pressure on presentation.4 Also, computed tomography pulmonary angiography (CTPA) is increasingly used as the main test to diagnose PE. This technique can also assess the degree of pulmonary arterial obstruction and the presence of signs suggestive of RVD. It has been suggested that CTPA findings can predict outcome in PE.5
Electrocardiography (ECG) has a widespread use and is routinely carried out and interpreted in the emergency room. Some ECG findings in patients with PE are suggestive of right ventricular strain and might therefore be used to prioritize cases that require closer monitoring.6
This study was designed with the objectives of assessing the correlation of standard ECG findings with echocardiography and CTPA signs of RVD, with the anatomic severity of the pulmonary vascular obstruction, and with the degree of hypoxemia, in hemodynamically stable patients with PE. Secondary objectives were determining if ECG could accurately predict RVD, and determining the interobserver agreement for the ECG score.
Patients and Methods
Patients and Study Design
We recently carried out a prospective, descriptive, single‐center follow‐up study to assess the prevalence of RVD and pulmonary hypertension (PH) in PE patients who presented with hemodynamic stability.7 We herein analyze ECG findings in these cases. The present, noninterventional study was approved by our institution's review board. The population studied included consecutive patients presenting with PE to our emergency room. Inclusion criteria were age >18 years and PE confirmed by CTPA. Exclusion criteria were high‐risk PE (presence of 2 consecutive systolic blood pressure measurements <90 mm Hg, measured >15 minutes apart or requiring inotropic support); comorbidity predictive of a 6‐month mortality >50% (eg, metastatic cancer or end‐stage respiratory or heart disease); creatinine clearance <35 mL/minute; or allergy to ionidated contrast media. All the patients gave informed consent to participate in the study.
Protocol
Initial assessment included clinical history, physical examination, ECG, arterial blood gas analysis, echocardiography, CTPA, and lower‐limb venous ultrasonography. All included individuals were treated with anticoagulation, and fibrinolytic therapy was not used.
ECG
A standard 12‐lead ECG was promptly obtained for all patients in the emergency room. We used the scoring system described by Daniel et al.8 (Table 1). This score is based on 4 signs that were previously found to be associated with high‐risk PE: tachycardia, incomplete or complete right bundle branch block, T wave inversion, and S1Q3T3 pattern. Two investigators trained in the interpretation of ECG results scored the ECG independently, and were blinded to patient clinical status and to echocardiography and CTPA findings.
| Characteristics | Score |
|---|---|
| |
| Tachycardia (>100 beats/min) | 2 |
| Incomplete right bundle‐branch block | 2 |
| Complete right bundle‐branch block | 3 |
| T‐wave inversion in lead V1 through V4 | 4 |
| T wave inversion in lead V1* | |
| <1 mm | 0 |
| 12 mm | 1 |
| >2 mm | 2 |
| T wave inversion in lead V2* | |
| <1 mm | 1 |
| 12 mm | 2 |
| >2 mm | 3 |
| T wave inversion in lead V3* | |
| <1 mm | 1 |
| 12 mm | 2 |
| >2 mm | 3 |
| S wave in lead 1 | 0 |
| Q wave in lead 3 | 1 |
| Inverted T wave in lead 3 | 1 |
| If all S1Q3T3, add | 2 |
| Total score (maximum: 21) | |
Echocardiography
The study was done as soon as possible after admission using a SONOS 5500 (Hewlett Packard, Palo Alto, CA) ultrasound imaging system with a S4 transducer. In all cases M‐mode, 2‐dimensional, Doppler (continuous and pulsed wave), and color Doppler was performed with the patient in the left lateral position. The structure of the mitral, aortic, tricuspid, and pulmonary valves (different grades of regurgitation and stenosis were assessed), and the systolic and diastolic function of the left ventricle (LV) were systematically assessed.
We assessed if patients had either RVD or isolated PH. Individuals with at least 1 of the following findings were diagnosed as having RVD: right ventricle (RV) hypokinesis (asymmetrical or delayed contraction, usually in the RV base), paradoxical septal systolic motion or right ventricular dilatation (end‐diastolic diameter > 30 mm or right to left ventricular end‐diastolic diameter ratio 1 in the apical 4‐chamber view); PH was defined as pulmonary arterial systolic pressure (PASP) > 40 mm Hg.9 PASP was derived from the right atrioventricular pressure gradient, using peak velocity of tricuspid flow regurgitation with continuous wave Doppler in the apical 4‐chamber view and the modified Bernoulli equation.10 Right atrial pressure was considered equal to 5 mm Hg or 10 mm Hg, according to whether the inferior vena cava collapsed during inspiration, respectively.11
Computed Tomographic Pulmonary Angiography
All CTPAs were performed within 6 hours of patient arrival to the emergency room. Nonionic contrast (100 mL) was administered intravenously at an injection rate of 2.5 mL/second for 40 seconds. Images were obtained on the same single‐detector scanner (Somatron PQ 2000S; Picker International, Cleveland, OH). If possible, scanning was performed during a 32‐second breath hold. If patients were dyspneic, spiral CT angiography was performed during shallow breathing. The scans were obtained using 125 mA and 130 kV. A 5 mm/second table feed was used to scan a 16‐cm volume in the craniocaudal direction (pitch of 1.5). An imaging delay of 20 seconds was used, and overlapping images were reconstructed every 1.5 mm and viewed on films at lung and mediastinal settings.
PE was diagnosed by the on‐duty radiologist if an intraluminal filling defect was seen. For the purpose of the study, the images were reviewed by a senior radiologist. The pulmonary obstruction index was determined according to Qanadli et al.12 The RV to LV diameter ratio was obtained by computing the ratio between the widths of the right and the left ventricular cavities assessed on axial images obtained at the plane of maximal distance between the ventricular endocardial free wall and the interventricular septum, perpendicular to the long axis. A RV/LV ratio > 1 was accepted as suggestive of RV dysfunction. The diameter of the main pulmonary artery (PA) was measured just before the division into its 2 main branches.
Definition of Clinical Endpoints
Primary outcome measures were the prevalence of echocardiography‐assessed RVD or PH at diagnosis, the prevalence of CTPA signs of RVD, the CTPA‐measured severity of the pulmonary vascular obstruction, and the degree of hypoxemia.
Statistical Analysis
Normal distribution of data was assessed using the D'agostino‐Pearson test. Data are shown as mean standard deviation (for normally distributed data) or median (interquartile range) (for non‐normally distributed data). Comparisons between different groups were made using unpaired t test or Wilcoxon rank‐sum test, as appropriate. Correlation between the ECG score and the different variables measured was assessed using Spearman's rank correlation coefficient. Receiver operating characteristic (ROC) curves were constructed to assess the value of ECG score to predict echocardiography or CTPA‐detected RVD. Kappa measurement was performed to examine the interobserver agreement for the ECG score. A 2‐tailed value of P < 0.05 was considered significant.
Results
A total of 103 patients were included in the study (mean age = 69 15 years). One patient died from fatal PE soon after the diagnosis, before echocardiography could be performed. During the 6‐month follow‐up, one patient died from septic shock and another suffered a thromboembolic recurrence (deep vein thrombosis). Echocardiography‐assessed RVD was found in 25 cases (24.5%) and isolated pulmonary hypertension in 20 (19.6%). Median value of the vascular obstruction index was 43.8% (25‐65). Thirty‐three patients (32%) had signs of RVD in CTPA.
Median value of ECG score was 2.5 (1‐6). The level of interobserver agreement regarding ECG score was substantial ( = 0.80). Table 2 shows correlation between ECG score and echocardiography, arterial blood gases, and CTPA parameters. ECG correlated significantly with all the variables measured. Correlation was higher for the vascular obstruction index and the RV/LV ratio, measured with echocardiography. ECG scores were significantly different for groups with varying degrees of severity of PE. Table 3 shows the ECG scores for patients grouped according to different criteria of severity of the disease.
| Variable | R (95% CI) | P |
|---|---|---|
| ||
| Vascular obstruction index | 0.41 (0.220.57) | <0.001 |
| PASP | 0.31 (0.090.49) | 0.006 |
| pO2(A‐a) | 0.29 (0.080.47) | 0.007 |
| PA diameter | 0.28 (0.070.47) | 0.011 |
| RV/LV ratio (echocardiography) | 0.42 (0.220.57) | <0.001 |
| RV/LV ratio (CTPA) | 0.36 (0.130.56) | 0.004 |
| Criteria | ECG score | P |
|---|---|---|
| ||
| RVD (echocardiography) present | 10 [615] | <0.0001 |
| RVD (echocardiography) absent | 2 [04] | |
| PH (echocardiography) present | 6 [1.7512.00] | 0.029 |
| PH (echocardiography) absent | 2 [04] | |
| RVD (CTPA) present | 6 [311] | 0.0015 |
| RVD (CTPA) absent | 2 [13] | |
| Vascular obstruction score >50% | 7 [211] | 0.0005 |
| Vascular obstruction score 50% | 2 [03] | |
| PaO2 < 60 mmHg | 4 [1.252.75] | 0.015 |
| PaO2 60 mmHg | 2 [14] | |
| Bilateral PE | 5 [111] | 0.028 |
| Unilateral PE | 2 [0.754.00] | |
| Central PE | 4 [210] | 0.0011 |
| Peripheral PE | 2 [03] | |
Figure 1 shows the ROC curve for the ECG score and the presence of echocardiography‐detected RVD. Area under the ROC curve was 0.82 (95% confidence interval [CI]: 0.72‐0.89). A cut‐off point of 6 for the ECG score showed the highest accuracy for detecting RVD; sensitivity = 76.5% (95% CI: 50.1‐93.0), specificity = 88.6% (95% CI: 78.7‐94.9), positive likelihood ratio (+LR) = 6.69, negative likelihood ratio (LR) = 0.37. If the ECG score was to be used as a screening method to exclude RVD, a cut‐off point of 0 showed sensitivity = 94.1% (95% CI: 71.2‐99.0), specificity = 27.1% (95% CI: 17.2‐39.1), +LR = 1.29, LR = 0.22. If the ECG score was considered for confirming RVD, the more useful value was 9; sensitivity = 58.8% (95% CI: 33.0‐81.5), specificity = 92.0% (95% CI: 84.1‐97.6), +LR = 8.23, LR = 0.44. Area under the ROC curve to predict CTPA‐detected RVD was slightly lower than for echocardiography: 0.74 (95% CI: 0.61‐0.84).
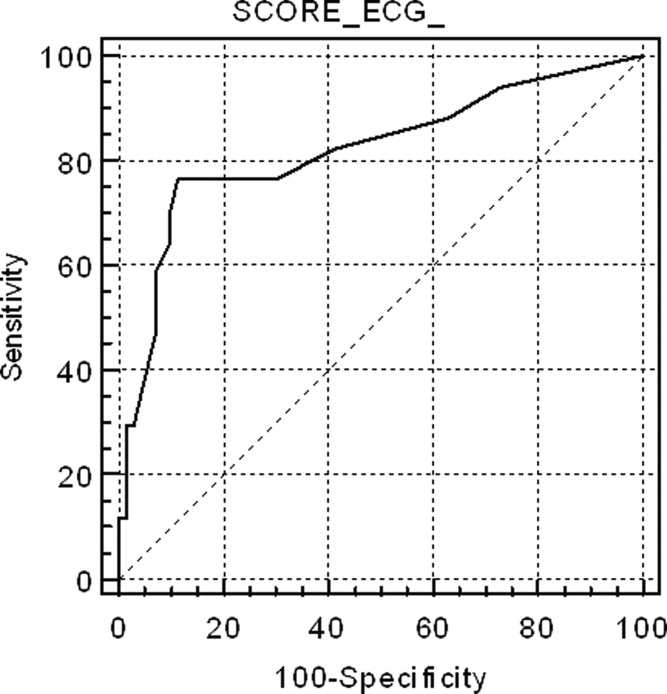
Discussion
This study shows that a simple, easy‐to‐use ECG scoring system correlates well with the severity of PE, assessed by different methods, in hemodynamically stable patients. Interobserver agreement regarding the scoring system was substantial. Several previous studies have found that ECG signs of RV strain correlate with the presence of RVD.6, 1316 However, some of these studies are limited by a retrospective design that could lead to selection bias or by the inclusion of relatively few (eg, <100) cases.6, 13, 14 Moreover, only a few of these articles have specifically examined patients with normal blood pressure.6, 15 Although our study is still small, one of its strengths is that it prospectively recruited a population of consecutive, normotensive patients and both echocardiography and CTPA were systematically performed. Classifying cases with normal blood pressure by severity is particularly relevant, because of the uncertainty about best treatment when hemodynamic instability is not present. These patients who are not at high risk for PE can be further stratified according to the presence of RVD and/or myocardial injury into intermediate‐risk and low‐risk PE.17 Early hospital discharge or initial outpatient treatment might be considered in low‐risk patients.17, 18 However, echocardiography can be difficult to perform in the emergency setting. Also, the presence of RVD is not easy to predict on clinical grounds. Our study suggests that a standard 12‐lead ECG can be useful to prioritize patients for more exhaustive monitoring or additional risk stratifying tests. An ECG score of 0 would exclude RVD with enough sensitivity to avoid getting an echocardiogram in these cases. On the other hand, a score 9 would suggest the possibility that RVD was present, and an echocardiography ought to be considered in these patients.
Previous studies regarding correlation between ECG and anatomic extension of the pulmonary vascular obstruction in PE have revealed conflicting data. Iles et al. found that ECG score identified those patients with the greatest percentage of perfusion defect on ventilation/perfusion scan.19 However, Kanbay et al. did not find significant differences in ECG scores for patients with pulmonary vascular obstruction scores <50% or 50%, also assessed with ventilation/perfusion scan.20 Subramaniam et al. used CTPA to assess clot burden score, and they did not see a significant association between ECG score and the anatomic severity of PE.21 This study found a significant association between higher ECG score and a more severe vascular obstruction index. This finding might have potential clinical implications, because some reports suggest that a higher CTPA‐measured clot load score can be associated with poorer outcome in PE.22 However, the utility of CTPA scores of vascular obstruction severity as a marker of clinical evolution is controversial, and several other authors have found that these scores are poor predictors of mortality or adverse outcome events.23, 24 Therefore, the positive correlation between ECG and the vascular obstruction index in our study is interesting mainly in the sense that it independently supports the validity of the ECG score as a marker of a potentially more severe PE.
In this study, we have not systematically excluded patients with comorbidities (eg, chronic obstructive pulmonary disease) that could account for RVD or PH. Our intention was to reflect a real‐life clinical scenario. When a patient attends the emergency room with PE, clinical decisions must usually be taken without complete information on comorbidities that may contribute to the existence of RV overload. Also, these subjects have a reduced cardiorespiratory reserve, and the PE might impose an unbearable strain to the RV, so risk stratification is especially important. Therefore, we felt that the study should include all patients presenting with PE, so that the results can be extrapolated to usual clinical practice.
Our results suggest that, by selecting the appropriate cut‐off value, the ECG score can be used with adequate sensitivity and specificity to exclude and confirm, respectively, RVD in hemodynamically stable PE patients. This finding implies that ECG may be useful to design management strategies in these cases, selecting patients that may benefit from further tests.
There are some limitations for the present study. Echocardiography was not immediately performed after the ECG. Thus, we might have missed some patients who presented with transient RVD, which resolved between tests. It is likely that the correlation between ECG and echocardiography would have improved if this delay had been avoided. Also, we did not use a multidetector scanner for performing CTPAs. Consequently, small emboli might have been missed and the clot score might have been underestimated. It is plausible that this may have reduced to some extent the correlation between ECG and CTPA. Also, this a single‐center study, with relatively few patients studied. Finally, due to the low incidence of adverse events in our patients, our study is underpowered to make conclusions about the independent prognostic value of ECG for predicting adverse events.
In conclusion, an easy‐to‐use ECG score correlates significantly with the severity of PE, as assessed with echocardiography, CTPA, and arterial blood gas analysis, in normotensive patients. It can be used to predict with acceptable sensitivity and specificity the presence of RVD in these cases and, accordingly, it has potential value in risk‐stratification strategies. Larger, multicenter studies, should confirm these results before they can be applied to clinical practice.
- ,,.Acute pulmonary embolism: clinical outcomes in the International Cooperative Pulmonary Embolism Registry (ICOPER).Lancet.1999;353:1386–1389.
- ,,,.Thrombolysis compared with heparin for the initial treatment of pulmonary embolism. A meta‐analysis of the randomized controlled trials.Circulation.2004;110:744–749.
- ,,, et al.Management strategies and determinants of outcome in acute major pulmonary embolism: results of a multicenter registry.J Am Coll Cardiol.1997;30:1165–1171
- ,,,,.Prognostic value of echocardiographycally assessed right ventricular dysfunction in patients with pulmonary embolism.Arch Intern Med.2004;164:1685–1689.
- ,,, et al.Right ventricular enlargement on chest computed tomography. A predictor of early death in acute pulmonary embolism.Circulation.2004;110:3276–3280.
- ,,,.Role of electrocardiography in identifying right ventricular dysfunction in acute pulmonary embolism.Am J Cardiol.2005;96:450–452.
- ,,, et al.Right ventricle dysfunction and pulmonary hypertension in hemodynamically stable pulmonary embolism.Respir Med.2010;104:1370–1376.
- ,,.Assessment of cardiac stress from massive pulmonary embolism with 12‐lead ECG.Chest.2001;120:474–481.
- ,,, et al.Clinical correlates and reference intervals for pulmonary artery systolic pressure among echocardiographically normal subjects.Circulation.2001;104:2797–2802.
- ,,, et al.Quantitative assessment of pulmonary hypertension in patients with tricuspid regurgitation using continuous wave Doppler ultrasound.J Am Coll Cardiol.1985;6:359–365.
- ,,.Noninvasive estimation of right atrial pressure from the inspiratory collapse of the inferior vena cava.Am J Cardiol.1990;66:493–496.
- ,,, et al.New CT index to quantify arterial obstruction in pulmonary embolism: comparison with angiographic index and echocardiography.AJR Am J Roentgenol.2001;176:1415–1420.
- ,,.Electrocardiographic score and short‐term outcomes of acute pulmonary embolism.Am J Cardiol.2007;100:1172–1176.
- ,,, et al.Is it possible to use standard electrocardiography for risk assessment of patients with pulmonary embolism?Kardiol Pol.2009;67:744–750.
- ,,, et al.Prognostic value of ECG among patients with acute pulmonary embolism and normal blood pressure.Am J Med.2009;122:257–264.
- ,,,,.QR in V1‐an ECG sign associated with right ventricular strain and adverse clinical outcome in pulmonary embolism.Eur Heart J.2003;24:1113–1119.
- ,,, et al.Guidelines on the diagnosis and management of acute pulmonary embolism. The Task Force for the Diagnosis and Management of Acute Pulmonary Embolism of the European Society of Cardiology (ESC).Eur Heart J.2008;29:2276–2315.
- .Acute pulmonary embolism.N Eng J Med.2008;359:2804–2813.
- ,,,,.ECG score predicts those with the greatest percentage of perfusion defects due to acute pulmonary thromboembolic disease.Chest.2004;125:1651–1656.
- ,,, et al.Electrocardiography and Wells scoring in predicting the anatomic severity of pulmonary embolism.Respir Med.2007;101:1171–1176.
- ,,, et al.Pulmonary embolism outcome: a prospective evaluation of CT pulmonary angiographic clot burden score and ECG score.AJR Am J Roentgenol.2008;190:1599–1604.
- ,,, et al.Right ventricular dysfunction and pulmonary obstruction index at helical CT: prediction of clinical outcome during 3‐month follow‐up in patients with acute pulmonary embolism.Radiology.2005;235:798–803.
- ,,,,.Acute PE mortality prediction by analysis of helical computed tomography angiography and hemodynamic evaluation.Thorax.2005;60:956–961.
- ,,,,.Pulmonary embolism: prognostic CT findings.Radiology.2007;242:889–893.
The clinical outcome of patients with pulmonary embolism (PE) has a wide spectrum, ranging from a benign course, with early resolution of symptoms, to death. Prognostic stratification of patients with PE is therefore essential to guide therapy. Currently, this stratification is primarily based on blood pressure on admission. Hemodynamic instability or shock carries a bad prognosis, and is associated with a 3‐fold to 7‐fold increase in mortality.1 Thrombolytic therapy is warranted in these cases.2 There is a subset of patients that, despite normal blood pressure on presentation, can subsequently suffer hemodynamic deterioration and death.3
Echocardiography has been proposed as a useful tool to identify a subset of patients at a higher risk. It has been suggested that the finding of right ventricle dysfunction (RVD) in echocardiography predicts a worse prognosis, even in patients with normal blood pressure on presentation.4 Also, computed tomography pulmonary angiography (CTPA) is increasingly used as the main test to diagnose PE. This technique can also assess the degree of pulmonary arterial obstruction and the presence of signs suggestive of RVD. It has been suggested that CTPA findings can predict outcome in PE.5
Electrocardiography (ECG) has a widespread use and is routinely carried out and interpreted in the emergency room. Some ECG findings in patients with PE are suggestive of right ventricular strain and might therefore be used to prioritize cases that require closer monitoring.6
This study was designed with the objectives of assessing the correlation of standard ECG findings with echocardiography and CTPA signs of RVD, with the anatomic severity of the pulmonary vascular obstruction, and with the degree of hypoxemia, in hemodynamically stable patients with PE. Secondary objectives were determining if ECG could accurately predict RVD, and determining the interobserver agreement for the ECG score.
Patients and Methods
Patients and Study Design
We recently carried out a prospective, descriptive, single‐center follow‐up study to assess the prevalence of RVD and pulmonary hypertension (PH) in PE patients who presented with hemodynamic stability.7 We herein analyze ECG findings in these cases. The present, noninterventional study was approved by our institution's review board. The population studied included consecutive patients presenting with PE to our emergency room. Inclusion criteria were age >18 years and PE confirmed by CTPA. Exclusion criteria were high‐risk PE (presence of 2 consecutive systolic blood pressure measurements <90 mm Hg, measured >15 minutes apart or requiring inotropic support); comorbidity predictive of a 6‐month mortality >50% (eg, metastatic cancer or end‐stage respiratory or heart disease); creatinine clearance <35 mL/minute; or allergy to ionidated contrast media. All the patients gave informed consent to participate in the study.
Protocol
Initial assessment included clinical history, physical examination, ECG, arterial blood gas analysis, echocardiography, CTPA, and lower‐limb venous ultrasonography. All included individuals were treated with anticoagulation, and fibrinolytic therapy was not used.
ECG
A standard 12‐lead ECG was promptly obtained for all patients in the emergency room. We used the scoring system described by Daniel et al.8 (Table 1). This score is based on 4 signs that were previously found to be associated with high‐risk PE: tachycardia, incomplete or complete right bundle branch block, T wave inversion, and S1Q3T3 pattern. Two investigators trained in the interpretation of ECG results scored the ECG independently, and were blinded to patient clinical status and to echocardiography and CTPA findings.
| Characteristics | Score |
|---|---|
| |
| Tachycardia (>100 beats/min) | 2 |
| Incomplete right bundle‐branch block | 2 |
| Complete right bundle‐branch block | 3 |
| T‐wave inversion in lead V1 through V4 | 4 |
| T wave inversion in lead V1* | |
| <1 mm | 0 |
| 12 mm | 1 |
| >2 mm | 2 |
| T wave inversion in lead V2* | |
| <1 mm | 1 |
| 12 mm | 2 |
| >2 mm | 3 |
| T wave inversion in lead V3* | |
| <1 mm | 1 |
| 12 mm | 2 |
| >2 mm | 3 |
| S wave in lead 1 | 0 |
| Q wave in lead 3 | 1 |
| Inverted T wave in lead 3 | 1 |
| If all S1Q3T3, add | 2 |
| Total score (maximum: 21) | |
Echocardiography
The study was done as soon as possible after admission using a SONOS 5500 (Hewlett Packard, Palo Alto, CA) ultrasound imaging system with a S4 transducer. In all cases M‐mode, 2‐dimensional, Doppler (continuous and pulsed wave), and color Doppler was performed with the patient in the left lateral position. The structure of the mitral, aortic, tricuspid, and pulmonary valves (different grades of regurgitation and stenosis were assessed), and the systolic and diastolic function of the left ventricle (LV) were systematically assessed.
We assessed if patients had either RVD or isolated PH. Individuals with at least 1 of the following findings were diagnosed as having RVD: right ventricle (RV) hypokinesis (asymmetrical or delayed contraction, usually in the RV base), paradoxical septal systolic motion or right ventricular dilatation (end‐diastolic diameter > 30 mm or right to left ventricular end‐diastolic diameter ratio 1 in the apical 4‐chamber view); PH was defined as pulmonary arterial systolic pressure (PASP) > 40 mm Hg.9 PASP was derived from the right atrioventricular pressure gradient, using peak velocity of tricuspid flow regurgitation with continuous wave Doppler in the apical 4‐chamber view and the modified Bernoulli equation.10 Right atrial pressure was considered equal to 5 mm Hg or 10 mm Hg, according to whether the inferior vena cava collapsed during inspiration, respectively.11
Computed Tomographic Pulmonary Angiography
All CTPAs were performed within 6 hours of patient arrival to the emergency room. Nonionic contrast (100 mL) was administered intravenously at an injection rate of 2.5 mL/second for 40 seconds. Images were obtained on the same single‐detector scanner (Somatron PQ 2000S; Picker International, Cleveland, OH). If possible, scanning was performed during a 32‐second breath hold. If patients were dyspneic, spiral CT angiography was performed during shallow breathing. The scans were obtained using 125 mA and 130 kV. A 5 mm/second table feed was used to scan a 16‐cm volume in the craniocaudal direction (pitch of 1.5). An imaging delay of 20 seconds was used, and overlapping images were reconstructed every 1.5 mm and viewed on films at lung and mediastinal settings.
PE was diagnosed by the on‐duty radiologist if an intraluminal filling defect was seen. For the purpose of the study, the images were reviewed by a senior radiologist. The pulmonary obstruction index was determined according to Qanadli et al.12 The RV to LV diameter ratio was obtained by computing the ratio between the widths of the right and the left ventricular cavities assessed on axial images obtained at the plane of maximal distance between the ventricular endocardial free wall and the interventricular septum, perpendicular to the long axis. A RV/LV ratio > 1 was accepted as suggestive of RV dysfunction. The diameter of the main pulmonary artery (PA) was measured just before the division into its 2 main branches.
Definition of Clinical Endpoints
Primary outcome measures were the prevalence of echocardiography‐assessed RVD or PH at diagnosis, the prevalence of CTPA signs of RVD, the CTPA‐measured severity of the pulmonary vascular obstruction, and the degree of hypoxemia.
Statistical Analysis
Normal distribution of data was assessed using the D'agostino‐Pearson test. Data are shown as mean standard deviation (for normally distributed data) or median (interquartile range) (for non‐normally distributed data). Comparisons between different groups were made using unpaired t test or Wilcoxon rank‐sum test, as appropriate. Correlation between the ECG score and the different variables measured was assessed using Spearman's rank correlation coefficient. Receiver operating characteristic (ROC) curves were constructed to assess the value of ECG score to predict echocardiography or CTPA‐detected RVD. Kappa measurement was performed to examine the interobserver agreement for the ECG score. A 2‐tailed value of P < 0.05 was considered significant.
Results
A total of 103 patients were included in the study (mean age = 69 15 years). One patient died from fatal PE soon after the diagnosis, before echocardiography could be performed. During the 6‐month follow‐up, one patient died from septic shock and another suffered a thromboembolic recurrence (deep vein thrombosis). Echocardiography‐assessed RVD was found in 25 cases (24.5%) and isolated pulmonary hypertension in 20 (19.6%). Median value of the vascular obstruction index was 43.8% (25‐65). Thirty‐three patients (32%) had signs of RVD in CTPA.
Median value of ECG score was 2.5 (1‐6). The level of interobserver agreement regarding ECG score was substantial ( = 0.80). Table 2 shows correlation between ECG score and echocardiography, arterial blood gases, and CTPA parameters. ECG correlated significantly with all the variables measured. Correlation was higher for the vascular obstruction index and the RV/LV ratio, measured with echocardiography. ECG scores were significantly different for groups with varying degrees of severity of PE. Table 3 shows the ECG scores for patients grouped according to different criteria of severity of the disease.
| Variable | R (95% CI) | P |
|---|---|---|
| ||
| Vascular obstruction index | 0.41 (0.220.57) | <0.001 |
| PASP | 0.31 (0.090.49) | 0.006 |
| pO2(A‐a) | 0.29 (0.080.47) | 0.007 |
| PA diameter | 0.28 (0.070.47) | 0.011 |
| RV/LV ratio (echocardiography) | 0.42 (0.220.57) | <0.001 |
| RV/LV ratio (CTPA) | 0.36 (0.130.56) | 0.004 |
| Criteria | ECG score | P |
|---|---|---|
| ||
| RVD (echocardiography) present | 10 [615] | <0.0001 |
| RVD (echocardiography) absent | 2 [04] | |
| PH (echocardiography) present | 6 [1.7512.00] | 0.029 |
| PH (echocardiography) absent | 2 [04] | |
| RVD (CTPA) present | 6 [311] | 0.0015 |
| RVD (CTPA) absent | 2 [13] | |
| Vascular obstruction score >50% | 7 [211] | 0.0005 |
| Vascular obstruction score 50% | 2 [03] | |
| PaO2 < 60 mmHg | 4 [1.252.75] | 0.015 |
| PaO2 60 mmHg | 2 [14] | |
| Bilateral PE | 5 [111] | 0.028 |
| Unilateral PE | 2 [0.754.00] | |
| Central PE | 4 [210] | 0.0011 |
| Peripheral PE | 2 [03] | |
Figure 1 shows the ROC curve for the ECG score and the presence of echocardiography‐detected RVD. Area under the ROC curve was 0.82 (95% confidence interval [CI]: 0.72‐0.89). A cut‐off point of 6 for the ECG score showed the highest accuracy for detecting RVD; sensitivity = 76.5% (95% CI: 50.1‐93.0), specificity = 88.6% (95% CI: 78.7‐94.9), positive likelihood ratio (+LR) = 6.69, negative likelihood ratio (LR) = 0.37. If the ECG score was to be used as a screening method to exclude RVD, a cut‐off point of 0 showed sensitivity = 94.1% (95% CI: 71.2‐99.0), specificity = 27.1% (95% CI: 17.2‐39.1), +LR = 1.29, LR = 0.22. If the ECG score was considered for confirming RVD, the more useful value was 9; sensitivity = 58.8% (95% CI: 33.0‐81.5), specificity = 92.0% (95% CI: 84.1‐97.6), +LR = 8.23, LR = 0.44. Area under the ROC curve to predict CTPA‐detected RVD was slightly lower than for echocardiography: 0.74 (95% CI: 0.61‐0.84).
Discussion
This study shows that a simple, easy‐to‐use ECG scoring system correlates well with the severity of PE, assessed by different methods, in hemodynamically stable patients. Interobserver agreement regarding the scoring system was substantial. Several previous studies have found that ECG signs of RV strain correlate with the presence of RVD.6, 1316 However, some of these studies are limited by a retrospective design that could lead to selection bias or by the inclusion of relatively few (eg, <100) cases.6, 13, 14 Moreover, only a few of these articles have specifically examined patients with normal blood pressure.6, 15 Although our study is still small, one of its strengths is that it prospectively recruited a population of consecutive, normotensive patients and both echocardiography and CTPA were systematically performed. Classifying cases with normal blood pressure by severity is particularly relevant, because of the uncertainty about best treatment when hemodynamic instability is not present. These patients who are not at high risk for PE can be further stratified according to the presence of RVD and/or myocardial injury into intermediate‐risk and low‐risk PE.17 Early hospital discharge or initial outpatient treatment might be considered in low‐risk patients.17, 18 However, echocardiography can be difficult to perform in the emergency setting. Also, the presence of RVD is not easy to predict on clinical grounds. Our study suggests that a standard 12‐lead ECG can be useful to prioritize patients for more exhaustive monitoring or additional risk stratifying tests. An ECG score of 0 would exclude RVD with enough sensitivity to avoid getting an echocardiogram in these cases. On the other hand, a score 9 would suggest the possibility that RVD was present, and an echocardiography ought to be considered in these patients.
Previous studies regarding correlation between ECG and anatomic extension of the pulmonary vascular obstruction in PE have revealed conflicting data. Iles et al. found that ECG score identified those patients with the greatest percentage of perfusion defect on ventilation/perfusion scan.19 However, Kanbay et al. did not find significant differences in ECG scores for patients with pulmonary vascular obstruction scores <50% or 50%, also assessed with ventilation/perfusion scan.20 Subramaniam et al. used CTPA to assess clot burden score, and they did not see a significant association between ECG score and the anatomic severity of PE.21 This study found a significant association between higher ECG score and a more severe vascular obstruction index. This finding might have potential clinical implications, because some reports suggest that a higher CTPA‐measured clot load score can be associated with poorer outcome in PE.22 However, the utility of CTPA scores of vascular obstruction severity as a marker of clinical evolution is controversial, and several other authors have found that these scores are poor predictors of mortality or adverse outcome events.23, 24 Therefore, the positive correlation between ECG and the vascular obstruction index in our study is interesting mainly in the sense that it independently supports the validity of the ECG score as a marker of a potentially more severe PE.
In this study, we have not systematically excluded patients with comorbidities (eg, chronic obstructive pulmonary disease) that could account for RVD or PH. Our intention was to reflect a real‐life clinical scenario. When a patient attends the emergency room with PE, clinical decisions must usually be taken without complete information on comorbidities that may contribute to the existence of RV overload. Also, these subjects have a reduced cardiorespiratory reserve, and the PE might impose an unbearable strain to the RV, so risk stratification is especially important. Therefore, we felt that the study should include all patients presenting with PE, so that the results can be extrapolated to usual clinical practice.
Our results suggest that, by selecting the appropriate cut‐off value, the ECG score can be used with adequate sensitivity and specificity to exclude and confirm, respectively, RVD in hemodynamically stable PE patients. This finding implies that ECG may be useful to design management strategies in these cases, selecting patients that may benefit from further tests.
There are some limitations for the present study. Echocardiography was not immediately performed after the ECG. Thus, we might have missed some patients who presented with transient RVD, which resolved between tests. It is likely that the correlation between ECG and echocardiography would have improved if this delay had been avoided. Also, we did not use a multidetector scanner for performing CTPAs. Consequently, small emboli might have been missed and the clot score might have been underestimated. It is plausible that this may have reduced to some extent the correlation between ECG and CTPA. Also, this a single‐center study, with relatively few patients studied. Finally, due to the low incidence of adverse events in our patients, our study is underpowered to make conclusions about the independent prognostic value of ECG for predicting adverse events.
In conclusion, an easy‐to‐use ECG score correlates significantly with the severity of PE, as assessed with echocardiography, CTPA, and arterial blood gas analysis, in normotensive patients. It can be used to predict with acceptable sensitivity and specificity the presence of RVD in these cases and, accordingly, it has potential value in risk‐stratification strategies. Larger, multicenter studies, should confirm these results before they can be applied to clinical practice.
The clinical outcome of patients with pulmonary embolism (PE) has a wide spectrum, ranging from a benign course, with early resolution of symptoms, to death. Prognostic stratification of patients with PE is therefore essential to guide therapy. Currently, this stratification is primarily based on blood pressure on admission. Hemodynamic instability or shock carries a bad prognosis, and is associated with a 3‐fold to 7‐fold increase in mortality.1 Thrombolytic therapy is warranted in these cases.2 There is a subset of patients that, despite normal blood pressure on presentation, can subsequently suffer hemodynamic deterioration and death.3
Echocardiography has been proposed as a useful tool to identify a subset of patients at a higher risk. It has been suggested that the finding of right ventricle dysfunction (RVD) in echocardiography predicts a worse prognosis, even in patients with normal blood pressure on presentation.4 Also, computed tomography pulmonary angiography (CTPA) is increasingly used as the main test to diagnose PE. This technique can also assess the degree of pulmonary arterial obstruction and the presence of signs suggestive of RVD. It has been suggested that CTPA findings can predict outcome in PE.5
Electrocardiography (ECG) has a widespread use and is routinely carried out and interpreted in the emergency room. Some ECG findings in patients with PE are suggestive of right ventricular strain and might therefore be used to prioritize cases that require closer monitoring.6
This study was designed with the objectives of assessing the correlation of standard ECG findings with echocardiography and CTPA signs of RVD, with the anatomic severity of the pulmonary vascular obstruction, and with the degree of hypoxemia, in hemodynamically stable patients with PE. Secondary objectives were determining if ECG could accurately predict RVD, and determining the interobserver agreement for the ECG score.
Patients and Methods
Patients and Study Design
We recently carried out a prospective, descriptive, single‐center follow‐up study to assess the prevalence of RVD and pulmonary hypertension (PH) in PE patients who presented with hemodynamic stability.7 We herein analyze ECG findings in these cases. The present, noninterventional study was approved by our institution's review board. The population studied included consecutive patients presenting with PE to our emergency room. Inclusion criteria were age >18 years and PE confirmed by CTPA. Exclusion criteria were high‐risk PE (presence of 2 consecutive systolic blood pressure measurements <90 mm Hg, measured >15 minutes apart or requiring inotropic support); comorbidity predictive of a 6‐month mortality >50% (eg, metastatic cancer or end‐stage respiratory or heart disease); creatinine clearance <35 mL/minute; or allergy to ionidated contrast media. All the patients gave informed consent to participate in the study.
Protocol
Initial assessment included clinical history, physical examination, ECG, arterial blood gas analysis, echocardiography, CTPA, and lower‐limb venous ultrasonography. All included individuals were treated with anticoagulation, and fibrinolytic therapy was not used.
ECG
A standard 12‐lead ECG was promptly obtained for all patients in the emergency room. We used the scoring system described by Daniel et al.8 (Table 1). This score is based on 4 signs that were previously found to be associated with high‐risk PE: tachycardia, incomplete or complete right bundle branch block, T wave inversion, and S1Q3T3 pattern. Two investigators trained in the interpretation of ECG results scored the ECG independently, and were blinded to patient clinical status and to echocardiography and CTPA findings.
| Characteristics | Score |
|---|---|
| |
| Tachycardia (>100 beats/min) | 2 |
| Incomplete right bundle‐branch block | 2 |
| Complete right bundle‐branch block | 3 |
| T‐wave inversion in lead V1 through V4 | 4 |
| T wave inversion in lead V1* | |
| <1 mm | 0 |
| 12 mm | 1 |
| >2 mm | 2 |
| T wave inversion in lead V2* | |
| <1 mm | 1 |
| 12 mm | 2 |
| >2 mm | 3 |
| T wave inversion in lead V3* | |
| <1 mm | 1 |
| 12 mm | 2 |
| >2 mm | 3 |
| S wave in lead 1 | 0 |
| Q wave in lead 3 | 1 |
| Inverted T wave in lead 3 | 1 |
| If all S1Q3T3, add | 2 |
| Total score (maximum: 21) | |
Echocardiography
The study was done as soon as possible after admission using a SONOS 5500 (Hewlett Packard, Palo Alto, CA) ultrasound imaging system with a S4 transducer. In all cases M‐mode, 2‐dimensional, Doppler (continuous and pulsed wave), and color Doppler was performed with the patient in the left lateral position. The structure of the mitral, aortic, tricuspid, and pulmonary valves (different grades of regurgitation and stenosis were assessed), and the systolic and diastolic function of the left ventricle (LV) were systematically assessed.
We assessed if patients had either RVD or isolated PH. Individuals with at least 1 of the following findings were diagnosed as having RVD: right ventricle (RV) hypokinesis (asymmetrical or delayed contraction, usually in the RV base), paradoxical septal systolic motion or right ventricular dilatation (end‐diastolic diameter > 30 mm or right to left ventricular end‐diastolic diameter ratio 1 in the apical 4‐chamber view); PH was defined as pulmonary arterial systolic pressure (PASP) > 40 mm Hg.9 PASP was derived from the right atrioventricular pressure gradient, using peak velocity of tricuspid flow regurgitation with continuous wave Doppler in the apical 4‐chamber view and the modified Bernoulli equation.10 Right atrial pressure was considered equal to 5 mm Hg or 10 mm Hg, according to whether the inferior vena cava collapsed during inspiration, respectively.11
Computed Tomographic Pulmonary Angiography
All CTPAs were performed within 6 hours of patient arrival to the emergency room. Nonionic contrast (100 mL) was administered intravenously at an injection rate of 2.5 mL/second for 40 seconds. Images were obtained on the same single‐detector scanner (Somatron PQ 2000S; Picker International, Cleveland, OH). If possible, scanning was performed during a 32‐second breath hold. If patients were dyspneic, spiral CT angiography was performed during shallow breathing. The scans were obtained using 125 mA and 130 kV. A 5 mm/second table feed was used to scan a 16‐cm volume in the craniocaudal direction (pitch of 1.5). An imaging delay of 20 seconds was used, and overlapping images were reconstructed every 1.5 mm and viewed on films at lung and mediastinal settings.
PE was diagnosed by the on‐duty radiologist if an intraluminal filling defect was seen. For the purpose of the study, the images were reviewed by a senior radiologist. The pulmonary obstruction index was determined according to Qanadli et al.12 The RV to LV diameter ratio was obtained by computing the ratio between the widths of the right and the left ventricular cavities assessed on axial images obtained at the plane of maximal distance between the ventricular endocardial free wall and the interventricular septum, perpendicular to the long axis. A RV/LV ratio > 1 was accepted as suggestive of RV dysfunction. The diameter of the main pulmonary artery (PA) was measured just before the division into its 2 main branches.
Definition of Clinical Endpoints
Primary outcome measures were the prevalence of echocardiography‐assessed RVD or PH at diagnosis, the prevalence of CTPA signs of RVD, the CTPA‐measured severity of the pulmonary vascular obstruction, and the degree of hypoxemia.
Statistical Analysis
Normal distribution of data was assessed using the D'agostino‐Pearson test. Data are shown as mean standard deviation (for normally distributed data) or median (interquartile range) (for non‐normally distributed data). Comparisons between different groups were made using unpaired t test or Wilcoxon rank‐sum test, as appropriate. Correlation between the ECG score and the different variables measured was assessed using Spearman's rank correlation coefficient. Receiver operating characteristic (ROC) curves were constructed to assess the value of ECG score to predict echocardiography or CTPA‐detected RVD. Kappa measurement was performed to examine the interobserver agreement for the ECG score. A 2‐tailed value of P < 0.05 was considered significant.
Results
A total of 103 patients were included in the study (mean age = 69 15 years). One patient died from fatal PE soon after the diagnosis, before echocardiography could be performed. During the 6‐month follow‐up, one patient died from septic shock and another suffered a thromboembolic recurrence (deep vein thrombosis). Echocardiography‐assessed RVD was found in 25 cases (24.5%) and isolated pulmonary hypertension in 20 (19.6%). Median value of the vascular obstruction index was 43.8% (25‐65). Thirty‐three patients (32%) had signs of RVD in CTPA.
Median value of ECG score was 2.5 (1‐6). The level of interobserver agreement regarding ECG score was substantial ( = 0.80). Table 2 shows correlation between ECG score and echocardiography, arterial blood gases, and CTPA parameters. ECG correlated significantly with all the variables measured. Correlation was higher for the vascular obstruction index and the RV/LV ratio, measured with echocardiography. ECG scores were significantly different for groups with varying degrees of severity of PE. Table 3 shows the ECG scores for patients grouped according to different criteria of severity of the disease.
| Variable | R (95% CI) | P |
|---|---|---|
| ||
| Vascular obstruction index | 0.41 (0.220.57) | <0.001 |
| PASP | 0.31 (0.090.49) | 0.006 |
| pO2(A‐a) | 0.29 (0.080.47) | 0.007 |
| PA diameter | 0.28 (0.070.47) | 0.011 |
| RV/LV ratio (echocardiography) | 0.42 (0.220.57) | <0.001 |
| RV/LV ratio (CTPA) | 0.36 (0.130.56) | 0.004 |
| Criteria | ECG score | P |
|---|---|---|
| ||
| RVD (echocardiography) present | 10 [615] | <0.0001 |
| RVD (echocardiography) absent | 2 [04] | |
| PH (echocardiography) present | 6 [1.7512.00] | 0.029 |
| PH (echocardiography) absent | 2 [04] | |
| RVD (CTPA) present | 6 [311] | 0.0015 |
| RVD (CTPA) absent | 2 [13] | |
| Vascular obstruction score >50% | 7 [211] | 0.0005 |
| Vascular obstruction score 50% | 2 [03] | |
| PaO2 < 60 mmHg | 4 [1.252.75] | 0.015 |
| PaO2 60 mmHg | 2 [14] | |
| Bilateral PE | 5 [111] | 0.028 |
| Unilateral PE | 2 [0.754.00] | |
| Central PE | 4 [210] | 0.0011 |
| Peripheral PE | 2 [03] | |
Figure 1 shows the ROC curve for the ECG score and the presence of echocardiography‐detected RVD. Area under the ROC curve was 0.82 (95% confidence interval [CI]: 0.72‐0.89). A cut‐off point of 6 for the ECG score showed the highest accuracy for detecting RVD; sensitivity = 76.5% (95% CI: 50.1‐93.0), specificity = 88.6% (95% CI: 78.7‐94.9), positive likelihood ratio (+LR) = 6.69, negative likelihood ratio (LR) = 0.37. If the ECG score was to be used as a screening method to exclude RVD, a cut‐off point of 0 showed sensitivity = 94.1% (95% CI: 71.2‐99.0), specificity = 27.1% (95% CI: 17.2‐39.1), +LR = 1.29, LR = 0.22. If the ECG score was considered for confirming RVD, the more useful value was 9; sensitivity = 58.8% (95% CI: 33.0‐81.5), specificity = 92.0% (95% CI: 84.1‐97.6), +LR = 8.23, LR = 0.44. Area under the ROC curve to predict CTPA‐detected RVD was slightly lower than for echocardiography: 0.74 (95% CI: 0.61‐0.84).
Discussion
This study shows that a simple, easy‐to‐use ECG scoring system correlates well with the severity of PE, assessed by different methods, in hemodynamically stable patients. Interobserver agreement regarding the scoring system was substantial. Several previous studies have found that ECG signs of RV strain correlate with the presence of RVD.6, 1316 However, some of these studies are limited by a retrospective design that could lead to selection bias or by the inclusion of relatively few (eg, <100) cases.6, 13, 14 Moreover, only a few of these articles have specifically examined patients with normal blood pressure.6, 15 Although our study is still small, one of its strengths is that it prospectively recruited a population of consecutive, normotensive patients and both echocardiography and CTPA were systematically performed. Classifying cases with normal blood pressure by severity is particularly relevant, because of the uncertainty about best treatment when hemodynamic instability is not present. These patients who are not at high risk for PE can be further stratified according to the presence of RVD and/or myocardial injury into intermediate‐risk and low‐risk PE.17 Early hospital discharge or initial outpatient treatment might be considered in low‐risk patients.17, 18 However, echocardiography can be difficult to perform in the emergency setting. Also, the presence of RVD is not easy to predict on clinical grounds. Our study suggests that a standard 12‐lead ECG can be useful to prioritize patients for more exhaustive monitoring or additional risk stratifying tests. An ECG score of 0 would exclude RVD with enough sensitivity to avoid getting an echocardiogram in these cases. On the other hand, a score 9 would suggest the possibility that RVD was present, and an echocardiography ought to be considered in these patients.
Previous studies regarding correlation between ECG and anatomic extension of the pulmonary vascular obstruction in PE have revealed conflicting data. Iles et al. found that ECG score identified those patients with the greatest percentage of perfusion defect on ventilation/perfusion scan.19 However, Kanbay et al. did not find significant differences in ECG scores for patients with pulmonary vascular obstruction scores <50% or 50%, also assessed with ventilation/perfusion scan.20 Subramaniam et al. used CTPA to assess clot burden score, and they did not see a significant association between ECG score and the anatomic severity of PE.21 This study found a significant association between higher ECG score and a more severe vascular obstruction index. This finding might have potential clinical implications, because some reports suggest that a higher CTPA‐measured clot load score can be associated with poorer outcome in PE.22 However, the utility of CTPA scores of vascular obstruction severity as a marker of clinical evolution is controversial, and several other authors have found that these scores are poor predictors of mortality or adverse outcome events.23, 24 Therefore, the positive correlation between ECG and the vascular obstruction index in our study is interesting mainly in the sense that it independently supports the validity of the ECG score as a marker of a potentially more severe PE.
In this study, we have not systematically excluded patients with comorbidities (eg, chronic obstructive pulmonary disease) that could account for RVD or PH. Our intention was to reflect a real‐life clinical scenario. When a patient attends the emergency room with PE, clinical decisions must usually be taken without complete information on comorbidities that may contribute to the existence of RV overload. Also, these subjects have a reduced cardiorespiratory reserve, and the PE might impose an unbearable strain to the RV, so risk stratification is especially important. Therefore, we felt that the study should include all patients presenting with PE, so that the results can be extrapolated to usual clinical practice.
Our results suggest that, by selecting the appropriate cut‐off value, the ECG score can be used with adequate sensitivity and specificity to exclude and confirm, respectively, RVD in hemodynamically stable PE patients. This finding implies that ECG may be useful to design management strategies in these cases, selecting patients that may benefit from further tests.
There are some limitations for the present study. Echocardiography was not immediately performed after the ECG. Thus, we might have missed some patients who presented with transient RVD, which resolved between tests. It is likely that the correlation between ECG and echocardiography would have improved if this delay had been avoided. Also, we did not use a multidetector scanner for performing CTPAs. Consequently, small emboli might have been missed and the clot score might have been underestimated. It is plausible that this may have reduced to some extent the correlation between ECG and CTPA. Also, this a single‐center study, with relatively few patients studied. Finally, due to the low incidence of adverse events in our patients, our study is underpowered to make conclusions about the independent prognostic value of ECG for predicting adverse events.
In conclusion, an easy‐to‐use ECG score correlates significantly with the severity of PE, as assessed with echocardiography, CTPA, and arterial blood gas analysis, in normotensive patients. It can be used to predict with acceptable sensitivity and specificity the presence of RVD in these cases and, accordingly, it has potential value in risk‐stratification strategies. Larger, multicenter studies, should confirm these results before they can be applied to clinical practice.
- ,,.Acute pulmonary embolism: clinical outcomes in the International Cooperative Pulmonary Embolism Registry (ICOPER).Lancet.1999;353:1386–1389.
- ,,,.Thrombolysis compared with heparin for the initial treatment of pulmonary embolism. A meta‐analysis of the randomized controlled trials.Circulation.2004;110:744–749.
- ,,, et al.Management strategies and determinants of outcome in acute major pulmonary embolism: results of a multicenter registry.J Am Coll Cardiol.1997;30:1165–1171
- ,,,,.Prognostic value of echocardiographycally assessed right ventricular dysfunction in patients with pulmonary embolism.Arch Intern Med.2004;164:1685–1689.
- ,,, et al.Right ventricular enlargement on chest computed tomography. A predictor of early death in acute pulmonary embolism.Circulation.2004;110:3276–3280.
- ,,,.Role of electrocardiography in identifying right ventricular dysfunction in acute pulmonary embolism.Am J Cardiol.2005;96:450–452.
- ,,, et al.Right ventricle dysfunction and pulmonary hypertension in hemodynamically stable pulmonary embolism.Respir Med.2010;104:1370–1376.
- ,,.Assessment of cardiac stress from massive pulmonary embolism with 12‐lead ECG.Chest.2001;120:474–481.
- ,,, et al.Clinical correlates and reference intervals for pulmonary artery systolic pressure among echocardiographically normal subjects.Circulation.2001;104:2797–2802.
- ,,, et al.Quantitative assessment of pulmonary hypertension in patients with tricuspid regurgitation using continuous wave Doppler ultrasound.J Am Coll Cardiol.1985;6:359–365.
- ,,.Noninvasive estimation of right atrial pressure from the inspiratory collapse of the inferior vena cava.Am J Cardiol.1990;66:493–496.
- ,,, et al.New CT index to quantify arterial obstruction in pulmonary embolism: comparison with angiographic index and echocardiography.AJR Am J Roentgenol.2001;176:1415–1420.
- ,,.Electrocardiographic score and short‐term outcomes of acute pulmonary embolism.Am J Cardiol.2007;100:1172–1176.
- ,,, et al.Is it possible to use standard electrocardiography for risk assessment of patients with pulmonary embolism?Kardiol Pol.2009;67:744–750.
- ,,, et al.Prognostic value of ECG among patients with acute pulmonary embolism and normal blood pressure.Am J Med.2009;122:257–264.
- ,,,,.QR in V1‐an ECG sign associated with right ventricular strain and adverse clinical outcome in pulmonary embolism.Eur Heart J.2003;24:1113–1119.
- ,,, et al.Guidelines on the diagnosis and management of acute pulmonary embolism. The Task Force for the Diagnosis and Management of Acute Pulmonary Embolism of the European Society of Cardiology (ESC).Eur Heart J.2008;29:2276–2315.
- .Acute pulmonary embolism.N Eng J Med.2008;359:2804–2813.
- ,,,,.ECG score predicts those with the greatest percentage of perfusion defects due to acute pulmonary thromboembolic disease.Chest.2004;125:1651–1656.
- ,,, et al.Electrocardiography and Wells scoring in predicting the anatomic severity of pulmonary embolism.Respir Med.2007;101:1171–1176.
- ,,, et al.Pulmonary embolism outcome: a prospective evaluation of CT pulmonary angiographic clot burden score and ECG score.AJR Am J Roentgenol.2008;190:1599–1604.
- ,,, et al.Right ventricular dysfunction and pulmonary obstruction index at helical CT: prediction of clinical outcome during 3‐month follow‐up in patients with acute pulmonary embolism.Radiology.2005;235:798–803.
- ,,,,.Acute PE mortality prediction by analysis of helical computed tomography angiography and hemodynamic evaluation.Thorax.2005;60:956–961.
- ,,,,.Pulmonary embolism: prognostic CT findings.Radiology.2007;242:889–893.
- ,,.Acute pulmonary embolism: clinical outcomes in the International Cooperative Pulmonary Embolism Registry (ICOPER).Lancet.1999;353:1386–1389.
- ,,,.Thrombolysis compared with heparin for the initial treatment of pulmonary embolism. A meta‐analysis of the randomized controlled trials.Circulation.2004;110:744–749.
- ,,, et al.Management strategies and determinants of outcome in acute major pulmonary embolism: results of a multicenter registry.J Am Coll Cardiol.1997;30:1165–1171
- ,,,,.Prognostic value of echocardiographycally assessed right ventricular dysfunction in patients with pulmonary embolism.Arch Intern Med.2004;164:1685–1689.
- ,,, et al.Right ventricular enlargement on chest computed tomography. A predictor of early death in acute pulmonary embolism.Circulation.2004;110:3276–3280.
- ,,,.Role of electrocardiography in identifying right ventricular dysfunction in acute pulmonary embolism.Am J Cardiol.2005;96:450–452.
- ,,, et al.Right ventricle dysfunction and pulmonary hypertension in hemodynamically stable pulmonary embolism.Respir Med.2010;104:1370–1376.
- ,,.Assessment of cardiac stress from massive pulmonary embolism with 12‐lead ECG.Chest.2001;120:474–481.
- ,,, et al.Clinical correlates and reference intervals for pulmonary artery systolic pressure among echocardiographically normal subjects.Circulation.2001;104:2797–2802.
- ,,, et al.Quantitative assessment of pulmonary hypertension in patients with tricuspid regurgitation using continuous wave Doppler ultrasound.J Am Coll Cardiol.1985;6:359–365.
- ,,.Noninvasive estimation of right atrial pressure from the inspiratory collapse of the inferior vena cava.Am J Cardiol.1990;66:493–496.
- ,,, et al.New CT index to quantify arterial obstruction in pulmonary embolism: comparison with angiographic index and echocardiography.AJR Am J Roentgenol.2001;176:1415–1420.
- ,,.Electrocardiographic score and short‐term outcomes of acute pulmonary embolism.Am J Cardiol.2007;100:1172–1176.
- ,,, et al.Is it possible to use standard electrocardiography for risk assessment of patients with pulmonary embolism?Kardiol Pol.2009;67:744–750.
- ,,, et al.Prognostic value of ECG among patients with acute pulmonary embolism and normal blood pressure.Am J Med.2009;122:257–264.
- ,,,,.QR in V1‐an ECG sign associated with right ventricular strain and adverse clinical outcome in pulmonary embolism.Eur Heart J.2003;24:1113–1119.
- ,,, et al.Guidelines on the diagnosis and management of acute pulmonary embolism. The Task Force for the Diagnosis and Management of Acute Pulmonary Embolism of the European Society of Cardiology (ESC).Eur Heart J.2008;29:2276–2315.
- .Acute pulmonary embolism.N Eng J Med.2008;359:2804–2813.
- ,,,,.ECG score predicts those with the greatest percentage of perfusion defects due to acute pulmonary thromboembolic disease.Chest.2004;125:1651–1656.
- ,,, et al.Electrocardiography and Wells scoring in predicting the anatomic severity of pulmonary embolism.Respir Med.2007;101:1171–1176.
- ,,, et al.Pulmonary embolism outcome: a prospective evaluation of CT pulmonary angiographic clot burden score and ECG score.AJR Am J Roentgenol.2008;190:1599–1604.
- ,,, et al.Right ventricular dysfunction and pulmonary obstruction index at helical CT: prediction of clinical outcome during 3‐month follow‐up in patients with acute pulmonary embolism.Radiology.2005;235:798–803.
- ,,,,.Acute PE mortality prediction by analysis of helical computed tomography angiography and hemodynamic evaluation.Thorax.2005;60:956–961.
- ,,,,.Pulmonary embolism: prognostic CT findings.Radiology.2007;242:889–893.
Copyright © 2010 Society of Hospital Medicine
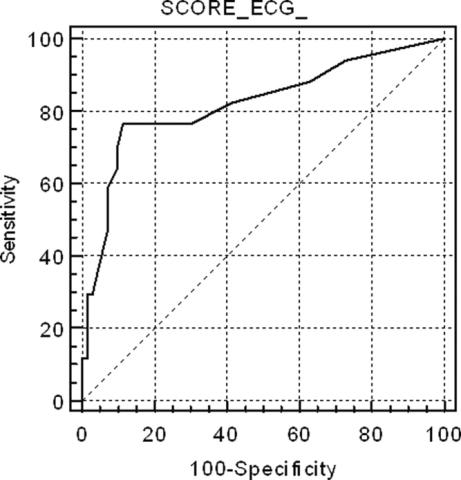
Continuing Medical Education Program in
If you wish to receive credit for this activity, please refer to the website: www.wileyblackwellcme.com.
Accreditation and Designation Statement
Blackwell Futura Media Services designates this journal‐based CME activity for a maximum of 1 AMA PRA Category 1 Credit.. Physicians should only claim credit commensurate with the extent of their participation in the activity.
Blackwell Futura Media Services is accredited by the Accreditation Council for Continuing Medical Education to provide continuing medical education for physicians.
Educational Objectives
Upon completion of this educational activity, participants will be better able to:
Illustrate the elements of a systematic approach to successful hospital smoking cessation programs.
Describe the efficacy of a coordinated real world” hospital smoking cessation program in a U.S. hospital.
Evaluate the barriers to successful hospital smoking cessation programs.
This manuscript underwent peer review in line with the standards of editorial integrity and publication ethics maintained by Journal of Hospital Medicine. The peer reviewers have no relevant financial relationships. The peer review process for Journal of Hospital Medicine is blinded. As such, the identities of the reviewers are not disclosed in line with the standard accepted practices of medical journal peer review.
Conflicts of interest have been identified and resolved in accordance with Blackwell Futura Media Services's Policy on Activity Disclosure and Conflict of Interest. The primary resolution method used was peer review and review by a non‐conflicted expert.
Instructions on Receiving Credit
For information on applicability and acceptance of CME credit for this activity, please consult your professional licensing board.
This activity is designed to be completed within an hour; physicians should claim only those credits that reflect the time actually spent in the activity. To successfully earn credit, participants must complete the activity during the valid credit period, which is up to two years from initial publication.
Follow these steps to earn credit:
Log on to www.wileyblackwellcme.com
Read the target audience, learning objectives, and author disclosures.
Read the article in print or online format.
Reflect on the article.
Access the CME Exam, and choose the best answer to each question.
Complete the required evaluation component of the activity.
This activity will be available for CME credit for twelve months following its publication date. At that time, it will be reviewed and potentially updated and extended for an additional twelve months.
If you wish to receive credit for this activity, please refer to the website: www.wileyblackwellcme.com.
Accreditation and Designation Statement
Blackwell Futura Media Services designates this journal‐based CME activity for a maximum of 1 AMA PRA Category 1 Credit.. Physicians should only claim credit commensurate with the extent of their participation in the activity.
Blackwell Futura Media Services is accredited by the Accreditation Council for Continuing Medical Education to provide continuing medical education for physicians.
Educational Objectives
Upon completion of this educational activity, participants will be better able to:
Illustrate the elements of a systematic approach to successful hospital smoking cessation programs.
Describe the efficacy of a coordinated real world” hospital smoking cessation program in a U.S. hospital.
Evaluate the barriers to successful hospital smoking cessation programs.
This manuscript underwent peer review in line with the standards of editorial integrity and publication ethics maintained by Journal of Hospital Medicine. The peer reviewers have no relevant financial relationships. The peer review process for Journal of Hospital Medicine is blinded. As such, the identities of the reviewers are not disclosed in line with the standard accepted practices of medical journal peer review.
Conflicts of interest have been identified and resolved in accordance with Blackwell Futura Media Services's Policy on Activity Disclosure and Conflict of Interest. The primary resolution method used was peer review and review by a non‐conflicted expert.
Instructions on Receiving Credit
For information on applicability and acceptance of CME credit for this activity, please consult your professional licensing board.
This activity is designed to be completed within an hour; physicians should claim only those credits that reflect the time actually spent in the activity. To successfully earn credit, participants must complete the activity during the valid credit period, which is up to two years from initial publication.
Follow these steps to earn credit:
Log on to www.wileyblackwellcme.com
Read the target audience, learning objectives, and author disclosures.
Read the article in print or online format.
Reflect on the article.
Access the CME Exam, and choose the best answer to each question.
Complete the required evaluation component of the activity.
This activity will be available for CME credit for twelve months following its publication date. At that time, it will be reviewed and potentially updated and extended for an additional twelve months.
If you wish to receive credit for this activity, please refer to the website: www.wileyblackwellcme.com.
Accreditation and Designation Statement
Blackwell Futura Media Services designates this journal‐based CME activity for a maximum of 1 AMA PRA Category 1 Credit.. Physicians should only claim credit commensurate with the extent of their participation in the activity.
Blackwell Futura Media Services is accredited by the Accreditation Council for Continuing Medical Education to provide continuing medical education for physicians.
Educational Objectives
Upon completion of this educational activity, participants will be better able to:
Illustrate the elements of a systematic approach to successful hospital smoking cessation programs.
Describe the efficacy of a coordinated real world” hospital smoking cessation program in a U.S. hospital.
Evaluate the barriers to successful hospital smoking cessation programs.
This manuscript underwent peer review in line with the standards of editorial integrity and publication ethics maintained by Journal of Hospital Medicine. The peer reviewers have no relevant financial relationships. The peer review process for Journal of Hospital Medicine is blinded. As such, the identities of the reviewers are not disclosed in line with the standard accepted practices of medical journal peer review.
Conflicts of interest have been identified and resolved in accordance with Blackwell Futura Media Services's Policy on Activity Disclosure and Conflict of Interest. The primary resolution method used was peer review and review by a non‐conflicted expert.
Instructions on Receiving Credit
For information on applicability and acceptance of CME credit for this activity, please consult your professional licensing board.
This activity is designed to be completed within an hour; physicians should claim only those credits that reflect the time actually spent in the activity. To successfully earn credit, participants must complete the activity during the valid credit period, which is up to two years from initial publication.
Follow these steps to earn credit:
Log on to www.wileyblackwellcme.com
Read the target audience, learning objectives, and author disclosures.
Read the article in print or online format.
Reflect on the article.
Access the CME Exam, and choose the best answer to each question.
Complete the required evaluation component of the activity.
This activity will be available for CME credit for twelve months following its publication date. At that time, it will be reviewed and potentially updated and extended for an additional twelve months.
Copyright © 2010 Society of Hospital Medicine
Hospitalists and Sickle Cell Disease
Severe, disabling pain, often requiring opioids, is the most common medical presentation for children and adults with sickle cell disease (SCD), an autosomal recessive red blood cell disorder affecting those of African, Mediterranean, and Asian descent.1, 2 A genetically controlled hemoglobin alteration impairs oxygen binding, and enables polymerization of deoxy‐hemoglobin, resulting in, classically, sickle‐shaped erythrocytes3 and a complex cascade of ischemia and vaso‐occlusion in the microcirculation.4, 5
Dramatic gains in the treatment of SCD in childhood have resulted in markedly improved survival through adulthood.68 Thus, the need for adult SCD care is relatively new and rapidly growing. In 2005, approximately 70% of the nearly 80,000 US SCD hospitalizations occurred in adults versus children (Table 1). These hospitalizations occurred in the context of a poorly coordinated American health care system,9 despite the hopes raised by the Patient‐Centered Medical Home10 and the Chronic Care Model.11
| 2005 | 2008 | ||||||
|---|---|---|---|---|---|---|---|
| Total No. of Discharges | LOS | Total No. of Discharges | LOS | ||||
| |||||||
| All discharges | 79,187 | 100.00% | 5.3 | 70,121 | 100.00% | 5.4 | |
| Age group | 1 | 996 | 1.26% | 2.5 | 513 | 0.73% | 2.7 |
| 1‐17 | 23,134 | 29.21% | 3.9 | 13,754 | 19.62% | 3.8 | |
| 18‐44 | 48,168 | 60.83% | 6 | 48,021 | 68.48% | 5.8 | |
| 45‐64 | 6,527 | 8.24% | 6 | 7,543 | 10.76% | 5.6 | |
| 65‐84 | 281 | 0.35% | 6.4 | 221 | 0.32% | 5.6 | |
| Missing | 81 | 0.10% | 4 | 70 | 0.10% | 3.0 | |
Adults with SCD are vulnerable both because they are usually members of racial and ethnic minority groups, and because they have a Food and Drug Administration (FDA)‐defined orphan disease.12 They often do not receive the only FDA‐approved medication for SCD, life‐saving hydroxyurea,13 recommended for adults with homozygous sickle cell anemia (Hb SS) and sickle‐othalassemia (Hb SoThal).14 Young adults often fail to experience a smooth transition of care from children's hospitals, falling into a medical abyss.15
Therefore, increasingly, hospitalists are managing adults with SCD, rather than adult hematologyoncology, pain, or palliative care specialists. Adults with SCD experience negative opinions, bilateral lack of trust, and conflict in the doctorpatient relationship, frequently cited in studies of SCD adults and providers in the literature.16, 17
Evidence Base
General guidelines for SCD management have been published by the National Institutes of Health (NIH)18 and the Agency for Healthcare Policy and Research.19 But one of us (K.L.H.) found evidence lacking with regard to SCD pain management.20 Published guidelines on general pain management, such as the World Health Organization's Analgesic Ladder,21 do not address SCD. A Cochrane Review of pain management in SCD found only 9 randomized controlled trials, all with small numbers of patients, addressing acute SCD pain only.22 As well, American and British consensus SCD pain guidelines23, 24 admit, and subsequent publications emphasize,25, 26 the lack of evidence for what to do or not do for SCD pain management. At least 1 well‐done summary of the SCD evidence base intended for hospitalists has been published, but it focuses on management of issues other than pain.27
Motivations and Fears
It is not surprising then that hospitalists may bring great fear and apprehension with them into their care of SCD patients. One of us (W.R.S.), a general internist, has been called by his own and 3 other academic medical centers, 2 with active Federally‐funded SCD research programs, to address the problems of high‐utilizing adults with SCD, including counseling hospitalists frustrated with the management of pain in these patients.
Hospitalists may be motivated to provide efficient inpatient management (Table 2), and be aware of pain as the primary symptom of SCD inpatients. But they may carry knowledge gaps and biases into their relationships with SCD inpatients. They may fear opioid administration (opiophobia), loss of licensure or governmental reprisals because of high‐dose prescription of opioids, or may believe that SCD patients are more often addicted than most.17, 28 Consequently, more troublesome hospital stays may occur when patients are not rapidly and adequately titrated to appropriate analgesic doses, or when unnecessary deleterious side effects result from opioid and other analgesics. We therefore offer answers to frequently asked questions (FAQs) about pain management by hospitalists caring for adults with SCD. We address FAQs arising during the prototypical situationa patient with SCD admitted for a painful exacerbation, and little or no acute comorbidity. We refer the reader to the aforementioned articles and guidelines to address other treatment issues in adults with SCD.
| Principle | Obstacles |
|---|---|
| |
| Make appropriate management handoffs for patients coming from the ED to promote continuity of care and shorten hospitalization | Poor information systems and poor handoffs/continuity from ED management to hospital management |
| Get as much preexisting information about the patient as possible to inform acute care, avoid returns or further hospitalization | Patient may have no primary care physician or may underutilize primary care |
| Patient may misuse ED and hospital (as primary care source) | |
| Provide rapid and adequate analgesia | Ignorance of the differences between tolerance, physical dependence, addiction, and pseudoaddiction |
| No specific data on pharmacodynamics of opioid analgesics in sickle cell disease | |
| Don't lose licensure or arouse regulatory suspicion about prescribing patterns | Ignorance of DEA monitoring and laws governing appropriate vs inappropriate prescribing of opioids |
| Get the patient discharged as soon as medically appropriate | Difficulty assessing pain quality and intensity |
| Difficulty assessing/avoiding side effects of analgesics | |
| Difficulty determining appropriateness/timing of changes in analgesic dosing, discharge planning | |
| Make appropriate handoffs with the patient's usual source of continuity care (provide that source when necessary) to avoid returns or further hospitalization | Patient may have no primary care physician or may underutilize primary care physician |
| Patient may be mis/underprescribed analgesics by primary care physician | |
| Define and maintain appropriate roles for hospitalists vs physicians with sickle cell training, pain specialists, or other specialists | Inadequate adult system of care for sickle cell disease (no/paucity of specialty care) |
| Multiple prescribers of opioids | |
| Providers unwilling to care for or prescribe opioids for sickle cell patients | |
FAQS
-
Is there any objective way to tell when SCD patients really are in a crisis?
Although the term crisis is used as if it were an objectively definable biological entity, no one has proposed a standard definition of a crisis based on pain intensity level, clinical features, or biomarkers. Measures of vaso‐occlusion are correlated with ischemic pain, including pain that is often called a crisis.2932 However, neither ischemic pain from SCD, nor the underlying vaso‐occlusive cascade that is associated with this pain, is a sudden, present‐or‐absent phenomenon. Instead, these are continua that can be measured using pain scales or various biomarkers.
There is, however, correlative evidence of the intensity of SCD pain associated with various distinctive health states (admitted/not admitted, in crisis/not in crisis). The most visible measure of a crisis, health care utilization, was a strong predictor of mortality in the Cooperative Study of Sickle Cell Disease. Patients with 3 or more admissions per year had a lower 5‐year survival rate.33 In contrast, crisis in the landmark Pain in Sickle Cell Epidemiology Study (PiSCES) was self‐defined by patients.34 Despite being in pain on over half of their days on average, and despite a third of patients being in pain daily, most pain in PiSCES was not considered a crisis, and less than 5% of patients' days were spent in emergency departments (EDs) or hospitals. Ambulatory pain intensity reports were correlated with opioid use.35 A substantial minority (35%) of PiSCES patients made at least 3 ED visits per year. However, these high ED utilizers had worse laboratory values, more pain, more distress, and a lower quality of life.36
Importantly, sometimes adults with SCD may have severe comorbidities which may not be addressed or may be mistakenly managed as an acute vaso‐occlusive episode without further investigation or timely specialist consultation. Although pain is primarily the individual's chief complaint, any potential relationship between the presence of medical comorbidities and pain should be examined when patients are admitted.
-
How can one know when opioid dosages should be changed, or when SCD pain is appropriately controlled to allow discharge?
We recommend, as a standard of care, that SCD pain assessment and pain therapy be interwoven, despite a systematic review finding no evidence that directly linked the timing, frequency, or method of pain assessment with outcomes or safety in medical inpatients, and concluding that the safety and effectiveness of patient‐controlled analgesia (PCA) in medical patients had not been adequately studied.37 Hospitalists should focus the first 24 hours of inpatient SCD pain management on cycles of recurrent pain assessment and opioid dose titration as frequently as every 1 to 2 hours, to assure safe and rapidly efficacious analgesia. Pain intensity, duration, and character should be assessed directly. Intensity is often assessed using a visual analog scale (VAS) or numeric rating scale.38 Treating physicians should themselves directly assess pain during discussions of therapy with the patient, even though some assessment usually is done in hospitals during each nursing shift. Pain and pain relief can be assessed indirectly by monitoring opioid use.
We recommend PCA for inpatients with SCD, administered as an intermittent demand dose (patient must push a button) of opioid, with or without a background opioid constant infusion.39 We usually set the interval between doses, or lockout, to 6 to 10 minutes. Both the lockout and the sedation from delivered doses prevent patients from pushing the demand button repetitively to the point of overdose. Use of a low‐level constant infusion (basal) may sustain pain control during times when the patient is asleep, avoiding recrudescent pain and lost ground due to inadequate analgesia during rest. Alternatively, long‐acting oral opioids may be continued if already used at home, or newly introduced to provide adequate baseline pain control which is augmented by the demand dosing. Most PCA pumps monitor hourly opioid dose demand (number of pushes), as well as hourly doses delivered. Both hourly opioid dose demand and hourly dose‐per‐demand ratio are measures of PCA efficacy or futility. Pumps record this data, and can be interrogated at the patient's bedside for up to several days of prior use. Physicians should combine pump interrogation with direct pain assessment to guide demand‐dose titration. Demand doses should be increased to 1.5 to 2 times the previous demand dose after several hours of failed reduction of pain intensity and duration, and/or persistently futile dose‐per‐demand ratios.
PCA interrogation is also useful for conversion of parenteral opioids to oral opioids, as well as to guide the recommendation for discharge home. After the first 24‐48 hours of up‐titration, if opioid dose demand decreases concordantly with pain frequency and intensity, the demand dose may be safely decreased, and eventually daily PCA requirements may be summed and converted to oral medication using standard opioid dose conversion tables. At this point, physicians may use single measures or daily averages of directly assessed pain.
Routine PCA use in SCD is backed by some evidence.40, 41 But we find it important that patients be taught and encouraged to use the demand feature of PCA. Still, for various reasons, some patients do not use PCA pumps well. Discordant or unreliable assessments (eg, high pain intensity but low‐opioid demand doses during the same interval) may result, and PCA potentially may fail as a dosing strategy. Management is more difficult for these patients. One alternative dosing strategy is prescription of scheduled doses of a short‐acting opioid, attaching to each dose the order, patient may refuse. This is different than dosing as needed, and allows counts of dose refusals over an interval, analogous to PCA pump interrogation.
-
How much is too much opioid? Should one rely on side effects, or on requests for medicine, or is there a ceiling dose?
Addictionologists, pain specialists, oncologists, those involved in hospice care, and some hematologists caring for SCD patients agree that, in general, there should be no a priori dose limitations imposed on opioid prescribing for acute pain. Instead, titration of dose of opioid to pain relief is a central principle of acute pain management. Experts also agree that particular opioids carry particular side effects which warrant dose limitation, adjustments, or avoidance of that opioid altogether. A summary of opioids commonly used in SCD, along with warnings and implied dose limitations is found in Table 3.
For safety, it is important to assess the history of prior opioid use to recognize a patient who is not tolerant to opioids (see below, FAQ 4), to avoid mistakenly overdosing a patient using doses often required by tolerant patients. In lieu of a pre‐written, individualized opioid dosing plan in place for the patient, the patient may be the best source of information regarding preferred medication and tolerated doses.
The reader is referred to standard texts for a description of opioids, their pharmacokinetics and pharmacodynamics, and their addictive and abuse potential. The side‐effect profile of opioids is well‐known: nausea, vomiting, and itching frequently occur; hallucinations, respiratory suppression, and myoclonus occur infrequently.42 Meperidine may more readily cause central nervous system (CNS) dysfunction, including seizures, as compared to other commonly used opioids, because of its toxic metabolite nor‐meperidine. Use of meperidine is often avoided, especially use via PCA.43 Methadone may cause dysrhythmias, specificially corrected Q‐T interval (QTc) prolongation and torsades de pointes on an electrocardiogram, in doses above 200 mg per day.44 Some recommend baseline and yearly electrocardiogram monitoring when giving methadone chronically.
Recognizing the potential dangers of opioids, it is also reasonable to look for opioid‐sparing analgesic strategies. Non‐opioid analgesics such as ketorolac45 and adjuvants such as ketamine46 that are opioid‐sparing should be considered whenever feasible. Complementary and alternative therapies such as transcutaneous electrical nerve stimulation (TENS)47 have less evidence of effectiveness, but have limited risks and may be of use for some individuals.
-
What are the major signs of substance abuse (opioids, street drugs) in SCD patients already on opioids, and can a hospitalist judge those signs acutely and intervene appropriately?
Reports of underprescription of opioids in SCD have cited physician fear of abuse and addiction.48 A recent informal poll of adult sickle cell providers suggests policies vary on how potential abuse is monitored in ambulatory sickle cell patients. We note that physicians, especially upon meeting a patient for the first time, may be unable to reliably judge whether that patient is abusing opioids or street drugs. Both false‐positive and false‐negative diagnoses may be made.49 Repetitive reports of lost or stolen prescriptions or pill bottles, receipt of prescriptions from multiple providers, or repeated requests for early refills increase the suspicion of misuse or abuse, but are indirect evidence. Urine and serum monitoring may be useful, but may give incorrect information if misinterpreted or not conducted frequently enough to improve sensitivity.50
It is important to distinguish between tolerance, the decreased analgesic response over time to repeated doses of the same drug; physical dependence, the production of withdrawal upon abrupt discontinuation of an opioid agonist or administration of an antagonist; and addiction, the psychological dependence upon opioids. Tolerance may be misperceived as true addiction. Its earliest symptom is shortening of the duration of effective analgesia. In contrast, addiction may be manifested by dose escalation in the absence of an increased pain stimulus, or by use of opioids for purposes other than pain relief.51 These are not easily distinguished during a single patient encounter.
SCD patients' requests for specific opioid medications in specific doses, should not be taken as evidence of past or current abuse, but rather evidence of a well‐informed, self‐managing patient. Adults with SCD are clearly expected to be very knowledgeable about and tolerant to opioids if they have had a life of pain as a child, and will require higher doses of opioids than other patients treated by most hospitalists. The issue of medication abuse may be best handled in the ambulatory setting. Whenever possible, hospitalists should not rely only on data from the acute care setting to manage patients. Ambulatory providers may conduct random, unannounced urine and/or serum testing, as part of an opioid prescribing agreement that is written and filed in the patient's chart. Assays for prescribed opioids (especially long‐acting agents), as well as assays for common drugs of abuse, should be conducted. Comanagement with an addictionologist, psychiatrist, or psychologist should be considered in individuals suspected of opioid abuse.
We do not suggest routine urine drug test monitoring of all SCD patients unless routine monitoring is done as a policy for all patients on opioids. Though the prevalence of addiction may be higher in subpopulations of patients with pain,52 and though prescription of opioids, prescription drug abuse, and accidental deaths from prescribed opioids have risen exponentially in the last several years,53 in our experience and in the published literature, drug misuse/abuse among SCD patients is no worse than among patients with other illnesses.5456 However, pseudoaddiction, the appropriate seeking of needed opioids from multiple physicians because of uncontrolled pain and opioid underprescription, may well be prevalent in SCD,57 and may be mistaken for true addiction.
-
How can patients' readiness for discharge be assessed? What can be done for the patient who has lengthy and/or multiple hospitalizations or frequent ED visits?
The appropriate time for discharge in most patients is when they can manage their pain at home with oral opioids or less. Often, patients do not improve even after a few days of inpatient therapy.58 A typical pain episode may last much longer than the 6‐day average US hospital length of stay for a diagnosis of sickle cell crisis among 18‐44 year olds (Table 1).59 Patients may return and be readmitted.60, 61 But in the best cases, pain resolves or reverts to a usual chronic intensity level. As described in FAQ 2, daily or more frequent pain assessment is a bedrock for making discharge decisions. Patients well‐experienced in the use of pain intensity scales can report their usual pain intensity at home, and how close they are to their baseline pain intensity. Simply asking patients, Are you ready for discharge? is appropriate and may yield a surprising positive response. In a recent inpatient trial of PCA (manuscript in preparation), adult patients were admitted with a minimum pain intensity of 45 mm on a 100 mm horizontal VAS scale after treatment in the ED, and mean pain intensity of 76 mm 10 mm. All adults in this study were discharged with pain that was clinically significantly lower. Researchers have found a VAS change of 13.5 mm to be the minimum clinically significant change62 during treatment of vaso‐occlusive crisis.63
Unremitting pain despite appropriate titration of opioids and prolonged hospital stays suggests the need for comprehensive evaluation for medical and psychosocial comorbidities, as is done for other patients with chronic pain syndromes. If not already done, discussion with the patient's primary care provider may reveal factors impacting on persistent pain. Consultation with a hematologist, pain or palliative care specialist, or other provider familiar with SCD may prove helpful. Implementation of adjuvant therapies as discussed in FAQ 3 and adding long‐acting oral opioids to continue postdischarge may also help. Hyperalgesia, or heightened sensitivity to pain, is normal after acute tissue injury, but is now suspected in SCD as a long‐term neuropathic pain syndrome, as a consequence either of repeated painful crises or of chronic opioid therapy.2 Only some centers have specialists qualified to test for and diagnose neuropathic pain.64
Discharge planning should include identification of a source of outpatient follow‐up. Opioids prescribed at discharge should be sufficient to last at least until the first outpatient appointment, to avoid repeated ED or hospital visits. Communication with a primary care provider at discharge can enhance successful care transition. Otherwise, for patients without established providers, social workers and others may address barriers to follow‐up that frustrate both patient and provider.
| Opioid | Used Frequently (>20% of Patients) | How Used | Unique Side Effects and/or Dose Limitations |
|---|---|---|---|
| |||
| Short‐acting | |||
| Codeine | No | Inpatient, parenteral; Ambulatory, oral | |
| Oxycodone | Yes | Most commonly used ambulatory opioid | |
| Morphine | Yes | Most commonly used inpatient opioid | |
| Hydromorphone | Yes | Inpatient more than ambulatory | |
| Fentanyl | No | Inpatient, parenteral | Short‐acting |
| Hydrocodone | No | Ambulatory | |
| Meperedine | No | Avoided | Unpredictable seizure, coma, death |
| Propoxyphene | No | Ambulatory | |
| Tramadol | No | Ambulatory | |
| Long‐acting | |||
| Oxycodone | No | Ambulatory and as an oral basal in inpatients | Abuse potential from capsule manipulation |
| Morphine | Yes | Ambulatory and as an oral basal in inpatients; most commonly used long‐acting opioid | |
| Methadone | No | Ambulatory and as an oral basal in inpatients | Dose‐dependent prolongation of QTc, torsades de pointes |
| Fentanyl | No | Ambulatory and as a transdermal basal in inpatients | Abuse potential from transdermal patch manipulation |
Support for Hospitalists Managing Adults With Sickle Cell Disease
Beside the general advice on pain management in SCD mentioned above or found in the bibliography of this article, at long last, a group of adult practitioners skilled in the care of SCD has formed nationally. The Sickle Cell Adult Provider Network [
Ultimately, evidence and updated guidelines will be the best support for hospitalists and others managing pain in SCD. The hope is that SCD will receive the attention it deserves, so that practitioners and patients alike do not suffer continued pain from this disease or its management.
- .Sickle‐cell disease.Lancet.1997;350(9079):725–302.
- ,.Sickle‐cell pain: advances in epidemiology and etiology.Hematology Am Soc Hematol Educ Program.2010;409–415. PMID: 21239827.
- .Management of sickle cell disease.N Engl J Med.1999;340:1021–1030.
- ,,.A systems biology consideration of the vasculopathy of sickle cell anemia: the need for multi‐modality chemo‐prophylaxsis.Cardiovasc Hematol Disord Drug Targets.2009;9(4):271–292.
- ,,.Newer aspects of the pathophysiology of sickle cell disease vaso‐occlusion [review].Hemoglobin.2009;33(1):1–16.
- ,,,.National trends in the mortality of children with sickle cell disease, 1968 through 1992.Am J Public Health.1997;87(8):1317–1322.
- ,,, et al.Prevention of a first stroke by transfusions in children with sickle cell anemia and abnormal results on transcranial Doppler ultrasonography.N Engl J Med.1998;339:5–11.
- ,.Optimizing primary stroke prevention in sickle cell anemia (STOP 2) trial investigators. Discontinuing prophylactic transfusions used to prevent stroke in sickle cell disease.N Engl J Med.2005;353(26):2769–2778.
- .Homeostasis without reserve—the risk of health system collapse.N Engl J Med.2002;347(24):1971–1975.
- The Advanced Medical Home: A Patient‐Centered, Physician‐Guided Model of Health Care [Policy Monograph].Philadelphia, PA:American College of Physicians;2006.
- ,,,,,.Quality improvement in chronic illness care: a collaborative approach.Jt Comm J Qual Improv.2001;27:63–80.
- Definition of Disease Prevalence for Therapies Qualifying Under the Orphan Drug Act. Subpart C, Designation of an Orphan Drug. Sec. 316.20. Content and format of a request for orphan‐drug designation. Available at: http://www.fda.gov/orphan/designat/prevalence.html. Accessed September 3,2008.
- ,,, et al.Effect of hydroxyurea on mortality and morbidity in adult sickle cell anemia: risks and benefits up to 9 years of treatment.JAMA.2003;289:1645–1651.
- ,,,.Provider barriers to hydroxyurea use in adults with sickle cell disease: a survey of the Sickle Cell Disease Adult Provider Network.J Natl Med Assoc.2008;100(8):968–973.
- ,,,,.Transition from pediatric to adult care in sickle cell disease: establishing evidence‐based practice and directions for research.Am J Hematol.2011;86(1):116–120. PMID: 21061308.
- ,,,,,.Health perceptions and medical care opinions of inner‐city adults with sickle cell disease or asthma compared with those of their siblings.South Med J.1989;82(1):9–12.
- ,,,.Sickle cell‐related pain: perceptions of medical practitioners.J Pain Symptom Manage.1997;14(3):168–174.
- The Management of Sickle Cell Disease.4th ed. NIH Publication 2002–2117.Washington, DC:National Institutes of Health, National Heart, Lung, and Blood Institute, Division of Blood Diseases and Resources; June2002.
- Pain Management Guideline.Washington, DC:Agency for Health Care Policy and Research;1992.
- ,.An evidence‐based approach to the treatment of adults with sickle cell disease.Hematology Am Soc Hematol Educ Program.2005;58–65.
- World Health Organization: Cancer Pain Relief.Geneva, Switzerland:WHO,1986.
- ,.Pain management for sickle cell disease.Cochrane Database Syst Rev. April 19,2006;(2):CD003350.
- ,,;for the Guideline Committee.Guidelines for the Management of Acute and Chronic Pain in Sickle Cell Disease. APS Clinical Practice Guideline Series, No 1.Glenview, IL:American Pain Society;1999.
- .Guidelines for the management of the acute painful crisis of sickle cell disease.Br J Haematol.2003;120:744–752.
- ,,.Acute pain in children and adults with sickle cell disease: management in the absence of evidence‐based guidelines.Curr Opin Hematol.2009;16(3):173–178.
- ,,,.Opioids and the treatment of chronic pain: controversies, current status, and future directions.Exp Clin Psychopharmacol.2008;16(5):405–416.
- .A sickle cell primer.The Hospitalist.2006;10(10):39–41.
- .The barriers to adequate pain management with opioid analgesics.Semin Oncol.1993;20(2 suppl 1):1–5.
- ,,,,,.Vaso‐occlusion in children with sickle cell disease: clinical characteristics and biologic correlates.J Pediatr Hematol Oncol.2004;26:785–790. PMID: 15591896.
- ,,,,,.Plasma endothelin‐1, cytokine, and prostaglandin E2 levels in sickle cell disease and acute vaso‐occlusive sickle crisis.Blood.1998;92:2551–2555. PMID: 9746797.
- ,,,.Serum levels of substance P are elevated in patients with sickle cell disease and increase further during vaso‐occlusive crisis.Blood.1998;92:3148–3151. PMID: 9787150.
- ,,,,;for the CURAMA study group.Plasma concentrations of asymmetric dimethylarginine, an endogenous nitric oxide synthase inhibitor, are elevated in sickle cell patients but do not increase further during painful crisis.Am J Hematol. February 27,2008; PMID: 18383318
- ,,, et al.Pain in sickle cell disease: rates and risk factors.N Engl J Med.1991;325:11–16.
- ,,, et al.Understanding pain and improving management of sickle cell disease: the PiSCES Study.J Natl Med Assoc.2005;97(2):183–193.
- ,,, et al.Daily assessment of pain in adults with sickle cell disease.Ann Intern Med.2008;148(2):94–101.
- ,,, et al.Comparisons of high versus low emergency department utilizers in sickle cell disease.Ann Emerg Med.2009;53(5):587–593.
- ,.Assessment and management of acute pain in adult medical inpatients: a systematic review.Pain Med.2009;10(7):1183–1199. PMID: 19818030.
- .Scaling clinical pain and pain relief. In: Bromm B, ed.Pain Measurement in Man: Neorephysiological Correlates of Pain.New York:Elsevier Science Publishers,1984:389–396.
- .Patient‐controlled analgesia for acute pain.Clin J Pain.1989;5(suppl 1):S8–S15. PMID: 2520435.
- ,,,,.Patient‐controlled analgesia for sickle pain crisis in pediatric emergency department.Pediatr Emerg Care.2004;20:2–4.
- ,,.A comparison of two regimens of patient‐controlled analgesia for children with sickle cell disease.J Pediatr Nurs.1998;13:15–19.
- Narcotic analgesics, 2002 update.The DAWN Report;2004.
- ,.Meperidine is alive and well in the new millennium: evaluation of meperidine usage patterns and frequency of adverse drug reactions.Pharmacotherapy.2004;24:776–783.
- ,,.Methadone‐related torsades de pointes in a sickle cell patient treated for chronic pain.Am J Hematol.2005;78(4):316–317.
- ,,,,,.A pilot study on the efficacy of ketorolac plus tramadol infusion combined with erythrocytapheresis in the management of acute severe vaso‐occlusive crises and sickle cell pain.Haematologica.2004;89(11):1389–1391.
- ,,,.Use of low‐dose ketamine infusion for pediatric patients with sickle cell disease‐related pain: a case series.Clin J Pain.2010;26(2):163–167.
- ,,.Transcutaneous electrical nerve stimulation treatment of sickle cell pain crises.Acta Haematol.1988;80(2):99–102.
- ,,.Psychosocial aspects of sickle cell disease (SCD) in childhood and adolescence: a review.Br J Clin Psychol.1993;32 (pt 3):271–280.
- ,,,,.Aberrant drug‐taking behaviors and headache: patient versus physician report.Am J Health Behav.2006;30(5):475–482.
- .Current issues in sickle cell pain and its management [review].Hematology Am Soc Hematol Educ Program.2007;97–105.
- ,,,.Opioid Abuse. Available at: http://www.emedicine.com/med/topic1673.htm. Updated April 18, 2006. Accessed August 23,2006.
- .Assessment for addiction in pain‐treatment settings.Clin J Pain.2002;18(4 suppl):S28–S38.
- ,,,,,,.Association between opioid prescribing patterns and opioid overdose‐related deaths.JAMA.2011;305(13):1315–1321.
- .American Pain Society workshop on the management of sickle cell pain.Saint Louis, MO;1990.
- ,,.Multidisciplinary approach to pain management in sickle cell disease.Am J Pediatr Hematol Oncol.1982;4:328–333.
- ,,,,,.Pain relief in sickle cell crisis [letter].Lancet.1986;2:624–625.
- ,,,,.Understanding the causes of problematic pain management in sickle cell disease: evidence that pseudoaddiction plays a more important role than genuine analgesic dependence.J Pain Symptom Manage.2004;27(2):156–169.
- ,.Red blood cell changes during the evolution of the sickle cell painful crisis.Blood.1992;79:2154–2163.
- ,,.Postdischarge pain, functional limitations and impact on caregivers of children with sickle cell disease treated for painful events.Br J Haematol.2009;144(5):782–788.
- ,.Hospital readmission for adult acute sickle cell painful episodes: frequency, etiology, and prognostic significance.Am J Hematol.2005;79:17–25.
- ,,,,.Acute care utilization and rehospitalizations for sickle cell disease.JAMA.2010;303(13):1288–1294.
- ,,, et al.Clinical significance of reported changes in pain severity.Ann Emerg Med.1996;27:485–489.
- ,,,,.Clinically significant differences in visual analogue scale in acute vasoocclusive sickle cell crisis.Hemoglobin.2007;31:427–432.
- ,,.Usefulness and limitations of quantitative sensory testing: clinical and research application in neuropathic pain states.Pain.2007;129:256–259.
Severe, disabling pain, often requiring opioids, is the most common medical presentation for children and adults with sickle cell disease (SCD), an autosomal recessive red blood cell disorder affecting those of African, Mediterranean, and Asian descent.1, 2 A genetically controlled hemoglobin alteration impairs oxygen binding, and enables polymerization of deoxy‐hemoglobin, resulting in, classically, sickle‐shaped erythrocytes3 and a complex cascade of ischemia and vaso‐occlusion in the microcirculation.4, 5
Dramatic gains in the treatment of SCD in childhood have resulted in markedly improved survival through adulthood.68 Thus, the need for adult SCD care is relatively new and rapidly growing. In 2005, approximately 70% of the nearly 80,000 US SCD hospitalizations occurred in adults versus children (Table 1). These hospitalizations occurred in the context of a poorly coordinated American health care system,9 despite the hopes raised by the Patient‐Centered Medical Home10 and the Chronic Care Model.11
| 2005 | 2008 | ||||||
|---|---|---|---|---|---|---|---|
| Total No. of Discharges | LOS | Total No. of Discharges | LOS | ||||
| |||||||
| All discharges | 79,187 | 100.00% | 5.3 | 70,121 | 100.00% | 5.4 | |
| Age group | 1 | 996 | 1.26% | 2.5 | 513 | 0.73% | 2.7 |
| 1‐17 | 23,134 | 29.21% | 3.9 | 13,754 | 19.62% | 3.8 | |
| 18‐44 | 48,168 | 60.83% | 6 | 48,021 | 68.48% | 5.8 | |
| 45‐64 | 6,527 | 8.24% | 6 | 7,543 | 10.76% | 5.6 | |
| 65‐84 | 281 | 0.35% | 6.4 | 221 | 0.32% | 5.6 | |
| Missing | 81 | 0.10% | 4 | 70 | 0.10% | 3.0 | |
Adults with SCD are vulnerable both because they are usually members of racial and ethnic minority groups, and because they have a Food and Drug Administration (FDA)‐defined orphan disease.12 They often do not receive the only FDA‐approved medication for SCD, life‐saving hydroxyurea,13 recommended for adults with homozygous sickle cell anemia (Hb SS) and sickle‐othalassemia (Hb SoThal).14 Young adults often fail to experience a smooth transition of care from children's hospitals, falling into a medical abyss.15
Therefore, increasingly, hospitalists are managing adults with SCD, rather than adult hematologyoncology, pain, or palliative care specialists. Adults with SCD experience negative opinions, bilateral lack of trust, and conflict in the doctorpatient relationship, frequently cited in studies of SCD adults and providers in the literature.16, 17
Evidence Base
General guidelines for SCD management have been published by the National Institutes of Health (NIH)18 and the Agency for Healthcare Policy and Research.19 But one of us (K.L.H.) found evidence lacking with regard to SCD pain management.20 Published guidelines on general pain management, such as the World Health Organization's Analgesic Ladder,21 do not address SCD. A Cochrane Review of pain management in SCD found only 9 randomized controlled trials, all with small numbers of patients, addressing acute SCD pain only.22 As well, American and British consensus SCD pain guidelines23, 24 admit, and subsequent publications emphasize,25, 26 the lack of evidence for what to do or not do for SCD pain management. At least 1 well‐done summary of the SCD evidence base intended for hospitalists has been published, but it focuses on management of issues other than pain.27
Motivations and Fears
It is not surprising then that hospitalists may bring great fear and apprehension with them into their care of SCD patients. One of us (W.R.S.), a general internist, has been called by his own and 3 other academic medical centers, 2 with active Federally‐funded SCD research programs, to address the problems of high‐utilizing adults with SCD, including counseling hospitalists frustrated with the management of pain in these patients.
Hospitalists may be motivated to provide efficient inpatient management (Table 2), and be aware of pain as the primary symptom of SCD inpatients. But they may carry knowledge gaps and biases into their relationships with SCD inpatients. They may fear opioid administration (opiophobia), loss of licensure or governmental reprisals because of high‐dose prescription of opioids, or may believe that SCD patients are more often addicted than most.17, 28 Consequently, more troublesome hospital stays may occur when patients are not rapidly and adequately titrated to appropriate analgesic doses, or when unnecessary deleterious side effects result from opioid and other analgesics. We therefore offer answers to frequently asked questions (FAQs) about pain management by hospitalists caring for adults with SCD. We address FAQs arising during the prototypical situationa patient with SCD admitted for a painful exacerbation, and little or no acute comorbidity. We refer the reader to the aforementioned articles and guidelines to address other treatment issues in adults with SCD.
| Principle | Obstacles |
|---|---|
| |
| Make appropriate management handoffs for patients coming from the ED to promote continuity of care and shorten hospitalization | Poor information systems and poor handoffs/continuity from ED management to hospital management |
| Get as much preexisting information about the patient as possible to inform acute care, avoid returns or further hospitalization | Patient may have no primary care physician or may underutilize primary care |
| Patient may misuse ED and hospital (as primary care source) | |
| Provide rapid and adequate analgesia | Ignorance of the differences between tolerance, physical dependence, addiction, and pseudoaddiction |
| No specific data on pharmacodynamics of opioid analgesics in sickle cell disease | |
| Don't lose licensure or arouse regulatory suspicion about prescribing patterns | Ignorance of DEA monitoring and laws governing appropriate vs inappropriate prescribing of opioids |
| Get the patient discharged as soon as medically appropriate | Difficulty assessing pain quality and intensity |
| Difficulty assessing/avoiding side effects of analgesics | |
| Difficulty determining appropriateness/timing of changes in analgesic dosing, discharge planning | |
| Make appropriate handoffs with the patient's usual source of continuity care (provide that source when necessary) to avoid returns or further hospitalization | Patient may have no primary care physician or may underutilize primary care physician |
| Patient may be mis/underprescribed analgesics by primary care physician | |
| Define and maintain appropriate roles for hospitalists vs physicians with sickle cell training, pain specialists, or other specialists | Inadequate adult system of care for sickle cell disease (no/paucity of specialty care) |
| Multiple prescribers of opioids | |
| Providers unwilling to care for or prescribe opioids for sickle cell patients | |
FAQS
-
Is there any objective way to tell when SCD patients really are in a crisis?
Although the term crisis is used as if it were an objectively definable biological entity, no one has proposed a standard definition of a crisis based on pain intensity level, clinical features, or biomarkers. Measures of vaso‐occlusion are correlated with ischemic pain, including pain that is often called a crisis.2932 However, neither ischemic pain from SCD, nor the underlying vaso‐occlusive cascade that is associated with this pain, is a sudden, present‐or‐absent phenomenon. Instead, these are continua that can be measured using pain scales or various biomarkers.
There is, however, correlative evidence of the intensity of SCD pain associated with various distinctive health states (admitted/not admitted, in crisis/not in crisis). The most visible measure of a crisis, health care utilization, was a strong predictor of mortality in the Cooperative Study of Sickle Cell Disease. Patients with 3 or more admissions per year had a lower 5‐year survival rate.33 In contrast, crisis in the landmark Pain in Sickle Cell Epidemiology Study (PiSCES) was self‐defined by patients.34 Despite being in pain on over half of their days on average, and despite a third of patients being in pain daily, most pain in PiSCES was not considered a crisis, and less than 5% of patients' days were spent in emergency departments (EDs) or hospitals. Ambulatory pain intensity reports were correlated with opioid use.35 A substantial minority (35%) of PiSCES patients made at least 3 ED visits per year. However, these high ED utilizers had worse laboratory values, more pain, more distress, and a lower quality of life.36
Importantly, sometimes adults with SCD may have severe comorbidities which may not be addressed or may be mistakenly managed as an acute vaso‐occlusive episode without further investigation or timely specialist consultation. Although pain is primarily the individual's chief complaint, any potential relationship between the presence of medical comorbidities and pain should be examined when patients are admitted.
-
How can one know when opioid dosages should be changed, or when SCD pain is appropriately controlled to allow discharge?
We recommend, as a standard of care, that SCD pain assessment and pain therapy be interwoven, despite a systematic review finding no evidence that directly linked the timing, frequency, or method of pain assessment with outcomes or safety in medical inpatients, and concluding that the safety and effectiveness of patient‐controlled analgesia (PCA) in medical patients had not been adequately studied.37 Hospitalists should focus the first 24 hours of inpatient SCD pain management on cycles of recurrent pain assessment and opioid dose titration as frequently as every 1 to 2 hours, to assure safe and rapidly efficacious analgesia. Pain intensity, duration, and character should be assessed directly. Intensity is often assessed using a visual analog scale (VAS) or numeric rating scale.38 Treating physicians should themselves directly assess pain during discussions of therapy with the patient, even though some assessment usually is done in hospitals during each nursing shift. Pain and pain relief can be assessed indirectly by monitoring opioid use.
We recommend PCA for inpatients with SCD, administered as an intermittent demand dose (patient must push a button) of opioid, with or without a background opioid constant infusion.39 We usually set the interval between doses, or lockout, to 6 to 10 minutes. Both the lockout and the sedation from delivered doses prevent patients from pushing the demand button repetitively to the point of overdose. Use of a low‐level constant infusion (basal) may sustain pain control during times when the patient is asleep, avoiding recrudescent pain and lost ground due to inadequate analgesia during rest. Alternatively, long‐acting oral opioids may be continued if already used at home, or newly introduced to provide adequate baseline pain control which is augmented by the demand dosing. Most PCA pumps monitor hourly opioid dose demand (number of pushes), as well as hourly doses delivered. Both hourly opioid dose demand and hourly dose‐per‐demand ratio are measures of PCA efficacy or futility. Pumps record this data, and can be interrogated at the patient's bedside for up to several days of prior use. Physicians should combine pump interrogation with direct pain assessment to guide demand‐dose titration. Demand doses should be increased to 1.5 to 2 times the previous demand dose after several hours of failed reduction of pain intensity and duration, and/or persistently futile dose‐per‐demand ratios.
PCA interrogation is also useful for conversion of parenteral opioids to oral opioids, as well as to guide the recommendation for discharge home. After the first 24‐48 hours of up‐titration, if opioid dose demand decreases concordantly with pain frequency and intensity, the demand dose may be safely decreased, and eventually daily PCA requirements may be summed and converted to oral medication using standard opioid dose conversion tables. At this point, physicians may use single measures or daily averages of directly assessed pain.
Routine PCA use in SCD is backed by some evidence.40, 41 But we find it important that patients be taught and encouraged to use the demand feature of PCA. Still, for various reasons, some patients do not use PCA pumps well. Discordant or unreliable assessments (eg, high pain intensity but low‐opioid demand doses during the same interval) may result, and PCA potentially may fail as a dosing strategy. Management is more difficult for these patients. One alternative dosing strategy is prescription of scheduled doses of a short‐acting opioid, attaching to each dose the order, patient may refuse. This is different than dosing as needed, and allows counts of dose refusals over an interval, analogous to PCA pump interrogation.
-
How much is too much opioid? Should one rely on side effects, or on requests for medicine, or is there a ceiling dose?
Addictionologists, pain specialists, oncologists, those involved in hospice care, and some hematologists caring for SCD patients agree that, in general, there should be no a priori dose limitations imposed on opioid prescribing for acute pain. Instead, titration of dose of opioid to pain relief is a central principle of acute pain management. Experts also agree that particular opioids carry particular side effects which warrant dose limitation, adjustments, or avoidance of that opioid altogether. A summary of opioids commonly used in SCD, along with warnings and implied dose limitations is found in Table 3.
For safety, it is important to assess the history of prior opioid use to recognize a patient who is not tolerant to opioids (see below, FAQ 4), to avoid mistakenly overdosing a patient using doses often required by tolerant patients. In lieu of a pre‐written, individualized opioid dosing plan in place for the patient, the patient may be the best source of information regarding preferred medication and tolerated doses.
The reader is referred to standard texts for a description of opioids, their pharmacokinetics and pharmacodynamics, and their addictive and abuse potential. The side‐effect profile of opioids is well‐known: nausea, vomiting, and itching frequently occur; hallucinations, respiratory suppression, and myoclonus occur infrequently.42 Meperidine may more readily cause central nervous system (CNS) dysfunction, including seizures, as compared to other commonly used opioids, because of its toxic metabolite nor‐meperidine. Use of meperidine is often avoided, especially use via PCA.43 Methadone may cause dysrhythmias, specificially corrected Q‐T interval (QTc) prolongation and torsades de pointes on an electrocardiogram, in doses above 200 mg per day.44 Some recommend baseline and yearly electrocardiogram monitoring when giving methadone chronically.
Recognizing the potential dangers of opioids, it is also reasonable to look for opioid‐sparing analgesic strategies. Non‐opioid analgesics such as ketorolac45 and adjuvants such as ketamine46 that are opioid‐sparing should be considered whenever feasible. Complementary and alternative therapies such as transcutaneous electrical nerve stimulation (TENS)47 have less evidence of effectiveness, but have limited risks and may be of use for some individuals.
-
What are the major signs of substance abuse (opioids, street drugs) in SCD patients already on opioids, and can a hospitalist judge those signs acutely and intervene appropriately?
Reports of underprescription of opioids in SCD have cited physician fear of abuse and addiction.48 A recent informal poll of adult sickle cell providers suggests policies vary on how potential abuse is monitored in ambulatory sickle cell patients. We note that physicians, especially upon meeting a patient for the first time, may be unable to reliably judge whether that patient is abusing opioids or street drugs. Both false‐positive and false‐negative diagnoses may be made.49 Repetitive reports of lost or stolen prescriptions or pill bottles, receipt of prescriptions from multiple providers, or repeated requests for early refills increase the suspicion of misuse or abuse, but are indirect evidence. Urine and serum monitoring may be useful, but may give incorrect information if misinterpreted or not conducted frequently enough to improve sensitivity.50
It is important to distinguish between tolerance, the decreased analgesic response over time to repeated doses of the same drug; physical dependence, the production of withdrawal upon abrupt discontinuation of an opioid agonist or administration of an antagonist; and addiction, the psychological dependence upon opioids. Tolerance may be misperceived as true addiction. Its earliest symptom is shortening of the duration of effective analgesia. In contrast, addiction may be manifested by dose escalation in the absence of an increased pain stimulus, or by use of opioids for purposes other than pain relief.51 These are not easily distinguished during a single patient encounter.
SCD patients' requests for specific opioid medications in specific doses, should not be taken as evidence of past or current abuse, but rather evidence of a well‐informed, self‐managing patient. Adults with SCD are clearly expected to be very knowledgeable about and tolerant to opioids if they have had a life of pain as a child, and will require higher doses of opioids than other patients treated by most hospitalists. The issue of medication abuse may be best handled in the ambulatory setting. Whenever possible, hospitalists should not rely only on data from the acute care setting to manage patients. Ambulatory providers may conduct random, unannounced urine and/or serum testing, as part of an opioid prescribing agreement that is written and filed in the patient's chart. Assays for prescribed opioids (especially long‐acting agents), as well as assays for common drugs of abuse, should be conducted. Comanagement with an addictionologist, psychiatrist, or psychologist should be considered in individuals suspected of opioid abuse.
We do not suggest routine urine drug test monitoring of all SCD patients unless routine monitoring is done as a policy for all patients on opioids. Though the prevalence of addiction may be higher in subpopulations of patients with pain,52 and though prescription of opioids, prescription drug abuse, and accidental deaths from prescribed opioids have risen exponentially in the last several years,53 in our experience and in the published literature, drug misuse/abuse among SCD patients is no worse than among patients with other illnesses.5456 However, pseudoaddiction, the appropriate seeking of needed opioids from multiple physicians because of uncontrolled pain and opioid underprescription, may well be prevalent in SCD,57 and may be mistaken for true addiction.
-
How can patients' readiness for discharge be assessed? What can be done for the patient who has lengthy and/or multiple hospitalizations or frequent ED visits?
The appropriate time for discharge in most patients is when they can manage their pain at home with oral opioids or less. Often, patients do not improve even after a few days of inpatient therapy.58 A typical pain episode may last much longer than the 6‐day average US hospital length of stay for a diagnosis of sickle cell crisis among 18‐44 year olds (Table 1).59 Patients may return and be readmitted.60, 61 But in the best cases, pain resolves or reverts to a usual chronic intensity level. As described in FAQ 2, daily or more frequent pain assessment is a bedrock for making discharge decisions. Patients well‐experienced in the use of pain intensity scales can report their usual pain intensity at home, and how close they are to their baseline pain intensity. Simply asking patients, Are you ready for discharge? is appropriate and may yield a surprising positive response. In a recent inpatient trial of PCA (manuscript in preparation), adult patients were admitted with a minimum pain intensity of 45 mm on a 100 mm horizontal VAS scale after treatment in the ED, and mean pain intensity of 76 mm 10 mm. All adults in this study were discharged with pain that was clinically significantly lower. Researchers have found a VAS change of 13.5 mm to be the minimum clinically significant change62 during treatment of vaso‐occlusive crisis.63
Unremitting pain despite appropriate titration of opioids and prolonged hospital stays suggests the need for comprehensive evaluation for medical and psychosocial comorbidities, as is done for other patients with chronic pain syndromes. If not already done, discussion with the patient's primary care provider may reveal factors impacting on persistent pain. Consultation with a hematologist, pain or palliative care specialist, or other provider familiar with SCD may prove helpful. Implementation of adjuvant therapies as discussed in FAQ 3 and adding long‐acting oral opioids to continue postdischarge may also help. Hyperalgesia, or heightened sensitivity to pain, is normal after acute tissue injury, but is now suspected in SCD as a long‐term neuropathic pain syndrome, as a consequence either of repeated painful crises or of chronic opioid therapy.2 Only some centers have specialists qualified to test for and diagnose neuropathic pain.64
Discharge planning should include identification of a source of outpatient follow‐up. Opioids prescribed at discharge should be sufficient to last at least until the first outpatient appointment, to avoid repeated ED or hospital visits. Communication with a primary care provider at discharge can enhance successful care transition. Otherwise, for patients without established providers, social workers and others may address barriers to follow‐up that frustrate both patient and provider.
| Opioid | Used Frequently (>20% of Patients) | How Used | Unique Side Effects and/or Dose Limitations |
|---|---|---|---|
| |||
| Short‐acting | |||
| Codeine | No | Inpatient, parenteral; Ambulatory, oral | |
| Oxycodone | Yes | Most commonly used ambulatory opioid | |
| Morphine | Yes | Most commonly used inpatient opioid | |
| Hydromorphone | Yes | Inpatient more than ambulatory | |
| Fentanyl | No | Inpatient, parenteral | Short‐acting |
| Hydrocodone | No | Ambulatory | |
| Meperedine | No | Avoided | Unpredictable seizure, coma, death |
| Propoxyphene | No | Ambulatory | |
| Tramadol | No | Ambulatory | |
| Long‐acting | |||
| Oxycodone | No | Ambulatory and as an oral basal in inpatients | Abuse potential from capsule manipulation |
| Morphine | Yes | Ambulatory and as an oral basal in inpatients; most commonly used long‐acting opioid | |
| Methadone | No | Ambulatory and as an oral basal in inpatients | Dose‐dependent prolongation of QTc, torsades de pointes |
| Fentanyl | No | Ambulatory and as a transdermal basal in inpatients | Abuse potential from transdermal patch manipulation |
Support for Hospitalists Managing Adults With Sickle Cell Disease
Beside the general advice on pain management in SCD mentioned above or found in the bibliography of this article, at long last, a group of adult practitioners skilled in the care of SCD has formed nationally. The Sickle Cell Adult Provider Network [
Ultimately, evidence and updated guidelines will be the best support for hospitalists and others managing pain in SCD. The hope is that SCD will receive the attention it deserves, so that practitioners and patients alike do not suffer continued pain from this disease or its management.
Severe, disabling pain, often requiring opioids, is the most common medical presentation for children and adults with sickle cell disease (SCD), an autosomal recessive red blood cell disorder affecting those of African, Mediterranean, and Asian descent.1, 2 A genetically controlled hemoglobin alteration impairs oxygen binding, and enables polymerization of deoxy‐hemoglobin, resulting in, classically, sickle‐shaped erythrocytes3 and a complex cascade of ischemia and vaso‐occlusion in the microcirculation.4, 5
Dramatic gains in the treatment of SCD in childhood have resulted in markedly improved survival through adulthood.68 Thus, the need for adult SCD care is relatively new and rapidly growing. In 2005, approximately 70% of the nearly 80,000 US SCD hospitalizations occurred in adults versus children (Table 1). These hospitalizations occurred in the context of a poorly coordinated American health care system,9 despite the hopes raised by the Patient‐Centered Medical Home10 and the Chronic Care Model.11
| 2005 | 2008 | ||||||
|---|---|---|---|---|---|---|---|
| Total No. of Discharges | LOS | Total No. of Discharges | LOS | ||||
| |||||||
| All discharges | 79,187 | 100.00% | 5.3 | 70,121 | 100.00% | 5.4 | |
| Age group | 1 | 996 | 1.26% | 2.5 | 513 | 0.73% | 2.7 |
| 1‐17 | 23,134 | 29.21% | 3.9 | 13,754 | 19.62% | 3.8 | |
| 18‐44 | 48,168 | 60.83% | 6 | 48,021 | 68.48% | 5.8 | |
| 45‐64 | 6,527 | 8.24% | 6 | 7,543 | 10.76% | 5.6 | |
| 65‐84 | 281 | 0.35% | 6.4 | 221 | 0.32% | 5.6 | |
| Missing | 81 | 0.10% | 4 | 70 | 0.10% | 3.0 | |
Adults with SCD are vulnerable both because they are usually members of racial and ethnic minority groups, and because they have a Food and Drug Administration (FDA)‐defined orphan disease.12 They often do not receive the only FDA‐approved medication for SCD, life‐saving hydroxyurea,13 recommended for adults with homozygous sickle cell anemia (Hb SS) and sickle‐othalassemia (Hb SoThal).14 Young adults often fail to experience a smooth transition of care from children's hospitals, falling into a medical abyss.15
Therefore, increasingly, hospitalists are managing adults with SCD, rather than adult hematologyoncology, pain, or palliative care specialists. Adults with SCD experience negative opinions, bilateral lack of trust, and conflict in the doctorpatient relationship, frequently cited in studies of SCD adults and providers in the literature.16, 17
Evidence Base
General guidelines for SCD management have been published by the National Institutes of Health (NIH)18 and the Agency for Healthcare Policy and Research.19 But one of us (K.L.H.) found evidence lacking with regard to SCD pain management.20 Published guidelines on general pain management, such as the World Health Organization's Analgesic Ladder,21 do not address SCD. A Cochrane Review of pain management in SCD found only 9 randomized controlled trials, all with small numbers of patients, addressing acute SCD pain only.22 As well, American and British consensus SCD pain guidelines23, 24 admit, and subsequent publications emphasize,25, 26 the lack of evidence for what to do or not do for SCD pain management. At least 1 well‐done summary of the SCD evidence base intended for hospitalists has been published, but it focuses on management of issues other than pain.27
Motivations and Fears
It is not surprising then that hospitalists may bring great fear and apprehension with them into their care of SCD patients. One of us (W.R.S.), a general internist, has been called by his own and 3 other academic medical centers, 2 with active Federally‐funded SCD research programs, to address the problems of high‐utilizing adults with SCD, including counseling hospitalists frustrated with the management of pain in these patients.
Hospitalists may be motivated to provide efficient inpatient management (Table 2), and be aware of pain as the primary symptom of SCD inpatients. But they may carry knowledge gaps and biases into their relationships with SCD inpatients. They may fear opioid administration (opiophobia), loss of licensure or governmental reprisals because of high‐dose prescription of opioids, or may believe that SCD patients are more often addicted than most.17, 28 Consequently, more troublesome hospital stays may occur when patients are not rapidly and adequately titrated to appropriate analgesic doses, or when unnecessary deleterious side effects result from opioid and other analgesics. We therefore offer answers to frequently asked questions (FAQs) about pain management by hospitalists caring for adults with SCD. We address FAQs arising during the prototypical situationa patient with SCD admitted for a painful exacerbation, and little or no acute comorbidity. We refer the reader to the aforementioned articles and guidelines to address other treatment issues in adults with SCD.
| Principle | Obstacles |
|---|---|
| |
| Make appropriate management handoffs for patients coming from the ED to promote continuity of care and shorten hospitalization | Poor information systems and poor handoffs/continuity from ED management to hospital management |
| Get as much preexisting information about the patient as possible to inform acute care, avoid returns or further hospitalization | Patient may have no primary care physician or may underutilize primary care |
| Patient may misuse ED and hospital (as primary care source) | |
| Provide rapid and adequate analgesia | Ignorance of the differences between tolerance, physical dependence, addiction, and pseudoaddiction |
| No specific data on pharmacodynamics of opioid analgesics in sickle cell disease | |
| Don't lose licensure or arouse regulatory suspicion about prescribing patterns | Ignorance of DEA monitoring and laws governing appropriate vs inappropriate prescribing of opioids |
| Get the patient discharged as soon as medically appropriate | Difficulty assessing pain quality and intensity |
| Difficulty assessing/avoiding side effects of analgesics | |
| Difficulty determining appropriateness/timing of changes in analgesic dosing, discharge planning | |
| Make appropriate handoffs with the patient's usual source of continuity care (provide that source when necessary) to avoid returns or further hospitalization | Patient may have no primary care physician or may underutilize primary care physician |
| Patient may be mis/underprescribed analgesics by primary care physician | |
| Define and maintain appropriate roles for hospitalists vs physicians with sickle cell training, pain specialists, or other specialists | Inadequate adult system of care for sickle cell disease (no/paucity of specialty care) |
| Multiple prescribers of opioids | |
| Providers unwilling to care for or prescribe opioids for sickle cell patients | |
FAQS
-
Is there any objective way to tell when SCD patients really are in a crisis?
Although the term crisis is used as if it were an objectively definable biological entity, no one has proposed a standard definition of a crisis based on pain intensity level, clinical features, or biomarkers. Measures of vaso‐occlusion are correlated with ischemic pain, including pain that is often called a crisis.2932 However, neither ischemic pain from SCD, nor the underlying vaso‐occlusive cascade that is associated with this pain, is a sudden, present‐or‐absent phenomenon. Instead, these are continua that can be measured using pain scales or various biomarkers.
There is, however, correlative evidence of the intensity of SCD pain associated with various distinctive health states (admitted/not admitted, in crisis/not in crisis). The most visible measure of a crisis, health care utilization, was a strong predictor of mortality in the Cooperative Study of Sickle Cell Disease. Patients with 3 or more admissions per year had a lower 5‐year survival rate.33 In contrast, crisis in the landmark Pain in Sickle Cell Epidemiology Study (PiSCES) was self‐defined by patients.34 Despite being in pain on over half of their days on average, and despite a third of patients being in pain daily, most pain in PiSCES was not considered a crisis, and less than 5% of patients' days were spent in emergency departments (EDs) or hospitals. Ambulatory pain intensity reports were correlated with opioid use.35 A substantial minority (35%) of PiSCES patients made at least 3 ED visits per year. However, these high ED utilizers had worse laboratory values, more pain, more distress, and a lower quality of life.36
Importantly, sometimes adults with SCD may have severe comorbidities which may not be addressed or may be mistakenly managed as an acute vaso‐occlusive episode without further investigation or timely specialist consultation. Although pain is primarily the individual's chief complaint, any potential relationship between the presence of medical comorbidities and pain should be examined when patients are admitted.
-
How can one know when opioid dosages should be changed, or when SCD pain is appropriately controlled to allow discharge?
We recommend, as a standard of care, that SCD pain assessment and pain therapy be interwoven, despite a systematic review finding no evidence that directly linked the timing, frequency, or method of pain assessment with outcomes or safety in medical inpatients, and concluding that the safety and effectiveness of patient‐controlled analgesia (PCA) in medical patients had not been adequately studied.37 Hospitalists should focus the first 24 hours of inpatient SCD pain management on cycles of recurrent pain assessment and opioid dose titration as frequently as every 1 to 2 hours, to assure safe and rapidly efficacious analgesia. Pain intensity, duration, and character should be assessed directly. Intensity is often assessed using a visual analog scale (VAS) or numeric rating scale.38 Treating physicians should themselves directly assess pain during discussions of therapy with the patient, even though some assessment usually is done in hospitals during each nursing shift. Pain and pain relief can be assessed indirectly by monitoring opioid use.
We recommend PCA for inpatients with SCD, administered as an intermittent demand dose (patient must push a button) of opioid, with or without a background opioid constant infusion.39 We usually set the interval between doses, or lockout, to 6 to 10 minutes. Both the lockout and the sedation from delivered doses prevent patients from pushing the demand button repetitively to the point of overdose. Use of a low‐level constant infusion (basal) may sustain pain control during times when the patient is asleep, avoiding recrudescent pain and lost ground due to inadequate analgesia during rest. Alternatively, long‐acting oral opioids may be continued if already used at home, or newly introduced to provide adequate baseline pain control which is augmented by the demand dosing. Most PCA pumps monitor hourly opioid dose demand (number of pushes), as well as hourly doses delivered. Both hourly opioid dose demand and hourly dose‐per‐demand ratio are measures of PCA efficacy or futility. Pumps record this data, and can be interrogated at the patient's bedside for up to several days of prior use. Physicians should combine pump interrogation with direct pain assessment to guide demand‐dose titration. Demand doses should be increased to 1.5 to 2 times the previous demand dose after several hours of failed reduction of pain intensity and duration, and/or persistently futile dose‐per‐demand ratios.
PCA interrogation is also useful for conversion of parenteral opioids to oral opioids, as well as to guide the recommendation for discharge home. After the first 24‐48 hours of up‐titration, if opioid dose demand decreases concordantly with pain frequency and intensity, the demand dose may be safely decreased, and eventually daily PCA requirements may be summed and converted to oral medication using standard opioid dose conversion tables. At this point, physicians may use single measures or daily averages of directly assessed pain.
Routine PCA use in SCD is backed by some evidence.40, 41 But we find it important that patients be taught and encouraged to use the demand feature of PCA. Still, for various reasons, some patients do not use PCA pumps well. Discordant or unreliable assessments (eg, high pain intensity but low‐opioid demand doses during the same interval) may result, and PCA potentially may fail as a dosing strategy. Management is more difficult for these patients. One alternative dosing strategy is prescription of scheduled doses of a short‐acting opioid, attaching to each dose the order, patient may refuse. This is different than dosing as needed, and allows counts of dose refusals over an interval, analogous to PCA pump interrogation.
-
How much is too much opioid? Should one rely on side effects, or on requests for medicine, or is there a ceiling dose?
Addictionologists, pain specialists, oncologists, those involved in hospice care, and some hematologists caring for SCD patients agree that, in general, there should be no a priori dose limitations imposed on opioid prescribing for acute pain. Instead, titration of dose of opioid to pain relief is a central principle of acute pain management. Experts also agree that particular opioids carry particular side effects which warrant dose limitation, adjustments, or avoidance of that opioid altogether. A summary of opioids commonly used in SCD, along with warnings and implied dose limitations is found in Table 3.
For safety, it is important to assess the history of prior opioid use to recognize a patient who is not tolerant to opioids (see below, FAQ 4), to avoid mistakenly overdosing a patient using doses often required by tolerant patients. In lieu of a pre‐written, individualized opioid dosing plan in place for the patient, the patient may be the best source of information regarding preferred medication and tolerated doses.
The reader is referred to standard texts for a description of opioids, their pharmacokinetics and pharmacodynamics, and their addictive and abuse potential. The side‐effect profile of opioids is well‐known: nausea, vomiting, and itching frequently occur; hallucinations, respiratory suppression, and myoclonus occur infrequently.42 Meperidine may more readily cause central nervous system (CNS) dysfunction, including seizures, as compared to other commonly used opioids, because of its toxic metabolite nor‐meperidine. Use of meperidine is often avoided, especially use via PCA.43 Methadone may cause dysrhythmias, specificially corrected Q‐T interval (QTc) prolongation and torsades de pointes on an electrocardiogram, in doses above 200 mg per day.44 Some recommend baseline and yearly electrocardiogram monitoring when giving methadone chronically.
Recognizing the potential dangers of opioids, it is also reasonable to look for opioid‐sparing analgesic strategies. Non‐opioid analgesics such as ketorolac45 and adjuvants such as ketamine46 that are opioid‐sparing should be considered whenever feasible. Complementary and alternative therapies such as transcutaneous electrical nerve stimulation (TENS)47 have less evidence of effectiveness, but have limited risks and may be of use for some individuals.
-
What are the major signs of substance abuse (opioids, street drugs) in SCD patients already on opioids, and can a hospitalist judge those signs acutely and intervene appropriately?
Reports of underprescription of opioids in SCD have cited physician fear of abuse and addiction.48 A recent informal poll of adult sickle cell providers suggests policies vary on how potential abuse is monitored in ambulatory sickle cell patients. We note that physicians, especially upon meeting a patient for the first time, may be unable to reliably judge whether that patient is abusing opioids or street drugs. Both false‐positive and false‐negative diagnoses may be made.49 Repetitive reports of lost or stolen prescriptions or pill bottles, receipt of prescriptions from multiple providers, or repeated requests for early refills increase the suspicion of misuse or abuse, but are indirect evidence. Urine and serum monitoring may be useful, but may give incorrect information if misinterpreted or not conducted frequently enough to improve sensitivity.50
It is important to distinguish between tolerance, the decreased analgesic response over time to repeated doses of the same drug; physical dependence, the production of withdrawal upon abrupt discontinuation of an opioid agonist or administration of an antagonist; and addiction, the psychological dependence upon opioids. Tolerance may be misperceived as true addiction. Its earliest symptom is shortening of the duration of effective analgesia. In contrast, addiction may be manifested by dose escalation in the absence of an increased pain stimulus, or by use of opioids for purposes other than pain relief.51 These are not easily distinguished during a single patient encounter.
SCD patients' requests for specific opioid medications in specific doses, should not be taken as evidence of past or current abuse, but rather evidence of a well‐informed, self‐managing patient. Adults with SCD are clearly expected to be very knowledgeable about and tolerant to opioids if they have had a life of pain as a child, and will require higher doses of opioids than other patients treated by most hospitalists. The issue of medication abuse may be best handled in the ambulatory setting. Whenever possible, hospitalists should not rely only on data from the acute care setting to manage patients. Ambulatory providers may conduct random, unannounced urine and/or serum testing, as part of an opioid prescribing agreement that is written and filed in the patient's chart. Assays for prescribed opioids (especially long‐acting agents), as well as assays for common drugs of abuse, should be conducted. Comanagement with an addictionologist, psychiatrist, or psychologist should be considered in individuals suspected of opioid abuse.
We do not suggest routine urine drug test monitoring of all SCD patients unless routine monitoring is done as a policy for all patients on opioids. Though the prevalence of addiction may be higher in subpopulations of patients with pain,52 and though prescription of opioids, prescription drug abuse, and accidental deaths from prescribed opioids have risen exponentially in the last several years,53 in our experience and in the published literature, drug misuse/abuse among SCD patients is no worse than among patients with other illnesses.5456 However, pseudoaddiction, the appropriate seeking of needed opioids from multiple physicians because of uncontrolled pain and opioid underprescription, may well be prevalent in SCD,57 and may be mistaken for true addiction.
-
How can patients' readiness for discharge be assessed? What can be done for the patient who has lengthy and/or multiple hospitalizations or frequent ED visits?
The appropriate time for discharge in most patients is when they can manage their pain at home with oral opioids or less. Often, patients do not improve even after a few days of inpatient therapy.58 A typical pain episode may last much longer than the 6‐day average US hospital length of stay for a diagnosis of sickle cell crisis among 18‐44 year olds (Table 1).59 Patients may return and be readmitted.60, 61 But in the best cases, pain resolves or reverts to a usual chronic intensity level. As described in FAQ 2, daily or more frequent pain assessment is a bedrock for making discharge decisions. Patients well‐experienced in the use of pain intensity scales can report their usual pain intensity at home, and how close they are to their baseline pain intensity. Simply asking patients, Are you ready for discharge? is appropriate and may yield a surprising positive response. In a recent inpatient trial of PCA (manuscript in preparation), adult patients were admitted with a minimum pain intensity of 45 mm on a 100 mm horizontal VAS scale after treatment in the ED, and mean pain intensity of 76 mm 10 mm. All adults in this study were discharged with pain that was clinically significantly lower. Researchers have found a VAS change of 13.5 mm to be the minimum clinically significant change62 during treatment of vaso‐occlusive crisis.63
Unremitting pain despite appropriate titration of opioids and prolonged hospital stays suggests the need for comprehensive evaluation for medical and psychosocial comorbidities, as is done for other patients with chronic pain syndromes. If not already done, discussion with the patient's primary care provider may reveal factors impacting on persistent pain. Consultation with a hematologist, pain or palliative care specialist, or other provider familiar with SCD may prove helpful. Implementation of adjuvant therapies as discussed in FAQ 3 and adding long‐acting oral opioids to continue postdischarge may also help. Hyperalgesia, or heightened sensitivity to pain, is normal after acute tissue injury, but is now suspected in SCD as a long‐term neuropathic pain syndrome, as a consequence either of repeated painful crises or of chronic opioid therapy.2 Only some centers have specialists qualified to test for and diagnose neuropathic pain.64
Discharge planning should include identification of a source of outpatient follow‐up. Opioids prescribed at discharge should be sufficient to last at least until the first outpatient appointment, to avoid repeated ED or hospital visits. Communication with a primary care provider at discharge can enhance successful care transition. Otherwise, for patients without established providers, social workers and others may address barriers to follow‐up that frustrate both patient and provider.
| Opioid | Used Frequently (>20% of Patients) | How Used | Unique Side Effects and/or Dose Limitations |
|---|---|---|---|
| |||
| Short‐acting | |||
| Codeine | No | Inpatient, parenteral; Ambulatory, oral | |
| Oxycodone | Yes | Most commonly used ambulatory opioid | |
| Morphine | Yes | Most commonly used inpatient opioid | |
| Hydromorphone | Yes | Inpatient more than ambulatory | |
| Fentanyl | No | Inpatient, parenteral | Short‐acting |
| Hydrocodone | No | Ambulatory | |
| Meperedine | No | Avoided | Unpredictable seizure, coma, death |
| Propoxyphene | No | Ambulatory | |
| Tramadol | No | Ambulatory | |
| Long‐acting | |||
| Oxycodone | No | Ambulatory and as an oral basal in inpatients | Abuse potential from capsule manipulation |
| Morphine | Yes | Ambulatory and as an oral basal in inpatients; most commonly used long‐acting opioid | |
| Methadone | No | Ambulatory and as an oral basal in inpatients | Dose‐dependent prolongation of QTc, torsades de pointes |
| Fentanyl | No | Ambulatory and as a transdermal basal in inpatients | Abuse potential from transdermal patch manipulation |
Support for Hospitalists Managing Adults With Sickle Cell Disease
Beside the general advice on pain management in SCD mentioned above or found in the bibliography of this article, at long last, a group of adult practitioners skilled in the care of SCD has formed nationally. The Sickle Cell Adult Provider Network [
Ultimately, evidence and updated guidelines will be the best support for hospitalists and others managing pain in SCD. The hope is that SCD will receive the attention it deserves, so that practitioners and patients alike do not suffer continued pain from this disease or its management.
- .Sickle‐cell disease.Lancet.1997;350(9079):725–302.
- ,.Sickle‐cell pain: advances in epidemiology and etiology.Hematology Am Soc Hematol Educ Program.2010;409–415. PMID: 21239827.
- .Management of sickle cell disease.N Engl J Med.1999;340:1021–1030.
- ,,.A systems biology consideration of the vasculopathy of sickle cell anemia: the need for multi‐modality chemo‐prophylaxsis.Cardiovasc Hematol Disord Drug Targets.2009;9(4):271–292.
- ,,.Newer aspects of the pathophysiology of sickle cell disease vaso‐occlusion [review].Hemoglobin.2009;33(1):1–16.
- ,,,.National trends in the mortality of children with sickle cell disease, 1968 through 1992.Am J Public Health.1997;87(8):1317–1322.
- ,,, et al.Prevention of a first stroke by transfusions in children with sickle cell anemia and abnormal results on transcranial Doppler ultrasonography.N Engl J Med.1998;339:5–11.
- ,.Optimizing primary stroke prevention in sickle cell anemia (STOP 2) trial investigators. Discontinuing prophylactic transfusions used to prevent stroke in sickle cell disease.N Engl J Med.2005;353(26):2769–2778.
- .Homeostasis without reserve—the risk of health system collapse.N Engl J Med.2002;347(24):1971–1975.
- The Advanced Medical Home: A Patient‐Centered, Physician‐Guided Model of Health Care [Policy Monograph].Philadelphia, PA:American College of Physicians;2006.
- ,,,,,.Quality improvement in chronic illness care: a collaborative approach.Jt Comm J Qual Improv.2001;27:63–80.
- Definition of Disease Prevalence for Therapies Qualifying Under the Orphan Drug Act. Subpart C, Designation of an Orphan Drug. Sec. 316.20. Content and format of a request for orphan‐drug designation. Available at: http://www.fda.gov/orphan/designat/prevalence.html. Accessed September 3,2008.
- ,,, et al.Effect of hydroxyurea on mortality and morbidity in adult sickle cell anemia: risks and benefits up to 9 years of treatment.JAMA.2003;289:1645–1651.
- ,,,.Provider barriers to hydroxyurea use in adults with sickle cell disease: a survey of the Sickle Cell Disease Adult Provider Network.J Natl Med Assoc.2008;100(8):968–973.
- ,,,,.Transition from pediatric to adult care in sickle cell disease: establishing evidence‐based practice and directions for research.Am J Hematol.2011;86(1):116–120. PMID: 21061308.
- ,,,,,.Health perceptions and medical care opinions of inner‐city adults with sickle cell disease or asthma compared with those of their siblings.South Med J.1989;82(1):9–12.
- ,,,.Sickle cell‐related pain: perceptions of medical practitioners.J Pain Symptom Manage.1997;14(3):168–174.
- The Management of Sickle Cell Disease.4th ed. NIH Publication 2002–2117.Washington, DC:National Institutes of Health, National Heart, Lung, and Blood Institute, Division of Blood Diseases and Resources; June2002.
- Pain Management Guideline.Washington, DC:Agency for Health Care Policy and Research;1992.
- ,.An evidence‐based approach to the treatment of adults with sickle cell disease.Hematology Am Soc Hematol Educ Program.2005;58–65.
- World Health Organization: Cancer Pain Relief.Geneva, Switzerland:WHO,1986.
- ,.Pain management for sickle cell disease.Cochrane Database Syst Rev. April 19,2006;(2):CD003350.
- ,,;for the Guideline Committee.Guidelines for the Management of Acute and Chronic Pain in Sickle Cell Disease. APS Clinical Practice Guideline Series, No 1.Glenview, IL:American Pain Society;1999.
- .Guidelines for the management of the acute painful crisis of sickle cell disease.Br J Haematol.2003;120:744–752.
- ,,.Acute pain in children and adults with sickle cell disease: management in the absence of evidence‐based guidelines.Curr Opin Hematol.2009;16(3):173–178.
- ,,,.Opioids and the treatment of chronic pain: controversies, current status, and future directions.Exp Clin Psychopharmacol.2008;16(5):405–416.
- .A sickle cell primer.The Hospitalist.2006;10(10):39–41.
- .The barriers to adequate pain management with opioid analgesics.Semin Oncol.1993;20(2 suppl 1):1–5.
- ,,,,,.Vaso‐occlusion in children with sickle cell disease: clinical characteristics and biologic correlates.J Pediatr Hematol Oncol.2004;26:785–790. PMID: 15591896.
- ,,,,,.Plasma endothelin‐1, cytokine, and prostaglandin E2 levels in sickle cell disease and acute vaso‐occlusive sickle crisis.Blood.1998;92:2551–2555. PMID: 9746797.
- ,,,.Serum levels of substance P are elevated in patients with sickle cell disease and increase further during vaso‐occlusive crisis.Blood.1998;92:3148–3151. PMID: 9787150.
- ,,,,;for the CURAMA study group.Plasma concentrations of asymmetric dimethylarginine, an endogenous nitric oxide synthase inhibitor, are elevated in sickle cell patients but do not increase further during painful crisis.Am J Hematol. February 27,2008; PMID: 18383318
- ,,, et al.Pain in sickle cell disease: rates and risk factors.N Engl J Med.1991;325:11–16.
- ,,, et al.Understanding pain and improving management of sickle cell disease: the PiSCES Study.J Natl Med Assoc.2005;97(2):183–193.
- ,,, et al.Daily assessment of pain in adults with sickle cell disease.Ann Intern Med.2008;148(2):94–101.
- ,,, et al.Comparisons of high versus low emergency department utilizers in sickle cell disease.Ann Emerg Med.2009;53(5):587–593.
- ,.Assessment and management of acute pain in adult medical inpatients: a systematic review.Pain Med.2009;10(7):1183–1199. PMID: 19818030.
- .Scaling clinical pain and pain relief. In: Bromm B, ed.Pain Measurement in Man: Neorephysiological Correlates of Pain.New York:Elsevier Science Publishers,1984:389–396.
- .Patient‐controlled analgesia for acute pain.Clin J Pain.1989;5(suppl 1):S8–S15. PMID: 2520435.
- ,,,,.Patient‐controlled analgesia for sickle pain crisis in pediatric emergency department.Pediatr Emerg Care.2004;20:2–4.
- ,,.A comparison of two regimens of patient‐controlled analgesia for children with sickle cell disease.J Pediatr Nurs.1998;13:15–19.
- Narcotic analgesics, 2002 update.The DAWN Report;2004.
- ,.Meperidine is alive and well in the new millennium: evaluation of meperidine usage patterns and frequency of adverse drug reactions.Pharmacotherapy.2004;24:776–783.
- ,,.Methadone‐related torsades de pointes in a sickle cell patient treated for chronic pain.Am J Hematol.2005;78(4):316–317.
- ,,,,,.A pilot study on the efficacy of ketorolac plus tramadol infusion combined with erythrocytapheresis in the management of acute severe vaso‐occlusive crises and sickle cell pain.Haematologica.2004;89(11):1389–1391.
- ,,,.Use of low‐dose ketamine infusion for pediatric patients with sickle cell disease‐related pain: a case series.Clin J Pain.2010;26(2):163–167.
- ,,.Transcutaneous electrical nerve stimulation treatment of sickle cell pain crises.Acta Haematol.1988;80(2):99–102.
- ,,.Psychosocial aspects of sickle cell disease (SCD) in childhood and adolescence: a review.Br J Clin Psychol.1993;32 (pt 3):271–280.
- ,,,,.Aberrant drug‐taking behaviors and headache: patient versus physician report.Am J Health Behav.2006;30(5):475–482.
- .Current issues in sickle cell pain and its management [review].Hematology Am Soc Hematol Educ Program.2007;97–105.
- ,,,.Opioid Abuse. Available at: http://www.emedicine.com/med/topic1673.htm. Updated April 18, 2006. Accessed August 23,2006.
- .Assessment for addiction in pain‐treatment settings.Clin J Pain.2002;18(4 suppl):S28–S38.
- ,,,,,,.Association between opioid prescribing patterns and opioid overdose‐related deaths.JAMA.2011;305(13):1315–1321.
- .American Pain Society workshop on the management of sickle cell pain.Saint Louis, MO;1990.
- ,,.Multidisciplinary approach to pain management in sickle cell disease.Am J Pediatr Hematol Oncol.1982;4:328–333.
- ,,,,,.Pain relief in sickle cell crisis [letter].Lancet.1986;2:624–625.
- ,,,,.Understanding the causes of problematic pain management in sickle cell disease: evidence that pseudoaddiction plays a more important role than genuine analgesic dependence.J Pain Symptom Manage.2004;27(2):156–169.
- ,.Red blood cell changes during the evolution of the sickle cell painful crisis.Blood.1992;79:2154–2163.
- ,,.Postdischarge pain, functional limitations and impact on caregivers of children with sickle cell disease treated for painful events.Br J Haematol.2009;144(5):782–788.
- ,.Hospital readmission for adult acute sickle cell painful episodes: frequency, etiology, and prognostic significance.Am J Hematol.2005;79:17–25.
- ,,,,.Acute care utilization and rehospitalizations for sickle cell disease.JAMA.2010;303(13):1288–1294.
- ,,, et al.Clinical significance of reported changes in pain severity.Ann Emerg Med.1996;27:485–489.
- ,,,,.Clinically significant differences in visual analogue scale in acute vasoocclusive sickle cell crisis.Hemoglobin.2007;31:427–432.
- ,,.Usefulness and limitations of quantitative sensory testing: clinical and research application in neuropathic pain states.Pain.2007;129:256–259.
- .Sickle‐cell disease.Lancet.1997;350(9079):725–302.
- ,.Sickle‐cell pain: advances in epidemiology and etiology.Hematology Am Soc Hematol Educ Program.2010;409–415. PMID: 21239827.
- .Management of sickle cell disease.N Engl J Med.1999;340:1021–1030.
- ,,.A systems biology consideration of the vasculopathy of sickle cell anemia: the need for multi‐modality chemo‐prophylaxsis.Cardiovasc Hematol Disord Drug Targets.2009;9(4):271–292.
- ,,.Newer aspects of the pathophysiology of sickle cell disease vaso‐occlusion [review].Hemoglobin.2009;33(1):1–16.
- ,,,.National trends in the mortality of children with sickle cell disease, 1968 through 1992.Am J Public Health.1997;87(8):1317–1322.
- ,,, et al.Prevention of a first stroke by transfusions in children with sickle cell anemia and abnormal results on transcranial Doppler ultrasonography.N Engl J Med.1998;339:5–11.
- ,.Optimizing primary stroke prevention in sickle cell anemia (STOP 2) trial investigators. Discontinuing prophylactic transfusions used to prevent stroke in sickle cell disease.N Engl J Med.2005;353(26):2769–2778.
- .Homeostasis without reserve—the risk of health system collapse.N Engl J Med.2002;347(24):1971–1975.
- The Advanced Medical Home: A Patient‐Centered, Physician‐Guided Model of Health Care [Policy Monograph].Philadelphia, PA:American College of Physicians;2006.
- ,,,,,.Quality improvement in chronic illness care: a collaborative approach.Jt Comm J Qual Improv.2001;27:63–80.
- Definition of Disease Prevalence for Therapies Qualifying Under the Orphan Drug Act. Subpart C, Designation of an Orphan Drug. Sec. 316.20. Content and format of a request for orphan‐drug designation. Available at: http://www.fda.gov/orphan/designat/prevalence.html. Accessed September 3,2008.
- ,,, et al.Effect of hydroxyurea on mortality and morbidity in adult sickle cell anemia: risks and benefits up to 9 years of treatment.JAMA.2003;289:1645–1651.
- ,,,.Provider barriers to hydroxyurea use in adults with sickle cell disease: a survey of the Sickle Cell Disease Adult Provider Network.J Natl Med Assoc.2008;100(8):968–973.
- ,,,,.Transition from pediatric to adult care in sickle cell disease: establishing evidence‐based practice and directions for research.Am J Hematol.2011;86(1):116–120. PMID: 21061308.
- ,,,,,.Health perceptions and medical care opinions of inner‐city adults with sickle cell disease or asthma compared with those of their siblings.South Med J.1989;82(1):9–12.
- ,,,.Sickle cell‐related pain: perceptions of medical practitioners.J Pain Symptom Manage.1997;14(3):168–174.
- The Management of Sickle Cell Disease.4th ed. NIH Publication 2002–2117.Washington, DC:National Institutes of Health, National Heart, Lung, and Blood Institute, Division of Blood Diseases and Resources; June2002.
- Pain Management Guideline.Washington, DC:Agency for Health Care Policy and Research;1992.
- ,.An evidence‐based approach to the treatment of adults with sickle cell disease.Hematology Am Soc Hematol Educ Program.2005;58–65.
- World Health Organization: Cancer Pain Relief.Geneva, Switzerland:WHO,1986.
- ,.Pain management for sickle cell disease.Cochrane Database Syst Rev. April 19,2006;(2):CD003350.
- ,,;for the Guideline Committee.Guidelines for the Management of Acute and Chronic Pain in Sickle Cell Disease. APS Clinical Practice Guideline Series, No 1.Glenview, IL:American Pain Society;1999.
- .Guidelines for the management of the acute painful crisis of sickle cell disease.Br J Haematol.2003;120:744–752.
- ,,.Acute pain in children and adults with sickle cell disease: management in the absence of evidence‐based guidelines.Curr Opin Hematol.2009;16(3):173–178.
- ,,,.Opioids and the treatment of chronic pain: controversies, current status, and future directions.Exp Clin Psychopharmacol.2008;16(5):405–416.
- .A sickle cell primer.The Hospitalist.2006;10(10):39–41.
- .The barriers to adequate pain management with opioid analgesics.Semin Oncol.1993;20(2 suppl 1):1–5.
- ,,,,,.Vaso‐occlusion in children with sickle cell disease: clinical characteristics and biologic correlates.J Pediatr Hematol Oncol.2004;26:785–790. PMID: 15591896.
- ,,,,,.Plasma endothelin‐1, cytokine, and prostaglandin E2 levels in sickle cell disease and acute vaso‐occlusive sickle crisis.Blood.1998;92:2551–2555. PMID: 9746797.
- ,,,.Serum levels of substance P are elevated in patients with sickle cell disease and increase further during vaso‐occlusive crisis.Blood.1998;92:3148–3151. PMID: 9787150.
- ,,,,;for the CURAMA study group.Plasma concentrations of asymmetric dimethylarginine, an endogenous nitric oxide synthase inhibitor, are elevated in sickle cell patients but do not increase further during painful crisis.Am J Hematol. February 27,2008; PMID: 18383318
- ,,, et al.Pain in sickle cell disease: rates and risk factors.N Engl J Med.1991;325:11–16.
- ,,, et al.Understanding pain and improving management of sickle cell disease: the PiSCES Study.J Natl Med Assoc.2005;97(2):183–193.
- ,,, et al.Daily assessment of pain in adults with sickle cell disease.Ann Intern Med.2008;148(2):94–101.
- ,,, et al.Comparisons of high versus low emergency department utilizers in sickle cell disease.Ann Emerg Med.2009;53(5):587–593.
- ,.Assessment and management of acute pain in adult medical inpatients: a systematic review.Pain Med.2009;10(7):1183–1199. PMID: 19818030.
- .Scaling clinical pain and pain relief. In: Bromm B, ed.Pain Measurement in Man: Neorephysiological Correlates of Pain.New York:Elsevier Science Publishers,1984:389–396.
- .Patient‐controlled analgesia for acute pain.Clin J Pain.1989;5(suppl 1):S8–S15. PMID: 2520435.
- ,,,,.Patient‐controlled analgesia for sickle pain crisis in pediatric emergency department.Pediatr Emerg Care.2004;20:2–4.
- ,,.A comparison of two regimens of patient‐controlled analgesia for children with sickle cell disease.J Pediatr Nurs.1998;13:15–19.
- Narcotic analgesics, 2002 update.The DAWN Report;2004.
- ,.Meperidine is alive and well in the new millennium: evaluation of meperidine usage patterns and frequency of adverse drug reactions.Pharmacotherapy.2004;24:776–783.
- ,,.Methadone‐related torsades de pointes in a sickle cell patient treated for chronic pain.Am J Hematol.2005;78(4):316–317.
- ,,,,,.A pilot study on the efficacy of ketorolac plus tramadol infusion combined with erythrocytapheresis in the management of acute severe vaso‐occlusive crises and sickle cell pain.Haematologica.2004;89(11):1389–1391.
- ,,,.Use of low‐dose ketamine infusion for pediatric patients with sickle cell disease‐related pain: a case series.Clin J Pain.2010;26(2):163–167.
- ,,.Transcutaneous electrical nerve stimulation treatment of sickle cell pain crises.Acta Haematol.1988;80(2):99–102.
- ,,.Psychosocial aspects of sickle cell disease (SCD) in childhood and adolescence: a review.Br J Clin Psychol.1993;32 (pt 3):271–280.
- ,,,,.Aberrant drug‐taking behaviors and headache: patient versus physician report.Am J Health Behav.2006;30(5):475–482.
- .Current issues in sickle cell pain and its management [review].Hematology Am Soc Hematol Educ Program.2007;97–105.
- ,,,.Opioid Abuse. Available at: http://www.emedicine.com/med/topic1673.htm. Updated April 18, 2006. Accessed August 23,2006.
- .Assessment for addiction in pain‐treatment settings.Clin J Pain.2002;18(4 suppl):S28–S38.
- ,,,,,,.Association between opioid prescribing patterns and opioid overdose‐related deaths.JAMA.2011;305(13):1315–1321.
- .American Pain Society workshop on the management of sickle cell pain.Saint Louis, MO;1990.
- ,,.Multidisciplinary approach to pain management in sickle cell disease.Am J Pediatr Hematol Oncol.1982;4:328–333.
- ,,,,,.Pain relief in sickle cell crisis [letter].Lancet.1986;2:624–625.
- ,,,,.Understanding the causes of problematic pain management in sickle cell disease: evidence that pseudoaddiction plays a more important role than genuine analgesic dependence.J Pain Symptom Manage.2004;27(2):156–169.
- ,.Red blood cell changes during the evolution of the sickle cell painful crisis.Blood.1992;79:2154–2163.
- ,,.Postdischarge pain, functional limitations and impact on caregivers of children with sickle cell disease treated for painful events.Br J Haematol.2009;144(5):782–788.
- ,.Hospital readmission for adult acute sickle cell painful episodes: frequency, etiology, and prognostic significance.Am J Hematol.2005;79:17–25.
- ,,,,.Acute care utilization and rehospitalizations for sickle cell disease.JAMA.2010;303(13):1288–1294.
- ,,, et al.Clinical significance of reported changes in pain severity.Ann Emerg Med.1996;27:485–489.
- ,,,,.Clinically significant differences in visual analogue scale in acute vasoocclusive sickle cell crisis.Hemoglobin.2007;31:427–432.
- ,,.Usefulness and limitations of quantitative sensory testing: clinical and research application in neuropathic pain states.Pain.2007;129:256–259.
SCD High Utilization
In November 2010, the National Heart, Lung, and Blood Institute celebrated the 100th year anniversary of the discovery of sickle cell disease (SCD) in the United States by hosting the Herrick Symposium. Despite progress in the past 100 years, there is just one treatment available (hydroxyurea) and, while SCD is no longer considered only a disease of children, patients' life spans remain severely shortened (42 and 48 years, respectively, for males and females).1 With restrictions in residency hours and hospitals efforts to contain costs, hospitalists are increasingly being called upon to manage inpatient care for adults with SCD during their hospitalization. With the Centers for Medicare and Medicaid Services' recent plans to penalize hospitals with 30‐day readmission rates in excess of expected, hospitalists should address the challenges they face in providing care to adults with SCD and identify strategies to successfully meet them.
In this issue of the Journal of Hospital Medicine, Carroll and colleagues examined data from the California State Inpatient Database provided by the Healthcare Cost and Utilization Project (HCUP) for persons with International Classification of Diseases, Ninth Revision (ICD‐9) codes for SCD.2 They characterized patterns of hospital use during a 4‐year study period. Records for all patients, age 13 and older, with an admission for an SCD ICD‐9related cause were included. Patients with 4 or more hospitalizations in a 12‐month period were classified as having high hospital utilization, and 25% of the 1879 different patients evaluated fell into this category. A general perception exists that most persons with SCD have high hospital utilization, but data from Carroll et al. challenge this perception.2
While 1 in 4 patients in the cohort had high hospital utilization, why were not even more able to stay out of the hospital? Characteristics of these high utilizers shed light on contributing factors. Many patients died in the hospital (6.6%), consistent with research by others who also demonstrated the high risk of death associated with rehospitalization among patients with SCD.3, 4 In a prospective cohort study of 71 adults with either 70 hospital days or 6 admissions in a 12‐month period, 15% of the cohort died within a 24‐month study period.3 Patients with the highest number of hospital days, and those suffering from depression, were at highest risk of death. A separate prospective, longitudinal, 4‐year cohort study of adults with sickle cell anemia found an overall mortality of 14%.4 Mortality for those readmitted within 1 week of a painful crisis was 20%, compared to 11% for others in the cohort. High hospitalization use and hospital readmissions should be seen as worrisome markers of high risk for death, and patients should be carefully evaluated for life‐threatening complications, and not assumed to be purely drug seeking.
Why do some patients with SCD experience high readmission rates and mortality? Such patients with frequent hospitalizations have been found, in fact, to be sicker, and Carroll's research confirms that high utilizers were more likely to have comorbidities (acute chest syndrome, aseptic necrosis, renal disease) and complications (sepsis, pneumonia, pulmonary embolus, diabetes, mood disorders, and cocaine and alcohol use).2 Fortunately, high utilization appears to moderate over time for most patients, but those with persistent high utilization were more likely to have sepsis and mood disorders. Aisiku and colleagues studied a cohort of adults with SCD, in Virginia, in which emergency department (ED) utilization provided additional evidence for the association of high utilization with worse outcomes.5 Patients with 3 or more ED visits in 1 year were found to have lower hematocrits and higher white blood cell counts, to require more blood transfusions, and to report more pain, more pain days, more pain crises, and a worse quality of life. It is clear that patients with high hospital utilization are sicker and at an increased risk of death. While enlightening, this data does not tell the entire story.
Most admissions for patients with SCD begin with a vaso‐occlusive crisis, and frequently other complications may develop. Smith et al. provided the first prospectively collected data documenting that these patients reported pain on more than 54% of days, and many experience pain daily, yet infrequently access healthcare services.6 Hospitalists should appreciate that chronic pain is common for many adults with SCD. Pain management in this patient population is complex and often challenging, requiring high doses of opioids. In this current issue of the Journal, Smith and colleagues have contributed an excellent overview of how to manage pain in adults with SCD.7 The review specifically addresses some of the most challenging aspects of pain management in the hospital setting. Unfortunately, healthcare providers too frequently perceive patients as addicted to narcotics and abusing them, despite clear evidence that patients with SCD suffer from chronic pain. The consequent crisis of trust between the patient and provider commonly leads to inadequate treatment of pain and subsequent self‐discharge. Haywood and colleagues compared trust levels in adults with SCD and a history of sudden self‐discharge (ie, leaving against medical advice [AMA]) to those without such a history.8 Patients with a history of self‐discharge reported lower levels of trust of the medical staff and more negative interpersonal experiences. In a separate investigation, researchers compared scores on the Picker Patient Experience Questionnaire between a cohort of adults with SCD and national norms.9 Patients with SCD scored lower on 9 of 12 items. More specifically, 86% of respondents reported having insufficient involvement in decisions about care and treatment, and 50% reported staff did not do enough to control pain. Sadly, it appears the health system overall has undertreated and mismanaged patients with SCD suffering from pain crises.
Hospitalists face many challenges when managing care for adults with such a complex disease associated with high mortality, severe pain, and often a high readmission rate. The complexity of SCD calls for a comprehensive approach, and the need for each patient to have a clearly identified medical home.10 The hospital, emergency department, and hospitalist cannot and should not serve this role. Recently, Lindquist and Baker proposed a framework to understand and prevent hospital readmissions.11 They recommend optimizing the interfaces of transitional care among the patient, hospitalist, and primary care physician (PCP). By applying this framework of care, hospitalists must identify a PCP and provider with SCD expertise for follow‐up. Clear communication between the PCP, sickle cell expert, and hospitalist can be used to facilitate inpatient and emergency department care, and avoid inconsistent care that fosters mistrust. Individualized and consistent analgesic protocols established by outpatient providers, in collaboration with the patient, are more likely to deliver effective care, compared to variable attempts by whatever hospitalist happens to admit the patient.
Working with physicians expert in the care of patients with SCD, hospitalists might also identify patients who may benefit from hydroxyurea (HU) therapy. Despite clear evidence of HU's multiple salutary effects (decreased number of painful crises and need for hospital admissions, reduced number of blood transfusions and frequency of acute chest syndrome, and an overall benefit in mortality),12, 13 it remains underprescribed.14 In an analysis of a Medicaid managed care organization database in Maryland, 85% of patients never refilled a HU prescription. Moreover, patients with the highest rate of refills had the lowest number of hospital admissions and cost of care. Based on the evidence, hospitalists should screen all patients to determine whether or not HU has been prescribed, and if not, patients should be carefully assessed to determine if they are candidates for this effective therapy with communication to the patient's PCP and SCD expert.
Carroll's analysis confirms that patients with sickle cell disease frequently admitted to hospital (high utilizers) suffer a heavier burden of their illness and are at remarkably high risk of further morbidity and mortality.2 Though admissions are usually for acute pain crises, these high utilizers also suffer greater risk of hematologic, cardiovascular, infectious, orthopedic, and psychiatric complications. The common psychiatric issues, including both mood disorders and substance abuse, emphasize the need for a multidisciplinary team of care providers to provide a comprehensive bio‐psycho‐social assessment of all patients with SCD who experience high hospital utilization. These patients will also benefit from system improvements that integrate and coordinate care across inpatient, outpatient, emergency department, and patient homes. Hospitalists are well positioned to engage in this model of care, as well as develop and improve processes to ensure seamless transitions across the various settings of care delivery. It is also crucial that hospitalists are engaged in research needed to better identify and understand risk factors that lead to high utilization. Only through collaborative efforts can we hope to solve the conundrum of frequently hospitalized patients with sickle cell pain crises.
- ,,, et al.Mortality in sickle cell disease. Life expectancy and risk factors for early death.N Engl J Med.1994;330:1639–1644.
- ,,.Prediction of onset and course of high hospital utilization in sickle cell disease.J Hosp Med.2011;6:248–255.
- ,,,.Frequent and prolonged hospitalizations: a risk factor for early mortality in sickle cell disease patients.Am J Hematol.2003;72:201–203.
- ,.Hospital readmission for adult acute sickle cell painful episodes: frequency, etiology, and prognostic significance.Am J Hematol.2005;79:17–25.
- ,,,,,.Comparison of high versus low emergency department utilizers in sickle cell disease.Ann Emerg Med.2009;53:587–593.
- ,,, et al.Daily assessment of pain in adults with sickle cell disease.Ann Intern Med.2008;148:94–101.
- ,,.Frequently asked questions by hospitalists managing pain in adults with sickle cell disease.J Hosp Med.2011;6:297–303.
- ,,,,,.Hospital self‐discharge among adults with sickle‐cell disease (SCD): associations with trust and interpersonal experiences with care.J Hosp Med.2010;5:289–294.
- ,,,,,.Problematic hospital experiences among adult patients with sickle cell disease.J Health Care Poor Underserved.2010;21:1114–1123.
- ,,, et al.Sickle cell disease summit: from clinical and research disparity to action.Am J Hematol.2008;84:39–45.
- ,.Understanding preventable hospital readmissions: masqueraders, markers and true causal factors.J Hosp Med.2011;6:51–53.
- ,,, et al.Effect of hydroxyurea on the frequency of painful crises in sickle cell anemia.N Engl J Med.1995;332:1317–1322.
- ,,, et al.Effect of hydroxyurea on mortality and morbidity in adult sickle cell anemia: risks and benefits up to 9 years of treatment.JAMA.2003;289:1645–1651.
- ,,,.Examining the effectiveness of hydroxyurea in people with sickle cell disease.J Health Care Poor Underserved.2010;21:277–286.
In November 2010, the National Heart, Lung, and Blood Institute celebrated the 100th year anniversary of the discovery of sickle cell disease (SCD) in the United States by hosting the Herrick Symposium. Despite progress in the past 100 years, there is just one treatment available (hydroxyurea) and, while SCD is no longer considered only a disease of children, patients' life spans remain severely shortened (42 and 48 years, respectively, for males and females).1 With restrictions in residency hours and hospitals efforts to contain costs, hospitalists are increasingly being called upon to manage inpatient care for adults with SCD during their hospitalization. With the Centers for Medicare and Medicaid Services' recent plans to penalize hospitals with 30‐day readmission rates in excess of expected, hospitalists should address the challenges they face in providing care to adults with SCD and identify strategies to successfully meet them.
In this issue of the Journal of Hospital Medicine, Carroll and colleagues examined data from the California State Inpatient Database provided by the Healthcare Cost and Utilization Project (HCUP) for persons with International Classification of Diseases, Ninth Revision (ICD‐9) codes for SCD.2 They characterized patterns of hospital use during a 4‐year study period. Records for all patients, age 13 and older, with an admission for an SCD ICD‐9related cause were included. Patients with 4 or more hospitalizations in a 12‐month period were classified as having high hospital utilization, and 25% of the 1879 different patients evaluated fell into this category. A general perception exists that most persons with SCD have high hospital utilization, but data from Carroll et al. challenge this perception.2
While 1 in 4 patients in the cohort had high hospital utilization, why were not even more able to stay out of the hospital? Characteristics of these high utilizers shed light on contributing factors. Many patients died in the hospital (6.6%), consistent with research by others who also demonstrated the high risk of death associated with rehospitalization among patients with SCD.3, 4 In a prospective cohort study of 71 adults with either 70 hospital days or 6 admissions in a 12‐month period, 15% of the cohort died within a 24‐month study period.3 Patients with the highest number of hospital days, and those suffering from depression, were at highest risk of death. A separate prospective, longitudinal, 4‐year cohort study of adults with sickle cell anemia found an overall mortality of 14%.4 Mortality for those readmitted within 1 week of a painful crisis was 20%, compared to 11% for others in the cohort. High hospitalization use and hospital readmissions should be seen as worrisome markers of high risk for death, and patients should be carefully evaluated for life‐threatening complications, and not assumed to be purely drug seeking.
Why do some patients with SCD experience high readmission rates and mortality? Such patients with frequent hospitalizations have been found, in fact, to be sicker, and Carroll's research confirms that high utilizers were more likely to have comorbidities (acute chest syndrome, aseptic necrosis, renal disease) and complications (sepsis, pneumonia, pulmonary embolus, diabetes, mood disorders, and cocaine and alcohol use).2 Fortunately, high utilization appears to moderate over time for most patients, but those with persistent high utilization were more likely to have sepsis and mood disorders. Aisiku and colleagues studied a cohort of adults with SCD, in Virginia, in which emergency department (ED) utilization provided additional evidence for the association of high utilization with worse outcomes.5 Patients with 3 or more ED visits in 1 year were found to have lower hematocrits and higher white blood cell counts, to require more blood transfusions, and to report more pain, more pain days, more pain crises, and a worse quality of life. It is clear that patients with high hospital utilization are sicker and at an increased risk of death. While enlightening, this data does not tell the entire story.
Most admissions for patients with SCD begin with a vaso‐occlusive crisis, and frequently other complications may develop. Smith et al. provided the first prospectively collected data documenting that these patients reported pain on more than 54% of days, and many experience pain daily, yet infrequently access healthcare services.6 Hospitalists should appreciate that chronic pain is common for many adults with SCD. Pain management in this patient population is complex and often challenging, requiring high doses of opioids. In this current issue of the Journal, Smith and colleagues have contributed an excellent overview of how to manage pain in adults with SCD.7 The review specifically addresses some of the most challenging aspects of pain management in the hospital setting. Unfortunately, healthcare providers too frequently perceive patients as addicted to narcotics and abusing them, despite clear evidence that patients with SCD suffer from chronic pain. The consequent crisis of trust between the patient and provider commonly leads to inadequate treatment of pain and subsequent self‐discharge. Haywood and colleagues compared trust levels in adults with SCD and a history of sudden self‐discharge (ie, leaving against medical advice [AMA]) to those without such a history.8 Patients with a history of self‐discharge reported lower levels of trust of the medical staff and more negative interpersonal experiences. In a separate investigation, researchers compared scores on the Picker Patient Experience Questionnaire between a cohort of adults with SCD and national norms.9 Patients with SCD scored lower on 9 of 12 items. More specifically, 86% of respondents reported having insufficient involvement in decisions about care and treatment, and 50% reported staff did not do enough to control pain. Sadly, it appears the health system overall has undertreated and mismanaged patients with SCD suffering from pain crises.
Hospitalists face many challenges when managing care for adults with such a complex disease associated with high mortality, severe pain, and often a high readmission rate. The complexity of SCD calls for a comprehensive approach, and the need for each patient to have a clearly identified medical home.10 The hospital, emergency department, and hospitalist cannot and should not serve this role. Recently, Lindquist and Baker proposed a framework to understand and prevent hospital readmissions.11 They recommend optimizing the interfaces of transitional care among the patient, hospitalist, and primary care physician (PCP). By applying this framework of care, hospitalists must identify a PCP and provider with SCD expertise for follow‐up. Clear communication between the PCP, sickle cell expert, and hospitalist can be used to facilitate inpatient and emergency department care, and avoid inconsistent care that fosters mistrust. Individualized and consistent analgesic protocols established by outpatient providers, in collaboration with the patient, are more likely to deliver effective care, compared to variable attempts by whatever hospitalist happens to admit the patient.
Working with physicians expert in the care of patients with SCD, hospitalists might also identify patients who may benefit from hydroxyurea (HU) therapy. Despite clear evidence of HU's multiple salutary effects (decreased number of painful crises and need for hospital admissions, reduced number of blood transfusions and frequency of acute chest syndrome, and an overall benefit in mortality),12, 13 it remains underprescribed.14 In an analysis of a Medicaid managed care organization database in Maryland, 85% of patients never refilled a HU prescription. Moreover, patients with the highest rate of refills had the lowest number of hospital admissions and cost of care. Based on the evidence, hospitalists should screen all patients to determine whether or not HU has been prescribed, and if not, patients should be carefully assessed to determine if they are candidates for this effective therapy with communication to the patient's PCP and SCD expert.
Carroll's analysis confirms that patients with sickle cell disease frequently admitted to hospital (high utilizers) suffer a heavier burden of their illness and are at remarkably high risk of further morbidity and mortality.2 Though admissions are usually for acute pain crises, these high utilizers also suffer greater risk of hematologic, cardiovascular, infectious, orthopedic, and psychiatric complications. The common psychiatric issues, including both mood disorders and substance abuse, emphasize the need for a multidisciplinary team of care providers to provide a comprehensive bio‐psycho‐social assessment of all patients with SCD who experience high hospital utilization. These patients will also benefit from system improvements that integrate and coordinate care across inpatient, outpatient, emergency department, and patient homes. Hospitalists are well positioned to engage in this model of care, as well as develop and improve processes to ensure seamless transitions across the various settings of care delivery. It is also crucial that hospitalists are engaged in research needed to better identify and understand risk factors that lead to high utilization. Only through collaborative efforts can we hope to solve the conundrum of frequently hospitalized patients with sickle cell pain crises.
In November 2010, the National Heart, Lung, and Blood Institute celebrated the 100th year anniversary of the discovery of sickle cell disease (SCD) in the United States by hosting the Herrick Symposium. Despite progress in the past 100 years, there is just one treatment available (hydroxyurea) and, while SCD is no longer considered only a disease of children, patients' life spans remain severely shortened (42 and 48 years, respectively, for males and females).1 With restrictions in residency hours and hospitals efforts to contain costs, hospitalists are increasingly being called upon to manage inpatient care for adults with SCD during their hospitalization. With the Centers for Medicare and Medicaid Services' recent plans to penalize hospitals with 30‐day readmission rates in excess of expected, hospitalists should address the challenges they face in providing care to adults with SCD and identify strategies to successfully meet them.
In this issue of the Journal of Hospital Medicine, Carroll and colleagues examined data from the California State Inpatient Database provided by the Healthcare Cost and Utilization Project (HCUP) for persons with International Classification of Diseases, Ninth Revision (ICD‐9) codes for SCD.2 They characterized patterns of hospital use during a 4‐year study period. Records for all patients, age 13 and older, with an admission for an SCD ICD‐9related cause were included. Patients with 4 or more hospitalizations in a 12‐month period were classified as having high hospital utilization, and 25% of the 1879 different patients evaluated fell into this category. A general perception exists that most persons with SCD have high hospital utilization, but data from Carroll et al. challenge this perception.2
While 1 in 4 patients in the cohort had high hospital utilization, why were not even more able to stay out of the hospital? Characteristics of these high utilizers shed light on contributing factors. Many patients died in the hospital (6.6%), consistent with research by others who also demonstrated the high risk of death associated with rehospitalization among patients with SCD.3, 4 In a prospective cohort study of 71 adults with either 70 hospital days or 6 admissions in a 12‐month period, 15% of the cohort died within a 24‐month study period.3 Patients with the highest number of hospital days, and those suffering from depression, were at highest risk of death. A separate prospective, longitudinal, 4‐year cohort study of adults with sickle cell anemia found an overall mortality of 14%.4 Mortality for those readmitted within 1 week of a painful crisis was 20%, compared to 11% for others in the cohort. High hospitalization use and hospital readmissions should be seen as worrisome markers of high risk for death, and patients should be carefully evaluated for life‐threatening complications, and not assumed to be purely drug seeking.
Why do some patients with SCD experience high readmission rates and mortality? Such patients with frequent hospitalizations have been found, in fact, to be sicker, and Carroll's research confirms that high utilizers were more likely to have comorbidities (acute chest syndrome, aseptic necrosis, renal disease) and complications (sepsis, pneumonia, pulmonary embolus, diabetes, mood disorders, and cocaine and alcohol use).2 Fortunately, high utilization appears to moderate over time for most patients, but those with persistent high utilization were more likely to have sepsis and mood disorders. Aisiku and colleagues studied a cohort of adults with SCD, in Virginia, in which emergency department (ED) utilization provided additional evidence for the association of high utilization with worse outcomes.5 Patients with 3 or more ED visits in 1 year were found to have lower hematocrits and higher white blood cell counts, to require more blood transfusions, and to report more pain, more pain days, more pain crises, and a worse quality of life. It is clear that patients with high hospital utilization are sicker and at an increased risk of death. While enlightening, this data does not tell the entire story.
Most admissions for patients with SCD begin with a vaso‐occlusive crisis, and frequently other complications may develop. Smith et al. provided the first prospectively collected data documenting that these patients reported pain on more than 54% of days, and many experience pain daily, yet infrequently access healthcare services.6 Hospitalists should appreciate that chronic pain is common for many adults with SCD. Pain management in this patient population is complex and often challenging, requiring high doses of opioids. In this current issue of the Journal, Smith and colleagues have contributed an excellent overview of how to manage pain in adults with SCD.7 The review specifically addresses some of the most challenging aspects of pain management in the hospital setting. Unfortunately, healthcare providers too frequently perceive patients as addicted to narcotics and abusing them, despite clear evidence that patients with SCD suffer from chronic pain. The consequent crisis of trust between the patient and provider commonly leads to inadequate treatment of pain and subsequent self‐discharge. Haywood and colleagues compared trust levels in adults with SCD and a history of sudden self‐discharge (ie, leaving against medical advice [AMA]) to those without such a history.8 Patients with a history of self‐discharge reported lower levels of trust of the medical staff and more negative interpersonal experiences. In a separate investigation, researchers compared scores on the Picker Patient Experience Questionnaire between a cohort of adults with SCD and national norms.9 Patients with SCD scored lower on 9 of 12 items. More specifically, 86% of respondents reported having insufficient involvement in decisions about care and treatment, and 50% reported staff did not do enough to control pain. Sadly, it appears the health system overall has undertreated and mismanaged patients with SCD suffering from pain crises.
Hospitalists face many challenges when managing care for adults with such a complex disease associated with high mortality, severe pain, and often a high readmission rate. The complexity of SCD calls for a comprehensive approach, and the need for each patient to have a clearly identified medical home.10 The hospital, emergency department, and hospitalist cannot and should not serve this role. Recently, Lindquist and Baker proposed a framework to understand and prevent hospital readmissions.11 They recommend optimizing the interfaces of transitional care among the patient, hospitalist, and primary care physician (PCP). By applying this framework of care, hospitalists must identify a PCP and provider with SCD expertise for follow‐up. Clear communication between the PCP, sickle cell expert, and hospitalist can be used to facilitate inpatient and emergency department care, and avoid inconsistent care that fosters mistrust. Individualized and consistent analgesic protocols established by outpatient providers, in collaboration with the patient, are more likely to deliver effective care, compared to variable attempts by whatever hospitalist happens to admit the patient.
Working with physicians expert in the care of patients with SCD, hospitalists might also identify patients who may benefit from hydroxyurea (HU) therapy. Despite clear evidence of HU's multiple salutary effects (decreased number of painful crises and need for hospital admissions, reduced number of blood transfusions and frequency of acute chest syndrome, and an overall benefit in mortality),12, 13 it remains underprescribed.14 In an analysis of a Medicaid managed care organization database in Maryland, 85% of patients never refilled a HU prescription. Moreover, patients with the highest rate of refills had the lowest number of hospital admissions and cost of care. Based on the evidence, hospitalists should screen all patients to determine whether or not HU has been prescribed, and if not, patients should be carefully assessed to determine if they are candidates for this effective therapy with communication to the patient's PCP and SCD expert.
Carroll's analysis confirms that patients with sickle cell disease frequently admitted to hospital (high utilizers) suffer a heavier burden of their illness and are at remarkably high risk of further morbidity and mortality.2 Though admissions are usually for acute pain crises, these high utilizers also suffer greater risk of hematologic, cardiovascular, infectious, orthopedic, and psychiatric complications. The common psychiatric issues, including both mood disorders and substance abuse, emphasize the need for a multidisciplinary team of care providers to provide a comprehensive bio‐psycho‐social assessment of all patients with SCD who experience high hospital utilization. These patients will also benefit from system improvements that integrate and coordinate care across inpatient, outpatient, emergency department, and patient homes. Hospitalists are well positioned to engage in this model of care, as well as develop and improve processes to ensure seamless transitions across the various settings of care delivery. It is also crucial that hospitalists are engaged in research needed to better identify and understand risk factors that lead to high utilization. Only through collaborative efforts can we hope to solve the conundrum of frequently hospitalized patients with sickle cell pain crises.
- ,,, et al.Mortality in sickle cell disease. Life expectancy and risk factors for early death.N Engl J Med.1994;330:1639–1644.
- ,,.Prediction of onset and course of high hospital utilization in sickle cell disease.J Hosp Med.2011;6:248–255.
- ,,,.Frequent and prolonged hospitalizations: a risk factor for early mortality in sickle cell disease patients.Am J Hematol.2003;72:201–203.
- ,.Hospital readmission for adult acute sickle cell painful episodes: frequency, etiology, and prognostic significance.Am J Hematol.2005;79:17–25.
- ,,,,,.Comparison of high versus low emergency department utilizers in sickle cell disease.Ann Emerg Med.2009;53:587–593.
- ,,, et al.Daily assessment of pain in adults with sickle cell disease.Ann Intern Med.2008;148:94–101.
- ,,.Frequently asked questions by hospitalists managing pain in adults with sickle cell disease.J Hosp Med.2011;6:297–303.
- ,,,,,.Hospital self‐discharge among adults with sickle‐cell disease (SCD): associations with trust and interpersonal experiences with care.J Hosp Med.2010;5:289–294.
- ,,,,,.Problematic hospital experiences among adult patients with sickle cell disease.J Health Care Poor Underserved.2010;21:1114–1123.
- ,,, et al.Sickle cell disease summit: from clinical and research disparity to action.Am J Hematol.2008;84:39–45.
- ,.Understanding preventable hospital readmissions: masqueraders, markers and true causal factors.J Hosp Med.2011;6:51–53.
- ,,, et al.Effect of hydroxyurea on the frequency of painful crises in sickle cell anemia.N Engl J Med.1995;332:1317–1322.
- ,,, et al.Effect of hydroxyurea on mortality and morbidity in adult sickle cell anemia: risks and benefits up to 9 years of treatment.JAMA.2003;289:1645–1651.
- ,,,.Examining the effectiveness of hydroxyurea in people with sickle cell disease.J Health Care Poor Underserved.2010;21:277–286.
- ,,, et al.Mortality in sickle cell disease. Life expectancy and risk factors for early death.N Engl J Med.1994;330:1639–1644.
- ,,.Prediction of onset and course of high hospital utilization in sickle cell disease.J Hosp Med.2011;6:248–255.
- ,,,.Frequent and prolonged hospitalizations: a risk factor for early mortality in sickle cell disease patients.Am J Hematol.2003;72:201–203.
- ,.Hospital readmission for adult acute sickle cell painful episodes: frequency, etiology, and prognostic significance.Am J Hematol.2005;79:17–25.
- ,,,,,.Comparison of high versus low emergency department utilizers in sickle cell disease.Ann Emerg Med.2009;53:587–593.
- ,,, et al.Daily assessment of pain in adults with sickle cell disease.Ann Intern Med.2008;148:94–101.
- ,,.Frequently asked questions by hospitalists managing pain in adults with sickle cell disease.J Hosp Med.2011;6:297–303.
- ,,,,,.Hospital self‐discharge among adults with sickle‐cell disease (SCD): associations with trust and interpersonal experiences with care.J Hosp Med.2010;5:289–294.
- ,,,,,.Problematic hospital experiences among adult patients with sickle cell disease.J Health Care Poor Underserved.2010;21:1114–1123.
- ,,, et al.Sickle cell disease summit: from clinical and research disparity to action.Am J Hematol.2008;84:39–45.
- ,.Understanding preventable hospital readmissions: masqueraders, markers and true causal factors.J Hosp Med.2011;6:51–53.
- ,,, et al.Effect of hydroxyurea on the frequency of painful crises in sickle cell anemia.N Engl J Med.1995;332:1317–1322.
- ,,, et al.Effect of hydroxyurea on mortality and morbidity in adult sickle cell anemia: risks and benefits up to 9 years of treatment.JAMA.2003;289:1645–1651.
- ,,,.Examining the effectiveness of hydroxyurea in people with sickle cell disease.J Health Care Poor Underserved.2010;21:277–286.
High Utilization in SCD
Extremes of hospital utilization by patients with sickle cell disease (SCD) are problematic for patients, clinicians, and policymakers.110 Although patients manage their pain at home most of the time, even acute crises,11 a small minority of SCD patients accounts for a remarkable amount of hospital resource utilization.1, 3, 4, 6, 1114 Where it is quite unusual for a patient with SCD to be hospitalized more than twice per year,1, 11 in prior work with payer datasets our group identified some patients who were hospitalized more frequently than once per month. In rare cases, admission rates exceeding once per week were identified.1 High‐utilizing SCD patients, and particularly the very high‐utilizing subset, account for the majority of costs of care for the population.13, 14
In previous work by our group describing hospital utilization among members of a regional Medicaid MCO, results suggested that high utilization was a relatively transient phenomenon for most patients, likely resulting from short‐term increases in hospitalization rates among previously moderate utilizers.1 However, high‐utilizing members whose inpatient admission rate did not quickly moderate were progressively less likely to resume a more typical utilization pattern.
The present study used the State Inpatient Databases for years 2004 to 2007 from the Agency for Healthcare Research and Quality to replicate prior findings and to investigate questions not addressed in our prior work. Specifically, hospital discharge data from all hospitals in the state of California were examined to identify first‐year adolescent and adult high utilizers and to follow their hospital utilization over time. The objectives of the study were as follows:
To identify historical predictors of a period of high utilization by comparing diagnoses between 20042006 in patients who were new high utilizers in 2007 with those who were never high utilizers.
To identify predictors of a persistent rather than moderating course by following patients who were new high utilizers in 2005 over the succeeding 2 years.
To replicate prior findings on the course of high hospital utilization.
Patients and Methods
Initial Data Source
The State Inpatient Databases (SID) are provided by the Healthcare Cost and Utilization Project, sponsored by the Agency for Healthcare Research and Quality. They contain patient‐level discharge data from all hospitals in participating states. This study presents SID data from California for the years 2004 through 2007, including a total of 34,363 hospital admissions in which a diagnosis of sickle cell disease was recorded. Encrypted patient identifiers were used to identify individual patients, and there are few missing identifiers in the California dataset for these years. The data set includes up to 25 discharge diagnostic codes using ICD‐9 nomenclature. In addition, each patient's age and gender are recorded.
Categorization Based on Diagnosis and Inpatient Utilization
Management of missing or conflicting information
A minority of hospitalization records contained ambiguous demographic information (such as conflicting or missing gender or age) associated with the same patient identifier. Identical identifiers were assumed to represent the same patient for purposes of this study, even if other information was conflicting. This decision avoided overly conservative utilization estimates, as high utilizers would have correspondingly more missing information and data entry errors that could lead the same patient to be identified as multiple others with lower utilization. An examination of admissions with conflicting measures supported this method, in that most conflicts were due to missing entries in otherwise consistent data or were very likely typographical. If inconsistencies were due only to missing information for some hospitalizations, the non‐missing values were accepted. In cases where there was actual inconsistency, the following methods were employed.
For dichotomous information, such as gender, conflicts were recoded as missing. Ages recorded in each hospitalization were standardized to ages as of 2004 by subtracting the difference between the year of admission and 2004. If the spread of ages associated with a given patient identification number was greater than 3 years (missing values excluded), the age was coded as missing (note that age at hospitalization could differ by 1 year depending on the temporal relation of hospitalization to the date of birth). If the discrepancy was less, the minimum recorded age was accepted.
Construction of the Study Subset
The study data set was constructed as follows (Fig. 1):
Patient identifiers associated with a diagnosis of sickle cell disease were selected by identifying admissions with ICD‐9 diagnosis codes for sickle cell disease appearing in the first 10 diagnoses for calendar years 2004 to 2007 (these included ICD‐9 codes 282.60 to 282.64, 282.68, 282.69, 282.41, and 282.42). Of this group, patients who had a record of at least 1 admission for sickle cell crisis were identified. An admission for crisis was operationalized as a hospitalization with 1 discharge diagnosis coded as 282.42, 282.62, 282.64, or 282.69. This yielded a data set of 34,363 admissions among 3169 patients.
Admissions with missing patient identification numbers were excluded (n = 2365 of 34,363 admissions, 6.88%).
Hospitalizations were tabulated for each unique patient identifier.
Patients with a known age of 13 years or more in 2004 were selected. There were 481 patients excluded due to age below 13 years, and 814 excluded for having an uncertain age. The final sample consisted of 1874 unique patient identifiers representing 10,704 hospital admissions.
As patients who were hospitalized more often were more likely to have inconsistent data, the exclusion for unknown and inconsistent age likely biased the findings by excluding more frequently hospitalized patients. Further post‐hoc analyses were conducted to gauge the extent of this bias, reported in Results, below.
Categorization by Utilization
For each patient, inpatient hospital admissions were tabulated for each year. A year of high utilization for a patient was defined as any calendar year in which that patient had 4 or more hospital admissions. In prior well‐designed studies, categorical definitions of high utilization have used cutoffs between 3 and 5 hospitalizations per year.13, 14 In our group's experience, the cutoff around 4 admissions per year identifies a subpopulation in the top 10% to 20% for annual hospital utilization, both in the outpatient clinic and in payer populations with which our center interacts. A patient was included in the high utilizer group if he or she was a high utilizer in at least 1 year of the study period; all other patients were placed in the comparison group. There were 479 patients in the high utilizer group (25.6% of the total sample) and 1395 in the comparison group. To predict onset of a period of high utilization, patients whose first year of high utilization was 2007 (n = 84) were compared with patients who were never high utilizers (n = 1395). In the prospective analysis to predict moderation, patients who were new high utilizers in 2005 (n = 206) were divided into the group who had fewer than 4 admissions in the following year (moderating course, n = 131) and those who had more than 4 admissions in the following year (continuous course, n = 75).
Operationalization of Diagnoses of Comorbid Conditions and Complications
Discharge diagnoses were parsed by a computer algorithm for diagnostic codes matching selected diagnoses. If the diagnosis was found at least once, the patient was coded as having the diagnosis. Diagnostic codes (ICD‐9‐CM) included the following: HIV: 042.__; septicemia: 038.__; pneumonia: 482.00 to 486.99; pulmonary embolus: 415.11,12 and 415.19; acute chest syndrome: 517.3_; chronic renal disease: 585.__; diabetes mellitus: 250.__; cocaine dependence: 304.2_; cocaine abuse: 305.6_; alcohol dependence: 303.00 to 303.92; alcohol abuse: 305.0_; mood disorders (including depressive and bipolar disorders): 296.00 to 296.89; and aseptic necrosis of bone: 733.4_. Substance dependence and abuse were aggregated to create alcohol use disorder and cocaine use disorder categories. Opiate use disorders were not included, as the clinical experience of the authors suggested that clinicians may sometimes diagnose opiate dependence on the basis of frequent hospitalization in itself, and it seemed prudent to avoid the confound.
Statistical Analyses
All statistical and graphical analyses were performed in the R statistical computing environment.15 Intergroup differences in categorical data were analyzed using the chi‐square test for independence. The sample distributions of many measures were highly skewed, and nonparametric methods were used where practical. In general, the median and interquartile range are reported as measures of central tendency and spread, respectively. Comparisons between groups on continuous measures were done using the Mann‐Whitney‐Wilcoxon test.
Institutional Review Board Approval
The study was exempt from institutional review board review, due to the nature of the data set and its noninterventional design.
Results
Comparison of Utilization Groups by Demographics and Diagnosis
Table 1 presents direct comparisons of high utilizers with comparison patients. Patients in the high utilizer group were slightly more likely to be female and had a higher prevalence of all diagnoses examined, with the exception of HIV (where prevalence was quite low). At least 1 discharge diagnosis of acute chest syndrome was common in both groups, but was more than twice as prevalent in high utilizers. Diagnoses of aseptic necrosis of bone and septicemia were much greater in the high utilizer group than among comparison subjects.
| Comparison N = 1395 | High Utilizers N = 479 | P | |
|---|---|---|---|
| |||
| Demographics | |||
| Age | 32 [21]b | 29 [19]b | <0.001 |
| Femalea | 55.28% | 66.46% | <0.001 |
| Complications | |||
| Acute chest syndrome | 15.63% | 40.29% | <0.001 |
| Aseptic necrosis | 9.18% | 30.90% | <0.001 |
| Renal disease | 4.01% | 11.48% | <0.001 |
| Comorbidities | |||
| Septicemia | 7.03% | 31.52% | <0.001 |
| Pneumonia | 2.51% | 8.14% | <0.001 |
| HIV | 0.57% | 1.04% | 0.453 |
| Pulmonary embolus | 2.51% | 10.02% | <0.001 |
| Diabetes | 6.38% | 13.57% | <0.001 |
| Mood disorder | 1.72% | 11.69% | <0.001 |
| Cocaine disorder | 1.00% | 9.60% | <0.001 |
| Alcohol disorder | 2.87% | 8.56% | <0.001 |
| Utilization | |||
| Hospitalizations | 2 [2]b | 11 [12]b | <0.001 |
Prior History of New High Utilizers
Patients who were first high utilizers in 2007 (FY2007) were compared with patients who were never high utilizers on hospital diagnoses made before 2007 to identify predictors of a new‐onset period of high utilization (Table 2). The FY2007 high utilizers did not differ significantly in demographics from nonhigh utilizers. The FY2007 high utilizers had a greater prevalence of discharge diagnoses of aseptic necrosis of bone (OR 2.03, 95% CI, 1.07 to 3.85) and renal disease (OR 6.28, 95% CI, 2.72 to 14.5) prior to the onset of high utilization. FY2007 high utilizers also had a greater number of hospitalizations prior to their initial year of high utilization (median 3 vs 1); however, a similar proportion of FY2007 and never high utilizers had been hospitalized at least once before 2007. In 2007, the first‐year 2007 high utilizers had a markedly greater prevalence of hospital diagnoses of acute chest syndrome (OR 4.67, 95% CI, 2.53 to 8.63) and septicemia (OR 8.26, 95% CI, 3.91 to 17.4). Other diagnoses, expressed as OR and 95% confidence intervals, included aseptic necrosis of bone 4.80 (1.89 to 12.2), pneumonia 17.6 (4.99 to 62.0), pulmonary embolus 5.70 (1.52 to 21.5), mood disorder 11.0 (3.51 to 34.3), and cocaine disorder 10.3 (2.42 to 43.8), Table 2). However, only a minority of nonhigh utilizers were hospitalized at all that year.
| Prior to 2007 | In 2007 | |||||
|---|---|---|---|---|---|---|
| Never | New High Utilizers in 2007 | P | Never | New High Utilizers in 2007 | P | |
| N = 1395 | N = 84 | |||||
| ||||||
| Demographics | ||||||
| Age | 32 [20]a | 30 [20]a | 0.116 | |||
| Female | 55.28% | 65.06% | 0.103 | |||
| New complications | ||||||
| Acute chest syndrome | 11.18% | 15.48% | 0.306 | 4.44% | 17.86% | <0.001 |
| Aseptic necrosis | 7.60% | 14.29% | 0.047 | 1.58% | 7.14% | 0.001 |
| Renal disease | 1.65% | 9.52% | <0.001 | 2.37% | 3.57% | 0.740 |
| New comorbidities | ||||||
| Septicemia | 5.23% | 5.95% | 0.972 | 1.79% | 13.10% | <0.001 |
| Pneumonia | 2.15% | 0.00% | 0.337 | 0.36% | 5.95% | <0.001 |
| HIV | 0.57% | 0.00% | 0.944 | 0 | 0 | |
| Pulmonary embolus | 1.86% | 2.38% | 0.941 | 0.65% | 3.57% | 0.023 |
| Diabetes mellitus | 4.52% | 4.76% | 0.869 | 1.86% | 4.76% | 0.152 |
| Mood disorder | 1.15% | 3.57% | 0.156 | 0.57% | 5.95% | <0.001 |
| Cocaine disorder | 0.65% | 1.19% | 0.926 | 0.36% | 3.57% | 0.002 |
| Alcohol disorder | 4.30% | 2.38% | 0.567 | 1.43% | 4.76% | 0.057 |
| Utilization | ||||||
| Hospitalized | 82.51% | 85.71% | 0.545 | 46.73% | 100% | <0.001 |
| Hospitalizations | 1 [4]a | 3 [4]a | <0.001 | 0 [2]a | 5 [2]a | <0.001 |
Course of New High Utilizers
Patients who were high utilizers in 2005 but not in 2004 were identified, and their hospital utilization from 2005 to 2007 was plotted (Fig. 2). The results are shown in Figure 1. Fifty‐five of the original 91 (60.44%) new high utilizers moderated in the following year, and 6.59% were known to have died in the hospital. Of the surviving 30 (32.97%) who did not moderate in the second year, 19 (65.3%) continued the high‐utilizing pattern into the third year, while 9 (16.36%) of those who moderated in year 2 returned to the high‐utilizing pattern in year 3. During this 3‐year period, 10 members (10.99%) of the initial group died in the hospital.
Diagnostic Patterns in Continued and Moderated First‐Year High Utilizers
The diagnoses of patients who were high utilizers in 2005 and not 2004 were examined for differences between those who moderated in 2006 (moderating group) and those who continued the high‐utilizing pattern (persistent group, Table 3). There were no differences in any measures examined in 2004. In 2005, the initial year of high utilization, the groups differed only on the prevalence of new diagnoses of alcohol use disorders (95% CI for odds ratio incalculable due to zero prevalence in moderating group), and slightly in number of hospitalizations (median 5 vs 5.5). Over ensuing years, the persistent group was more likely to have new discharge diagnoses of septicemia (OR 5.88, 95% CI, 1.40 to 24.7) and mood disorders (OR not calculated due to zero prevalence in the moderating group).
| Course of 2005 1st Year High Utilizers | |||||||||
|---|---|---|---|---|---|---|---|---|---|
| Prior Year (2004) | First Year (2005) | Subsequent Years (20062007) | |||||||
| Moderating | Persistent | P | Moderating | Persistent | P | Moderating | Persistent | P | |
| N = 61 | N = 30 | ||||||||
| |||||||||
| Demographics | |||||||||
| Age | 30 [22]a | 25 [29.5]a | .682 | ||||||
| Female | 63.93% | 66.67% | .982 | ||||||
| New complications | |||||||||
| Acute chest syndrome | 8.2% | 6.67% | .872 | 21.31% | 33.33% | .325 | 4.92% | 13.33% | .318 |
| Aseptic necrosis | 6.56% | 13.33% | .978 | 11.48% | 10.00% | .885 | 8.20% | 13.33% | .691 |
| Renal disease | 0.00% | 0.00% | 11.48% | 10.00% | .885 | 3.28% | 10.00% | .405 | |
| New comorbidities | |||||||||
| Septicemia | 4.92% | 0.00% | .541 | 9.84% | 3.33% | .500 | 4.92% | 23.33% | .022 |
| Pneumonia | 1.64% | 0.00% | .716 | 4.92% | 0.00% | .541 | 0.00% | 6.67% | .201 |
| HIV | 0.00% | 0.00% | 1.64% | 0.00% | .716 | 0.00% | 0.00% | ||
| Pulmonary embolus | 0.00% | 3.33% | .541 | 11.48% | 3.33% | .370 | 4.92% | 3.33% | .844 |
| Diabetes mellitus | 3.28% | 3.33% | .844 | 9.84% | 6.67% | .914 | 0.00% | 3.33% | .716 |
| Mood disorder | 3.28% | 6.67% | .541 | 1.64% | 10.00% | .199 | 0.00% | 13.33% | .018 |
| Cocaine disorder | 3.28% | 3.33% | .622 | 1.64% | 10.00% | .199 | 0.00% | 6.67% | .201 |
| Alcohol disorder | 0.00% | 0.00% | 0.00% | 16.67% | .005 | 1.64% | 6.67% | .523 | |
| Utilization | |||||||||
| Hospitalized | 77.05% | 73.33% | .898 | 100% | 100% | 73.77% | 100% | .005 | |
| Hospitalizations | 1 [2]a | 1.5 [2.5]a | .924 | 5 [2]a | 5.5 [4]a | .022 | 2 [4]a | 11 [11.75]a | <.001 |
Assessment of Effects of Age Selection
In order to assess the effects of restricting the sample to patients with a known age <13, post‐hoc analyses were performed without this restriction. In general, results were in line with findings from the planned analysis.
Using these less stringent criteria, prior to the onset of their first year of high utilization, FY2007 high utilizers (n = 142) were more likely to be female (63.0% vs 52.5%, P = 0.019) than never high utilizers (n = 2173), and also had more chronic kidney disease (7.75% vs 1.29%, P < 0.001), mood disorders (4.93% vs 0.83%, P < 0.001), and prior hospitalizations (median 3 vs 2, P < 0.001).
New 2005 high utilizers who persisted after 2005 (n = 75) were more likely to be diagnosed with alcohol disorders in 2005 (8% vs 0%, P = 0.004) and had slightly more hospitalizations (median 5 for both groups, but with a greater spread for the continuous group, P = 0.003) in 2005 than those who moderated (n = 131). After 2005, the continuous group were more likely to have new diagnoses of acute chest syndrome (5.34% vs 14.67%, P = 0.043), aseptic necrosis (4.58% vs 14.67%, P = 0.023), septicemia (3.82% vs 21.33%, P < 0.001), and mood disorders (0.00% vs 9.33%, P = 0.002).
Discussion
Replication of the Moderating Course of High Utilization
This study replicates, with substantial sample size, the finding that high inpatient utilization in patients with SCD tends to moderate relatively quickly. As the present report used a statewide data set of patients not selected for payer type, it mitigates prior concerns that selection by insurance status, disenrollment, and mortality biased previous findings using payer data sets. Thus, the moderating course of the typical high‐utilizing SCD patient now seems well‐established.
The fact that those new high utilizers who did not moderate stabilized at a new, higher level of utilization suggests that interventional studies of high utilizers in SCD may best target a more extreme population, either in terms of multi‐year persistence or an accelerating course of utilization. However, this subgroup will be rare.
Prediction of Onset and Course of New High Utilizers
This is the first study to the authors' knowledge to address the question of whether the onset and course of a period of high utilization can be reliably predicted. The results were mixed. High utilizers appeared to be more ill and complex than comparison patients over a wide range of measures, and new high utilizers were diagnosed with more complications prior to and during an index period of high utilization than comparison patients. Chronic complications appeared to lead a period of new high utilization, and more acute complications occurred in the same year. However, while complications were more prevalent in new high utilizers, the differences were not of sufficient magnitude to be reliably predictive. Even the most common SCD complication noted, acute chest syndrome, occurred as a new diagnosis in less than 20% of the new high utilizers in the initial year of high utilization. Thus, paradoxically, while high utilizers appeared more ill, no particular pattern of illness was strongly predictive of high utilization.
Persistent high utilization, rather than the more usual transient course, seemed more closely related to new substance use and mood disorder diagnoses than to complications of sickle cell disease. Persistent high utilizers had a greater prevalence of new diagnoses of mood disorders than moderating high utilizers in every time period examined, emerging as statistically significant after the first year of high utilization. The difference in new diagnoses of alcohol disorders was statistically significant in the initial period of high utilization, but was also present in the other time periods. Cocaine use disorders showed a similar pattern, though they were more rare and did not rise to the level of statistical significance.
The one SCD complication associated with persistent high utilization was septicemia. It is tempting to speculate that this could be as much cause as consequence of high utilization, given the exposures of frequently hospitalized patients to invasive procedures and nosocomial infection.
There was an intriguing regularity of associations of high utilization with mood disorders. This was most clear in differentiating persistent from moderating high utilizers, but was present as a theme in the results throughout. High utilizers were much more likely to be diagnosed with a mood disorder, and both first year high utilizers and persistent high utilizers were distinguished by a higher prevalence of new mood disorder diagnoses. Patients who were persistent high utilizers after an initial high utilization period in 2005 had a cumulative prevalence of hospital‐diagnosed mood disorder approximating 30% by 2007. These differences could be due to a number of factors, including increased surveillance in high utilizers, pain and chronic illness causing mood disturbance, or mood disorders influencing the underlying disease process.
Implications
High utilization in this and other studies is closely related to evidence of more severe sickle cell disease.3, 8, 9, 17 This fact, and the apparent difficulty of predicting the onset and course of high utilization, suggest that the primary intervention to moderate high utilization is to prevent such acute complications as acute chest syndrome in the more seriously affected. While the advent of hydroxyurea produced new hope that clinicians could reduce disruptive and dangerous hospitalizations for SCD patients,18 so far there is little evidence that this has occurred.14 Particularly concerning is evidence that only a minority of patients for whom hydroxyurea is indicated are being prescribed the medication.14, 19 Given the individual and public benefits of reduced morbidity and cost, interventions to reduce barriers to physician prescribing and patient adherence are urgently needed, and this is one of the most important issues in the clinical care of SCD today.
The study also points out the continuing question of the role of psychiatric problems in the high‐utilizing SCD patient. While depression, anxiety, and addiction are frequently used as clinical explanations for high utilization in SCD patients, the research literature has stalled at reporting associations between measures of psychological distress and worsened outcome, with inconsistent results depending on methods and populations chosen. Generally, depression has been defined categorically by threshold cutoffs in screening instruments.2023 Whether the term depression should refer to major depressive disorder as defined in the standard psychiatric diagnostic system, or as a broader entity including less severe symptoms or milder disorders, is only rarely addressed.20 This method probably produces a high false‐positive rate relative to the provisional gold standard of diagnosisexpert, diagnostic, semi‐structured interviews.21, 22
However, within the limitations of current methods, certain themes have emerged. Depression, as currently defined, appears highly prevalent among SCD patients.20, 21, 23, 24 It is clearly and consistently associated with worsened pain.20, 21, 25, 26 It also predicts greater opioid use, dramatically reduced quality of life, and reduced relief from opioids.20, 27 Findings on utilization are mixed, however. In some studies, depression has been associated with greater utilization.23, 28 However, in the longitudinal Pain in Sickle Cell Epidemiology Study (PiSCES) study, depression was not associated with utilization when other relevant characteristics were controlled.20 In general, depression appears to lose predictive power as more clinical variables are entered into the model; however, a number of the clinical variables associated with utilization also are related to depression. Whether depression may have a causal role through multiple pathways is not yet settled.
Another matter, frequently discussed but currently unsettled, is the role of addiction in utilization behavior in SCD. Whereas patients with SCD are heavily scrutinized for addiction, and the clinical problem of aberrant opioid use behavior is often discussed for this population, research literature gives little guidance as to the true prevalence and management of such comorbidities. It is well known that substance use disorders are interconnected, such that presence of one elevates risk for others; thus, one would expect more common substance use disorders to act as epidemiologic sentinels for the less. The study of alcohol use disorders, in particular, could be an excellent candidate for developing hypotheses about substance use disorders in this populationdivorced from differentiating problematic pain management behavior from purely drug‐reinforced behavior. In the present study, alcohol use disorders appeared associated with persistent high utilization; however, in other well‐designed longitudinal studies alcohol abuse was related to lower utilization. The meaning of these divergent findings is unclear for the moment.
Despite frequent clinical attention to psychiatric problems in SCD, well‐designed longitudinal studies to clarify causal relations are lacking. Such studies will require reasonable sample sizes, the use of expert structured interviews for diagnostic confirmation, and care taken to address the level of independence of the depressive syndrome from consequences of the underlying illness. The latter will be methodologically difficult. It may require detailed assessment of the course of the depressive syndrome relative to that of the hematologic disorder, assessment of background familial risk for mood disorder, and the effects of subclinical ischemic neurological insults. Despite the challenges, if this work is not done clinicians will be left with tantalizing associations but no solid evidence to guide treatment, and the confusion surrounding the role of psychiatric illness in SCD will remain. Meanwhile,, it seems prudent to have a low threshold to screen for psychiatric disorder and to obtain psychiatric consultations relatively early, where appropriate, for patients whose hospital utilization appears to be accelerating.
Strengths and Weaknesses
Higher hospital utilization provided greater opportunity for diagnosis, so some detection bias in these results should be assumed. Diagnoses are extracted from hospital discharge records using ICD codes. There are opportunities for a number of errors in reporting and coding these diagnoses, and this is likely to be particularly true of conditions that are not the primary clinical focus of the hospitalization. However, all patients had at least 1 hospital admission, and the diagnostic differences are not far outside of expectation. The study also required at least one hospitalization for crisis for inclusion to guard against bias from patients with more mild disease. As such, the conservatively‐defined comparison group may not be a perfect representation of low utilizers, and some relationships may be blunted relative to findings from a broader population.
The study also had a number of strengths, particularly related to the large number of patients who could be tracked using these methods. Given the rarity of sickle cell disease, and the rarity of high‐utilizing patients in the SCD population, such methods as these are the most practical means of developing hypotheses as to the causes and course of high utilization. It is reassuring that the age selection criterion did not significantly alter results; in fact, post hoc analyses that were more inclusive of the high‐utilizing population generally reinforced results of the more stringent analysis.
- ,,,.The course and correlates of high hospital utilization in sickle cell disease: evidence from a large, urban Medicaid managed care organization.Am J Hematol.2009;84:666–670.
- ,,,,,,,.Health care provider attitudes toward patients with acute vaso‐occlusive crisis due to sickle cell disease: development of a scale.Patient Educ Couns.2009 Feb 20. [published online ahead of print]
- ,,,,,,,.Comparisons of high versus low emergency department utilizers in sickle cell disease.Ann Emerg Med.2009;53:587–593.
- ,.Healthcare Cost and Utilization Project Statistical Brief #21: Sickle Cell Disease Patients in U.S. Hospitals, 2004.Rockville, MD:Agency for Healthcare Research and Quality;2006.
- ,,.Physicians' attitude and practices in sickle cell disease pain management.J Palliat Care.2005;21:246–251.
- ,,,,,.Medical care utilization and mortality in sickle cell disease: a population‐based study.Am J Hematol.2005;80:262–270.
- ,,,,.Understanding the causes of problematic pain management in sickle cell disease: evidence that pseudoaddiction plays a more important role than genuine analgesic dependence.J Pain Symptom Manage.2004;27:156–169.
- ,,,.Frequent and prolonged hospitalizations: a risk factor for early mortality in sickle cell disease patients.Am J Hematol.2003;72:201–203.
- ,,.Hospital resource utilization among patients with sickle cell disease.J Health Care Poor Underserved.2003;14:122–135.
- ,,,,Nurses' attitudes and practices in sickle cell pain management.Appl Nurs Res.2001;14:187–192.
- ,,,,,,,,.Daily assessment of pain in adults with sickle cell disease.Ann Intern Med.2008;148:94–101.
- ,,,.A longitudinal examination predicting emergency room use in children with sickle cell disease and their caregivers.J Pediatr Psychol.200631:163–173.
- ,,,,.Utilization of the office, hospital and emergency department for adult sickle cell patients: a five‐year study.J Natl Med Assoc.2006;98:1109–1113.
- ,,,.Hospitalization rates and costs of care of patients with sickle‐cell anemia in the state of Maryland in the era of hydroxyurea.Am J Hematol.2006;81:927–932.
- The R Development Core Team. R:A Language and Environment for Statistical Computing.Vienna, Austria;2009.
- ,,.Physical and mental health in adults hospitalized with sickle cell disease: impact on resource use.J Natl Med Assoc.2009;101:139–144.
- ,,,,.Rural/urban differences in access to and utilization of services among people in Alabama with sickle cell disease.Public Health Rep.2003;118:27–36.
- ,,,,,,,.Effect of hydroxyurea on the frequency of painful crises in sickle cell anemia. Investigators of the multicenter study of hydroxyurea in sickle cell anemia.N Engl J Med.1995;332:1317–1322.
- ,,,.Provider barriers to hydroxyurea use in adults with sickle cell disease: a survey of the sickle cell disease adult provider network.J Natl Med Assoc.2008;100:968–973.
- ,,,,,,,,,.Depression and anxiety in adults with sickle cell disease: the PiSCES project.Psychosom Med.2008;70:192–196.
- ,,,,,,.Depression, disease severity, and sickle cell disease.J Behav Med.1999;22:115–126.
- ,,,.Depression and functioning in relation to health care use in sickle cell disease.Ann Behav Med.2000;22:149–157.
- ,.The role of depression in hospital admissions and emergency treatment of patients with sickle cell disease.J Natl Med Assoc.1991;83:777–781.
- ,.Depression and anxiety in patients with sickle cell disease: conceptual and methodological considerations.J Health Soc Policy.1994;5:39–53.
- ,,,,,,,,.Pain site frequency and location in sickle cell disease: the PiSCES project.Pain.2009;145:246–251.
- ,,,.Quality of life among adolescents with sickle cell disease: mediation of pain by internalizing symptoms and parenting stress.Health Qual Life Outcomes.2008;6:60.
- ,,,,,,,,.Understanding pain and improving management of sickle cell disease: the PiSCES study.J Natl Med Assoc.2005;97:183–193.
- ,,,,.Depression in sickle cell disease.J Natl Med Assoc.2003;95:533–537.
Extremes of hospital utilization by patients with sickle cell disease (SCD) are problematic for patients, clinicians, and policymakers.110 Although patients manage their pain at home most of the time, even acute crises,11 a small minority of SCD patients accounts for a remarkable amount of hospital resource utilization.1, 3, 4, 6, 1114 Where it is quite unusual for a patient with SCD to be hospitalized more than twice per year,1, 11 in prior work with payer datasets our group identified some patients who were hospitalized more frequently than once per month. In rare cases, admission rates exceeding once per week were identified.1 High‐utilizing SCD patients, and particularly the very high‐utilizing subset, account for the majority of costs of care for the population.13, 14
In previous work by our group describing hospital utilization among members of a regional Medicaid MCO, results suggested that high utilization was a relatively transient phenomenon for most patients, likely resulting from short‐term increases in hospitalization rates among previously moderate utilizers.1 However, high‐utilizing members whose inpatient admission rate did not quickly moderate were progressively less likely to resume a more typical utilization pattern.
The present study used the State Inpatient Databases for years 2004 to 2007 from the Agency for Healthcare Research and Quality to replicate prior findings and to investigate questions not addressed in our prior work. Specifically, hospital discharge data from all hospitals in the state of California were examined to identify first‐year adolescent and adult high utilizers and to follow their hospital utilization over time. The objectives of the study were as follows:
To identify historical predictors of a period of high utilization by comparing diagnoses between 20042006 in patients who were new high utilizers in 2007 with those who were never high utilizers.
To identify predictors of a persistent rather than moderating course by following patients who were new high utilizers in 2005 over the succeeding 2 years.
To replicate prior findings on the course of high hospital utilization.
Patients and Methods
Initial Data Source
The State Inpatient Databases (SID) are provided by the Healthcare Cost and Utilization Project, sponsored by the Agency for Healthcare Research and Quality. They contain patient‐level discharge data from all hospitals in participating states. This study presents SID data from California for the years 2004 through 2007, including a total of 34,363 hospital admissions in which a diagnosis of sickle cell disease was recorded. Encrypted patient identifiers were used to identify individual patients, and there are few missing identifiers in the California dataset for these years. The data set includes up to 25 discharge diagnostic codes using ICD‐9 nomenclature. In addition, each patient's age and gender are recorded.
Categorization Based on Diagnosis and Inpatient Utilization
Management of missing or conflicting information
A minority of hospitalization records contained ambiguous demographic information (such as conflicting or missing gender or age) associated with the same patient identifier. Identical identifiers were assumed to represent the same patient for purposes of this study, even if other information was conflicting. This decision avoided overly conservative utilization estimates, as high utilizers would have correspondingly more missing information and data entry errors that could lead the same patient to be identified as multiple others with lower utilization. An examination of admissions with conflicting measures supported this method, in that most conflicts were due to missing entries in otherwise consistent data or were very likely typographical. If inconsistencies were due only to missing information for some hospitalizations, the non‐missing values were accepted. In cases where there was actual inconsistency, the following methods were employed.
For dichotomous information, such as gender, conflicts were recoded as missing. Ages recorded in each hospitalization were standardized to ages as of 2004 by subtracting the difference between the year of admission and 2004. If the spread of ages associated with a given patient identification number was greater than 3 years (missing values excluded), the age was coded as missing (note that age at hospitalization could differ by 1 year depending on the temporal relation of hospitalization to the date of birth). If the discrepancy was less, the minimum recorded age was accepted.
Construction of the Study Subset
The study data set was constructed as follows (Fig. 1):
Patient identifiers associated with a diagnosis of sickle cell disease were selected by identifying admissions with ICD‐9 diagnosis codes for sickle cell disease appearing in the first 10 diagnoses for calendar years 2004 to 2007 (these included ICD‐9 codes 282.60 to 282.64, 282.68, 282.69, 282.41, and 282.42). Of this group, patients who had a record of at least 1 admission for sickle cell crisis were identified. An admission for crisis was operationalized as a hospitalization with 1 discharge diagnosis coded as 282.42, 282.62, 282.64, or 282.69. This yielded a data set of 34,363 admissions among 3169 patients.
Admissions with missing patient identification numbers were excluded (n = 2365 of 34,363 admissions, 6.88%).
Hospitalizations were tabulated for each unique patient identifier.
Patients with a known age of 13 years or more in 2004 were selected. There were 481 patients excluded due to age below 13 years, and 814 excluded for having an uncertain age. The final sample consisted of 1874 unique patient identifiers representing 10,704 hospital admissions.
As patients who were hospitalized more often were more likely to have inconsistent data, the exclusion for unknown and inconsistent age likely biased the findings by excluding more frequently hospitalized patients. Further post‐hoc analyses were conducted to gauge the extent of this bias, reported in Results, below.
Categorization by Utilization
For each patient, inpatient hospital admissions were tabulated for each year. A year of high utilization for a patient was defined as any calendar year in which that patient had 4 or more hospital admissions. In prior well‐designed studies, categorical definitions of high utilization have used cutoffs between 3 and 5 hospitalizations per year.13, 14 In our group's experience, the cutoff around 4 admissions per year identifies a subpopulation in the top 10% to 20% for annual hospital utilization, both in the outpatient clinic and in payer populations with which our center interacts. A patient was included in the high utilizer group if he or she was a high utilizer in at least 1 year of the study period; all other patients were placed in the comparison group. There were 479 patients in the high utilizer group (25.6% of the total sample) and 1395 in the comparison group. To predict onset of a period of high utilization, patients whose first year of high utilization was 2007 (n = 84) were compared with patients who were never high utilizers (n = 1395). In the prospective analysis to predict moderation, patients who were new high utilizers in 2005 (n = 206) were divided into the group who had fewer than 4 admissions in the following year (moderating course, n = 131) and those who had more than 4 admissions in the following year (continuous course, n = 75).
Operationalization of Diagnoses of Comorbid Conditions and Complications
Discharge diagnoses were parsed by a computer algorithm for diagnostic codes matching selected diagnoses. If the diagnosis was found at least once, the patient was coded as having the diagnosis. Diagnostic codes (ICD‐9‐CM) included the following: HIV: 042.__; septicemia: 038.__; pneumonia: 482.00 to 486.99; pulmonary embolus: 415.11,12 and 415.19; acute chest syndrome: 517.3_; chronic renal disease: 585.__; diabetes mellitus: 250.__; cocaine dependence: 304.2_; cocaine abuse: 305.6_; alcohol dependence: 303.00 to 303.92; alcohol abuse: 305.0_; mood disorders (including depressive and bipolar disorders): 296.00 to 296.89; and aseptic necrosis of bone: 733.4_. Substance dependence and abuse were aggregated to create alcohol use disorder and cocaine use disorder categories. Opiate use disorders were not included, as the clinical experience of the authors suggested that clinicians may sometimes diagnose opiate dependence on the basis of frequent hospitalization in itself, and it seemed prudent to avoid the confound.
Statistical Analyses
All statistical and graphical analyses were performed in the R statistical computing environment.15 Intergroup differences in categorical data were analyzed using the chi‐square test for independence. The sample distributions of many measures were highly skewed, and nonparametric methods were used where practical. In general, the median and interquartile range are reported as measures of central tendency and spread, respectively. Comparisons between groups on continuous measures were done using the Mann‐Whitney‐Wilcoxon test.
Institutional Review Board Approval
The study was exempt from institutional review board review, due to the nature of the data set and its noninterventional design.
Results
Comparison of Utilization Groups by Demographics and Diagnosis
Table 1 presents direct comparisons of high utilizers with comparison patients. Patients in the high utilizer group were slightly more likely to be female and had a higher prevalence of all diagnoses examined, with the exception of HIV (where prevalence was quite low). At least 1 discharge diagnosis of acute chest syndrome was common in both groups, but was more than twice as prevalent in high utilizers. Diagnoses of aseptic necrosis of bone and septicemia were much greater in the high utilizer group than among comparison subjects.
| Comparison N = 1395 | High Utilizers N = 479 | P | |
|---|---|---|---|
| |||
| Demographics | |||
| Age | 32 [21]b | 29 [19]b | <0.001 |
| Femalea | 55.28% | 66.46% | <0.001 |
| Complications | |||
| Acute chest syndrome | 15.63% | 40.29% | <0.001 |
| Aseptic necrosis | 9.18% | 30.90% | <0.001 |
| Renal disease | 4.01% | 11.48% | <0.001 |
| Comorbidities | |||
| Septicemia | 7.03% | 31.52% | <0.001 |
| Pneumonia | 2.51% | 8.14% | <0.001 |
| HIV | 0.57% | 1.04% | 0.453 |
| Pulmonary embolus | 2.51% | 10.02% | <0.001 |
| Diabetes | 6.38% | 13.57% | <0.001 |
| Mood disorder | 1.72% | 11.69% | <0.001 |
| Cocaine disorder | 1.00% | 9.60% | <0.001 |
| Alcohol disorder | 2.87% | 8.56% | <0.001 |
| Utilization | |||
| Hospitalizations | 2 [2]b | 11 [12]b | <0.001 |
Prior History of New High Utilizers
Patients who were first high utilizers in 2007 (FY2007) were compared with patients who were never high utilizers on hospital diagnoses made before 2007 to identify predictors of a new‐onset period of high utilization (Table 2). The FY2007 high utilizers did not differ significantly in demographics from nonhigh utilizers. The FY2007 high utilizers had a greater prevalence of discharge diagnoses of aseptic necrosis of bone (OR 2.03, 95% CI, 1.07 to 3.85) and renal disease (OR 6.28, 95% CI, 2.72 to 14.5) prior to the onset of high utilization. FY2007 high utilizers also had a greater number of hospitalizations prior to their initial year of high utilization (median 3 vs 1); however, a similar proportion of FY2007 and never high utilizers had been hospitalized at least once before 2007. In 2007, the first‐year 2007 high utilizers had a markedly greater prevalence of hospital diagnoses of acute chest syndrome (OR 4.67, 95% CI, 2.53 to 8.63) and septicemia (OR 8.26, 95% CI, 3.91 to 17.4). Other diagnoses, expressed as OR and 95% confidence intervals, included aseptic necrosis of bone 4.80 (1.89 to 12.2), pneumonia 17.6 (4.99 to 62.0), pulmonary embolus 5.70 (1.52 to 21.5), mood disorder 11.0 (3.51 to 34.3), and cocaine disorder 10.3 (2.42 to 43.8), Table 2). However, only a minority of nonhigh utilizers were hospitalized at all that year.
| Prior to 2007 | In 2007 | |||||
|---|---|---|---|---|---|---|
| Never | New High Utilizers in 2007 | P | Never | New High Utilizers in 2007 | P | |
| N = 1395 | N = 84 | |||||
| ||||||
| Demographics | ||||||
| Age | 32 [20]a | 30 [20]a | 0.116 | |||
| Female | 55.28% | 65.06% | 0.103 | |||
| New complications | ||||||
| Acute chest syndrome | 11.18% | 15.48% | 0.306 | 4.44% | 17.86% | <0.001 |
| Aseptic necrosis | 7.60% | 14.29% | 0.047 | 1.58% | 7.14% | 0.001 |
| Renal disease | 1.65% | 9.52% | <0.001 | 2.37% | 3.57% | 0.740 |
| New comorbidities | ||||||
| Septicemia | 5.23% | 5.95% | 0.972 | 1.79% | 13.10% | <0.001 |
| Pneumonia | 2.15% | 0.00% | 0.337 | 0.36% | 5.95% | <0.001 |
| HIV | 0.57% | 0.00% | 0.944 | 0 | 0 | |
| Pulmonary embolus | 1.86% | 2.38% | 0.941 | 0.65% | 3.57% | 0.023 |
| Diabetes mellitus | 4.52% | 4.76% | 0.869 | 1.86% | 4.76% | 0.152 |
| Mood disorder | 1.15% | 3.57% | 0.156 | 0.57% | 5.95% | <0.001 |
| Cocaine disorder | 0.65% | 1.19% | 0.926 | 0.36% | 3.57% | 0.002 |
| Alcohol disorder | 4.30% | 2.38% | 0.567 | 1.43% | 4.76% | 0.057 |
| Utilization | ||||||
| Hospitalized | 82.51% | 85.71% | 0.545 | 46.73% | 100% | <0.001 |
| Hospitalizations | 1 [4]a | 3 [4]a | <0.001 | 0 [2]a | 5 [2]a | <0.001 |
Course of New High Utilizers
Patients who were high utilizers in 2005 but not in 2004 were identified, and their hospital utilization from 2005 to 2007 was plotted (Fig. 2). The results are shown in Figure 1. Fifty‐five of the original 91 (60.44%) new high utilizers moderated in the following year, and 6.59% were known to have died in the hospital. Of the surviving 30 (32.97%) who did not moderate in the second year, 19 (65.3%) continued the high‐utilizing pattern into the third year, while 9 (16.36%) of those who moderated in year 2 returned to the high‐utilizing pattern in year 3. During this 3‐year period, 10 members (10.99%) of the initial group died in the hospital.
Diagnostic Patterns in Continued and Moderated First‐Year High Utilizers
The diagnoses of patients who were high utilizers in 2005 and not 2004 were examined for differences between those who moderated in 2006 (moderating group) and those who continued the high‐utilizing pattern (persistent group, Table 3). There were no differences in any measures examined in 2004. In 2005, the initial year of high utilization, the groups differed only on the prevalence of new diagnoses of alcohol use disorders (95% CI for odds ratio incalculable due to zero prevalence in moderating group), and slightly in number of hospitalizations (median 5 vs 5.5). Over ensuing years, the persistent group was more likely to have new discharge diagnoses of septicemia (OR 5.88, 95% CI, 1.40 to 24.7) and mood disorders (OR not calculated due to zero prevalence in the moderating group).
| Course of 2005 1st Year High Utilizers | |||||||||
|---|---|---|---|---|---|---|---|---|---|
| Prior Year (2004) | First Year (2005) | Subsequent Years (20062007) | |||||||
| Moderating | Persistent | P | Moderating | Persistent | P | Moderating | Persistent | P | |
| N = 61 | N = 30 | ||||||||
| |||||||||
| Demographics | |||||||||
| Age | 30 [22]a | 25 [29.5]a | .682 | ||||||
| Female | 63.93% | 66.67% | .982 | ||||||
| New complications | |||||||||
| Acute chest syndrome | 8.2% | 6.67% | .872 | 21.31% | 33.33% | .325 | 4.92% | 13.33% | .318 |
| Aseptic necrosis | 6.56% | 13.33% | .978 | 11.48% | 10.00% | .885 | 8.20% | 13.33% | .691 |
| Renal disease | 0.00% | 0.00% | 11.48% | 10.00% | .885 | 3.28% | 10.00% | .405 | |
| New comorbidities | |||||||||
| Septicemia | 4.92% | 0.00% | .541 | 9.84% | 3.33% | .500 | 4.92% | 23.33% | .022 |
| Pneumonia | 1.64% | 0.00% | .716 | 4.92% | 0.00% | .541 | 0.00% | 6.67% | .201 |
| HIV | 0.00% | 0.00% | 1.64% | 0.00% | .716 | 0.00% | 0.00% | ||
| Pulmonary embolus | 0.00% | 3.33% | .541 | 11.48% | 3.33% | .370 | 4.92% | 3.33% | .844 |
| Diabetes mellitus | 3.28% | 3.33% | .844 | 9.84% | 6.67% | .914 | 0.00% | 3.33% | .716 |
| Mood disorder | 3.28% | 6.67% | .541 | 1.64% | 10.00% | .199 | 0.00% | 13.33% | .018 |
| Cocaine disorder | 3.28% | 3.33% | .622 | 1.64% | 10.00% | .199 | 0.00% | 6.67% | .201 |
| Alcohol disorder | 0.00% | 0.00% | 0.00% | 16.67% | .005 | 1.64% | 6.67% | .523 | |
| Utilization | |||||||||
| Hospitalized | 77.05% | 73.33% | .898 | 100% | 100% | 73.77% | 100% | .005 | |
| Hospitalizations | 1 [2]a | 1.5 [2.5]a | .924 | 5 [2]a | 5.5 [4]a | .022 | 2 [4]a | 11 [11.75]a | <.001 |
Assessment of Effects of Age Selection
In order to assess the effects of restricting the sample to patients with a known age <13, post‐hoc analyses were performed without this restriction. In general, results were in line with findings from the planned analysis.
Using these less stringent criteria, prior to the onset of their first year of high utilization, FY2007 high utilizers (n = 142) were more likely to be female (63.0% vs 52.5%, P = 0.019) than never high utilizers (n = 2173), and also had more chronic kidney disease (7.75% vs 1.29%, P < 0.001), mood disorders (4.93% vs 0.83%, P < 0.001), and prior hospitalizations (median 3 vs 2, P < 0.001).
New 2005 high utilizers who persisted after 2005 (n = 75) were more likely to be diagnosed with alcohol disorders in 2005 (8% vs 0%, P = 0.004) and had slightly more hospitalizations (median 5 for both groups, but with a greater spread for the continuous group, P = 0.003) in 2005 than those who moderated (n = 131). After 2005, the continuous group were more likely to have new diagnoses of acute chest syndrome (5.34% vs 14.67%, P = 0.043), aseptic necrosis (4.58% vs 14.67%, P = 0.023), septicemia (3.82% vs 21.33%, P < 0.001), and mood disorders (0.00% vs 9.33%, P = 0.002).
Discussion
Replication of the Moderating Course of High Utilization
This study replicates, with substantial sample size, the finding that high inpatient utilization in patients with SCD tends to moderate relatively quickly. As the present report used a statewide data set of patients not selected for payer type, it mitigates prior concerns that selection by insurance status, disenrollment, and mortality biased previous findings using payer data sets. Thus, the moderating course of the typical high‐utilizing SCD patient now seems well‐established.
The fact that those new high utilizers who did not moderate stabilized at a new, higher level of utilization suggests that interventional studies of high utilizers in SCD may best target a more extreme population, either in terms of multi‐year persistence or an accelerating course of utilization. However, this subgroup will be rare.
Prediction of Onset and Course of New High Utilizers
This is the first study to the authors' knowledge to address the question of whether the onset and course of a period of high utilization can be reliably predicted. The results were mixed. High utilizers appeared to be more ill and complex than comparison patients over a wide range of measures, and new high utilizers were diagnosed with more complications prior to and during an index period of high utilization than comparison patients. Chronic complications appeared to lead a period of new high utilization, and more acute complications occurred in the same year. However, while complications were more prevalent in new high utilizers, the differences were not of sufficient magnitude to be reliably predictive. Even the most common SCD complication noted, acute chest syndrome, occurred as a new diagnosis in less than 20% of the new high utilizers in the initial year of high utilization. Thus, paradoxically, while high utilizers appeared more ill, no particular pattern of illness was strongly predictive of high utilization.
Persistent high utilization, rather than the more usual transient course, seemed more closely related to new substance use and mood disorder diagnoses than to complications of sickle cell disease. Persistent high utilizers had a greater prevalence of new diagnoses of mood disorders than moderating high utilizers in every time period examined, emerging as statistically significant after the first year of high utilization. The difference in new diagnoses of alcohol disorders was statistically significant in the initial period of high utilization, but was also present in the other time periods. Cocaine use disorders showed a similar pattern, though they were more rare and did not rise to the level of statistical significance.
The one SCD complication associated with persistent high utilization was septicemia. It is tempting to speculate that this could be as much cause as consequence of high utilization, given the exposures of frequently hospitalized patients to invasive procedures and nosocomial infection.
There was an intriguing regularity of associations of high utilization with mood disorders. This was most clear in differentiating persistent from moderating high utilizers, but was present as a theme in the results throughout. High utilizers were much more likely to be diagnosed with a mood disorder, and both first year high utilizers and persistent high utilizers were distinguished by a higher prevalence of new mood disorder diagnoses. Patients who were persistent high utilizers after an initial high utilization period in 2005 had a cumulative prevalence of hospital‐diagnosed mood disorder approximating 30% by 2007. These differences could be due to a number of factors, including increased surveillance in high utilizers, pain and chronic illness causing mood disturbance, or mood disorders influencing the underlying disease process.
Implications
High utilization in this and other studies is closely related to evidence of more severe sickle cell disease.3, 8, 9, 17 This fact, and the apparent difficulty of predicting the onset and course of high utilization, suggest that the primary intervention to moderate high utilization is to prevent such acute complications as acute chest syndrome in the more seriously affected. While the advent of hydroxyurea produced new hope that clinicians could reduce disruptive and dangerous hospitalizations for SCD patients,18 so far there is little evidence that this has occurred.14 Particularly concerning is evidence that only a minority of patients for whom hydroxyurea is indicated are being prescribed the medication.14, 19 Given the individual and public benefits of reduced morbidity and cost, interventions to reduce barriers to physician prescribing and patient adherence are urgently needed, and this is one of the most important issues in the clinical care of SCD today.
The study also points out the continuing question of the role of psychiatric problems in the high‐utilizing SCD patient. While depression, anxiety, and addiction are frequently used as clinical explanations for high utilization in SCD patients, the research literature has stalled at reporting associations between measures of psychological distress and worsened outcome, with inconsistent results depending on methods and populations chosen. Generally, depression has been defined categorically by threshold cutoffs in screening instruments.2023 Whether the term depression should refer to major depressive disorder as defined in the standard psychiatric diagnostic system, or as a broader entity including less severe symptoms or milder disorders, is only rarely addressed.20 This method probably produces a high false‐positive rate relative to the provisional gold standard of diagnosisexpert, diagnostic, semi‐structured interviews.21, 22
However, within the limitations of current methods, certain themes have emerged. Depression, as currently defined, appears highly prevalent among SCD patients.20, 21, 23, 24 It is clearly and consistently associated with worsened pain.20, 21, 25, 26 It also predicts greater opioid use, dramatically reduced quality of life, and reduced relief from opioids.20, 27 Findings on utilization are mixed, however. In some studies, depression has been associated with greater utilization.23, 28 However, in the longitudinal Pain in Sickle Cell Epidemiology Study (PiSCES) study, depression was not associated with utilization when other relevant characteristics were controlled.20 In general, depression appears to lose predictive power as more clinical variables are entered into the model; however, a number of the clinical variables associated with utilization also are related to depression. Whether depression may have a causal role through multiple pathways is not yet settled.
Another matter, frequently discussed but currently unsettled, is the role of addiction in utilization behavior in SCD. Whereas patients with SCD are heavily scrutinized for addiction, and the clinical problem of aberrant opioid use behavior is often discussed for this population, research literature gives little guidance as to the true prevalence and management of such comorbidities. It is well known that substance use disorders are interconnected, such that presence of one elevates risk for others; thus, one would expect more common substance use disorders to act as epidemiologic sentinels for the less. The study of alcohol use disorders, in particular, could be an excellent candidate for developing hypotheses about substance use disorders in this populationdivorced from differentiating problematic pain management behavior from purely drug‐reinforced behavior. In the present study, alcohol use disorders appeared associated with persistent high utilization; however, in other well‐designed longitudinal studies alcohol abuse was related to lower utilization. The meaning of these divergent findings is unclear for the moment.
Despite frequent clinical attention to psychiatric problems in SCD, well‐designed longitudinal studies to clarify causal relations are lacking. Such studies will require reasonable sample sizes, the use of expert structured interviews for diagnostic confirmation, and care taken to address the level of independence of the depressive syndrome from consequences of the underlying illness. The latter will be methodologically difficult. It may require detailed assessment of the course of the depressive syndrome relative to that of the hematologic disorder, assessment of background familial risk for mood disorder, and the effects of subclinical ischemic neurological insults. Despite the challenges, if this work is not done clinicians will be left with tantalizing associations but no solid evidence to guide treatment, and the confusion surrounding the role of psychiatric illness in SCD will remain. Meanwhile,, it seems prudent to have a low threshold to screen for psychiatric disorder and to obtain psychiatric consultations relatively early, where appropriate, for patients whose hospital utilization appears to be accelerating.
Strengths and Weaknesses
Higher hospital utilization provided greater opportunity for diagnosis, so some detection bias in these results should be assumed. Diagnoses are extracted from hospital discharge records using ICD codes. There are opportunities for a number of errors in reporting and coding these diagnoses, and this is likely to be particularly true of conditions that are not the primary clinical focus of the hospitalization. However, all patients had at least 1 hospital admission, and the diagnostic differences are not far outside of expectation. The study also required at least one hospitalization for crisis for inclusion to guard against bias from patients with more mild disease. As such, the conservatively‐defined comparison group may not be a perfect representation of low utilizers, and some relationships may be blunted relative to findings from a broader population.
The study also had a number of strengths, particularly related to the large number of patients who could be tracked using these methods. Given the rarity of sickle cell disease, and the rarity of high‐utilizing patients in the SCD population, such methods as these are the most practical means of developing hypotheses as to the causes and course of high utilization. It is reassuring that the age selection criterion did not significantly alter results; in fact, post hoc analyses that were more inclusive of the high‐utilizing population generally reinforced results of the more stringent analysis.
Extremes of hospital utilization by patients with sickle cell disease (SCD) are problematic for patients, clinicians, and policymakers.110 Although patients manage their pain at home most of the time, even acute crises,11 a small minority of SCD patients accounts for a remarkable amount of hospital resource utilization.1, 3, 4, 6, 1114 Where it is quite unusual for a patient with SCD to be hospitalized more than twice per year,1, 11 in prior work with payer datasets our group identified some patients who were hospitalized more frequently than once per month. In rare cases, admission rates exceeding once per week were identified.1 High‐utilizing SCD patients, and particularly the very high‐utilizing subset, account for the majority of costs of care for the population.13, 14
In previous work by our group describing hospital utilization among members of a regional Medicaid MCO, results suggested that high utilization was a relatively transient phenomenon for most patients, likely resulting from short‐term increases in hospitalization rates among previously moderate utilizers.1 However, high‐utilizing members whose inpatient admission rate did not quickly moderate were progressively less likely to resume a more typical utilization pattern.
The present study used the State Inpatient Databases for years 2004 to 2007 from the Agency for Healthcare Research and Quality to replicate prior findings and to investigate questions not addressed in our prior work. Specifically, hospital discharge data from all hospitals in the state of California were examined to identify first‐year adolescent and adult high utilizers and to follow their hospital utilization over time. The objectives of the study were as follows:
To identify historical predictors of a period of high utilization by comparing diagnoses between 20042006 in patients who were new high utilizers in 2007 with those who were never high utilizers.
To identify predictors of a persistent rather than moderating course by following patients who were new high utilizers in 2005 over the succeeding 2 years.
To replicate prior findings on the course of high hospital utilization.
Patients and Methods
Initial Data Source
The State Inpatient Databases (SID) are provided by the Healthcare Cost and Utilization Project, sponsored by the Agency for Healthcare Research and Quality. They contain patient‐level discharge data from all hospitals in participating states. This study presents SID data from California for the years 2004 through 2007, including a total of 34,363 hospital admissions in which a diagnosis of sickle cell disease was recorded. Encrypted patient identifiers were used to identify individual patients, and there are few missing identifiers in the California dataset for these years. The data set includes up to 25 discharge diagnostic codes using ICD‐9 nomenclature. In addition, each patient's age and gender are recorded.
Categorization Based on Diagnosis and Inpatient Utilization
Management of missing or conflicting information
A minority of hospitalization records contained ambiguous demographic information (such as conflicting or missing gender or age) associated with the same patient identifier. Identical identifiers were assumed to represent the same patient for purposes of this study, even if other information was conflicting. This decision avoided overly conservative utilization estimates, as high utilizers would have correspondingly more missing information and data entry errors that could lead the same patient to be identified as multiple others with lower utilization. An examination of admissions with conflicting measures supported this method, in that most conflicts were due to missing entries in otherwise consistent data or were very likely typographical. If inconsistencies were due only to missing information for some hospitalizations, the non‐missing values were accepted. In cases where there was actual inconsistency, the following methods were employed.
For dichotomous information, such as gender, conflicts were recoded as missing. Ages recorded in each hospitalization were standardized to ages as of 2004 by subtracting the difference between the year of admission and 2004. If the spread of ages associated with a given patient identification number was greater than 3 years (missing values excluded), the age was coded as missing (note that age at hospitalization could differ by 1 year depending on the temporal relation of hospitalization to the date of birth). If the discrepancy was less, the minimum recorded age was accepted.
Construction of the Study Subset
The study data set was constructed as follows (Fig. 1):
Patient identifiers associated with a diagnosis of sickle cell disease were selected by identifying admissions with ICD‐9 diagnosis codes for sickle cell disease appearing in the first 10 diagnoses for calendar years 2004 to 2007 (these included ICD‐9 codes 282.60 to 282.64, 282.68, 282.69, 282.41, and 282.42). Of this group, patients who had a record of at least 1 admission for sickle cell crisis were identified. An admission for crisis was operationalized as a hospitalization with 1 discharge diagnosis coded as 282.42, 282.62, 282.64, or 282.69. This yielded a data set of 34,363 admissions among 3169 patients.
Admissions with missing patient identification numbers were excluded (n = 2365 of 34,363 admissions, 6.88%).
Hospitalizations were tabulated for each unique patient identifier.
Patients with a known age of 13 years or more in 2004 were selected. There were 481 patients excluded due to age below 13 years, and 814 excluded for having an uncertain age. The final sample consisted of 1874 unique patient identifiers representing 10,704 hospital admissions.
As patients who were hospitalized more often were more likely to have inconsistent data, the exclusion for unknown and inconsistent age likely biased the findings by excluding more frequently hospitalized patients. Further post‐hoc analyses were conducted to gauge the extent of this bias, reported in Results, below.
Categorization by Utilization
For each patient, inpatient hospital admissions were tabulated for each year. A year of high utilization for a patient was defined as any calendar year in which that patient had 4 or more hospital admissions. In prior well‐designed studies, categorical definitions of high utilization have used cutoffs between 3 and 5 hospitalizations per year.13, 14 In our group's experience, the cutoff around 4 admissions per year identifies a subpopulation in the top 10% to 20% for annual hospital utilization, both in the outpatient clinic and in payer populations with which our center interacts. A patient was included in the high utilizer group if he or she was a high utilizer in at least 1 year of the study period; all other patients were placed in the comparison group. There were 479 patients in the high utilizer group (25.6% of the total sample) and 1395 in the comparison group. To predict onset of a period of high utilization, patients whose first year of high utilization was 2007 (n = 84) were compared with patients who were never high utilizers (n = 1395). In the prospective analysis to predict moderation, patients who were new high utilizers in 2005 (n = 206) were divided into the group who had fewer than 4 admissions in the following year (moderating course, n = 131) and those who had more than 4 admissions in the following year (continuous course, n = 75).
Operationalization of Diagnoses of Comorbid Conditions and Complications
Discharge diagnoses were parsed by a computer algorithm for diagnostic codes matching selected diagnoses. If the diagnosis was found at least once, the patient was coded as having the diagnosis. Diagnostic codes (ICD‐9‐CM) included the following: HIV: 042.__; septicemia: 038.__; pneumonia: 482.00 to 486.99; pulmonary embolus: 415.11,12 and 415.19; acute chest syndrome: 517.3_; chronic renal disease: 585.__; diabetes mellitus: 250.__; cocaine dependence: 304.2_; cocaine abuse: 305.6_; alcohol dependence: 303.00 to 303.92; alcohol abuse: 305.0_; mood disorders (including depressive and bipolar disorders): 296.00 to 296.89; and aseptic necrosis of bone: 733.4_. Substance dependence and abuse were aggregated to create alcohol use disorder and cocaine use disorder categories. Opiate use disorders were not included, as the clinical experience of the authors suggested that clinicians may sometimes diagnose opiate dependence on the basis of frequent hospitalization in itself, and it seemed prudent to avoid the confound.
Statistical Analyses
All statistical and graphical analyses were performed in the R statistical computing environment.15 Intergroup differences in categorical data were analyzed using the chi‐square test for independence. The sample distributions of many measures were highly skewed, and nonparametric methods were used where practical. In general, the median and interquartile range are reported as measures of central tendency and spread, respectively. Comparisons between groups on continuous measures were done using the Mann‐Whitney‐Wilcoxon test.
Institutional Review Board Approval
The study was exempt from institutional review board review, due to the nature of the data set and its noninterventional design.
Results
Comparison of Utilization Groups by Demographics and Diagnosis
Table 1 presents direct comparisons of high utilizers with comparison patients. Patients in the high utilizer group were slightly more likely to be female and had a higher prevalence of all diagnoses examined, with the exception of HIV (where prevalence was quite low). At least 1 discharge diagnosis of acute chest syndrome was common in both groups, but was more than twice as prevalent in high utilizers. Diagnoses of aseptic necrosis of bone and septicemia were much greater in the high utilizer group than among comparison subjects.
| Comparison N = 1395 | High Utilizers N = 479 | P | |
|---|---|---|---|
| |||
| Demographics | |||
| Age | 32 [21]b | 29 [19]b | <0.001 |
| Femalea | 55.28% | 66.46% | <0.001 |
| Complications | |||
| Acute chest syndrome | 15.63% | 40.29% | <0.001 |
| Aseptic necrosis | 9.18% | 30.90% | <0.001 |
| Renal disease | 4.01% | 11.48% | <0.001 |
| Comorbidities | |||
| Septicemia | 7.03% | 31.52% | <0.001 |
| Pneumonia | 2.51% | 8.14% | <0.001 |
| HIV | 0.57% | 1.04% | 0.453 |
| Pulmonary embolus | 2.51% | 10.02% | <0.001 |
| Diabetes | 6.38% | 13.57% | <0.001 |
| Mood disorder | 1.72% | 11.69% | <0.001 |
| Cocaine disorder | 1.00% | 9.60% | <0.001 |
| Alcohol disorder | 2.87% | 8.56% | <0.001 |
| Utilization | |||
| Hospitalizations | 2 [2]b | 11 [12]b | <0.001 |
Prior History of New High Utilizers
Patients who were first high utilizers in 2007 (FY2007) were compared with patients who were never high utilizers on hospital diagnoses made before 2007 to identify predictors of a new‐onset period of high utilization (Table 2). The FY2007 high utilizers did not differ significantly in demographics from nonhigh utilizers. The FY2007 high utilizers had a greater prevalence of discharge diagnoses of aseptic necrosis of bone (OR 2.03, 95% CI, 1.07 to 3.85) and renal disease (OR 6.28, 95% CI, 2.72 to 14.5) prior to the onset of high utilization. FY2007 high utilizers also had a greater number of hospitalizations prior to their initial year of high utilization (median 3 vs 1); however, a similar proportion of FY2007 and never high utilizers had been hospitalized at least once before 2007. In 2007, the first‐year 2007 high utilizers had a markedly greater prevalence of hospital diagnoses of acute chest syndrome (OR 4.67, 95% CI, 2.53 to 8.63) and septicemia (OR 8.26, 95% CI, 3.91 to 17.4). Other diagnoses, expressed as OR and 95% confidence intervals, included aseptic necrosis of bone 4.80 (1.89 to 12.2), pneumonia 17.6 (4.99 to 62.0), pulmonary embolus 5.70 (1.52 to 21.5), mood disorder 11.0 (3.51 to 34.3), and cocaine disorder 10.3 (2.42 to 43.8), Table 2). However, only a minority of nonhigh utilizers were hospitalized at all that year.
| Prior to 2007 | In 2007 | |||||
|---|---|---|---|---|---|---|
| Never | New High Utilizers in 2007 | P | Never | New High Utilizers in 2007 | P | |
| N = 1395 | N = 84 | |||||
| ||||||
| Demographics | ||||||
| Age | 32 [20]a | 30 [20]a | 0.116 | |||
| Female | 55.28% | 65.06% | 0.103 | |||
| New complications | ||||||
| Acute chest syndrome | 11.18% | 15.48% | 0.306 | 4.44% | 17.86% | <0.001 |
| Aseptic necrosis | 7.60% | 14.29% | 0.047 | 1.58% | 7.14% | 0.001 |
| Renal disease | 1.65% | 9.52% | <0.001 | 2.37% | 3.57% | 0.740 |
| New comorbidities | ||||||
| Septicemia | 5.23% | 5.95% | 0.972 | 1.79% | 13.10% | <0.001 |
| Pneumonia | 2.15% | 0.00% | 0.337 | 0.36% | 5.95% | <0.001 |
| HIV | 0.57% | 0.00% | 0.944 | 0 | 0 | |
| Pulmonary embolus | 1.86% | 2.38% | 0.941 | 0.65% | 3.57% | 0.023 |
| Diabetes mellitus | 4.52% | 4.76% | 0.869 | 1.86% | 4.76% | 0.152 |
| Mood disorder | 1.15% | 3.57% | 0.156 | 0.57% | 5.95% | <0.001 |
| Cocaine disorder | 0.65% | 1.19% | 0.926 | 0.36% | 3.57% | 0.002 |
| Alcohol disorder | 4.30% | 2.38% | 0.567 | 1.43% | 4.76% | 0.057 |
| Utilization | ||||||
| Hospitalized | 82.51% | 85.71% | 0.545 | 46.73% | 100% | <0.001 |
| Hospitalizations | 1 [4]a | 3 [4]a | <0.001 | 0 [2]a | 5 [2]a | <0.001 |
Course of New High Utilizers
Patients who were high utilizers in 2005 but not in 2004 were identified, and their hospital utilization from 2005 to 2007 was plotted (Fig. 2). The results are shown in Figure 1. Fifty‐five of the original 91 (60.44%) new high utilizers moderated in the following year, and 6.59% were known to have died in the hospital. Of the surviving 30 (32.97%) who did not moderate in the second year, 19 (65.3%) continued the high‐utilizing pattern into the third year, while 9 (16.36%) of those who moderated in year 2 returned to the high‐utilizing pattern in year 3. During this 3‐year period, 10 members (10.99%) of the initial group died in the hospital.
Diagnostic Patterns in Continued and Moderated First‐Year High Utilizers
The diagnoses of patients who were high utilizers in 2005 and not 2004 were examined for differences between those who moderated in 2006 (moderating group) and those who continued the high‐utilizing pattern (persistent group, Table 3). There were no differences in any measures examined in 2004. In 2005, the initial year of high utilization, the groups differed only on the prevalence of new diagnoses of alcohol use disorders (95% CI for odds ratio incalculable due to zero prevalence in moderating group), and slightly in number of hospitalizations (median 5 vs 5.5). Over ensuing years, the persistent group was more likely to have new discharge diagnoses of septicemia (OR 5.88, 95% CI, 1.40 to 24.7) and mood disorders (OR not calculated due to zero prevalence in the moderating group).
| Course of 2005 1st Year High Utilizers | |||||||||
|---|---|---|---|---|---|---|---|---|---|
| Prior Year (2004) | First Year (2005) | Subsequent Years (20062007) | |||||||
| Moderating | Persistent | P | Moderating | Persistent | P | Moderating | Persistent | P | |
| N = 61 | N = 30 | ||||||||
| |||||||||
| Demographics | |||||||||
| Age | 30 [22]a | 25 [29.5]a | .682 | ||||||
| Female | 63.93% | 66.67% | .982 | ||||||
| New complications | |||||||||
| Acute chest syndrome | 8.2% | 6.67% | .872 | 21.31% | 33.33% | .325 | 4.92% | 13.33% | .318 |
| Aseptic necrosis | 6.56% | 13.33% | .978 | 11.48% | 10.00% | .885 | 8.20% | 13.33% | .691 |
| Renal disease | 0.00% | 0.00% | 11.48% | 10.00% | .885 | 3.28% | 10.00% | .405 | |
| New comorbidities | |||||||||
| Septicemia | 4.92% | 0.00% | .541 | 9.84% | 3.33% | .500 | 4.92% | 23.33% | .022 |
| Pneumonia | 1.64% | 0.00% | .716 | 4.92% | 0.00% | .541 | 0.00% | 6.67% | .201 |
| HIV | 0.00% | 0.00% | 1.64% | 0.00% | .716 | 0.00% | 0.00% | ||
| Pulmonary embolus | 0.00% | 3.33% | .541 | 11.48% | 3.33% | .370 | 4.92% | 3.33% | .844 |
| Diabetes mellitus | 3.28% | 3.33% | .844 | 9.84% | 6.67% | .914 | 0.00% | 3.33% | .716 |
| Mood disorder | 3.28% | 6.67% | .541 | 1.64% | 10.00% | .199 | 0.00% | 13.33% | .018 |
| Cocaine disorder | 3.28% | 3.33% | .622 | 1.64% | 10.00% | .199 | 0.00% | 6.67% | .201 |
| Alcohol disorder | 0.00% | 0.00% | 0.00% | 16.67% | .005 | 1.64% | 6.67% | .523 | |
| Utilization | |||||||||
| Hospitalized | 77.05% | 73.33% | .898 | 100% | 100% | 73.77% | 100% | .005 | |
| Hospitalizations | 1 [2]a | 1.5 [2.5]a | .924 | 5 [2]a | 5.5 [4]a | .022 | 2 [4]a | 11 [11.75]a | <.001 |
Assessment of Effects of Age Selection
In order to assess the effects of restricting the sample to patients with a known age <13, post‐hoc analyses were performed without this restriction. In general, results were in line with findings from the planned analysis.
Using these less stringent criteria, prior to the onset of their first year of high utilization, FY2007 high utilizers (n = 142) were more likely to be female (63.0% vs 52.5%, P = 0.019) than never high utilizers (n = 2173), and also had more chronic kidney disease (7.75% vs 1.29%, P < 0.001), mood disorders (4.93% vs 0.83%, P < 0.001), and prior hospitalizations (median 3 vs 2, P < 0.001).
New 2005 high utilizers who persisted after 2005 (n = 75) were more likely to be diagnosed with alcohol disorders in 2005 (8% vs 0%, P = 0.004) and had slightly more hospitalizations (median 5 for both groups, but with a greater spread for the continuous group, P = 0.003) in 2005 than those who moderated (n = 131). After 2005, the continuous group were more likely to have new diagnoses of acute chest syndrome (5.34% vs 14.67%, P = 0.043), aseptic necrosis (4.58% vs 14.67%, P = 0.023), septicemia (3.82% vs 21.33%, P < 0.001), and mood disorders (0.00% vs 9.33%, P = 0.002).
Discussion
Replication of the Moderating Course of High Utilization
This study replicates, with substantial sample size, the finding that high inpatient utilization in patients with SCD tends to moderate relatively quickly. As the present report used a statewide data set of patients not selected for payer type, it mitigates prior concerns that selection by insurance status, disenrollment, and mortality biased previous findings using payer data sets. Thus, the moderating course of the typical high‐utilizing SCD patient now seems well‐established.
The fact that those new high utilizers who did not moderate stabilized at a new, higher level of utilization suggests that interventional studies of high utilizers in SCD may best target a more extreme population, either in terms of multi‐year persistence or an accelerating course of utilization. However, this subgroup will be rare.
Prediction of Onset and Course of New High Utilizers
This is the first study to the authors' knowledge to address the question of whether the onset and course of a period of high utilization can be reliably predicted. The results were mixed. High utilizers appeared to be more ill and complex than comparison patients over a wide range of measures, and new high utilizers were diagnosed with more complications prior to and during an index period of high utilization than comparison patients. Chronic complications appeared to lead a period of new high utilization, and more acute complications occurred in the same year. However, while complications were more prevalent in new high utilizers, the differences were not of sufficient magnitude to be reliably predictive. Even the most common SCD complication noted, acute chest syndrome, occurred as a new diagnosis in less than 20% of the new high utilizers in the initial year of high utilization. Thus, paradoxically, while high utilizers appeared more ill, no particular pattern of illness was strongly predictive of high utilization.
Persistent high utilization, rather than the more usual transient course, seemed more closely related to new substance use and mood disorder diagnoses than to complications of sickle cell disease. Persistent high utilizers had a greater prevalence of new diagnoses of mood disorders than moderating high utilizers in every time period examined, emerging as statistically significant after the first year of high utilization. The difference in new diagnoses of alcohol disorders was statistically significant in the initial period of high utilization, but was also present in the other time periods. Cocaine use disorders showed a similar pattern, though they were more rare and did not rise to the level of statistical significance.
The one SCD complication associated with persistent high utilization was septicemia. It is tempting to speculate that this could be as much cause as consequence of high utilization, given the exposures of frequently hospitalized patients to invasive procedures and nosocomial infection.
There was an intriguing regularity of associations of high utilization with mood disorders. This was most clear in differentiating persistent from moderating high utilizers, but was present as a theme in the results throughout. High utilizers were much more likely to be diagnosed with a mood disorder, and both first year high utilizers and persistent high utilizers were distinguished by a higher prevalence of new mood disorder diagnoses. Patients who were persistent high utilizers after an initial high utilization period in 2005 had a cumulative prevalence of hospital‐diagnosed mood disorder approximating 30% by 2007. These differences could be due to a number of factors, including increased surveillance in high utilizers, pain and chronic illness causing mood disturbance, or mood disorders influencing the underlying disease process.
Implications
High utilization in this and other studies is closely related to evidence of more severe sickle cell disease.3, 8, 9, 17 This fact, and the apparent difficulty of predicting the onset and course of high utilization, suggest that the primary intervention to moderate high utilization is to prevent such acute complications as acute chest syndrome in the more seriously affected. While the advent of hydroxyurea produced new hope that clinicians could reduce disruptive and dangerous hospitalizations for SCD patients,18 so far there is little evidence that this has occurred.14 Particularly concerning is evidence that only a minority of patients for whom hydroxyurea is indicated are being prescribed the medication.14, 19 Given the individual and public benefits of reduced morbidity and cost, interventions to reduce barriers to physician prescribing and patient adherence are urgently needed, and this is one of the most important issues in the clinical care of SCD today.
The study also points out the continuing question of the role of psychiatric problems in the high‐utilizing SCD patient. While depression, anxiety, and addiction are frequently used as clinical explanations for high utilization in SCD patients, the research literature has stalled at reporting associations between measures of psychological distress and worsened outcome, with inconsistent results depending on methods and populations chosen. Generally, depression has been defined categorically by threshold cutoffs in screening instruments.2023 Whether the term depression should refer to major depressive disorder as defined in the standard psychiatric diagnostic system, or as a broader entity including less severe symptoms or milder disorders, is only rarely addressed.20 This method probably produces a high false‐positive rate relative to the provisional gold standard of diagnosisexpert, diagnostic, semi‐structured interviews.21, 22
However, within the limitations of current methods, certain themes have emerged. Depression, as currently defined, appears highly prevalent among SCD patients.20, 21, 23, 24 It is clearly and consistently associated with worsened pain.20, 21, 25, 26 It also predicts greater opioid use, dramatically reduced quality of life, and reduced relief from opioids.20, 27 Findings on utilization are mixed, however. In some studies, depression has been associated with greater utilization.23, 28 However, in the longitudinal Pain in Sickle Cell Epidemiology Study (PiSCES) study, depression was not associated with utilization when other relevant characteristics were controlled.20 In general, depression appears to lose predictive power as more clinical variables are entered into the model; however, a number of the clinical variables associated with utilization also are related to depression. Whether depression may have a causal role through multiple pathways is not yet settled.
Another matter, frequently discussed but currently unsettled, is the role of addiction in utilization behavior in SCD. Whereas patients with SCD are heavily scrutinized for addiction, and the clinical problem of aberrant opioid use behavior is often discussed for this population, research literature gives little guidance as to the true prevalence and management of such comorbidities. It is well known that substance use disorders are interconnected, such that presence of one elevates risk for others; thus, one would expect more common substance use disorders to act as epidemiologic sentinels for the less. The study of alcohol use disorders, in particular, could be an excellent candidate for developing hypotheses about substance use disorders in this populationdivorced from differentiating problematic pain management behavior from purely drug‐reinforced behavior. In the present study, alcohol use disorders appeared associated with persistent high utilization; however, in other well‐designed longitudinal studies alcohol abuse was related to lower utilization. The meaning of these divergent findings is unclear for the moment.
Despite frequent clinical attention to psychiatric problems in SCD, well‐designed longitudinal studies to clarify causal relations are lacking. Such studies will require reasonable sample sizes, the use of expert structured interviews for diagnostic confirmation, and care taken to address the level of independence of the depressive syndrome from consequences of the underlying illness. The latter will be methodologically difficult. It may require detailed assessment of the course of the depressive syndrome relative to that of the hematologic disorder, assessment of background familial risk for mood disorder, and the effects of subclinical ischemic neurological insults. Despite the challenges, if this work is not done clinicians will be left with tantalizing associations but no solid evidence to guide treatment, and the confusion surrounding the role of psychiatric illness in SCD will remain. Meanwhile,, it seems prudent to have a low threshold to screen for psychiatric disorder and to obtain psychiatric consultations relatively early, where appropriate, for patients whose hospital utilization appears to be accelerating.
Strengths and Weaknesses
Higher hospital utilization provided greater opportunity for diagnosis, so some detection bias in these results should be assumed. Diagnoses are extracted from hospital discharge records using ICD codes. There are opportunities for a number of errors in reporting and coding these diagnoses, and this is likely to be particularly true of conditions that are not the primary clinical focus of the hospitalization. However, all patients had at least 1 hospital admission, and the diagnostic differences are not far outside of expectation. The study also required at least one hospitalization for crisis for inclusion to guard against bias from patients with more mild disease. As such, the conservatively‐defined comparison group may not be a perfect representation of low utilizers, and some relationships may be blunted relative to findings from a broader population.
The study also had a number of strengths, particularly related to the large number of patients who could be tracked using these methods. Given the rarity of sickle cell disease, and the rarity of high‐utilizing patients in the SCD population, such methods as these are the most practical means of developing hypotheses as to the causes and course of high utilization. It is reassuring that the age selection criterion did not significantly alter results; in fact, post hoc analyses that were more inclusive of the high‐utilizing population generally reinforced results of the more stringent analysis.
- ,,,.The course and correlates of high hospital utilization in sickle cell disease: evidence from a large, urban Medicaid managed care organization.Am J Hematol.2009;84:666–670.
- ,,,,,,,.Health care provider attitudes toward patients with acute vaso‐occlusive crisis due to sickle cell disease: development of a scale.Patient Educ Couns.2009 Feb 20. [published online ahead of print]
- ,,,,,,,.Comparisons of high versus low emergency department utilizers in sickle cell disease.Ann Emerg Med.2009;53:587–593.
- ,.Healthcare Cost and Utilization Project Statistical Brief #21: Sickle Cell Disease Patients in U.S. Hospitals, 2004.Rockville, MD:Agency for Healthcare Research and Quality;2006.
- ,,.Physicians' attitude and practices in sickle cell disease pain management.J Palliat Care.2005;21:246–251.
- ,,,,,.Medical care utilization and mortality in sickle cell disease: a population‐based study.Am J Hematol.2005;80:262–270.
- ,,,,.Understanding the causes of problematic pain management in sickle cell disease: evidence that pseudoaddiction plays a more important role than genuine analgesic dependence.J Pain Symptom Manage.2004;27:156–169.
- ,,,.Frequent and prolonged hospitalizations: a risk factor for early mortality in sickle cell disease patients.Am J Hematol.2003;72:201–203.
- ,,.Hospital resource utilization among patients with sickle cell disease.J Health Care Poor Underserved.2003;14:122–135.
- ,,,,Nurses' attitudes and practices in sickle cell pain management.Appl Nurs Res.2001;14:187–192.
- ,,,,,,,,.Daily assessment of pain in adults with sickle cell disease.Ann Intern Med.2008;148:94–101.
- ,,,.A longitudinal examination predicting emergency room use in children with sickle cell disease and their caregivers.J Pediatr Psychol.200631:163–173.
- ,,,,.Utilization of the office, hospital and emergency department for adult sickle cell patients: a five‐year study.J Natl Med Assoc.2006;98:1109–1113.
- ,,,.Hospitalization rates and costs of care of patients with sickle‐cell anemia in the state of Maryland in the era of hydroxyurea.Am J Hematol.2006;81:927–932.
- The R Development Core Team. R:A Language and Environment for Statistical Computing.Vienna, Austria;2009.
- ,,.Physical and mental health in adults hospitalized with sickle cell disease: impact on resource use.J Natl Med Assoc.2009;101:139–144.
- ,,,,.Rural/urban differences in access to and utilization of services among people in Alabama with sickle cell disease.Public Health Rep.2003;118:27–36.
- ,,,,,,,.Effect of hydroxyurea on the frequency of painful crises in sickle cell anemia. Investigators of the multicenter study of hydroxyurea in sickle cell anemia.N Engl J Med.1995;332:1317–1322.
- ,,,.Provider barriers to hydroxyurea use in adults with sickle cell disease: a survey of the sickle cell disease adult provider network.J Natl Med Assoc.2008;100:968–973.
- ,,,,,,,,,.Depression and anxiety in adults with sickle cell disease: the PiSCES project.Psychosom Med.2008;70:192–196.
- ,,,,,,.Depression, disease severity, and sickle cell disease.J Behav Med.1999;22:115–126.
- ,,,.Depression and functioning in relation to health care use in sickle cell disease.Ann Behav Med.2000;22:149–157.
- ,.The role of depression in hospital admissions and emergency treatment of patients with sickle cell disease.J Natl Med Assoc.1991;83:777–781.
- ,.Depression and anxiety in patients with sickle cell disease: conceptual and methodological considerations.J Health Soc Policy.1994;5:39–53.
- ,,,,,,,,.Pain site frequency and location in sickle cell disease: the PiSCES project.Pain.2009;145:246–251.
- ,,,.Quality of life among adolescents with sickle cell disease: mediation of pain by internalizing symptoms and parenting stress.Health Qual Life Outcomes.2008;6:60.
- ,,,,,,,,.Understanding pain and improving management of sickle cell disease: the PiSCES study.J Natl Med Assoc.2005;97:183–193.
- ,,,,.Depression in sickle cell disease.J Natl Med Assoc.2003;95:533–537.
- ,,,.The course and correlates of high hospital utilization in sickle cell disease: evidence from a large, urban Medicaid managed care organization.Am J Hematol.2009;84:666–670.
- ,,,,,,,.Health care provider attitudes toward patients with acute vaso‐occlusive crisis due to sickle cell disease: development of a scale.Patient Educ Couns.2009 Feb 20. [published online ahead of print]
- ,,,,,,,.Comparisons of high versus low emergency department utilizers in sickle cell disease.Ann Emerg Med.2009;53:587–593.
- ,.Healthcare Cost and Utilization Project Statistical Brief #21: Sickle Cell Disease Patients in U.S. Hospitals, 2004.Rockville, MD:Agency for Healthcare Research and Quality;2006.
- ,,.Physicians' attitude and practices in sickle cell disease pain management.J Palliat Care.2005;21:246–251.
- ,,,,,.Medical care utilization and mortality in sickle cell disease: a population‐based study.Am J Hematol.2005;80:262–270.
- ,,,,.Understanding the causes of problematic pain management in sickle cell disease: evidence that pseudoaddiction plays a more important role than genuine analgesic dependence.J Pain Symptom Manage.2004;27:156–169.
- ,,,.Frequent and prolonged hospitalizations: a risk factor for early mortality in sickle cell disease patients.Am J Hematol.2003;72:201–203.
- ,,.Hospital resource utilization among patients with sickle cell disease.J Health Care Poor Underserved.2003;14:122–135.
- ,,,,Nurses' attitudes and practices in sickle cell pain management.Appl Nurs Res.2001;14:187–192.
- ,,,,,,,,.Daily assessment of pain in adults with sickle cell disease.Ann Intern Med.2008;148:94–101.
- ,,,.A longitudinal examination predicting emergency room use in children with sickle cell disease and their caregivers.J Pediatr Psychol.200631:163–173.
- ,,,,.Utilization of the office, hospital and emergency department for adult sickle cell patients: a five‐year study.J Natl Med Assoc.2006;98:1109–1113.
- ,,,.Hospitalization rates and costs of care of patients with sickle‐cell anemia in the state of Maryland in the era of hydroxyurea.Am J Hematol.2006;81:927–932.
- The R Development Core Team. R:A Language and Environment for Statistical Computing.Vienna, Austria;2009.
- ,,.Physical and mental health in adults hospitalized with sickle cell disease: impact on resource use.J Natl Med Assoc.2009;101:139–144.
- ,,,,.Rural/urban differences in access to and utilization of services among people in Alabama with sickle cell disease.Public Health Rep.2003;118:27–36.
- ,,,,,,,.Effect of hydroxyurea on the frequency of painful crises in sickle cell anemia. Investigators of the multicenter study of hydroxyurea in sickle cell anemia.N Engl J Med.1995;332:1317–1322.
- ,,,.Provider barriers to hydroxyurea use in adults with sickle cell disease: a survey of the sickle cell disease adult provider network.J Natl Med Assoc.2008;100:968–973.
- ,,,,,,,,,.Depression and anxiety in adults with sickle cell disease: the PiSCES project.Psychosom Med.2008;70:192–196.
- ,,,,,,.Depression, disease severity, and sickle cell disease.J Behav Med.1999;22:115–126.
- ,,,.Depression and functioning in relation to health care use in sickle cell disease.Ann Behav Med.2000;22:149–157.
- ,.The role of depression in hospital admissions and emergency treatment of patients with sickle cell disease.J Natl Med Assoc.1991;83:777–781.
- ,.Depression and anxiety in patients with sickle cell disease: conceptual and methodological considerations.J Health Soc Policy.1994;5:39–53.
- ,,,,,,,,.Pain site frequency and location in sickle cell disease: the PiSCES project.Pain.2009;145:246–251.
- ,,,.Quality of life among adolescents with sickle cell disease: mediation of pain by internalizing symptoms and parenting stress.Health Qual Life Outcomes.2008;6:60.
- ,,,,,,,,.Understanding pain and improving management of sickle cell disease: the PiSCES study.J Natl Med Assoc.2005;97:183–193.
- ,,,,.Depression in sickle cell disease.J Natl Med Assoc.2003;95:533–537.
Copyright © 2010 Society of Hospital Medicine
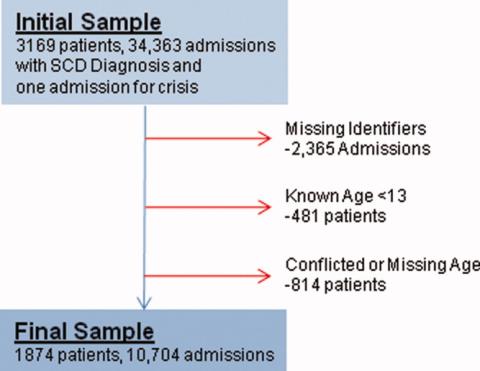
A Lifetime in the Making
A 66‐year‐old man presented to the emergency department with 3 weeks of progressive exertional dyspnea. He also reported a single episode of chest pain 1 day prior to admission.
Cardiac and pulmonary causes of dyspnea are the most common. Other causes include anemia or a neuromuscular process. Given the recent episode of chest pain, coronary ischemia, congestive heart failure, chronic obstructive pulmonary disease (COPD), pulmonary embolism, and pericardial effusion must be considered.
Up until 3 weeks ago, he had no exercise intolerance, and had been relatively active. He began noticing progressive dyspnea to the point where he had considerable difficulty walking up stairs, and performing minor household chores. He also complained of orthopnea and paroxysmal nocturnal dyspnea for the last 3 weeks.He denied chest pain at presentation, but 24 hours prior, he experienced one episode of sharp, left‐sided, nonradiating, nonpositional chest pain that occurred at rest. It lasted approximately 20 minutes and was not associated with diaphoresis, nausea, vomiting, or palpitations. He had never experienced chest discomfort prior to this episode. He denied fever, chills, cough, or wheezing.
Progressive dyspnea on exertion with associated orthopnea and paroxysmal nocturnal dyspnea is classically seen in patients with heart failure and is typically associated with left ventricular failure. However, paroxysmal nocturnal dyspnea and orthopnea are only moderately specific for heart failure. Orthopnea can also be seen in pericardial disease, and in numerous pulmonary diseases, including asthma, COPD, pulmonary hypertension, diaphragmatic weakness, pleural effusion, pulmonary embolism, and any apical lung process including lung cancer or pneumonia. Paroxysmal nocturnal dyspnea can be seen in many of the same disorders and can also be reported in obstructive sleep apnea.
His past medical history was remarkable for two episodes of syncope, occurring 5 and 3 years ago, both while working outside in warm weather. Neither was associated with chest pain, diaphoresis, palpitations, or post‐ictal symptoms. He was diagnosed with prostate cancer 8 years ago, and underwent 2 years of androgen‐deprivation therapy with goserelin along with local radiation therapy. Medications included subcutaneous goserelin every 3 months and daily omeprazole. He denied any other prescription, over‐the‐counter, or herbal medications. He reported a 50‐pack‐year history of smoking, but denied alcohol or illicit drug abuse. He denied any travel history or recent immobilization. He had no children, and there was no known history of heart disease in his family.
The past medical history of two episodes of likely exertional syncope is interesting, but the episodes were sporadic and in the distant past, arguing against a serious and ongoing process. Nonetheless, this history still raises the possibility of cardiac causes of syncope, especially causes such as hypertrophic obstructive cardiomyopathy or aortic stenosis which are classically associated with exertional syncope. Either of these two conditions can result in heart failure if untreated. The history of goserelin therapy does make the possibility of heart failure higher, as there has been an association reported between use of this drug and heart failure. His history of tobacco use is a risk factor for coronary artery disease (CAD) and COPD. An active cancer history is also a risk factor for thromboembolic disease, which remains a consideration.
On admission, his temperature was 36.9C, heart rate 94 bpm, respiratory rate 22 breaths per minute, blood pressure 200/108 mmHg, and oxygen saturation 93% breathing ambient air. He was a thin man in no acute distress. Cardiovascular examination was significant for normal first and second heart sounds, with a soft left‐sided S3; the point of maximal impulse was diffuse, but displaced laterally. His jugular venous pressure was estimated at 9 cm of H2O while positioned at a 45‐degree angle. Rales were heard at the lung bases bilaterally. Abdominal exam was normal. His lower extremities were without edema. There were no focal neurological deficits appreciated. Skin examination was unremarkable.
His combination of physical exam findings strongly suggests heart failure, most likely related to a dilated cardiomyopathy and left ventricular dysfunction. The presence of a left‐sided S3 and rales, and the lack of markedly elevated central venous pressure and peripheral edema, suggest heart failure predominantly due to left ventricular dysfunction. Of note, he is very hypertensive. This would not be the typical finding with severely decompensated heart failure. It would be important to determine whether his elevated blood pressure is due to an acute, reversible cause (e.g., pain, dyspnea, anxiety) or whether cocaine use, psychotropic agents, rare causes such as catecholamine‐producing tumors, other neuroendocrine tumors or thyroid toxic states are at play. In addition, one might see hypertension early in the course of heart failure, from a left ventricular outflow obstructive etiology such as severe aortic stenosis or hypertrophic obstructive cardiomyopathy.
Laboratory evaluation revealed a white blood cell count of 8900/mm3, with a normal differential; hemoglobin was 13.9 g/dL; platelet count was 264,000/mm3. Serum electrolytes and liver enzymes were unremarkable, with serum creatinine 1.1 mg/dL and blood urea nitrogen 7 mg/dL. Serial cardiac troponin‐I levels drawn 8 hours apart were 0.04, 0.07, 0.08, and 0.04 ng/mL (normal 0.04). Brain natriuretic peptide was 1420 pg/mL (normal 100). Thyroid stimulating hormone was 1.19 uIU/mL (normal 0.34‐5.60). Chest radiography revealed mild cardiomegaly, with peripheral interstitial opacities in the mid and lower lobes bilaterally, with fluid within the minor fissure. A 12‐lead electrocardiogram (ECG) revealed normal sinus rhythm at 95 bpm with left anterior fascicular block; intraventricular conduction delay was present (QRS width 106 ms) and QS complexes were present in V1‐V3. In addition, there was a left atrial abnormality and voltage criteria for left ventricular hypertrophy with secondary T‐wave inversions laterally (Figure 1). No previous ECGs were available for comparison. A chest computed tomography scan with contrast showed no evidence of pulmonary embolus. It did show interlobular septal thickening and small bilateral pleural effusions, consistent with left ventricular dysfunction.
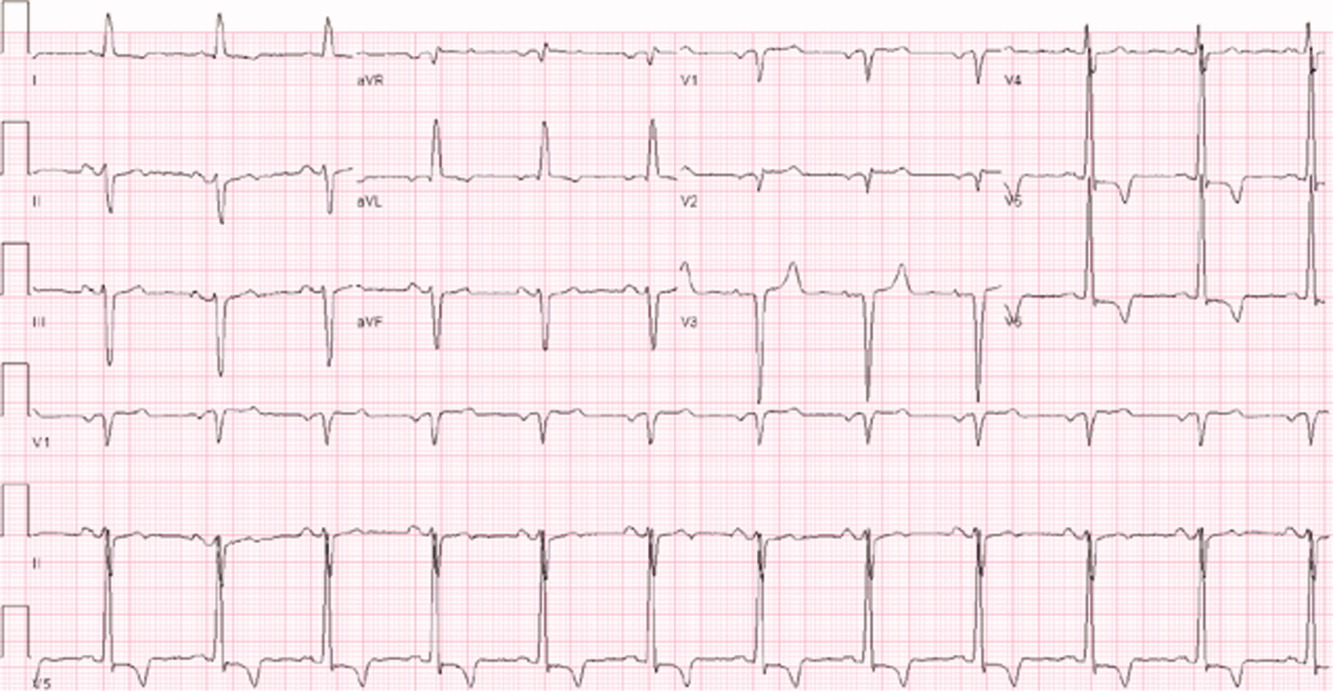
The patient's initial lab, imaging, and diagnostic work‐up continues to be consistent with the diagnosis of heart failure. The patient appears to have cardiomegaly and mild pulmonary edema by imaging. The etiology of heart failure remains unknown, but ischemia remains in the differential, given the mildly elevated troponins initially and the ECG findings of left anterior fascicular block and T‐wave inversions in the lateral leads. Left anterior fascicular block can be seen with ischemic heart disease (especially involving the left anterior descending coronary artery), hypertensive heart disease, valvular disease, and some infiltrative cardiac processes. The lateral T‐wave inversions are likely secondary to left ventricular hypertrophy (a so‐called strain pattern), rather than ischemia. Left ventricular hypertrophy is consistent with his hypertension, suggesting that it is chronic; his presentation may be due to hypertensive heart disease with new onset heart failure.
He was admitted to the hospital, and metoprolol, lisinopril, and intravenous furosemide were given. Transthoracic echocardiography demonstrated severe global hypokinesis with a left ventricular ejection fraction of 10%. There was no evidence of ventricular thrombus or valvular disease; however, prominent left ventricular trabeculation with deep recesses was noted (see Figure 2).
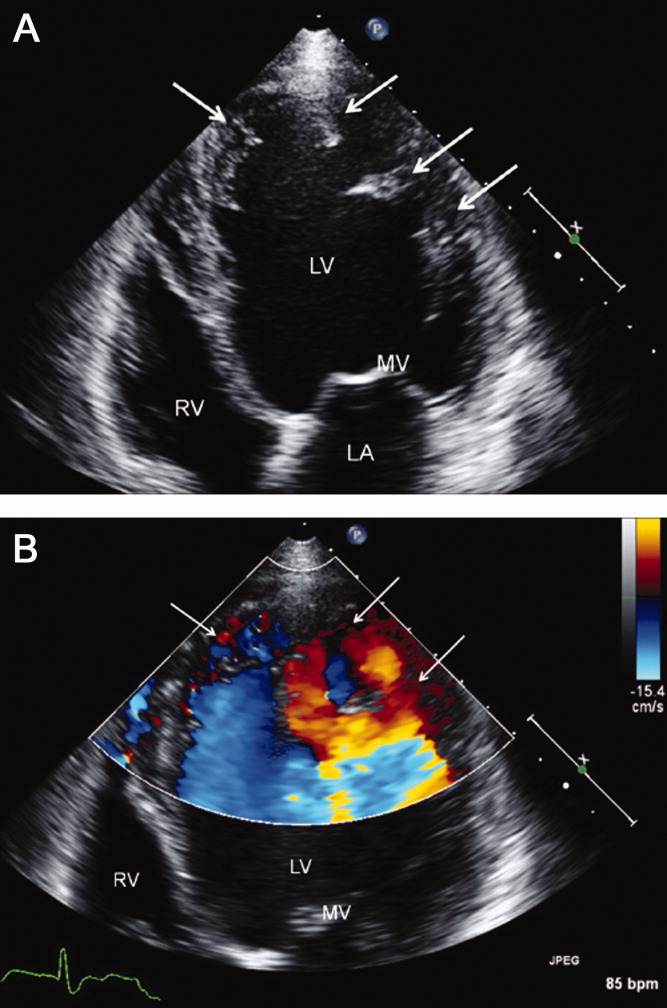
The echocardiographic findings of deep recesses and prominent left ventricular trabeculation are seen in only a few disorders. Sometimes these findings are thought to be due to hypertrophic obstructive cardiomyopathy. The deep trabeculations can be seen in patients with some forms of congenital heart disease associated with ventricular pressure overload during fetal development. The other cause is left ventricular noncompaction, a genetic cardiomyopathy which is becoming increasingly recognized. The disorder, along with causing heart failure, is associated with a high risk of ventricular thrombus and thromboembolic events, and a high risk of arrhythmias and sudden death. The overall prognosis appears to be poor, compared to some other cardiomyopathies. The imaging findings of left ventricular noncompaction are nearly pathognomonic, and experienced echocardiographers can usually make the diagnosis. Finally, left heart catheterization or noninvasive stress testing should be part of the workup to definitively exclude an ischemic cardiomyopathy, even in the setting of noncompaction, and especially given his recent history of chest pain.
A left heart catheterization with coronary arteriography demonstrated no angiographic evidence of obstructive coronary disease. Left ventriculography revealed severe global hypokinesis. The patient was diagnosed with left ventricular noncompaction.
The initial medical management centers upon the treatment of heart failure with a beta‐blocker, ACE‐inhibitor, and diuretics for fluid management. Patients with left ventricular noncompaction are at particularly high risk of both embolic events (thought due to propensity to develop left ventricular clots within the deep recesses of the endocardium) and sudden death from arrhythmias. Thus, anticoagulation with warfarin is often indicated and would be reasonable in this patient, given the extremely low ejection fraction. The patient does meet established criteria for primary prophylaxis of sudden death with an implantable cardioverter‐defibrillator in nonischemic cardiomyopathy (left ventricular ejection fraction 35% and New York Heart Association class II failure), and this would also be appropriate therapy as well, given the high‐risk profile of this patient population.
He was discharged in stable condition with a medical regimen consisting of diuretics, metoprolol, and lisinopril. Given the risk for thromboembolism, he was started on warfarin. On subsequent follow‐up, repeat echocardiogram revealed a persistently low left ventricular ejection fraction at 10%. Despite his marked improvement in exercise tolerance and overall well‐being after 4 months of treatment, his ejection fraction did not improve. As a result, he was evaluated and counseled for placement of an implantable cardioverter‐defibrillator, and received a dual‐chamber device shortly afterward.
COMMENTARY
Left ventricular noncompaction is a form of cardiomyopathy increasingly recognized in both pediatric and adult populations. The hallmark features are a pattern of prominent trabeculations and deep recesses in the left ventricular wall. During normal gestation, the myocardium compacts and matures while deep recesses evolve into capillary precursors of the coronary circulation. Left ventricular noncompaction may result from an arrest in this process, with cardiac myofibers failing to compact from their initial spongiform architecture into a developed endocardium.1 Restrictive relaxation from persistent trabeculae predisposes to diastolic dysfunction, while systolic dysfunction may be related to subendocardial hypoperfusion and mechanical dyssynchrony between compacted and noncompacted myocardium.2
Differentiation of left ventricular noncompaction from other cardiomyopathies, based on history and physical examination alone, is essentially impossible. There is high variability and lack of specificity in both clinical profile and onset of symptoms. Electrocardiographic findings are also nonspecific, and the diagnosis typically becomes evident only with transthoracic echocardiography. Current diagnostic criteria include: 1) absence of coexisting cardiac abnormalities; 2) a two‐layer structure with >2:1 ratio of noncompacted to compacted myocardium; 3) predominant involvement of the apical segment of myocardium; and 4) deep intertrabecular recesses demonstrated on Doppler imaging.2, 3 Although echocardiography remains the standard in clinical practice, cardiac magnetic resonance imaging is being increasingly employed as well.4
With more awareness of the disease and the development of higher resolution imaging, the reported incidence has risen. In one single‐center study performed at a heart failure/transplant clinic, 3% of 960 patients referred to heart failure clinic were diagnosed with left ventricular noncompaction, a prevalence similar to hypertensive disease and hypertrophic cardiomyopathy.5 In another community‐hospitalbased study of 4929 adult patients referred for echocardiography, 3.7% of those with systolic dysfunction were diagnosed with noncompaction.6
Left ventricular noncompaction is considered a genetic cardiomyopathy; a family history of heart failure is often present.7 Despite its congenital origin and genetic involvement,2 it is unclear why symptoms may first present at an advanced age. Chest pain and shortness of breath are common complaints, and approximately 62% of patients will have congestive heart failure at presentation.8
Tachyarrhythmia and ventricular tachycardia are commonly seen, as are systemic embolic events and pulmonary embolism. Significant predictors of death include New York Heart Association class III‐IV, sustained ventricular arrhythmias, and increased left atrial size.9
Management is focused on the treatment of arrhythmias, heart failure, and thromboembolic events. The use of standard medical therapy for heart failure (including ACE‐inhibitors and beta‐blockers) is not based on large‐scale studies, yet remains the cornerstone of therapy. An implantable cardioverter‐defibrillator is indicated after hemodynamically compromising sustained ventricular tachycardia or aborted sudden cardiac death, but there are no guidelines for primary prophylaxis outside of patients with heart failure and a depressed ejection fraction.10 Cardiac resynchronization therapy has been successful in some patients with isolated left ventricular noncompaction. Long‐term oral anticoagulation is recommended, especially when impaired left ventricular function, thrombi, or atrial fibrillation have been documented. Patients with left ventricular dysfunction in concert with left ventricular noncompaction are at 10% higher risk for embolic complications when compared to those without noncompaction.11 Familial screening with echocardiography is indicated once the diagnosis has been made.2
In this Clinical Care Conundrum, we describe a rare but increasingly recognized condition, and highlight the importance of delineating the underlying cause of cardiomyopathy when possible. Treatment of heart failure in the hospital setting is sometimes more focused on initiation of diuresis and further stabilization of the patient, and less focused on elucidation of the etiology. While recognition of left ventricular failure led to early treatment with standard therapy in this case, identification of the underlying cause allowed for targeted interventions directed at cardiac arrhythmias, embolic events, and familial screening. Of note, the discussant was careful not to let the prior history of syncopal events distract him from the central issues in this case.
This case also serves as a reminder that congenital anomalies should remain on the differential diagnosis when evaluating new complaints in adult patients. The discussant approached the presentation of new‐onset left ventricular dysfunction in a thorough manner, weighing the likelihood of ischemic and nonischemic causes in the context of the history and physical examination. Careful consideration of the patient's new clinical manifestationscoupled with characteristic echocardiographic findings and normal coronary anatomysolidified the diagnosis. By developing a broad differential, the discussant and clinical team arrived at a diagnosis that for this 66‐year‐old gentleman was a lifetime in the making.
Teaching Points
-
Left ventricular noncompaction is characterized by a pattern of prominent trabecular meshwork and deep intertrabecular recesses communicating with the left ventricular cavity. Heightened awareness among clinicians and echocardiographers has led to increased detection of this condition.
-
This disease needs to be considered in patients of all ages presenting with heart failure, especially in cases characterized by ventricular arrhythmias, thromboembolism, and a family history of similar events.
-
Left ventricular noncompaction management is mainly focused on the treatment of arrhythmias, heart failure, and thromboembolic events.
The approach to clinical conundrums by an expert clinician is revealed through the presentation of an actual patient's case in an approach typical of a morning report. Similarly to patient care, sequential pieces of information are provided to the clinician, who is unfamiliar with the case. The focus is on the thought processes of both the clinical team caring for the patient and the discussant.
- ,,.Isolated ventricular non‐compaction of the myocardium in adults.Heart.2006;93:11–15.
- .Left ventricular noncompaction.Circ J.2009;73:19–26.
- ,,,,.Echocardiographic and pathoanatomical characteristics of isolated left ventricular non‐compaction: a step towards classification as a distinct cardiomyopathy.Heart.2001;86:666–671.
- ,,, et al.Left ventricular non‐compaction: insights from cardiovascular magnetic resonance imaging.J Am Coll Cardiol.2005;46:101–105.
- ,,,,,.Isolated left ventricular noncompaction as a cause for heart failure and heart transplantation: a single center experience.Cardiology.2009;112:158–164.
- ,,,.Prevalence and characteristics of left ventricular noncompaction in a community hospital cohort of patients with systolic dysfunction.Echocardiography.2008;25(1):8–12.
- ,,, et al.Contemporary definitions and classification of the cardiomyopathies: an American Heart Association Scientific Statement from the Council on Clinical Cardiology, Heart Failure and Transplantation Committee; Quality of Care and Outcomes Research and Functional Genomics and Translational Biology Interdisciplinary Working Groups; and Council on Epidemiology and Prevention.Circulation.2006;113:1801–1816.
- ,,,,.Long‐term follow‐up of 34 adults with isolated left ventricular noncompaction: a distinct cardiomyopathy with poor prognosis.J Am Coll Cardiol.2000;36:493–500.
- ,,, et al.Wide spectrum of presentation and variable outcomes of isolated left ventricular non‐compaction.Heart.2007;93(1):65–71.
- ,,, et al.Prophylactic defibrillator implantation in patients with nonischemic dilated cardiomyopathy.N Engl J Med.2004;350:2151–2159.
- ,.Left ventricular hypertrabeculation/noncompaction and stroke or embolism.Cardiology.2005;103:68–72.
A 66‐year‐old man presented to the emergency department with 3 weeks of progressive exertional dyspnea. He also reported a single episode of chest pain 1 day prior to admission.
Cardiac and pulmonary causes of dyspnea are the most common. Other causes include anemia or a neuromuscular process. Given the recent episode of chest pain, coronary ischemia, congestive heart failure, chronic obstructive pulmonary disease (COPD), pulmonary embolism, and pericardial effusion must be considered.
Up until 3 weeks ago, he had no exercise intolerance, and had been relatively active. He began noticing progressive dyspnea to the point where he had considerable difficulty walking up stairs, and performing minor household chores. He also complained of orthopnea and paroxysmal nocturnal dyspnea for the last 3 weeks.He denied chest pain at presentation, but 24 hours prior, he experienced one episode of sharp, left‐sided, nonradiating, nonpositional chest pain that occurred at rest. It lasted approximately 20 minutes and was not associated with diaphoresis, nausea, vomiting, or palpitations. He had never experienced chest discomfort prior to this episode. He denied fever, chills, cough, or wheezing.
Progressive dyspnea on exertion with associated orthopnea and paroxysmal nocturnal dyspnea is classically seen in patients with heart failure and is typically associated with left ventricular failure. However, paroxysmal nocturnal dyspnea and orthopnea are only moderately specific for heart failure. Orthopnea can also be seen in pericardial disease, and in numerous pulmonary diseases, including asthma, COPD, pulmonary hypertension, diaphragmatic weakness, pleural effusion, pulmonary embolism, and any apical lung process including lung cancer or pneumonia. Paroxysmal nocturnal dyspnea can be seen in many of the same disorders and can also be reported in obstructive sleep apnea.
His past medical history was remarkable for two episodes of syncope, occurring 5 and 3 years ago, both while working outside in warm weather. Neither was associated with chest pain, diaphoresis, palpitations, or post‐ictal symptoms. He was diagnosed with prostate cancer 8 years ago, and underwent 2 years of androgen‐deprivation therapy with goserelin along with local radiation therapy. Medications included subcutaneous goserelin every 3 months and daily omeprazole. He denied any other prescription, over‐the‐counter, or herbal medications. He reported a 50‐pack‐year history of smoking, but denied alcohol or illicit drug abuse. He denied any travel history or recent immobilization. He had no children, and there was no known history of heart disease in his family.
The past medical history of two episodes of likely exertional syncope is interesting, but the episodes were sporadic and in the distant past, arguing against a serious and ongoing process. Nonetheless, this history still raises the possibility of cardiac causes of syncope, especially causes such as hypertrophic obstructive cardiomyopathy or aortic stenosis which are classically associated with exertional syncope. Either of these two conditions can result in heart failure if untreated. The history of goserelin therapy does make the possibility of heart failure higher, as there has been an association reported between use of this drug and heart failure. His history of tobacco use is a risk factor for coronary artery disease (CAD) and COPD. An active cancer history is also a risk factor for thromboembolic disease, which remains a consideration.
On admission, his temperature was 36.9C, heart rate 94 bpm, respiratory rate 22 breaths per minute, blood pressure 200/108 mmHg, and oxygen saturation 93% breathing ambient air. He was a thin man in no acute distress. Cardiovascular examination was significant for normal first and second heart sounds, with a soft left‐sided S3; the point of maximal impulse was diffuse, but displaced laterally. His jugular venous pressure was estimated at 9 cm of H2O while positioned at a 45‐degree angle. Rales were heard at the lung bases bilaterally. Abdominal exam was normal. His lower extremities were without edema. There were no focal neurological deficits appreciated. Skin examination was unremarkable.
His combination of physical exam findings strongly suggests heart failure, most likely related to a dilated cardiomyopathy and left ventricular dysfunction. The presence of a left‐sided S3 and rales, and the lack of markedly elevated central venous pressure and peripheral edema, suggest heart failure predominantly due to left ventricular dysfunction. Of note, he is very hypertensive. This would not be the typical finding with severely decompensated heart failure. It would be important to determine whether his elevated blood pressure is due to an acute, reversible cause (e.g., pain, dyspnea, anxiety) or whether cocaine use, psychotropic agents, rare causes such as catecholamine‐producing tumors, other neuroendocrine tumors or thyroid toxic states are at play. In addition, one might see hypertension early in the course of heart failure, from a left ventricular outflow obstructive etiology such as severe aortic stenosis or hypertrophic obstructive cardiomyopathy.
Laboratory evaluation revealed a white blood cell count of 8900/mm3, with a normal differential; hemoglobin was 13.9 g/dL; platelet count was 264,000/mm3. Serum electrolytes and liver enzymes were unremarkable, with serum creatinine 1.1 mg/dL and blood urea nitrogen 7 mg/dL. Serial cardiac troponin‐I levels drawn 8 hours apart were 0.04, 0.07, 0.08, and 0.04 ng/mL (normal 0.04). Brain natriuretic peptide was 1420 pg/mL (normal 100). Thyroid stimulating hormone was 1.19 uIU/mL (normal 0.34‐5.60). Chest radiography revealed mild cardiomegaly, with peripheral interstitial opacities in the mid and lower lobes bilaterally, with fluid within the minor fissure. A 12‐lead electrocardiogram (ECG) revealed normal sinus rhythm at 95 bpm with left anterior fascicular block; intraventricular conduction delay was present (QRS width 106 ms) and QS complexes were present in V1‐V3. In addition, there was a left atrial abnormality and voltage criteria for left ventricular hypertrophy with secondary T‐wave inversions laterally (Figure 1). No previous ECGs were available for comparison. A chest computed tomography scan with contrast showed no evidence of pulmonary embolus. It did show interlobular septal thickening and small bilateral pleural effusions, consistent with left ventricular dysfunction.
The patient's initial lab, imaging, and diagnostic work‐up continues to be consistent with the diagnosis of heart failure. The patient appears to have cardiomegaly and mild pulmonary edema by imaging. The etiology of heart failure remains unknown, but ischemia remains in the differential, given the mildly elevated troponins initially and the ECG findings of left anterior fascicular block and T‐wave inversions in the lateral leads. Left anterior fascicular block can be seen with ischemic heart disease (especially involving the left anterior descending coronary artery), hypertensive heart disease, valvular disease, and some infiltrative cardiac processes. The lateral T‐wave inversions are likely secondary to left ventricular hypertrophy (a so‐called strain pattern), rather than ischemia. Left ventricular hypertrophy is consistent with his hypertension, suggesting that it is chronic; his presentation may be due to hypertensive heart disease with new onset heart failure.
He was admitted to the hospital, and metoprolol, lisinopril, and intravenous furosemide were given. Transthoracic echocardiography demonstrated severe global hypokinesis with a left ventricular ejection fraction of 10%. There was no evidence of ventricular thrombus or valvular disease; however, prominent left ventricular trabeculation with deep recesses was noted (see Figure 2).
The echocardiographic findings of deep recesses and prominent left ventricular trabeculation are seen in only a few disorders. Sometimes these findings are thought to be due to hypertrophic obstructive cardiomyopathy. The deep trabeculations can be seen in patients with some forms of congenital heart disease associated with ventricular pressure overload during fetal development. The other cause is left ventricular noncompaction, a genetic cardiomyopathy which is becoming increasingly recognized. The disorder, along with causing heart failure, is associated with a high risk of ventricular thrombus and thromboembolic events, and a high risk of arrhythmias and sudden death. The overall prognosis appears to be poor, compared to some other cardiomyopathies. The imaging findings of left ventricular noncompaction are nearly pathognomonic, and experienced echocardiographers can usually make the diagnosis. Finally, left heart catheterization or noninvasive stress testing should be part of the workup to definitively exclude an ischemic cardiomyopathy, even in the setting of noncompaction, and especially given his recent history of chest pain.
A left heart catheterization with coronary arteriography demonstrated no angiographic evidence of obstructive coronary disease. Left ventriculography revealed severe global hypokinesis. The patient was diagnosed with left ventricular noncompaction.
The initial medical management centers upon the treatment of heart failure with a beta‐blocker, ACE‐inhibitor, and diuretics for fluid management. Patients with left ventricular noncompaction are at particularly high risk of both embolic events (thought due to propensity to develop left ventricular clots within the deep recesses of the endocardium) and sudden death from arrhythmias. Thus, anticoagulation with warfarin is often indicated and would be reasonable in this patient, given the extremely low ejection fraction. The patient does meet established criteria for primary prophylaxis of sudden death with an implantable cardioverter‐defibrillator in nonischemic cardiomyopathy (left ventricular ejection fraction 35% and New York Heart Association class II failure), and this would also be appropriate therapy as well, given the high‐risk profile of this patient population.
He was discharged in stable condition with a medical regimen consisting of diuretics, metoprolol, and lisinopril. Given the risk for thromboembolism, he was started on warfarin. On subsequent follow‐up, repeat echocardiogram revealed a persistently low left ventricular ejection fraction at 10%. Despite his marked improvement in exercise tolerance and overall well‐being after 4 months of treatment, his ejection fraction did not improve. As a result, he was evaluated and counseled for placement of an implantable cardioverter‐defibrillator, and received a dual‐chamber device shortly afterward.
COMMENTARY
Left ventricular noncompaction is a form of cardiomyopathy increasingly recognized in both pediatric and adult populations. The hallmark features are a pattern of prominent trabeculations and deep recesses in the left ventricular wall. During normal gestation, the myocardium compacts and matures while deep recesses evolve into capillary precursors of the coronary circulation. Left ventricular noncompaction may result from an arrest in this process, with cardiac myofibers failing to compact from their initial spongiform architecture into a developed endocardium.1 Restrictive relaxation from persistent trabeculae predisposes to diastolic dysfunction, while systolic dysfunction may be related to subendocardial hypoperfusion and mechanical dyssynchrony between compacted and noncompacted myocardium.2
Differentiation of left ventricular noncompaction from other cardiomyopathies, based on history and physical examination alone, is essentially impossible. There is high variability and lack of specificity in both clinical profile and onset of symptoms. Electrocardiographic findings are also nonspecific, and the diagnosis typically becomes evident only with transthoracic echocardiography. Current diagnostic criteria include: 1) absence of coexisting cardiac abnormalities; 2) a two‐layer structure with >2:1 ratio of noncompacted to compacted myocardium; 3) predominant involvement of the apical segment of myocardium; and 4) deep intertrabecular recesses demonstrated on Doppler imaging.2, 3 Although echocardiography remains the standard in clinical practice, cardiac magnetic resonance imaging is being increasingly employed as well.4
With more awareness of the disease and the development of higher resolution imaging, the reported incidence has risen. In one single‐center study performed at a heart failure/transplant clinic, 3% of 960 patients referred to heart failure clinic were diagnosed with left ventricular noncompaction, a prevalence similar to hypertensive disease and hypertrophic cardiomyopathy.5 In another community‐hospitalbased study of 4929 adult patients referred for echocardiography, 3.7% of those with systolic dysfunction were diagnosed with noncompaction.6
Left ventricular noncompaction is considered a genetic cardiomyopathy; a family history of heart failure is often present.7 Despite its congenital origin and genetic involvement,2 it is unclear why symptoms may first present at an advanced age. Chest pain and shortness of breath are common complaints, and approximately 62% of patients will have congestive heart failure at presentation.8
Tachyarrhythmia and ventricular tachycardia are commonly seen, as are systemic embolic events and pulmonary embolism. Significant predictors of death include New York Heart Association class III‐IV, sustained ventricular arrhythmias, and increased left atrial size.9
Management is focused on the treatment of arrhythmias, heart failure, and thromboembolic events. The use of standard medical therapy for heart failure (including ACE‐inhibitors and beta‐blockers) is not based on large‐scale studies, yet remains the cornerstone of therapy. An implantable cardioverter‐defibrillator is indicated after hemodynamically compromising sustained ventricular tachycardia or aborted sudden cardiac death, but there are no guidelines for primary prophylaxis outside of patients with heart failure and a depressed ejection fraction.10 Cardiac resynchronization therapy has been successful in some patients with isolated left ventricular noncompaction. Long‐term oral anticoagulation is recommended, especially when impaired left ventricular function, thrombi, or atrial fibrillation have been documented. Patients with left ventricular dysfunction in concert with left ventricular noncompaction are at 10% higher risk for embolic complications when compared to those without noncompaction.11 Familial screening with echocardiography is indicated once the diagnosis has been made.2
In this Clinical Care Conundrum, we describe a rare but increasingly recognized condition, and highlight the importance of delineating the underlying cause of cardiomyopathy when possible. Treatment of heart failure in the hospital setting is sometimes more focused on initiation of diuresis and further stabilization of the patient, and less focused on elucidation of the etiology. While recognition of left ventricular failure led to early treatment with standard therapy in this case, identification of the underlying cause allowed for targeted interventions directed at cardiac arrhythmias, embolic events, and familial screening. Of note, the discussant was careful not to let the prior history of syncopal events distract him from the central issues in this case.
This case also serves as a reminder that congenital anomalies should remain on the differential diagnosis when evaluating new complaints in adult patients. The discussant approached the presentation of new‐onset left ventricular dysfunction in a thorough manner, weighing the likelihood of ischemic and nonischemic causes in the context of the history and physical examination. Careful consideration of the patient's new clinical manifestationscoupled with characteristic echocardiographic findings and normal coronary anatomysolidified the diagnosis. By developing a broad differential, the discussant and clinical team arrived at a diagnosis that for this 66‐year‐old gentleman was a lifetime in the making.
Teaching Points
-
Left ventricular noncompaction is characterized by a pattern of prominent trabecular meshwork and deep intertrabecular recesses communicating with the left ventricular cavity. Heightened awareness among clinicians and echocardiographers has led to increased detection of this condition.
-
This disease needs to be considered in patients of all ages presenting with heart failure, especially in cases characterized by ventricular arrhythmias, thromboembolism, and a family history of similar events.
-
Left ventricular noncompaction management is mainly focused on the treatment of arrhythmias, heart failure, and thromboembolic events.
The approach to clinical conundrums by an expert clinician is revealed through the presentation of an actual patient's case in an approach typical of a morning report. Similarly to patient care, sequential pieces of information are provided to the clinician, who is unfamiliar with the case. The focus is on the thought processes of both the clinical team caring for the patient and the discussant.
A 66‐year‐old man presented to the emergency department with 3 weeks of progressive exertional dyspnea. He also reported a single episode of chest pain 1 day prior to admission.
Cardiac and pulmonary causes of dyspnea are the most common. Other causes include anemia or a neuromuscular process. Given the recent episode of chest pain, coronary ischemia, congestive heart failure, chronic obstructive pulmonary disease (COPD), pulmonary embolism, and pericardial effusion must be considered.
Up until 3 weeks ago, he had no exercise intolerance, and had been relatively active. He began noticing progressive dyspnea to the point where he had considerable difficulty walking up stairs, and performing minor household chores. He also complained of orthopnea and paroxysmal nocturnal dyspnea for the last 3 weeks.He denied chest pain at presentation, but 24 hours prior, he experienced one episode of sharp, left‐sided, nonradiating, nonpositional chest pain that occurred at rest. It lasted approximately 20 minutes and was not associated with diaphoresis, nausea, vomiting, or palpitations. He had never experienced chest discomfort prior to this episode. He denied fever, chills, cough, or wheezing.
Progressive dyspnea on exertion with associated orthopnea and paroxysmal nocturnal dyspnea is classically seen in patients with heart failure and is typically associated with left ventricular failure. However, paroxysmal nocturnal dyspnea and orthopnea are only moderately specific for heart failure. Orthopnea can also be seen in pericardial disease, and in numerous pulmonary diseases, including asthma, COPD, pulmonary hypertension, diaphragmatic weakness, pleural effusion, pulmonary embolism, and any apical lung process including lung cancer or pneumonia. Paroxysmal nocturnal dyspnea can be seen in many of the same disorders and can also be reported in obstructive sleep apnea.
His past medical history was remarkable for two episodes of syncope, occurring 5 and 3 years ago, both while working outside in warm weather. Neither was associated with chest pain, diaphoresis, palpitations, or post‐ictal symptoms. He was diagnosed with prostate cancer 8 years ago, and underwent 2 years of androgen‐deprivation therapy with goserelin along with local radiation therapy. Medications included subcutaneous goserelin every 3 months and daily omeprazole. He denied any other prescription, over‐the‐counter, or herbal medications. He reported a 50‐pack‐year history of smoking, but denied alcohol or illicit drug abuse. He denied any travel history or recent immobilization. He had no children, and there was no known history of heart disease in his family.
The past medical history of two episodes of likely exertional syncope is interesting, but the episodes were sporadic and in the distant past, arguing against a serious and ongoing process. Nonetheless, this history still raises the possibility of cardiac causes of syncope, especially causes such as hypertrophic obstructive cardiomyopathy or aortic stenosis which are classically associated with exertional syncope. Either of these two conditions can result in heart failure if untreated. The history of goserelin therapy does make the possibility of heart failure higher, as there has been an association reported between use of this drug and heart failure. His history of tobacco use is a risk factor for coronary artery disease (CAD) and COPD. An active cancer history is also a risk factor for thromboembolic disease, which remains a consideration.
On admission, his temperature was 36.9C, heart rate 94 bpm, respiratory rate 22 breaths per minute, blood pressure 200/108 mmHg, and oxygen saturation 93% breathing ambient air. He was a thin man in no acute distress. Cardiovascular examination was significant for normal first and second heart sounds, with a soft left‐sided S3; the point of maximal impulse was diffuse, but displaced laterally. His jugular venous pressure was estimated at 9 cm of H2O while positioned at a 45‐degree angle. Rales were heard at the lung bases bilaterally. Abdominal exam was normal. His lower extremities were without edema. There were no focal neurological deficits appreciated. Skin examination was unremarkable.
His combination of physical exam findings strongly suggests heart failure, most likely related to a dilated cardiomyopathy and left ventricular dysfunction. The presence of a left‐sided S3 and rales, and the lack of markedly elevated central venous pressure and peripheral edema, suggest heart failure predominantly due to left ventricular dysfunction. Of note, he is very hypertensive. This would not be the typical finding with severely decompensated heart failure. It would be important to determine whether his elevated blood pressure is due to an acute, reversible cause (e.g., pain, dyspnea, anxiety) or whether cocaine use, psychotropic agents, rare causes such as catecholamine‐producing tumors, other neuroendocrine tumors or thyroid toxic states are at play. In addition, one might see hypertension early in the course of heart failure, from a left ventricular outflow obstructive etiology such as severe aortic stenosis or hypertrophic obstructive cardiomyopathy.
Laboratory evaluation revealed a white blood cell count of 8900/mm3, with a normal differential; hemoglobin was 13.9 g/dL; platelet count was 264,000/mm3. Serum electrolytes and liver enzymes were unremarkable, with serum creatinine 1.1 mg/dL and blood urea nitrogen 7 mg/dL. Serial cardiac troponin‐I levels drawn 8 hours apart were 0.04, 0.07, 0.08, and 0.04 ng/mL (normal 0.04). Brain natriuretic peptide was 1420 pg/mL (normal 100). Thyroid stimulating hormone was 1.19 uIU/mL (normal 0.34‐5.60). Chest radiography revealed mild cardiomegaly, with peripheral interstitial opacities in the mid and lower lobes bilaterally, with fluid within the minor fissure. A 12‐lead electrocardiogram (ECG) revealed normal sinus rhythm at 95 bpm with left anterior fascicular block; intraventricular conduction delay was present (QRS width 106 ms) and QS complexes were present in V1‐V3. In addition, there was a left atrial abnormality and voltage criteria for left ventricular hypertrophy with secondary T‐wave inversions laterally (Figure 1). No previous ECGs were available for comparison. A chest computed tomography scan with contrast showed no evidence of pulmonary embolus. It did show interlobular septal thickening and small bilateral pleural effusions, consistent with left ventricular dysfunction.
The patient's initial lab, imaging, and diagnostic work‐up continues to be consistent with the diagnosis of heart failure. The patient appears to have cardiomegaly and mild pulmonary edema by imaging. The etiology of heart failure remains unknown, but ischemia remains in the differential, given the mildly elevated troponins initially and the ECG findings of left anterior fascicular block and T‐wave inversions in the lateral leads. Left anterior fascicular block can be seen with ischemic heart disease (especially involving the left anterior descending coronary artery), hypertensive heart disease, valvular disease, and some infiltrative cardiac processes. The lateral T‐wave inversions are likely secondary to left ventricular hypertrophy (a so‐called strain pattern), rather than ischemia. Left ventricular hypertrophy is consistent with his hypertension, suggesting that it is chronic; his presentation may be due to hypertensive heart disease with new onset heart failure.
He was admitted to the hospital, and metoprolol, lisinopril, and intravenous furosemide were given. Transthoracic echocardiography demonstrated severe global hypokinesis with a left ventricular ejection fraction of 10%. There was no evidence of ventricular thrombus or valvular disease; however, prominent left ventricular trabeculation with deep recesses was noted (see Figure 2).
The echocardiographic findings of deep recesses and prominent left ventricular trabeculation are seen in only a few disorders. Sometimes these findings are thought to be due to hypertrophic obstructive cardiomyopathy. The deep trabeculations can be seen in patients with some forms of congenital heart disease associated with ventricular pressure overload during fetal development. The other cause is left ventricular noncompaction, a genetic cardiomyopathy which is becoming increasingly recognized. The disorder, along with causing heart failure, is associated with a high risk of ventricular thrombus and thromboembolic events, and a high risk of arrhythmias and sudden death. The overall prognosis appears to be poor, compared to some other cardiomyopathies. The imaging findings of left ventricular noncompaction are nearly pathognomonic, and experienced echocardiographers can usually make the diagnosis. Finally, left heart catheterization or noninvasive stress testing should be part of the workup to definitively exclude an ischemic cardiomyopathy, even in the setting of noncompaction, and especially given his recent history of chest pain.
A left heart catheterization with coronary arteriography demonstrated no angiographic evidence of obstructive coronary disease. Left ventriculography revealed severe global hypokinesis. The patient was diagnosed with left ventricular noncompaction.
The initial medical management centers upon the treatment of heart failure with a beta‐blocker, ACE‐inhibitor, and diuretics for fluid management. Patients with left ventricular noncompaction are at particularly high risk of both embolic events (thought due to propensity to develop left ventricular clots within the deep recesses of the endocardium) and sudden death from arrhythmias. Thus, anticoagulation with warfarin is often indicated and would be reasonable in this patient, given the extremely low ejection fraction. The patient does meet established criteria for primary prophylaxis of sudden death with an implantable cardioverter‐defibrillator in nonischemic cardiomyopathy (left ventricular ejection fraction 35% and New York Heart Association class II failure), and this would also be appropriate therapy as well, given the high‐risk profile of this patient population.
He was discharged in stable condition with a medical regimen consisting of diuretics, metoprolol, and lisinopril. Given the risk for thromboembolism, he was started on warfarin. On subsequent follow‐up, repeat echocardiogram revealed a persistently low left ventricular ejection fraction at 10%. Despite his marked improvement in exercise tolerance and overall well‐being after 4 months of treatment, his ejection fraction did not improve. As a result, he was evaluated and counseled for placement of an implantable cardioverter‐defibrillator, and received a dual‐chamber device shortly afterward.
COMMENTARY
Left ventricular noncompaction is a form of cardiomyopathy increasingly recognized in both pediatric and adult populations. The hallmark features are a pattern of prominent trabeculations and deep recesses in the left ventricular wall. During normal gestation, the myocardium compacts and matures while deep recesses evolve into capillary precursors of the coronary circulation. Left ventricular noncompaction may result from an arrest in this process, with cardiac myofibers failing to compact from their initial spongiform architecture into a developed endocardium.1 Restrictive relaxation from persistent trabeculae predisposes to diastolic dysfunction, while systolic dysfunction may be related to subendocardial hypoperfusion and mechanical dyssynchrony between compacted and noncompacted myocardium.2
Differentiation of left ventricular noncompaction from other cardiomyopathies, based on history and physical examination alone, is essentially impossible. There is high variability and lack of specificity in both clinical profile and onset of symptoms. Electrocardiographic findings are also nonspecific, and the diagnosis typically becomes evident only with transthoracic echocardiography. Current diagnostic criteria include: 1) absence of coexisting cardiac abnormalities; 2) a two‐layer structure with >2:1 ratio of noncompacted to compacted myocardium; 3) predominant involvement of the apical segment of myocardium; and 4) deep intertrabecular recesses demonstrated on Doppler imaging.2, 3 Although echocardiography remains the standard in clinical practice, cardiac magnetic resonance imaging is being increasingly employed as well.4
With more awareness of the disease and the development of higher resolution imaging, the reported incidence has risen. In one single‐center study performed at a heart failure/transplant clinic, 3% of 960 patients referred to heart failure clinic were diagnosed with left ventricular noncompaction, a prevalence similar to hypertensive disease and hypertrophic cardiomyopathy.5 In another community‐hospitalbased study of 4929 adult patients referred for echocardiography, 3.7% of those with systolic dysfunction were diagnosed with noncompaction.6
Left ventricular noncompaction is considered a genetic cardiomyopathy; a family history of heart failure is often present.7 Despite its congenital origin and genetic involvement,2 it is unclear why symptoms may first present at an advanced age. Chest pain and shortness of breath are common complaints, and approximately 62% of patients will have congestive heart failure at presentation.8
Tachyarrhythmia and ventricular tachycardia are commonly seen, as are systemic embolic events and pulmonary embolism. Significant predictors of death include New York Heart Association class III‐IV, sustained ventricular arrhythmias, and increased left atrial size.9
Management is focused on the treatment of arrhythmias, heart failure, and thromboembolic events. The use of standard medical therapy for heart failure (including ACE‐inhibitors and beta‐blockers) is not based on large‐scale studies, yet remains the cornerstone of therapy. An implantable cardioverter‐defibrillator is indicated after hemodynamically compromising sustained ventricular tachycardia or aborted sudden cardiac death, but there are no guidelines for primary prophylaxis outside of patients with heart failure and a depressed ejection fraction.10 Cardiac resynchronization therapy has been successful in some patients with isolated left ventricular noncompaction. Long‐term oral anticoagulation is recommended, especially when impaired left ventricular function, thrombi, or atrial fibrillation have been documented. Patients with left ventricular dysfunction in concert with left ventricular noncompaction are at 10% higher risk for embolic complications when compared to those without noncompaction.11 Familial screening with echocardiography is indicated once the diagnosis has been made.2
In this Clinical Care Conundrum, we describe a rare but increasingly recognized condition, and highlight the importance of delineating the underlying cause of cardiomyopathy when possible. Treatment of heart failure in the hospital setting is sometimes more focused on initiation of diuresis and further stabilization of the patient, and less focused on elucidation of the etiology. While recognition of left ventricular failure led to early treatment with standard therapy in this case, identification of the underlying cause allowed for targeted interventions directed at cardiac arrhythmias, embolic events, and familial screening. Of note, the discussant was careful not to let the prior history of syncopal events distract him from the central issues in this case.
This case also serves as a reminder that congenital anomalies should remain on the differential diagnosis when evaluating new complaints in adult patients. The discussant approached the presentation of new‐onset left ventricular dysfunction in a thorough manner, weighing the likelihood of ischemic and nonischemic causes in the context of the history and physical examination. Careful consideration of the patient's new clinical manifestationscoupled with characteristic echocardiographic findings and normal coronary anatomysolidified the diagnosis. By developing a broad differential, the discussant and clinical team arrived at a diagnosis that for this 66‐year‐old gentleman was a lifetime in the making.
Teaching Points
-
Left ventricular noncompaction is characterized by a pattern of prominent trabecular meshwork and deep intertrabecular recesses communicating with the left ventricular cavity. Heightened awareness among clinicians and echocardiographers has led to increased detection of this condition.
-
This disease needs to be considered in patients of all ages presenting with heart failure, especially in cases characterized by ventricular arrhythmias, thromboembolism, and a family history of similar events.
-
Left ventricular noncompaction management is mainly focused on the treatment of arrhythmias, heart failure, and thromboembolic events.
The approach to clinical conundrums by an expert clinician is revealed through the presentation of an actual patient's case in an approach typical of a morning report. Similarly to patient care, sequential pieces of information are provided to the clinician, who is unfamiliar with the case. The focus is on the thought processes of both the clinical team caring for the patient and the discussant.
- ,,.Isolated ventricular non‐compaction of the myocardium in adults.Heart.2006;93:11–15.
- .Left ventricular noncompaction.Circ J.2009;73:19–26.
- ,,,,.Echocardiographic and pathoanatomical characteristics of isolated left ventricular non‐compaction: a step towards classification as a distinct cardiomyopathy.Heart.2001;86:666–671.
- ,,, et al.Left ventricular non‐compaction: insights from cardiovascular magnetic resonance imaging.J Am Coll Cardiol.2005;46:101–105.
- ,,,,,.Isolated left ventricular noncompaction as a cause for heart failure and heart transplantation: a single center experience.Cardiology.2009;112:158–164.
- ,,,.Prevalence and characteristics of left ventricular noncompaction in a community hospital cohort of patients with systolic dysfunction.Echocardiography.2008;25(1):8–12.
- ,,, et al.Contemporary definitions and classification of the cardiomyopathies: an American Heart Association Scientific Statement from the Council on Clinical Cardiology, Heart Failure and Transplantation Committee; Quality of Care and Outcomes Research and Functional Genomics and Translational Biology Interdisciplinary Working Groups; and Council on Epidemiology and Prevention.Circulation.2006;113:1801–1816.
- ,,,,.Long‐term follow‐up of 34 adults with isolated left ventricular noncompaction: a distinct cardiomyopathy with poor prognosis.J Am Coll Cardiol.2000;36:493–500.
- ,,, et al.Wide spectrum of presentation and variable outcomes of isolated left ventricular non‐compaction.Heart.2007;93(1):65–71.
- ,,, et al.Prophylactic defibrillator implantation in patients with nonischemic dilated cardiomyopathy.N Engl J Med.2004;350:2151–2159.
- ,.Left ventricular hypertrabeculation/noncompaction and stroke or embolism.Cardiology.2005;103:68–72.
- ,,.Isolated ventricular non‐compaction of the myocardium in adults.Heart.2006;93:11–15.
- .Left ventricular noncompaction.Circ J.2009;73:19–26.
- ,,,,.Echocardiographic and pathoanatomical characteristics of isolated left ventricular non‐compaction: a step towards classification as a distinct cardiomyopathy.Heart.2001;86:666–671.
- ,,, et al.Left ventricular non‐compaction: insights from cardiovascular magnetic resonance imaging.J Am Coll Cardiol.2005;46:101–105.
- ,,,,,.Isolated left ventricular noncompaction as a cause for heart failure and heart transplantation: a single center experience.Cardiology.2009;112:158–164.
- ,,,.Prevalence and characteristics of left ventricular noncompaction in a community hospital cohort of patients with systolic dysfunction.Echocardiography.2008;25(1):8–12.
- ,,, et al.Contemporary definitions and classification of the cardiomyopathies: an American Heart Association Scientific Statement from the Council on Clinical Cardiology, Heart Failure and Transplantation Committee; Quality of Care and Outcomes Research and Functional Genomics and Translational Biology Interdisciplinary Working Groups; and Council on Epidemiology and Prevention.Circulation.2006;113:1801–1816.
- ,,,,.Long‐term follow‐up of 34 adults with isolated left ventricular noncompaction: a distinct cardiomyopathy with poor prognosis.J Am Coll Cardiol.2000;36:493–500.
- ,,, et al.Wide spectrum of presentation and variable outcomes of isolated left ventricular non‐compaction.Heart.2007;93(1):65–71.
- ,,, et al.Prophylactic defibrillator implantation in patients with nonischemic dilated cardiomyopathy.N Engl J Med.2004;350:2151–2159.
- ,.Left ventricular hypertrabeculation/noncompaction and stroke or embolism.Cardiology.2005;103:68–72.
Prolonged Stay Factors in Bronchiolitis
Prior studies have identified risk factors for increased severity of illness, readmission, or prolonged length of stay (LOS) in infants admitted with bronchiolitis.123 These risk factors include birth‐related factors (prematurity, birth within six months of respiratory syncytial virus [RSV] season, discharge from the neonatal intensive care unit during winter, multiple birth infant), environmental factors (day care attendance, school‐age siblings, smoke exposure), and underlying diseases (chronic lung disease and other pulmonary conditions, failure to thrive (FTT), congenital heart disease, immunologic disorders, and neuromuscular disease).123 Additional risk factors occurring during the bronchiolitis course that have been associated with prolonged hospital course are mechanical ventilation, intensive care unit (ICU) admission, hypoxia on admission, apnea, feeding problems, and duration of supplemental oxygen.2123
Having a reliable model to identify infants at high risk for prolonged LOS early in the course of an admission would be helpful, both for clinical care and for studies of interventions designed to reduce LOS. Prior attempts at developing a model have yielded mixed results. The Michigan Logistic Regression Model displayed excellent predictive ability with an area under the receiver‐operator curve (ROC) of 0.88 using variables including prematurity, FTT, pulmonary disease, other comorbid diseases, and early mechanical ventilation.21 However, when applied to another patient population it did not perform as well. The Rotterdam Model using the variables of weight and supplemental oxygen had an ROC of 0.65.24
Prior prediction models have focused more on birth‐ and disease‐related risk factors than on hospital course factors, particularly common clinical assessments including respiratory status and caloric intake. An additional limitation of prior models is some loss of ability to study the interaction between various predictor variables when using multivariate regression methods.
Our aims were: 1) to study the associations of various clinical markers identifiable during the first two days of the hospital admission with LOS; and 2) to develop a LOS prediction model, using both previously identified risk factors and more detailed clinical data from the first two days of the hospital admission.
MATERIALS AND METHODS
Study Population and Setting
We conducted a retrospective cohort study during a single bronchiolitis season to identify factors predictive of a prolonged length of stay.
Children's Hospital of Wisconsin (CHW) is a 242‐bed tertiary care academic center. The charts of all infants discharged from CHW who met the following criteria were reviewed:
Age <365 days;
Admitted between November 1, 2004 and April 15, 2005;
Bronchiolitis diagnosis using the International Classification of Diseases, 9th edition (ICD‐9) discharge codes 466.11 (RSV bronchiolitis) or 466.19 (bronchiolitis from other organisms);
Placement on the CHW bronchiolitis treatment protocol. Major elements of this protocol include:
respiratory therapists (RT) assessments three times daily providing a standard means of evaluating severity of illness throughout the admission;
pre‐ and post‐intervention assessments.
Infants in this protocol differ from those not on the protocol; their average LOS is one day shorter and their care is more closely aligned with practices established in the Child Health Accountability Initiative (CHAI)25 and the American Academy of Pediatrics Guidelines,26 including: emphasis on clinical diagnosis rather than using laboratory and radiologic testing; avoiding routine bronchodilator use; and decreasing continuous pulse oximetry use. Only patients placed on the bronchiolitis treatment protocol were studied because these infants have a consistent model of care proven to be effective at CHW and other institutions25, 27; 70% of infants admitted to CHW with bronchiolitis were placed on the protocol. Common reasons for not placing infants on the protocol include: 1) the diagnosis of bronchiolitis was initially unclear; 2) the infant had chronic respiratory problems; and 3) physician preference.
Infants with events occurring during the admission not related to bronchiolitis and impacting LOS were excluded. Infants admitted or transferred to the ICU were included if placed on the bronchiolitis protocol; however, few ICU patients were placed on the protocol, as its intent is mainly for the general units.
Data Collected
Five trained abstractors (two were study authors) abstracted the following information from patient records: 1) baseline patient characteristics; 2) initial evaluation: respiratory rate, oxygen saturation, supplemental oxygen use, presence of increased work of breathing, weight, height, Waterlow percentile (percent of ideal body weight);28 3) fluid and nutritional information on hospital days 15; 4) respiratory assessments and treatments on hospital days 15 (clinical respiratory scores, respiratory rates, oxygen saturation, use of supplemental oxygen, medications received; 5) laboratory and imaging results; and 6) diagnoses. Each hospital day was defined as 0600 to 0559 the following day.
Clinical Respiratory Scores
The Children's Hospital of Wisconsin Respiratory Score (CHWRS) is a marker of overall respiratory status (not yet validated.) It contains six variables scored 03 based on degree: breath sounds, dyspnea, retractions, respiratory rate, heart rate, and supplemental oxygen. Scores range from 0 to 18, with lower scores representing less respiratory distress.
Outcomes and Analysis
The primary outcome was LOS, defined as the number of hours from the time a subject arrived on the hospital unit to time of last nursing documentation at time of discharge. The average LOS at CHW of 2.5 days is comparable to the lower end of that reported in the literature (2.85 days21, 22, 29, 30). LOS was dichotomized as short or prolonged, with prolonged LOS defined as 108 hours. We chose this length as it represents the 80th percentile LOS at our institution. Most physicians caring for infants with bronchiolitis at CHW use discharge criteria aligned with those in the hospitalist group's bronchiolitis clinical practice guideline,31 the SOFFFAR criteria: Sno longer dependent on nasopharyngeal suctioning; Ooff oxygen, or to baseline oxygen requirement; Ffamily agreeable to discharge; F follow‐up plan in place; FFeeding well enough to maintain hydration; Aif albuterol responsive, requiring treatments no more frequently than every six hours, Rrespiratory status acceptable (not too tachypneic or in respiratory distress).
Univariate Analysis
We examined the association between selected variables and LOS group (short or prolonged). Three groups of variables were studied: 1) variables identifiable upon admission (Table 1); 2) variables identifiable on hospital days 1 and 2 (Table 2); and 3) variables identifiable later in the admission. The variables evaluated were all non‐normally distributed and, therefore, the MannWhitney test was used to examine differences between groups with continuous or categorical variables. Dichotomous variables were compared using chi‐square or Fisher's exact test. SPSS (Chicago, IL) was used for these analyses. Because of multiple comparisons, 90% power and an alpha of 0.01 were used.
| Variable | Median (IQR), N [% of subjects] | P Value | |
|---|---|---|---|
| Short (N = 225) | Long (N = 47) | ||
| |||
| Age (days) | 134 (63‐225.5) | 139 (63‐240) | 0.86 |
| Gestation (weeks) | 40 (37‐40) | 39 (35‐40) | 0.07 |
| Race | |||
| White | 108 [48] | 23 [49] | 0.91 |
| Other | 117 [52] | 24 [51] | |
| Gender | |||
| Male | 121 [54] | 25 [53] | 0.94 |
| Respiratory support at birth | 22 [10] | 12 [26] | 0.003* |
| Chronic respiratory disease | 21 [9] | 8 [17] | 0.12 |
| Respiratory rate on admission | 56 (44‐64) | 56 (46‐66) | 0.58 |
| Cardiac conditions | 4 [2] | 3 [6] | 0.10 |
| Waterlow percent | 100 (92‐109) {n =203} | 96 (88‐107) {n =46} | 0.16 |
| Days of cough prior to admission | 4 (2‐6) {n =202} | 4 (2‐5) {n = 40} | 0.78 |
| Days of congestion prior to admission | 3 (1‐5) {n =183} | 3 (1‐5) {n =35} | 0.98 |
| Days of fever prior to admission | 1 (0‐3) {n =206} | 1 (0‐2) {n =43} | 0.50 |
| Days of decreased oral intake prior to admission | 1 (0‐2) {n =181} | 1 (0‐1) {n =36} | 0.44 |
| Variable | Median (IQR) or N [%] | P | Median (IQR) or N [%] | P | ||
|---|---|---|---|---|---|---|
| Short | Long | Short | Long | |||
| Hospital Day 1 | Hospital Day 2 | |||||
| ||||||
| Hours of supplemental oxygen | 3 (0‐10) | 11 (5‐17) | <0.001* | 3 (0‐19) | 24 (17‐24) | <0.001* |
| Minimum supplemental oxygen use (liters) | 0 (0‐0.1) | 0.25 (0‐0.5) | <0.001* | 0 (0‐0) | 0.2 (0‐0.5) | <0.001* |
| Maximum supplemental oxygen use (liters) | 0.5 (0‐1) | 0.75 (0.5‐1.5) | <0.001* | 0.2 (0‐0.5) | 1 (0.5‐1.5) | <0.001* |
| Minimum oxygen saturation (percent) | 94 (92‐96) | 94 (92‐96) | 0.89 | 94 (92‐95) | 93 (91‐94) | 0.001* |
| Maximum oxygen saturation (percent) | 99 (98‐100) | 100 (99‐100) | 0.23 | 100 (98‐100) | 100 (99‐100) | 0.37 |
| Minimum respiratory rate | 36 (32‐46) | 36 (32‐46) | 0.92 | 34 (30‐40) | 36 (32‐41) | 0.11 |
| Maximum respiratory rate | 53 (45‐62) | 56 (48‐64) | 0.14 | 55 (48‐64) | 63 (52‐75) | <0.001* |
| Mean respiratory score | 4 (3‐5.5) | 5 (4‐6.7) | 0.008* | 3.4 (2.7‐4.5) | 4.8 (3.7‐7) | <0.001* |
| Change in respiratory score | 0 (0‐1) | 0 (1‐1.5) | 0.3 | 1 (0‐2) | 0 (‐2‐2) | 0.022 |
| Number of times nasopharyngeal suctioned | 1 (0‐2) | 2 (1‐3) | 0.012 | 1 (0‐3) | 4 (2‐5) | <0.001* |
| Calories consumed (Kcal/kg/day) | 53 (22‐82) | 54 (33‐79) | 0.801 | 66 (47‐90) | 54 (21‐72) | 0.001* |
| ICU (% of subjects) | 4 (1.8%) | 2 (4.3%) | 0.28 | 4 (1.8%) | 5 (10.6%) | 0.009* |
Recursive Partitioning Analysis
We chose recursive partitioning as the method for model creation instead of multivariate linear regression in order to: 1) study multiple possible variable interactions without having to create multiple interaction terms; and 2) generate an easy‐to‐use flow diagram to identify infants at risk for prolonged LOS without having to use a complex formula generated by multivariate regression. In recursive partitioning methodology, the statistical program selects the variable among the set of candidate variables that best separates the first parent node with all subjects into short and prolonged stay intermediate nodes. The process is repeated with additional variables selected that further separate the intermediate nodes into short and prolonged stay nodes, until finally a flow diagram is generated, resulting in terminal nodes of predicted short and prolonged stay subjects. Recursive partitioning was performed using Salford Systems' CART software San Diego, CA. The minimum number of cases required in parent/emntermediate nodes was 20, and in terminal nodes was 5. Eighty percent of cases were randomly selected for the learning tree, and 20% in the test tree for cross‐validation.
Sixteen variables were considered a priori as potentially important in affecting LOS and were candidates for inclusion. These included five baseline variables (age, gestation, Waterlow percentile, presence of chronic respiratory disease, and a marker for missing Waterlow percentile) and 11 variables from hospital day 2 (kcal/kg/day consumed, hours of supplemental oxygen, maximum supplemental oxygen use, maximum oxygen saturation, maximum respiratory rate, minimum supplemental oxygen use, minimum oxygen saturation, minimum respiratory rate, mean clinical respiratory score, change in respiratory score, and nasopharyngeal suctioning frequency). Hospital day 2 variables were chosen rather than hospital day 1, because hospital day 1 was only a partial day in the hospital for the majority of subjects. Several aspects of oxygenation were studied because oxygen need has been consistently found to be an important predictor of LOS. We sought to discover which particular aspect of oxygen need was most important. For comparison, recursive partitioning was performed on the variable sets taken from the Michigan (weight, congenital heart disease, failure to thrive, gestational age, chronic pulmonary diseases, and early mechanical ventilation)21 and Rotterdam (weight and need for supplemental oxygen)24 Models.
This study was approved by the CHW Institutional Review Board.
RESULTS
Three hundred forty‐seven infants were admitted during the 20042005 bronchiolitis season, with 273 placed in the bronchiolitis treatment protocol. The charts of these 273 patients were reviewed. One was excluded because of gastrostomy tube placement during the admission. Of the remaining 272 patients, 47 (17.3%) had a LOS 108 hours. The median LOS was 59 hours (range 10334 hours). Two patients had missing data for caloric intake on days 1 and 2; and 23 patients did not have height obtained, therefore their Waterlow classification could not be determined. Historical details concerning fever, congestion, cough, and diminished caloric intake preceding admission were variably reported, resulting in a smaller sample size for these baseline characteristics as described in Table 1.
Univariate Analysis
Baseline characteristics of infants having short and prolonged LOS are described in Table 1. Groups were statistically similar except that the long stay group contained a significantly larger proportion of infants requiring respiratory support at birth (defined as needing intubation, continuous positive airway pressure [CPAP], or oxygen).
Table 2 describes selected variables on hospital days 1 and 2 in infants having short and prolonged LOS. On hospital day 1, infants in the prolonged LOS group had a significantly greater need for supplemental oxygen, and mean respiratory score. On hospital day 2, infants in the prolonged LOS group had a significantly greater need for supplemental oxygen maximum respiratory rate, mean respiratory score, and number of times they were suctioned. They had a significantly lower minimum oxygen saturation and caloric intake. On hospital day 2, the prolonged LOS group had a greater proportion of subjects in the ICU, on CPAP, and on the ventilator.
We examined two characteristics identifiable after the second hospital day. There was a significant difference in: a) the median number of discharge diagnoses in the short LOS group (two) vs the prolonged LOS group (three) (P < 0.001); and b) the presence of apnea during the admission in the short LOS group (0.1%) vs the prolonged LOS group (9%) (P = 0.009).
Recursive Partitioning Model
Figure 1 depicts the recursive partitioning model that best predicted LOS. Five variables were selected by the recursive partitioning model. Selected variables, in order of appearance (variable importance is related to order of appearance, ie, most important variable is first), were: hours of supplemental oxygen, maximum respiratory rate, minimum supplemental oxygen use, gestation, and kilocalories (kcal)/kilogram (kg)/day consumed. The characteristics of this model were: ROC 0.89 and 0.72 for the learning and test trees, respectively; sensitivity, 0.85; and specificity, 0.82
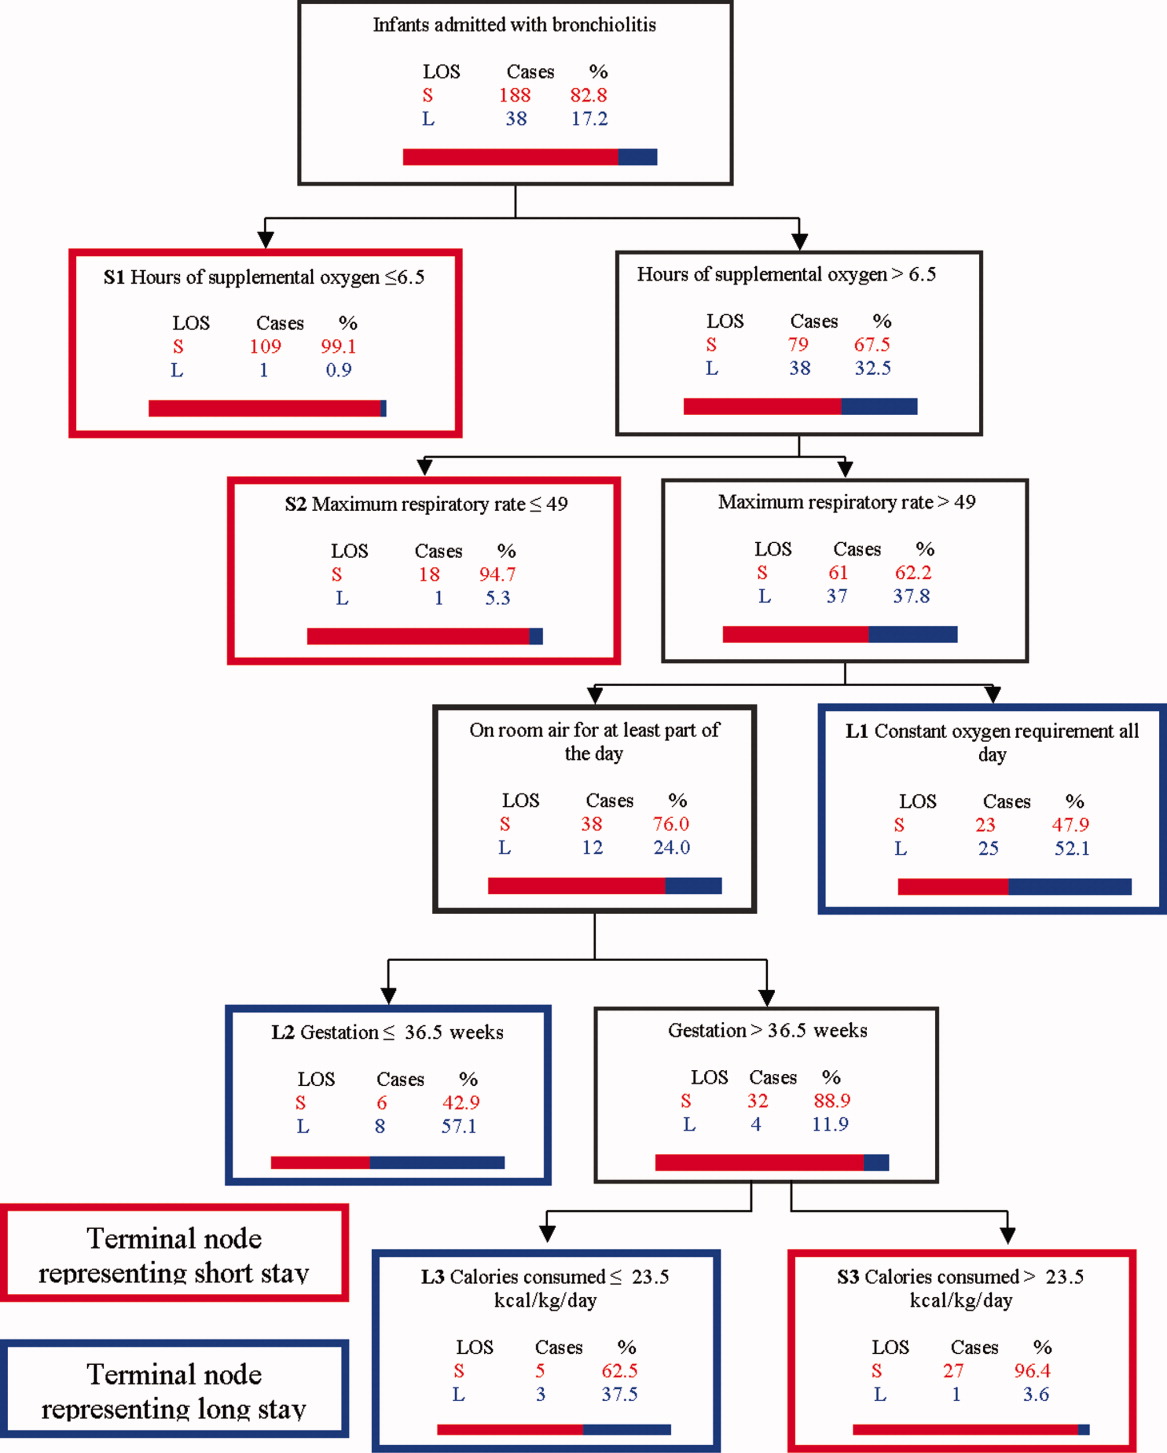
Infants predicted as having a short LOS had three distinct profiles labeled S1, S2, and S3 in Figure 1. The S1 group required 6.5 hours of oxygen. The S2 group required >6.5 hours of oxygen, but had a maximum respiratory rate 49. The S3 group required >6.5 hours of oxygen, had a maximum respiratory rate >49, but were >36.5 week gestation, and consumed >23.5 kcal/kg/day.
Infants predicted as having a long LOS had three distinct profiles labeled L1, L2, and L3 in Figure 1. The L1 group required >6.5 hours of supplemental oxygen, had a maximum respiratory rate >49, and required some level of oxygen support the entire day. The L2 group required >6.5 hours of supplemental oxygen, had a maximum respiratory rate >49, were on room air some portion of the day, but had a gestation 36.5 weeks. The L3 group required >6.5 hours of supplemental oxygen, had a maximum respiratory rate >49, were on room air for some portion of the day, had a gestation >36.5 weeks, but consumed 23.5 kcal/kg/day.
Table 3 compares the performance of our model (the Milwaukee Model), the Michigan Model, and the Rotterdam Model in predicting LOS group. Overall, the Milwaukee Model had the highest ROC 0.89/0.72 for the learning and test trees. All three models had good sensitivity (Milwaukee, 85%; Michigan, 85%), with the Rotterdam Model having the highest (98%). The Milwaukee Model also had good specificity (82%), while the Michigan and Rotterdam Models were less specific (46% and 44%).
| Model | Priors* | Sensitivity | Specificity | Learning Tree ROC | Test Tree ROC | |
|---|---|---|---|---|---|---|
| Long LOS | Short LOS | |||||
| ||||||
| Michigan | 0.5 | 0.5 | 0.85 | 0.46 | 0.69 | 0.56 |
| Rotterdam | 0.5 | 0.5 | 0.98 | 0.44 | 0.73 | 0.61 |
| Milwaukee | 0.5 | 0.5 | 0.85 | 0.82 | 0.89 | 0.72 |
DISCUSSION
We confirmed several previously recognized risk factors for prolonged LOS, including: apnea, at least part of the hospital stay in ICU, use of CPAP, mechanical ventilation, and prematurity. However, most patients admitted with bronchiolitis do not have these risk factors. The major contribution of this study is the evaluation of factors applicable to all patients admitted with bronchiolitis, and a more in‐depth analysis of clinical assessments performed on hospital days 1 and 2 than had been previously reported.
We did find strong associations between a number of clinical assessments and LOS. While some were apparent on day 1 of the admission, the number and degree of clinical differences between infants destined for a short vs prolonged stay were more apparent on hospital day 2. On this day, there were significant differences between the groups in the length and amount of oxygen received, oxygen saturation, maximum respiratory rate, respiratory scores, nasopharyngeal suctioning need, and caloric intake. Interestingly, it was noted the prolonged stay group had overall worsening or a lack of improvement in several clinical markers from day 1 to day 2, in areas where the short stay group showed improvements.
To our knowledge, the Milwaukee Model is the first bronchiolitis LOS prediction model to incorporate several clinical markers occurring early in the hospital stay. These clinical markers were found to be more effective predictors of LOS group in our study population than some of the traditional birth‐ and disease‐related risk factors previously reported. The model highlighted some important interactions among variables, and identified specific profiles of patients likely to have a short or prolonged LOS based on their day 2 clinical status.
The short LOS groups all shared one of the following three features: 1) low duration of oxygen use; 2) absence of tachypnea (tachypnea defined as a respiratory rate >60 in infants <2 months old and >50 for infants between 2 and 12 months old.3234); or 3) absence of severely diminished caloric intake. The prolonged LOS groups shared the common characteristics of higher duration of oxygen use and higher maximum respiratory rates. In addition to these two elements, each long stay group had either a constant oxygen requirement, prematurity (36.5 weeks), or very low caloric intake (<23.5 kcal/kg/day).
While all three models shared good sensitivity, the increased specificity of the Milwaukee Model limits the number of false positives (infants screening as destined for a prolonged LOS who actually will have a short LOS). For clinicians or researchers planning interventions for high‐risk infants, this greater specificity would reduce the number of infants who might unnecessarily receive those interventions. While there are limited proven therapies to hasten the recovery of patients with bronchiolits,35 many treatments and combinations of treatments are currently being used and studied. Nebulized hypertonic saline,36 airway secretion clearance modalities,37 and nutritional supplementation22, 38 are some examples of interventions that could be used and evaluated in infants screened as high risk for prolonged LOS. While it may have been better to identify short vs long stay immediately upon admission or after hospital day 1, it was the more clear separation between the short and long stay groups that occurred on day 2 that allowed us to develop an accurate predictive model. We believe that for infants destined to be in the hospital for at least three more days, a model based on hospital day 2 variables is worthwhile.
When evaluating the characteristics of the three models, it is important to note that they were initially studied in populations with some important differences. Only 11% of Milwaukee patients had chronic respiratory diseases, whereas the previously developed models were generated from a sample with a higher prevalence of chronic respiratory diseases (Michigan, 20%; Rotterdam, 23%). Only 3% of subjects needed placement in the ICU compared to higher rates in prior studies (Michigan, 15%; Rotterdam, 43.5%). In a population of patients with a lower prevalence of chronic respiratory diseases and need for ICU, early clinical markers may become more important in predicting LOS. While our model may generalize well in such a cohort of patients, it might not generalize as well to a cohort with a high prevalence of chronic lung disease and higher need for ICU. It is also important to note that the area under the ROC was lower in the test tree than the learning tree. This variation demonstrates the need for evaluating the performance of this model in additional populations.
This study has several limitations. First, it is a retrospective study of a single bronchiolitis season at a single institution. Second, the authors served as data abstractors and could have been biased, as they were not blinded. Third, four out of the five markers in our model are clinical markers that could vary based on clinical assessment skills and institutional practice. For example, oxygen use is dependent on the practice of nurses and respiratory therapists charged with regulating the oxygen delivery. However, the practice of initiating and weaning oxygen is fairly standardized at our institution. Fourth, environmental and social risk factors, such as day care attendance, school‐age siblings, and smoke exposure, can impact LOS but were not included in our model. Fifth, we do not have data on those infants not included in the bronchiolitis protocol. It is possible that they differed from those in protocol. Finally, six infants were either placed or transferred to the ICU on day 1, which may make them inherently different than the other infants in the model. However, four out of these six infants did go on to have a short stay, highlighting the fact that many other factors affect LOS.
We believe this model may be useful because the clinical markers it uses represent some of the key problems seen in bronchiolitis (poor oxygenation, tachypnea, and poor feeding). Careful assessment of these clinical markers can allow effective prediction of those infants likely to have a prolonged LOS. This early risk assessment could allow more effective targeting of interventions to help high‐risk infants.
CONCLUSIONS
There are important differences between infants with bronchiolitis having short and prolonged hospital stays, including several clinical markers identifiable on hospital day 2, such as the length and amount of oxygen received, minimum oxygen saturation, maximum respiratory rate, clinical respiratory scores, deep suctioning need, and caloric intake. The Milwaukee Model uses the number of hours of supplemental oxygen, respiratory rate, minimum supplemental oxygen use, gestation, and caloric intake to predict short or prolonged LOS. It performed well with a good ROC, sensitivity, and specificity in one population of infants with a low prevalence of chronic respiratory disease.
- ,.Clinical significance of respiratory syncytial virus.Postgrad Med.1964;35:460–465.
- ,,,,.Respiratory syncytial virus infection in young hospitalized children. Identification of risk patients and prevention of nosocomial spread by rapid diagnosis.Acta Paediatr Scand.1983;72(1):47–51.
- .Pathogenesis of bronchiolitis—epidemiologic considerations.Pediatr Res.1977;11(3 pt 2):239–243.
- ,,.Respiratory syncytial virus infection in children with bronchopulmonary dysplasia.Pediatrics.1988;82(2):199–203.
- ,,, et al.Respiratory syncytial viral infection in children with compromised immune function.N Engl J Med.1986;315(2):77–81.
- ,,,,.Risk of secondary bacterial infection in infants hospitalized with respiratory syncytial viral infection.J Pediatr.1988;113(2):266–271.
- ,,,,,.Respiratory syncytial viral infection in infants with congenital heart disease.N Engl J Med.1982;307(7):397–400.
- ,,, et al.Hospitalized children with respiratory syncytial virus infection and neuromuscular impairment face an increased risk of a complicated course.Pediatr Infect Dis J.2007;26(6):485–491.
- ,,.Rehospitalization for respiratory illness in infants of less than 32 weeks' gestation.Pediatrics.1991;88(3):527–532.
- ,,, et al.Respiratory syncytial virus (RSV) immune globulin intravenous therapy for RSV lower respiratory tract infection in infants and young children at high risk for severe RSV infections: Respiratory Syncytial Virus Immune Globulin Study Group.Pediatrics.1997;99(3):454–461.
- ,,,,.Risk factors for bronchiolitis‐associated deaths among infants in the United States.Pediatr Infect Dis J.2003;22(6):483–490.
- ,.Risk factors for severe respiratory syncytial virus infection in infants.Respir Med.2002;96(suppl B):S9–S14.
- ,,,,.Rehospitalization for respiratory syncytial virus among premature infants.Pediatrics.1999;104(4 pt 1):894–899.
- ,,,,.Risk of respiratory syncytial virus infection for infants from low‐income families in relationship to age, sex, ethnic group, and maternal antibody level.J Pediatr.1981;98(5):708–715.
- ,,,.Preterm twins and triplets. A high‐risk group for severe respiratory syncytial virus infection.Am J Dis Child.1993;147(3):303–306.
- ,,, et al.Rehospitalization because of respiratory syncytial virus infection in premature infants younger than 33 weeks of gestation: a prospective study. IRIS Study Group.Pediatr Infect Dis J.2000;19(7):592–597.
- ,.Parental smoking, presence of older siblings, and family history of asthma increase risk of bronchiolitis.Am J Dis Child.1986;140(8):806–812.
- ,,,,.Role of respiratory syncytial virus in early hospitalizations for respiratory distress of young infants with cystic fibrosis.J Pediatr.1988;113(5):826–830.
- ,,, et al.Variable morbidity of respiratory syncytial virus infection in patients with underlying lung disease: a review of the PICNIC RSV database. Pediatric Investigators Collaborative Network on Infections in Canada.Pediatr Infect Dis J.1999;18(10):866–869.
- ,,,,.Rates of hospitalization for respiratory syncytial virus infection among children in Medicaid.J Pediatr.2000;137(6):865–870.
- ,.Severity of illness models for respiratory syncytial virus‐associated hospitalization.Am J Respir Crit Care Med.1999;159(4 pt 1):1234–1240.
- ,.Effect of oxygen supplementation on length of stay for infants hospitalized with acute viral bronchiolitis.Pediatrics.2008;121(3):470–475.
- ,,.Pediatric Investigators Collaborative Network on Infections in Canada (PICNIC) prospective study of risk factors and outcomes in patients hospitalized with respiratory syncytial viral lower respiratory tract infection.J Pediatr.1995;126(2):212–219.
- ,,,.Prediction of duration of hospitalization in respiratory syncytial virus infection.Pediatr Pulmonol.2002;33(6):453–457.
- ,,,,,.Impact of a bronchiolitis guideline: a multisite demonstration project.Chest.2002;121(6):1789–1797.
- , , , , , , , , , Diagnosis and management of bronchiolitis.Pediatrics.2006;118(4):1774–1793.
- ,,, et al.Evaluation of an evidence‐based guideline for bronchiolitis.Pediatrics.1999;104(6):1334–1341.
- .Classification and definition of protein‐calorie malnutrition.Br Med J.1972;3(5826):566–569.
- ,,,,.Inpatient care for uncomplicated bronchiolitis: comparison with Milliman and Robertson guidelines.Arch Pediatr Adolesc Med.2001;155(12):1323–1327.
- ,,,.Impact of pulse oximetry and oxygen therapy on length of stay in bronchiolitis hospitalizations.Arch Pediatr Adolesc Med.2004;158(6):527–530.
- .Bronchiolitis clinical practice guideline.Children's Hospital of Wisconsin Intranet;2007. http://clinicalpractice.chw.org/display/displayFile.asp?docid=393185(2):319–336.
- ,.The rational clinical examination. Does this infant have pneumonia?JAMA.1998;279(4):308–313.
- ,.Focused ethnographic studies in the WHO Programme for the Control of Acute Respiratory Infections.Med Anthropol.1994;15(4):409–424.
- ,.Bronchiolitis: recent evidence on diagnosis and management.Pediatrics.125(2):342–349.
- ,,,.Nebulized hypertonic saline solution for acute bronchiolitis in infants.Cochrane Database Syst Rev.2008(4):CD006458.
- .Airway clearance applications in infants and children.Respir Care.2007;52(10):1382–1391.
- ,.Immunonutrition in critically ill patients: a systematic review and analysis of the literature.Intensive Care Med.2008;34(11):1980–1990.
Prior studies have identified risk factors for increased severity of illness, readmission, or prolonged length of stay (LOS) in infants admitted with bronchiolitis.123 These risk factors include birth‐related factors (prematurity, birth within six months of respiratory syncytial virus [RSV] season, discharge from the neonatal intensive care unit during winter, multiple birth infant), environmental factors (day care attendance, school‐age siblings, smoke exposure), and underlying diseases (chronic lung disease and other pulmonary conditions, failure to thrive (FTT), congenital heart disease, immunologic disorders, and neuromuscular disease).123 Additional risk factors occurring during the bronchiolitis course that have been associated with prolonged hospital course are mechanical ventilation, intensive care unit (ICU) admission, hypoxia on admission, apnea, feeding problems, and duration of supplemental oxygen.2123
Having a reliable model to identify infants at high risk for prolonged LOS early in the course of an admission would be helpful, both for clinical care and for studies of interventions designed to reduce LOS. Prior attempts at developing a model have yielded mixed results. The Michigan Logistic Regression Model displayed excellent predictive ability with an area under the receiver‐operator curve (ROC) of 0.88 using variables including prematurity, FTT, pulmonary disease, other comorbid diseases, and early mechanical ventilation.21 However, when applied to another patient population it did not perform as well. The Rotterdam Model using the variables of weight and supplemental oxygen had an ROC of 0.65.24
Prior prediction models have focused more on birth‐ and disease‐related risk factors than on hospital course factors, particularly common clinical assessments including respiratory status and caloric intake. An additional limitation of prior models is some loss of ability to study the interaction between various predictor variables when using multivariate regression methods.
Our aims were: 1) to study the associations of various clinical markers identifiable during the first two days of the hospital admission with LOS; and 2) to develop a LOS prediction model, using both previously identified risk factors and more detailed clinical data from the first two days of the hospital admission.
MATERIALS AND METHODS
Study Population and Setting
We conducted a retrospective cohort study during a single bronchiolitis season to identify factors predictive of a prolonged length of stay.
Children's Hospital of Wisconsin (CHW) is a 242‐bed tertiary care academic center. The charts of all infants discharged from CHW who met the following criteria were reviewed:
Age <365 days;
Admitted between November 1, 2004 and April 15, 2005;
Bronchiolitis diagnosis using the International Classification of Diseases, 9th edition (ICD‐9) discharge codes 466.11 (RSV bronchiolitis) or 466.19 (bronchiolitis from other organisms);
Placement on the CHW bronchiolitis treatment protocol. Major elements of this protocol include:
respiratory therapists (RT) assessments three times daily providing a standard means of evaluating severity of illness throughout the admission;
pre‐ and post‐intervention assessments.
Infants in this protocol differ from those not on the protocol; their average LOS is one day shorter and their care is more closely aligned with practices established in the Child Health Accountability Initiative (CHAI)25 and the American Academy of Pediatrics Guidelines,26 including: emphasis on clinical diagnosis rather than using laboratory and radiologic testing; avoiding routine bronchodilator use; and decreasing continuous pulse oximetry use. Only patients placed on the bronchiolitis treatment protocol were studied because these infants have a consistent model of care proven to be effective at CHW and other institutions25, 27; 70% of infants admitted to CHW with bronchiolitis were placed on the protocol. Common reasons for not placing infants on the protocol include: 1) the diagnosis of bronchiolitis was initially unclear; 2) the infant had chronic respiratory problems; and 3) physician preference.
Infants with events occurring during the admission not related to bronchiolitis and impacting LOS were excluded. Infants admitted or transferred to the ICU were included if placed on the bronchiolitis protocol; however, few ICU patients were placed on the protocol, as its intent is mainly for the general units.
Data Collected
Five trained abstractors (two were study authors) abstracted the following information from patient records: 1) baseline patient characteristics; 2) initial evaluation: respiratory rate, oxygen saturation, supplemental oxygen use, presence of increased work of breathing, weight, height, Waterlow percentile (percent of ideal body weight);28 3) fluid and nutritional information on hospital days 15; 4) respiratory assessments and treatments on hospital days 15 (clinical respiratory scores, respiratory rates, oxygen saturation, use of supplemental oxygen, medications received; 5) laboratory and imaging results; and 6) diagnoses. Each hospital day was defined as 0600 to 0559 the following day.
Clinical Respiratory Scores
The Children's Hospital of Wisconsin Respiratory Score (CHWRS) is a marker of overall respiratory status (not yet validated.) It contains six variables scored 03 based on degree: breath sounds, dyspnea, retractions, respiratory rate, heart rate, and supplemental oxygen. Scores range from 0 to 18, with lower scores representing less respiratory distress.
Outcomes and Analysis
The primary outcome was LOS, defined as the number of hours from the time a subject arrived on the hospital unit to time of last nursing documentation at time of discharge. The average LOS at CHW of 2.5 days is comparable to the lower end of that reported in the literature (2.85 days21, 22, 29, 30). LOS was dichotomized as short or prolonged, with prolonged LOS defined as 108 hours. We chose this length as it represents the 80th percentile LOS at our institution. Most physicians caring for infants with bronchiolitis at CHW use discharge criteria aligned with those in the hospitalist group's bronchiolitis clinical practice guideline,31 the SOFFFAR criteria: Sno longer dependent on nasopharyngeal suctioning; Ooff oxygen, or to baseline oxygen requirement; Ffamily agreeable to discharge; F follow‐up plan in place; FFeeding well enough to maintain hydration; Aif albuterol responsive, requiring treatments no more frequently than every six hours, Rrespiratory status acceptable (not too tachypneic or in respiratory distress).
Univariate Analysis
We examined the association between selected variables and LOS group (short or prolonged). Three groups of variables were studied: 1) variables identifiable upon admission (Table 1); 2) variables identifiable on hospital days 1 and 2 (Table 2); and 3) variables identifiable later in the admission. The variables evaluated were all non‐normally distributed and, therefore, the MannWhitney test was used to examine differences between groups with continuous or categorical variables. Dichotomous variables were compared using chi‐square or Fisher's exact test. SPSS (Chicago, IL) was used for these analyses. Because of multiple comparisons, 90% power and an alpha of 0.01 were used.
| Variable | Median (IQR), N [% of subjects] | P Value | |
|---|---|---|---|
| Short (N = 225) | Long (N = 47) | ||
| |||
| Age (days) | 134 (63‐225.5) | 139 (63‐240) | 0.86 |
| Gestation (weeks) | 40 (37‐40) | 39 (35‐40) | 0.07 |
| Race | |||
| White | 108 [48] | 23 [49] | 0.91 |
| Other | 117 [52] | 24 [51] | |
| Gender | |||
| Male | 121 [54] | 25 [53] | 0.94 |
| Respiratory support at birth | 22 [10] | 12 [26] | 0.003* |
| Chronic respiratory disease | 21 [9] | 8 [17] | 0.12 |
| Respiratory rate on admission | 56 (44‐64) | 56 (46‐66) | 0.58 |
| Cardiac conditions | 4 [2] | 3 [6] | 0.10 |
| Waterlow percent | 100 (92‐109) {n =203} | 96 (88‐107) {n =46} | 0.16 |
| Days of cough prior to admission | 4 (2‐6) {n =202} | 4 (2‐5) {n = 40} | 0.78 |
| Days of congestion prior to admission | 3 (1‐5) {n =183} | 3 (1‐5) {n =35} | 0.98 |
| Days of fever prior to admission | 1 (0‐3) {n =206} | 1 (0‐2) {n =43} | 0.50 |
| Days of decreased oral intake prior to admission | 1 (0‐2) {n =181} | 1 (0‐1) {n =36} | 0.44 |
| Variable | Median (IQR) or N [%] | P | Median (IQR) or N [%] | P | ||
|---|---|---|---|---|---|---|
| Short | Long | Short | Long | |||
| Hospital Day 1 | Hospital Day 2 | |||||
| ||||||
| Hours of supplemental oxygen | 3 (0‐10) | 11 (5‐17) | <0.001* | 3 (0‐19) | 24 (17‐24) | <0.001* |
| Minimum supplemental oxygen use (liters) | 0 (0‐0.1) | 0.25 (0‐0.5) | <0.001* | 0 (0‐0) | 0.2 (0‐0.5) | <0.001* |
| Maximum supplemental oxygen use (liters) | 0.5 (0‐1) | 0.75 (0.5‐1.5) | <0.001* | 0.2 (0‐0.5) | 1 (0.5‐1.5) | <0.001* |
| Minimum oxygen saturation (percent) | 94 (92‐96) | 94 (92‐96) | 0.89 | 94 (92‐95) | 93 (91‐94) | 0.001* |
| Maximum oxygen saturation (percent) | 99 (98‐100) | 100 (99‐100) | 0.23 | 100 (98‐100) | 100 (99‐100) | 0.37 |
| Minimum respiratory rate | 36 (32‐46) | 36 (32‐46) | 0.92 | 34 (30‐40) | 36 (32‐41) | 0.11 |
| Maximum respiratory rate | 53 (45‐62) | 56 (48‐64) | 0.14 | 55 (48‐64) | 63 (52‐75) | <0.001* |
| Mean respiratory score | 4 (3‐5.5) | 5 (4‐6.7) | 0.008* | 3.4 (2.7‐4.5) | 4.8 (3.7‐7) | <0.001* |
| Change in respiratory score | 0 (0‐1) | 0 (1‐1.5) | 0.3 | 1 (0‐2) | 0 (‐2‐2) | 0.022 |
| Number of times nasopharyngeal suctioned | 1 (0‐2) | 2 (1‐3) | 0.012 | 1 (0‐3) | 4 (2‐5) | <0.001* |
| Calories consumed (Kcal/kg/day) | 53 (22‐82) | 54 (33‐79) | 0.801 | 66 (47‐90) | 54 (21‐72) | 0.001* |
| ICU (% of subjects) | 4 (1.8%) | 2 (4.3%) | 0.28 | 4 (1.8%) | 5 (10.6%) | 0.009* |
Recursive Partitioning Analysis
We chose recursive partitioning as the method for model creation instead of multivariate linear regression in order to: 1) study multiple possible variable interactions without having to create multiple interaction terms; and 2) generate an easy‐to‐use flow diagram to identify infants at risk for prolonged LOS without having to use a complex formula generated by multivariate regression. In recursive partitioning methodology, the statistical program selects the variable among the set of candidate variables that best separates the first parent node with all subjects into short and prolonged stay intermediate nodes. The process is repeated with additional variables selected that further separate the intermediate nodes into short and prolonged stay nodes, until finally a flow diagram is generated, resulting in terminal nodes of predicted short and prolonged stay subjects. Recursive partitioning was performed using Salford Systems' CART software San Diego, CA. The minimum number of cases required in parent/emntermediate nodes was 20, and in terminal nodes was 5. Eighty percent of cases were randomly selected for the learning tree, and 20% in the test tree for cross‐validation.
Sixteen variables were considered a priori as potentially important in affecting LOS and were candidates for inclusion. These included five baseline variables (age, gestation, Waterlow percentile, presence of chronic respiratory disease, and a marker for missing Waterlow percentile) and 11 variables from hospital day 2 (kcal/kg/day consumed, hours of supplemental oxygen, maximum supplemental oxygen use, maximum oxygen saturation, maximum respiratory rate, minimum supplemental oxygen use, minimum oxygen saturation, minimum respiratory rate, mean clinical respiratory score, change in respiratory score, and nasopharyngeal suctioning frequency). Hospital day 2 variables were chosen rather than hospital day 1, because hospital day 1 was only a partial day in the hospital for the majority of subjects. Several aspects of oxygenation were studied because oxygen need has been consistently found to be an important predictor of LOS. We sought to discover which particular aspect of oxygen need was most important. For comparison, recursive partitioning was performed on the variable sets taken from the Michigan (weight, congenital heart disease, failure to thrive, gestational age, chronic pulmonary diseases, and early mechanical ventilation)21 and Rotterdam (weight and need for supplemental oxygen)24 Models.
This study was approved by the CHW Institutional Review Board.
RESULTS
Three hundred forty‐seven infants were admitted during the 20042005 bronchiolitis season, with 273 placed in the bronchiolitis treatment protocol. The charts of these 273 patients were reviewed. One was excluded because of gastrostomy tube placement during the admission. Of the remaining 272 patients, 47 (17.3%) had a LOS 108 hours. The median LOS was 59 hours (range 10334 hours). Two patients had missing data for caloric intake on days 1 and 2; and 23 patients did not have height obtained, therefore their Waterlow classification could not be determined. Historical details concerning fever, congestion, cough, and diminished caloric intake preceding admission were variably reported, resulting in a smaller sample size for these baseline characteristics as described in Table 1.
Univariate Analysis
Baseline characteristics of infants having short and prolonged LOS are described in Table 1. Groups were statistically similar except that the long stay group contained a significantly larger proportion of infants requiring respiratory support at birth (defined as needing intubation, continuous positive airway pressure [CPAP], or oxygen).
Table 2 describes selected variables on hospital days 1 and 2 in infants having short and prolonged LOS. On hospital day 1, infants in the prolonged LOS group had a significantly greater need for supplemental oxygen, and mean respiratory score. On hospital day 2, infants in the prolonged LOS group had a significantly greater need for supplemental oxygen maximum respiratory rate, mean respiratory score, and number of times they were suctioned. They had a significantly lower minimum oxygen saturation and caloric intake. On hospital day 2, the prolonged LOS group had a greater proportion of subjects in the ICU, on CPAP, and on the ventilator.
We examined two characteristics identifiable after the second hospital day. There was a significant difference in: a) the median number of discharge diagnoses in the short LOS group (two) vs the prolonged LOS group (three) (P < 0.001); and b) the presence of apnea during the admission in the short LOS group (0.1%) vs the prolonged LOS group (9%) (P = 0.009).
Recursive Partitioning Model
Figure 1 depicts the recursive partitioning model that best predicted LOS. Five variables were selected by the recursive partitioning model. Selected variables, in order of appearance (variable importance is related to order of appearance, ie, most important variable is first), were: hours of supplemental oxygen, maximum respiratory rate, minimum supplemental oxygen use, gestation, and kilocalories (kcal)/kilogram (kg)/day consumed. The characteristics of this model were: ROC 0.89 and 0.72 for the learning and test trees, respectively; sensitivity, 0.85; and specificity, 0.82
Infants predicted as having a short LOS had three distinct profiles labeled S1, S2, and S3 in Figure 1. The S1 group required 6.5 hours of oxygen. The S2 group required >6.5 hours of oxygen, but had a maximum respiratory rate 49. The S3 group required >6.5 hours of oxygen, had a maximum respiratory rate >49, but were >36.5 week gestation, and consumed >23.5 kcal/kg/day.
Infants predicted as having a long LOS had three distinct profiles labeled L1, L2, and L3 in Figure 1. The L1 group required >6.5 hours of supplemental oxygen, had a maximum respiratory rate >49, and required some level of oxygen support the entire day. The L2 group required >6.5 hours of supplemental oxygen, had a maximum respiratory rate >49, were on room air some portion of the day, but had a gestation 36.5 weeks. The L3 group required >6.5 hours of supplemental oxygen, had a maximum respiratory rate >49, were on room air for some portion of the day, had a gestation >36.5 weeks, but consumed 23.5 kcal/kg/day.
Table 3 compares the performance of our model (the Milwaukee Model), the Michigan Model, and the Rotterdam Model in predicting LOS group. Overall, the Milwaukee Model had the highest ROC 0.89/0.72 for the learning and test trees. All three models had good sensitivity (Milwaukee, 85%; Michigan, 85%), with the Rotterdam Model having the highest (98%). The Milwaukee Model also had good specificity (82%), while the Michigan and Rotterdam Models were less specific (46% and 44%).
| Model | Priors* | Sensitivity | Specificity | Learning Tree ROC | Test Tree ROC | |
|---|---|---|---|---|---|---|
| Long LOS | Short LOS | |||||
| ||||||
| Michigan | 0.5 | 0.5 | 0.85 | 0.46 | 0.69 | 0.56 |
| Rotterdam | 0.5 | 0.5 | 0.98 | 0.44 | 0.73 | 0.61 |
| Milwaukee | 0.5 | 0.5 | 0.85 | 0.82 | 0.89 | 0.72 |
DISCUSSION
We confirmed several previously recognized risk factors for prolonged LOS, including: apnea, at least part of the hospital stay in ICU, use of CPAP, mechanical ventilation, and prematurity. However, most patients admitted with bronchiolitis do not have these risk factors. The major contribution of this study is the evaluation of factors applicable to all patients admitted with bronchiolitis, and a more in‐depth analysis of clinical assessments performed on hospital days 1 and 2 than had been previously reported.
We did find strong associations between a number of clinical assessments and LOS. While some were apparent on day 1 of the admission, the number and degree of clinical differences between infants destined for a short vs prolonged stay were more apparent on hospital day 2. On this day, there were significant differences between the groups in the length and amount of oxygen received, oxygen saturation, maximum respiratory rate, respiratory scores, nasopharyngeal suctioning need, and caloric intake. Interestingly, it was noted the prolonged stay group had overall worsening or a lack of improvement in several clinical markers from day 1 to day 2, in areas where the short stay group showed improvements.
To our knowledge, the Milwaukee Model is the first bronchiolitis LOS prediction model to incorporate several clinical markers occurring early in the hospital stay. These clinical markers were found to be more effective predictors of LOS group in our study population than some of the traditional birth‐ and disease‐related risk factors previously reported. The model highlighted some important interactions among variables, and identified specific profiles of patients likely to have a short or prolonged LOS based on their day 2 clinical status.
The short LOS groups all shared one of the following three features: 1) low duration of oxygen use; 2) absence of tachypnea (tachypnea defined as a respiratory rate >60 in infants <2 months old and >50 for infants between 2 and 12 months old.3234); or 3) absence of severely diminished caloric intake. The prolonged LOS groups shared the common characteristics of higher duration of oxygen use and higher maximum respiratory rates. In addition to these two elements, each long stay group had either a constant oxygen requirement, prematurity (36.5 weeks), or very low caloric intake (<23.5 kcal/kg/day).
While all three models shared good sensitivity, the increased specificity of the Milwaukee Model limits the number of false positives (infants screening as destined for a prolonged LOS who actually will have a short LOS). For clinicians or researchers planning interventions for high‐risk infants, this greater specificity would reduce the number of infants who might unnecessarily receive those interventions. While there are limited proven therapies to hasten the recovery of patients with bronchiolits,35 many treatments and combinations of treatments are currently being used and studied. Nebulized hypertonic saline,36 airway secretion clearance modalities,37 and nutritional supplementation22, 38 are some examples of interventions that could be used and evaluated in infants screened as high risk for prolonged LOS. While it may have been better to identify short vs long stay immediately upon admission or after hospital day 1, it was the more clear separation between the short and long stay groups that occurred on day 2 that allowed us to develop an accurate predictive model. We believe that for infants destined to be in the hospital for at least three more days, a model based on hospital day 2 variables is worthwhile.
When evaluating the characteristics of the three models, it is important to note that they were initially studied in populations with some important differences. Only 11% of Milwaukee patients had chronic respiratory diseases, whereas the previously developed models were generated from a sample with a higher prevalence of chronic respiratory diseases (Michigan, 20%; Rotterdam, 23%). Only 3% of subjects needed placement in the ICU compared to higher rates in prior studies (Michigan, 15%; Rotterdam, 43.5%). In a population of patients with a lower prevalence of chronic respiratory diseases and need for ICU, early clinical markers may become more important in predicting LOS. While our model may generalize well in such a cohort of patients, it might not generalize as well to a cohort with a high prevalence of chronic lung disease and higher need for ICU. It is also important to note that the area under the ROC was lower in the test tree than the learning tree. This variation demonstrates the need for evaluating the performance of this model in additional populations.
This study has several limitations. First, it is a retrospective study of a single bronchiolitis season at a single institution. Second, the authors served as data abstractors and could have been biased, as they were not blinded. Third, four out of the five markers in our model are clinical markers that could vary based on clinical assessment skills and institutional practice. For example, oxygen use is dependent on the practice of nurses and respiratory therapists charged with regulating the oxygen delivery. However, the practice of initiating and weaning oxygen is fairly standardized at our institution. Fourth, environmental and social risk factors, such as day care attendance, school‐age siblings, and smoke exposure, can impact LOS but were not included in our model. Fifth, we do not have data on those infants not included in the bronchiolitis protocol. It is possible that they differed from those in protocol. Finally, six infants were either placed or transferred to the ICU on day 1, which may make them inherently different than the other infants in the model. However, four out of these six infants did go on to have a short stay, highlighting the fact that many other factors affect LOS.
We believe this model may be useful because the clinical markers it uses represent some of the key problems seen in bronchiolitis (poor oxygenation, tachypnea, and poor feeding). Careful assessment of these clinical markers can allow effective prediction of those infants likely to have a prolonged LOS. This early risk assessment could allow more effective targeting of interventions to help high‐risk infants.
CONCLUSIONS
There are important differences between infants with bronchiolitis having short and prolonged hospital stays, including several clinical markers identifiable on hospital day 2, such as the length and amount of oxygen received, minimum oxygen saturation, maximum respiratory rate, clinical respiratory scores, deep suctioning need, and caloric intake. The Milwaukee Model uses the number of hours of supplemental oxygen, respiratory rate, minimum supplemental oxygen use, gestation, and caloric intake to predict short or prolonged LOS. It performed well with a good ROC, sensitivity, and specificity in one population of infants with a low prevalence of chronic respiratory disease.
Prior studies have identified risk factors for increased severity of illness, readmission, or prolonged length of stay (LOS) in infants admitted with bronchiolitis.123 These risk factors include birth‐related factors (prematurity, birth within six months of respiratory syncytial virus [RSV] season, discharge from the neonatal intensive care unit during winter, multiple birth infant), environmental factors (day care attendance, school‐age siblings, smoke exposure), and underlying diseases (chronic lung disease and other pulmonary conditions, failure to thrive (FTT), congenital heart disease, immunologic disorders, and neuromuscular disease).123 Additional risk factors occurring during the bronchiolitis course that have been associated with prolonged hospital course are mechanical ventilation, intensive care unit (ICU) admission, hypoxia on admission, apnea, feeding problems, and duration of supplemental oxygen.2123
Having a reliable model to identify infants at high risk for prolonged LOS early in the course of an admission would be helpful, both for clinical care and for studies of interventions designed to reduce LOS. Prior attempts at developing a model have yielded mixed results. The Michigan Logistic Regression Model displayed excellent predictive ability with an area under the receiver‐operator curve (ROC) of 0.88 using variables including prematurity, FTT, pulmonary disease, other comorbid diseases, and early mechanical ventilation.21 However, when applied to another patient population it did not perform as well. The Rotterdam Model using the variables of weight and supplemental oxygen had an ROC of 0.65.24
Prior prediction models have focused more on birth‐ and disease‐related risk factors than on hospital course factors, particularly common clinical assessments including respiratory status and caloric intake. An additional limitation of prior models is some loss of ability to study the interaction between various predictor variables when using multivariate regression methods.
Our aims were: 1) to study the associations of various clinical markers identifiable during the first two days of the hospital admission with LOS; and 2) to develop a LOS prediction model, using both previously identified risk factors and more detailed clinical data from the first two days of the hospital admission.
MATERIALS AND METHODS
Study Population and Setting
We conducted a retrospective cohort study during a single bronchiolitis season to identify factors predictive of a prolonged length of stay.
Children's Hospital of Wisconsin (CHW) is a 242‐bed tertiary care academic center. The charts of all infants discharged from CHW who met the following criteria were reviewed:
Age <365 days;
Admitted between November 1, 2004 and April 15, 2005;
Bronchiolitis diagnosis using the International Classification of Diseases, 9th edition (ICD‐9) discharge codes 466.11 (RSV bronchiolitis) or 466.19 (bronchiolitis from other organisms);
Placement on the CHW bronchiolitis treatment protocol. Major elements of this protocol include:
respiratory therapists (RT) assessments three times daily providing a standard means of evaluating severity of illness throughout the admission;
pre‐ and post‐intervention assessments.
Infants in this protocol differ from those not on the protocol; their average LOS is one day shorter and their care is more closely aligned with practices established in the Child Health Accountability Initiative (CHAI)25 and the American Academy of Pediatrics Guidelines,26 including: emphasis on clinical diagnosis rather than using laboratory and radiologic testing; avoiding routine bronchodilator use; and decreasing continuous pulse oximetry use. Only patients placed on the bronchiolitis treatment protocol were studied because these infants have a consistent model of care proven to be effective at CHW and other institutions25, 27; 70% of infants admitted to CHW with bronchiolitis were placed on the protocol. Common reasons for not placing infants on the protocol include: 1) the diagnosis of bronchiolitis was initially unclear; 2) the infant had chronic respiratory problems; and 3) physician preference.
Infants with events occurring during the admission not related to bronchiolitis and impacting LOS were excluded. Infants admitted or transferred to the ICU were included if placed on the bronchiolitis protocol; however, few ICU patients were placed on the protocol, as its intent is mainly for the general units.
Data Collected
Five trained abstractors (two were study authors) abstracted the following information from patient records: 1) baseline patient characteristics; 2) initial evaluation: respiratory rate, oxygen saturation, supplemental oxygen use, presence of increased work of breathing, weight, height, Waterlow percentile (percent of ideal body weight);28 3) fluid and nutritional information on hospital days 15; 4) respiratory assessments and treatments on hospital days 15 (clinical respiratory scores, respiratory rates, oxygen saturation, use of supplemental oxygen, medications received; 5) laboratory and imaging results; and 6) diagnoses. Each hospital day was defined as 0600 to 0559 the following day.
Clinical Respiratory Scores
The Children's Hospital of Wisconsin Respiratory Score (CHWRS) is a marker of overall respiratory status (not yet validated.) It contains six variables scored 03 based on degree: breath sounds, dyspnea, retractions, respiratory rate, heart rate, and supplemental oxygen. Scores range from 0 to 18, with lower scores representing less respiratory distress.
Outcomes and Analysis
The primary outcome was LOS, defined as the number of hours from the time a subject arrived on the hospital unit to time of last nursing documentation at time of discharge. The average LOS at CHW of 2.5 days is comparable to the lower end of that reported in the literature (2.85 days21, 22, 29, 30). LOS was dichotomized as short or prolonged, with prolonged LOS defined as 108 hours. We chose this length as it represents the 80th percentile LOS at our institution. Most physicians caring for infants with bronchiolitis at CHW use discharge criteria aligned with those in the hospitalist group's bronchiolitis clinical practice guideline,31 the SOFFFAR criteria: Sno longer dependent on nasopharyngeal suctioning; Ooff oxygen, or to baseline oxygen requirement; Ffamily agreeable to discharge; F follow‐up plan in place; FFeeding well enough to maintain hydration; Aif albuterol responsive, requiring treatments no more frequently than every six hours, Rrespiratory status acceptable (not too tachypneic or in respiratory distress).
Univariate Analysis
We examined the association between selected variables and LOS group (short or prolonged). Three groups of variables were studied: 1) variables identifiable upon admission (Table 1); 2) variables identifiable on hospital days 1 and 2 (Table 2); and 3) variables identifiable later in the admission. The variables evaluated were all non‐normally distributed and, therefore, the MannWhitney test was used to examine differences between groups with continuous or categorical variables. Dichotomous variables were compared using chi‐square or Fisher's exact test. SPSS (Chicago, IL) was used for these analyses. Because of multiple comparisons, 90% power and an alpha of 0.01 were used.
| Variable | Median (IQR), N [% of subjects] | P Value | |
|---|---|---|---|
| Short (N = 225) | Long (N = 47) | ||
| |||
| Age (days) | 134 (63‐225.5) | 139 (63‐240) | 0.86 |
| Gestation (weeks) | 40 (37‐40) | 39 (35‐40) | 0.07 |
| Race | |||
| White | 108 [48] | 23 [49] | 0.91 |
| Other | 117 [52] | 24 [51] | |
| Gender | |||
| Male | 121 [54] | 25 [53] | 0.94 |
| Respiratory support at birth | 22 [10] | 12 [26] | 0.003* |
| Chronic respiratory disease | 21 [9] | 8 [17] | 0.12 |
| Respiratory rate on admission | 56 (44‐64) | 56 (46‐66) | 0.58 |
| Cardiac conditions | 4 [2] | 3 [6] | 0.10 |
| Waterlow percent | 100 (92‐109) {n =203} | 96 (88‐107) {n =46} | 0.16 |
| Days of cough prior to admission | 4 (2‐6) {n =202} | 4 (2‐5) {n = 40} | 0.78 |
| Days of congestion prior to admission | 3 (1‐5) {n =183} | 3 (1‐5) {n =35} | 0.98 |
| Days of fever prior to admission | 1 (0‐3) {n =206} | 1 (0‐2) {n =43} | 0.50 |
| Days of decreased oral intake prior to admission | 1 (0‐2) {n =181} | 1 (0‐1) {n =36} | 0.44 |
| Variable | Median (IQR) or N [%] | P | Median (IQR) or N [%] | P | ||
|---|---|---|---|---|---|---|
| Short | Long | Short | Long | |||
| Hospital Day 1 | Hospital Day 2 | |||||
| ||||||
| Hours of supplemental oxygen | 3 (0‐10) | 11 (5‐17) | <0.001* | 3 (0‐19) | 24 (17‐24) | <0.001* |
| Minimum supplemental oxygen use (liters) | 0 (0‐0.1) | 0.25 (0‐0.5) | <0.001* | 0 (0‐0) | 0.2 (0‐0.5) | <0.001* |
| Maximum supplemental oxygen use (liters) | 0.5 (0‐1) | 0.75 (0.5‐1.5) | <0.001* | 0.2 (0‐0.5) | 1 (0.5‐1.5) | <0.001* |
| Minimum oxygen saturation (percent) | 94 (92‐96) | 94 (92‐96) | 0.89 | 94 (92‐95) | 93 (91‐94) | 0.001* |
| Maximum oxygen saturation (percent) | 99 (98‐100) | 100 (99‐100) | 0.23 | 100 (98‐100) | 100 (99‐100) | 0.37 |
| Minimum respiratory rate | 36 (32‐46) | 36 (32‐46) | 0.92 | 34 (30‐40) | 36 (32‐41) | 0.11 |
| Maximum respiratory rate | 53 (45‐62) | 56 (48‐64) | 0.14 | 55 (48‐64) | 63 (52‐75) | <0.001* |
| Mean respiratory score | 4 (3‐5.5) | 5 (4‐6.7) | 0.008* | 3.4 (2.7‐4.5) | 4.8 (3.7‐7) | <0.001* |
| Change in respiratory score | 0 (0‐1) | 0 (1‐1.5) | 0.3 | 1 (0‐2) | 0 (‐2‐2) | 0.022 |
| Number of times nasopharyngeal suctioned | 1 (0‐2) | 2 (1‐3) | 0.012 | 1 (0‐3) | 4 (2‐5) | <0.001* |
| Calories consumed (Kcal/kg/day) | 53 (22‐82) | 54 (33‐79) | 0.801 | 66 (47‐90) | 54 (21‐72) | 0.001* |
| ICU (% of subjects) | 4 (1.8%) | 2 (4.3%) | 0.28 | 4 (1.8%) | 5 (10.6%) | 0.009* |
Recursive Partitioning Analysis
We chose recursive partitioning as the method for model creation instead of multivariate linear regression in order to: 1) study multiple possible variable interactions without having to create multiple interaction terms; and 2) generate an easy‐to‐use flow diagram to identify infants at risk for prolonged LOS without having to use a complex formula generated by multivariate regression. In recursive partitioning methodology, the statistical program selects the variable among the set of candidate variables that best separates the first parent node with all subjects into short and prolonged stay intermediate nodes. The process is repeated with additional variables selected that further separate the intermediate nodes into short and prolonged stay nodes, until finally a flow diagram is generated, resulting in terminal nodes of predicted short and prolonged stay subjects. Recursive partitioning was performed using Salford Systems' CART software San Diego, CA. The minimum number of cases required in parent/emntermediate nodes was 20, and in terminal nodes was 5. Eighty percent of cases were randomly selected for the learning tree, and 20% in the test tree for cross‐validation.
Sixteen variables were considered a priori as potentially important in affecting LOS and were candidates for inclusion. These included five baseline variables (age, gestation, Waterlow percentile, presence of chronic respiratory disease, and a marker for missing Waterlow percentile) and 11 variables from hospital day 2 (kcal/kg/day consumed, hours of supplemental oxygen, maximum supplemental oxygen use, maximum oxygen saturation, maximum respiratory rate, minimum supplemental oxygen use, minimum oxygen saturation, minimum respiratory rate, mean clinical respiratory score, change in respiratory score, and nasopharyngeal suctioning frequency). Hospital day 2 variables were chosen rather than hospital day 1, because hospital day 1 was only a partial day in the hospital for the majority of subjects. Several aspects of oxygenation were studied because oxygen need has been consistently found to be an important predictor of LOS. We sought to discover which particular aspect of oxygen need was most important. For comparison, recursive partitioning was performed on the variable sets taken from the Michigan (weight, congenital heart disease, failure to thrive, gestational age, chronic pulmonary diseases, and early mechanical ventilation)21 and Rotterdam (weight and need for supplemental oxygen)24 Models.
This study was approved by the CHW Institutional Review Board.
RESULTS
Three hundred forty‐seven infants were admitted during the 20042005 bronchiolitis season, with 273 placed in the bronchiolitis treatment protocol. The charts of these 273 patients were reviewed. One was excluded because of gastrostomy tube placement during the admission. Of the remaining 272 patients, 47 (17.3%) had a LOS 108 hours. The median LOS was 59 hours (range 10334 hours). Two patients had missing data for caloric intake on days 1 and 2; and 23 patients did not have height obtained, therefore their Waterlow classification could not be determined. Historical details concerning fever, congestion, cough, and diminished caloric intake preceding admission were variably reported, resulting in a smaller sample size for these baseline characteristics as described in Table 1.
Univariate Analysis
Baseline characteristics of infants having short and prolonged LOS are described in Table 1. Groups were statistically similar except that the long stay group contained a significantly larger proportion of infants requiring respiratory support at birth (defined as needing intubation, continuous positive airway pressure [CPAP], or oxygen).
Table 2 describes selected variables on hospital days 1 and 2 in infants having short and prolonged LOS. On hospital day 1, infants in the prolonged LOS group had a significantly greater need for supplemental oxygen, and mean respiratory score. On hospital day 2, infants in the prolonged LOS group had a significantly greater need for supplemental oxygen maximum respiratory rate, mean respiratory score, and number of times they were suctioned. They had a significantly lower minimum oxygen saturation and caloric intake. On hospital day 2, the prolonged LOS group had a greater proportion of subjects in the ICU, on CPAP, and on the ventilator.
We examined two characteristics identifiable after the second hospital day. There was a significant difference in: a) the median number of discharge diagnoses in the short LOS group (two) vs the prolonged LOS group (three) (P < 0.001); and b) the presence of apnea during the admission in the short LOS group (0.1%) vs the prolonged LOS group (9%) (P = 0.009).
Recursive Partitioning Model
Figure 1 depicts the recursive partitioning model that best predicted LOS. Five variables were selected by the recursive partitioning model. Selected variables, in order of appearance (variable importance is related to order of appearance, ie, most important variable is first), were: hours of supplemental oxygen, maximum respiratory rate, minimum supplemental oxygen use, gestation, and kilocalories (kcal)/kilogram (kg)/day consumed. The characteristics of this model were: ROC 0.89 and 0.72 for the learning and test trees, respectively; sensitivity, 0.85; and specificity, 0.82
Infants predicted as having a short LOS had three distinct profiles labeled S1, S2, and S3 in Figure 1. The S1 group required 6.5 hours of oxygen. The S2 group required >6.5 hours of oxygen, but had a maximum respiratory rate 49. The S3 group required >6.5 hours of oxygen, had a maximum respiratory rate >49, but were >36.5 week gestation, and consumed >23.5 kcal/kg/day.
Infants predicted as having a long LOS had three distinct profiles labeled L1, L2, and L3 in Figure 1. The L1 group required >6.5 hours of supplemental oxygen, had a maximum respiratory rate >49, and required some level of oxygen support the entire day. The L2 group required >6.5 hours of supplemental oxygen, had a maximum respiratory rate >49, were on room air some portion of the day, but had a gestation 36.5 weeks. The L3 group required >6.5 hours of supplemental oxygen, had a maximum respiratory rate >49, were on room air for some portion of the day, had a gestation >36.5 weeks, but consumed 23.5 kcal/kg/day.
Table 3 compares the performance of our model (the Milwaukee Model), the Michigan Model, and the Rotterdam Model in predicting LOS group. Overall, the Milwaukee Model had the highest ROC 0.89/0.72 for the learning and test trees. All three models had good sensitivity (Milwaukee, 85%; Michigan, 85%), with the Rotterdam Model having the highest (98%). The Milwaukee Model also had good specificity (82%), while the Michigan and Rotterdam Models were less specific (46% and 44%).
| Model | Priors* | Sensitivity | Specificity | Learning Tree ROC | Test Tree ROC | |
|---|---|---|---|---|---|---|
| Long LOS | Short LOS | |||||
| ||||||
| Michigan | 0.5 | 0.5 | 0.85 | 0.46 | 0.69 | 0.56 |
| Rotterdam | 0.5 | 0.5 | 0.98 | 0.44 | 0.73 | 0.61 |
| Milwaukee | 0.5 | 0.5 | 0.85 | 0.82 | 0.89 | 0.72 |
DISCUSSION
We confirmed several previously recognized risk factors for prolonged LOS, including: apnea, at least part of the hospital stay in ICU, use of CPAP, mechanical ventilation, and prematurity. However, most patients admitted with bronchiolitis do not have these risk factors. The major contribution of this study is the evaluation of factors applicable to all patients admitted with bronchiolitis, and a more in‐depth analysis of clinical assessments performed on hospital days 1 and 2 than had been previously reported.
We did find strong associations between a number of clinical assessments and LOS. While some were apparent on day 1 of the admission, the number and degree of clinical differences between infants destined for a short vs prolonged stay were more apparent on hospital day 2. On this day, there were significant differences between the groups in the length and amount of oxygen received, oxygen saturation, maximum respiratory rate, respiratory scores, nasopharyngeal suctioning need, and caloric intake. Interestingly, it was noted the prolonged stay group had overall worsening or a lack of improvement in several clinical markers from day 1 to day 2, in areas where the short stay group showed improvements.
To our knowledge, the Milwaukee Model is the first bronchiolitis LOS prediction model to incorporate several clinical markers occurring early in the hospital stay. These clinical markers were found to be more effective predictors of LOS group in our study population than some of the traditional birth‐ and disease‐related risk factors previously reported. The model highlighted some important interactions among variables, and identified specific profiles of patients likely to have a short or prolonged LOS based on their day 2 clinical status.
The short LOS groups all shared one of the following three features: 1) low duration of oxygen use; 2) absence of tachypnea (tachypnea defined as a respiratory rate >60 in infants <2 months old and >50 for infants between 2 and 12 months old.3234); or 3) absence of severely diminished caloric intake. The prolonged LOS groups shared the common characteristics of higher duration of oxygen use and higher maximum respiratory rates. In addition to these two elements, each long stay group had either a constant oxygen requirement, prematurity (36.5 weeks), or very low caloric intake (<23.5 kcal/kg/day).
While all three models shared good sensitivity, the increased specificity of the Milwaukee Model limits the number of false positives (infants screening as destined for a prolonged LOS who actually will have a short LOS). For clinicians or researchers planning interventions for high‐risk infants, this greater specificity would reduce the number of infants who might unnecessarily receive those interventions. While there are limited proven therapies to hasten the recovery of patients with bronchiolits,35 many treatments and combinations of treatments are currently being used and studied. Nebulized hypertonic saline,36 airway secretion clearance modalities,37 and nutritional supplementation22, 38 are some examples of interventions that could be used and evaluated in infants screened as high risk for prolonged LOS. While it may have been better to identify short vs long stay immediately upon admission or after hospital day 1, it was the more clear separation between the short and long stay groups that occurred on day 2 that allowed us to develop an accurate predictive model. We believe that for infants destined to be in the hospital for at least three more days, a model based on hospital day 2 variables is worthwhile.
When evaluating the characteristics of the three models, it is important to note that they were initially studied in populations with some important differences. Only 11% of Milwaukee patients had chronic respiratory diseases, whereas the previously developed models were generated from a sample with a higher prevalence of chronic respiratory diseases (Michigan, 20%; Rotterdam, 23%). Only 3% of subjects needed placement in the ICU compared to higher rates in prior studies (Michigan, 15%; Rotterdam, 43.5%). In a population of patients with a lower prevalence of chronic respiratory diseases and need for ICU, early clinical markers may become more important in predicting LOS. While our model may generalize well in such a cohort of patients, it might not generalize as well to a cohort with a high prevalence of chronic lung disease and higher need for ICU. It is also important to note that the area under the ROC was lower in the test tree than the learning tree. This variation demonstrates the need for evaluating the performance of this model in additional populations.
This study has several limitations. First, it is a retrospective study of a single bronchiolitis season at a single institution. Second, the authors served as data abstractors and could have been biased, as they were not blinded. Third, four out of the five markers in our model are clinical markers that could vary based on clinical assessment skills and institutional practice. For example, oxygen use is dependent on the practice of nurses and respiratory therapists charged with regulating the oxygen delivery. However, the practice of initiating and weaning oxygen is fairly standardized at our institution. Fourth, environmental and social risk factors, such as day care attendance, school‐age siblings, and smoke exposure, can impact LOS but were not included in our model. Fifth, we do not have data on those infants not included in the bronchiolitis protocol. It is possible that they differed from those in protocol. Finally, six infants were either placed or transferred to the ICU on day 1, which may make them inherently different than the other infants in the model. However, four out of these six infants did go on to have a short stay, highlighting the fact that many other factors affect LOS.
We believe this model may be useful because the clinical markers it uses represent some of the key problems seen in bronchiolitis (poor oxygenation, tachypnea, and poor feeding). Careful assessment of these clinical markers can allow effective prediction of those infants likely to have a prolonged LOS. This early risk assessment could allow more effective targeting of interventions to help high‐risk infants.
CONCLUSIONS
There are important differences between infants with bronchiolitis having short and prolonged hospital stays, including several clinical markers identifiable on hospital day 2, such as the length and amount of oxygen received, minimum oxygen saturation, maximum respiratory rate, clinical respiratory scores, deep suctioning need, and caloric intake. The Milwaukee Model uses the number of hours of supplemental oxygen, respiratory rate, minimum supplemental oxygen use, gestation, and caloric intake to predict short or prolonged LOS. It performed well with a good ROC, sensitivity, and specificity in one population of infants with a low prevalence of chronic respiratory disease.
- ,.Clinical significance of respiratory syncytial virus.Postgrad Med.1964;35:460–465.
- ,,,,.Respiratory syncytial virus infection in young hospitalized children. Identification of risk patients and prevention of nosocomial spread by rapid diagnosis.Acta Paediatr Scand.1983;72(1):47–51.
- .Pathogenesis of bronchiolitis—epidemiologic considerations.Pediatr Res.1977;11(3 pt 2):239–243.
- ,,.Respiratory syncytial virus infection in children with bronchopulmonary dysplasia.Pediatrics.1988;82(2):199–203.
- ,,, et al.Respiratory syncytial viral infection in children with compromised immune function.N Engl J Med.1986;315(2):77–81.
- ,,,,.Risk of secondary bacterial infection in infants hospitalized with respiratory syncytial viral infection.J Pediatr.1988;113(2):266–271.
- ,,,,,.Respiratory syncytial viral infection in infants with congenital heart disease.N Engl J Med.1982;307(7):397–400.
- ,,, et al.Hospitalized children with respiratory syncytial virus infection and neuromuscular impairment face an increased risk of a complicated course.Pediatr Infect Dis J.2007;26(6):485–491.
- ,,.Rehospitalization for respiratory illness in infants of less than 32 weeks' gestation.Pediatrics.1991;88(3):527–532.
- ,,, et al.Respiratory syncytial virus (RSV) immune globulin intravenous therapy for RSV lower respiratory tract infection in infants and young children at high risk for severe RSV infections: Respiratory Syncytial Virus Immune Globulin Study Group.Pediatrics.1997;99(3):454–461.
- ,,,,.Risk factors for bronchiolitis‐associated deaths among infants in the United States.Pediatr Infect Dis J.2003;22(6):483–490.
- ,.Risk factors for severe respiratory syncytial virus infection in infants.Respir Med.2002;96(suppl B):S9–S14.
- ,,,,.Rehospitalization for respiratory syncytial virus among premature infants.Pediatrics.1999;104(4 pt 1):894–899.
- ,,,,.Risk of respiratory syncytial virus infection for infants from low‐income families in relationship to age, sex, ethnic group, and maternal antibody level.J Pediatr.1981;98(5):708–715.
- ,,,.Preterm twins and triplets. A high‐risk group for severe respiratory syncytial virus infection.Am J Dis Child.1993;147(3):303–306.
- ,,, et al.Rehospitalization because of respiratory syncytial virus infection in premature infants younger than 33 weeks of gestation: a prospective study. IRIS Study Group.Pediatr Infect Dis J.2000;19(7):592–597.
- ,.Parental smoking, presence of older siblings, and family history of asthma increase risk of bronchiolitis.Am J Dis Child.1986;140(8):806–812.
- ,,,,.Role of respiratory syncytial virus in early hospitalizations for respiratory distress of young infants with cystic fibrosis.J Pediatr.1988;113(5):826–830.
- ,,, et al.Variable morbidity of respiratory syncytial virus infection in patients with underlying lung disease: a review of the PICNIC RSV database. Pediatric Investigators Collaborative Network on Infections in Canada.Pediatr Infect Dis J.1999;18(10):866–869.
- ,,,,.Rates of hospitalization for respiratory syncytial virus infection among children in Medicaid.J Pediatr.2000;137(6):865–870.
- ,.Severity of illness models for respiratory syncytial virus‐associated hospitalization.Am J Respir Crit Care Med.1999;159(4 pt 1):1234–1240.
- ,.Effect of oxygen supplementation on length of stay for infants hospitalized with acute viral bronchiolitis.Pediatrics.2008;121(3):470–475.
- ,,.Pediatric Investigators Collaborative Network on Infections in Canada (PICNIC) prospective study of risk factors and outcomes in patients hospitalized with respiratory syncytial viral lower respiratory tract infection.J Pediatr.1995;126(2):212–219.
- ,,,.Prediction of duration of hospitalization in respiratory syncytial virus infection.Pediatr Pulmonol.2002;33(6):453–457.
- ,,,,,.Impact of a bronchiolitis guideline: a multisite demonstration project.Chest.2002;121(6):1789–1797.
- , , , , , , , , , Diagnosis and management of bronchiolitis.Pediatrics.2006;118(4):1774–1793.
- ,,, et al.Evaluation of an evidence‐based guideline for bronchiolitis.Pediatrics.1999;104(6):1334–1341.
- .Classification and definition of protein‐calorie malnutrition.Br Med J.1972;3(5826):566–569.
- ,,,,.Inpatient care for uncomplicated bronchiolitis: comparison with Milliman and Robertson guidelines.Arch Pediatr Adolesc Med.2001;155(12):1323–1327.
- ,,,.Impact of pulse oximetry and oxygen therapy on length of stay in bronchiolitis hospitalizations.Arch Pediatr Adolesc Med.2004;158(6):527–530.
- .Bronchiolitis clinical practice guideline.Children's Hospital of Wisconsin Intranet;2007. http://clinicalpractice.chw.org/display/displayFile.asp?docid=393185(2):319–336.
- ,.The rational clinical examination. Does this infant have pneumonia?JAMA.1998;279(4):308–313.
- ,.Focused ethnographic studies in the WHO Programme for the Control of Acute Respiratory Infections.Med Anthropol.1994;15(4):409–424.
- ,.Bronchiolitis: recent evidence on diagnosis and management.Pediatrics.125(2):342–349.
- ,,,.Nebulized hypertonic saline solution for acute bronchiolitis in infants.Cochrane Database Syst Rev.2008(4):CD006458.
- .Airway clearance applications in infants and children.Respir Care.2007;52(10):1382–1391.
- ,.Immunonutrition in critically ill patients: a systematic review and analysis of the literature.Intensive Care Med.2008;34(11):1980–1990.
- ,.Clinical significance of respiratory syncytial virus.Postgrad Med.1964;35:460–465.
- ,,,,.Respiratory syncytial virus infection in young hospitalized children. Identification of risk patients and prevention of nosocomial spread by rapid diagnosis.Acta Paediatr Scand.1983;72(1):47–51.
- .Pathogenesis of bronchiolitis—epidemiologic considerations.Pediatr Res.1977;11(3 pt 2):239–243.
- ,,.Respiratory syncytial virus infection in children with bronchopulmonary dysplasia.Pediatrics.1988;82(2):199–203.
- ,,, et al.Respiratory syncytial viral infection in children with compromised immune function.N Engl J Med.1986;315(2):77–81.
- ,,,,.Risk of secondary bacterial infection in infants hospitalized with respiratory syncytial viral infection.J Pediatr.1988;113(2):266–271.
- ,,,,,.Respiratory syncytial viral infection in infants with congenital heart disease.N Engl J Med.1982;307(7):397–400.
- ,,, et al.Hospitalized children with respiratory syncytial virus infection and neuromuscular impairment face an increased risk of a complicated course.Pediatr Infect Dis J.2007;26(6):485–491.
- ,,.Rehospitalization for respiratory illness in infants of less than 32 weeks' gestation.Pediatrics.1991;88(3):527–532.
- ,,, et al.Respiratory syncytial virus (RSV) immune globulin intravenous therapy for RSV lower respiratory tract infection in infants and young children at high risk for severe RSV infections: Respiratory Syncytial Virus Immune Globulin Study Group.Pediatrics.1997;99(3):454–461.
- ,,,,.Risk factors for bronchiolitis‐associated deaths among infants in the United States.Pediatr Infect Dis J.2003;22(6):483–490.
- ,.Risk factors for severe respiratory syncytial virus infection in infants.Respir Med.2002;96(suppl B):S9–S14.
- ,,,,.Rehospitalization for respiratory syncytial virus among premature infants.Pediatrics.1999;104(4 pt 1):894–899.
- ,,,,.Risk of respiratory syncytial virus infection for infants from low‐income families in relationship to age, sex, ethnic group, and maternal antibody level.J Pediatr.1981;98(5):708–715.
- ,,,.Preterm twins and triplets. A high‐risk group for severe respiratory syncytial virus infection.Am J Dis Child.1993;147(3):303–306.
- ,,, et al.Rehospitalization because of respiratory syncytial virus infection in premature infants younger than 33 weeks of gestation: a prospective study. IRIS Study Group.Pediatr Infect Dis J.2000;19(7):592–597.
- ,.Parental smoking, presence of older siblings, and family history of asthma increase risk of bronchiolitis.Am J Dis Child.1986;140(8):806–812.
- ,,,,.Role of respiratory syncytial virus in early hospitalizations for respiratory distress of young infants with cystic fibrosis.J Pediatr.1988;113(5):826–830.
- ,,, et al.Variable morbidity of respiratory syncytial virus infection in patients with underlying lung disease: a review of the PICNIC RSV database. Pediatric Investigators Collaborative Network on Infections in Canada.Pediatr Infect Dis J.1999;18(10):866–869.
- ,,,,.Rates of hospitalization for respiratory syncytial virus infection among children in Medicaid.J Pediatr.2000;137(6):865–870.
- ,.Severity of illness models for respiratory syncytial virus‐associated hospitalization.Am J Respir Crit Care Med.1999;159(4 pt 1):1234–1240.
- ,.Effect of oxygen supplementation on length of stay for infants hospitalized with acute viral bronchiolitis.Pediatrics.2008;121(3):470–475.
- ,,.Pediatric Investigators Collaborative Network on Infections in Canada (PICNIC) prospective study of risk factors and outcomes in patients hospitalized with respiratory syncytial viral lower respiratory tract infection.J Pediatr.1995;126(2):212–219.
- ,,,.Prediction of duration of hospitalization in respiratory syncytial virus infection.Pediatr Pulmonol.2002;33(6):453–457.
- ,,,,,.Impact of a bronchiolitis guideline: a multisite demonstration project.Chest.2002;121(6):1789–1797.
- , , , , , , , , , Diagnosis and management of bronchiolitis.Pediatrics.2006;118(4):1774–1793.
- ,,, et al.Evaluation of an evidence‐based guideline for bronchiolitis.Pediatrics.1999;104(6):1334–1341.
- .Classification and definition of protein‐calorie malnutrition.Br Med J.1972;3(5826):566–569.
- ,,,,.Inpatient care for uncomplicated bronchiolitis: comparison with Milliman and Robertson guidelines.Arch Pediatr Adolesc Med.2001;155(12):1323–1327.
- ,,,.Impact of pulse oximetry and oxygen therapy on length of stay in bronchiolitis hospitalizations.Arch Pediatr Adolesc Med.2004;158(6):527–530.
- .Bronchiolitis clinical practice guideline.Children's Hospital of Wisconsin Intranet;2007. http://clinicalpractice.chw.org/display/displayFile.asp?docid=393185(2):319–336.
- ,.The rational clinical examination. Does this infant have pneumonia?JAMA.1998;279(4):308–313.
- ,.Focused ethnographic studies in the WHO Programme for the Control of Acute Respiratory Infections.Med Anthropol.1994;15(4):409–424.
- ,.Bronchiolitis: recent evidence on diagnosis and management.Pediatrics.125(2):342–349.
- ,,,.Nebulized hypertonic saline solution for acute bronchiolitis in infants.Cochrane Database Syst Rev.2008(4):CD006458.
- .Airway clearance applications in infants and children.Respir Care.2007;52(10):1382–1391.
- ,.Immunonutrition in critically ill patients: a systematic review and analysis of the literature.Intensive Care Med.2008;34(11):1980–1990.
Copyright © 2011 Society of Hospital Medicine
Important Postdischarge Culture Results
Many hospitalized patients have microbiology test results pending at the time of discharge.1, 2 Failure to follow up on these results in a timely fashion can lead to delays in diagnosis and adequate treatment of important infections. Prompt communication of the results of these pending tests to the responsible providers is crucial to minimize these delays.36 As hospitalized patients are increasingly cared for by clinicians other than their primary care providers,7 important information may be lost during the discharge process.8 This increasing fragmentation makes reliable communication of pending tests even more crucial.9, 10
Studies to date have primarily investigated tests from general medical services. In that setting, there is clearly room for improvement in test result communication. Discharge summaries often do not reach the outpatient providers at the time of the patients' follow‐up visits after hospitalization.11 When the discharge summaries are present, the majority of pending tests are not mentioned in them,2, 12, 13 and both inpatient and outpatient physicians are unaware of most of these results when they return.1 However, the specific characteristics of postdischarge microbiology results and the extent to which these results represent potential follow‐up errors in specialties other than general medicine have not been adequately studied.
We aimed to describe the issue of microbiology tests pending at the time of discharge from a hospital‐wide perspective. Specifically, we sought to determine: (1) frequency and characteristics of these results across all admitting services; and (2) how often these results potentially require a change in antimicrobial therapy.
Methods
Study Setting
We conducted our study at a 777‐bed, tertiary‐care academic hospital in Boston, MA with 13 medical and 18 surgical admitting specialties. The human research committee reviewed and approved the study design. For inpatient services, the hospital had well‐established computerized order entry and electronic discharge medication list systems, along with paper clinical notes. The affiliated outpatient practices used an internally developed electronic health record that could access the test results obtained during hospitalization.
Data Collection
We analyzed all 111,331 results of blood, urine, cerebrospinal fluid (CSF), and sputum cultures that were finalized by the hospital's microbiology laboratory in calendar year 2007. For each result, we determined the type of culture, the date of collection, the date of final result, and the identity and antibiotic susceptibility of any organisms isolated in the microbiology lab. For blood and CSF cultures, we also collected the date of preliminary susceptibilities. Preliminary susceptibilities are not reported for urine and sputum cultures at our institution. For cultures collected during hospital admission, we determined the dates of hospital admission and discharge, hospital service caring for the patient at the time of discharge, and the list of medications prescribed to the patient at discharge.
Case Selection Criteria
Our goal was to screen for postdischarge microbiology results that were likely to require action from the clinicians. To this end, we identified cases that were: (1) clinically important, which we defined as likely to represent a true infection or require further evaluation; and (2) were untreated at the time of discharge, which we defined as cases with no antibiotic or inadequate antibiotic therapy. We first excluded cultures obtained while patients were in the outpatient setting. We further excluded all cultures for which the preliminary susceptibilities or final results returned on or before the day of discharge from the hospital.
For each of the four culture types, we developed criteria to identify clinically important results. For blood cultures, we used a prediction model developed and validated at our institution that was based on the identity of the organism, time to first growth, and prior matching culture results.14 For the remaining three culture types, we defined clinical importance based on Centers for Disease Control and Prevention (CDC) definitions of nosocomial infections. These criteria were felt to be adequate to screen for both community‐acquired and nosocomial infections. For urine cultures, we required at least 100,000 colony‐forming units and growth of no more than two distinct organisms. For CSF, any growth was considered clinically important. For sputum, we required a positive culture as well as a discharge diagnosis of pneumonia based on International Classification of Diseases, Ninth Revision (ICD‐9) codes. The discharge diagnosis was included to incorporate the clinical interpretation required to separate true infections from contaminated samples or colonization.
To identify the untreated cultures, we compared the antibiotic susceptibility of the clinically important postdischarge results against the list of antibiotics prescribed to the patients at the time of hospital discharge. We considered the infections treated if there was at least one antibiotic on the discharge medication list to which the organism was found to be susceptible.
Manual Review
We manually reviewed a random sample of 94 of the clinically important and untreated postdischarge results to determine if the results potentially required a change in therapy and therefore required follow‐up. For each case, the electronic patient chart was reviewed by two internal medicine‐trained physicians on the study staff. Each reviewer was blinded to events that occurred after the cultures returned, and determined whether the results necessitated a potential change in antibiotic. The reviewer then indicated the level of certainty of that determination on a 6‐point Likert scale that had been previously used in reviews to identify adverse medical events15, 16: 1 = little or no evidence, 2 = slight evidence, 3 = not quite likely (<50:50 but close call), 4 = more likely than not (>50:50 but close call), 5 = strong evidence, and 6 = virtually certain evidence. To standardize the assignment of certainty for potential need for antibiotic change, we used a set of review guidelines developed by our study staff (Figure 1). A microbiology result was defined as potentially necessitating antibiotic change if both reviewers indicated as such and recorded a certainty with a score 4. Differences in assessments were resolved through discussion of the case between the reviewers.
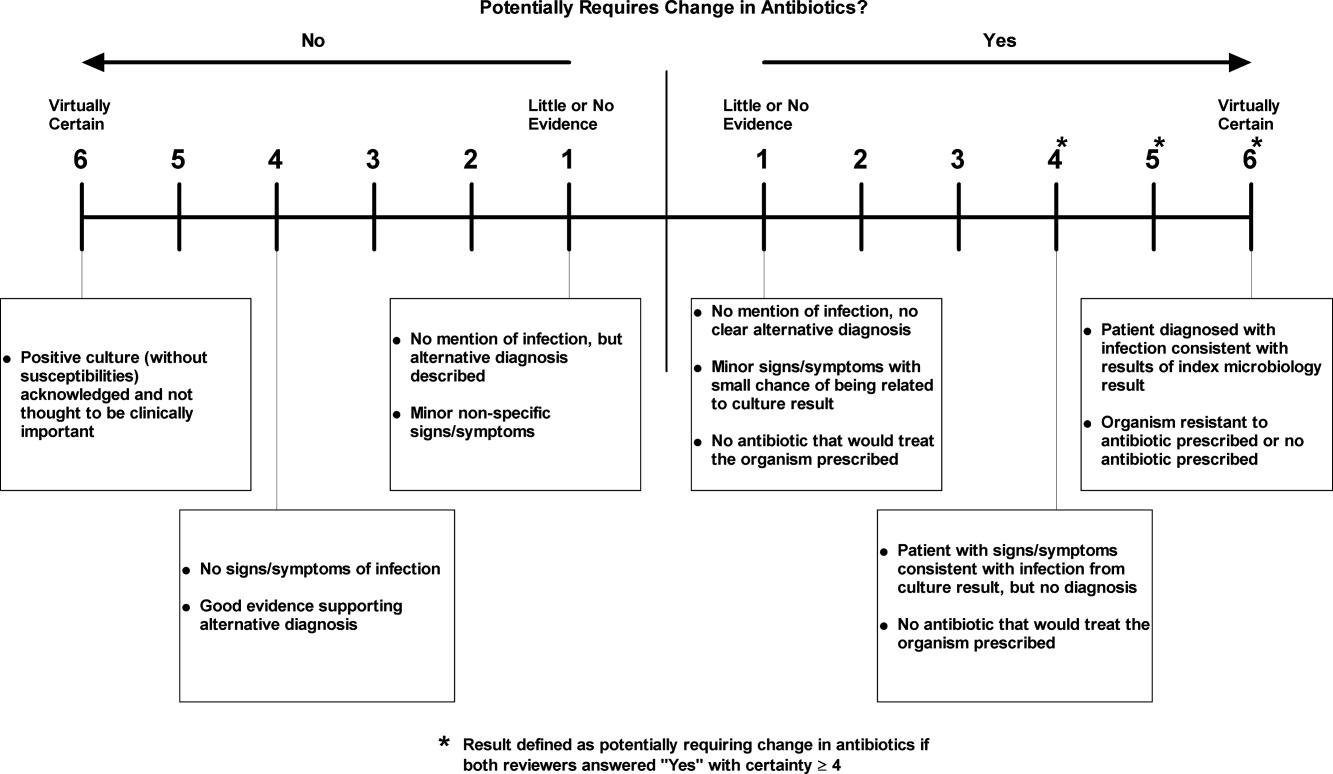
Statistical Analysis
Using the 94 manually reviewed results, we examined how the proportion of clinically important and untreated microbiology results requiring follow‐up varied by type of culture and primary discharging service. We created a multivariable logistic regression model to predict which of the untreated, postdischarge results required follow‐up. The covariates in our model were selected a priori and included type of culture, hospital service at the time of discharge, patient age, sex, and insurance status. Type of culture and hospital service were included to determine how the distribution of untreated results varied across hospital specialties. Patient age, sex, and insurance status were included to account for differences in the prevalence of antibiotic‐resistant organisms and the clinician's choice of which empiric antimicrobial agent, if any, to initiate based on these patient‐level factors. We calculated a kappa statistic to measure the concordance of the assessments of the two reviewers prior to resolution of disagreements. All analyses were performed using SAS (version 9.2, Cary, NC).
Results
Of the 111,331 blood, urine, sputum, and CSF cultures analyzed, 77,349 (69%) were collected from hospitalized patients. The majority (63%) of the inpatient results were for blood cultures and one quarter (24%) were for urine cultures. Table 1 shows the distribution of the microbiology results across primary services responsible for the patients at the time of discharge. Half (49%) of the patients from whom the specimens were collected were female. The mean age of patients was 55 years. Most (68%) were white and most (86%) had either commercial insurance or Medicare (Table 1).
| Variable | Results for Admitted Patients (n = 77,349) | Results Finalized Postdischarge (n = 8,668) |
|---|---|---|
| ||
| Type of culture, n (%) | ||
| Urine | 18,746 (24) | 2,843 (33) |
| Blood | 48,546 (63) | 4,696 (54) |
| Sputum | 8,466 (11) | 1,059 (12) |
| CSF | 1,591 (2) | 70 (1) |
| Hospital service at discharge, n (%) | ||
| General Medicine | 15,997 (21) | 2,548 (29) |
| Oncology | 13,138 (17) | 1,341 (15) |
| Medical subspecialties | 20,846 (27) | 2,025 (23) |
| Surgery | 23,380 (30) | 2,031 (23) |
| Other | 3,988 (5) | 723 (8) |
| Patient characteristics | ||
| Female, n (%) | 38,125 (49) | 4,539 (52) |
| Age, n (SD) | 55 (21) | 56 (19) |
| Race, n (%) | ||
| White | 52,824 (68) | 5,669 (65) |
| Black | 9,319 (12) | 1,241 (14) |
| Asian | 1,565 (2) | 183 (2) |
| Hispanic | 5,116 (7) | 897 (10) |
| Other | 1,330 (2) | 146 (2) |
| Unavailable | 7,195 (9) | 532 (6) |
| Insurance, n (%) | ||
| Commercial | 35,893 (46) | 3,977 (46) |
| Medicare | 30,553 (40) | 3,473 (40) |
| Medicaid | 9,514 (12) | 1,034 (12) |
| Other | 1,389 (2) | 184 (2) |
Of the 77,349 microbiology tests obtained during hospital stays, 8668 (11%) of the inpatient microbiology results were reported after the patients were discharged from the hospital. Most (54%) of these postdischarge results were for blood cultures. The distribution of results across primary hospital service, patient sex, race, insurance, and mean patient age were similar to those for all inpatient results (Table 1). Of the 8668 postdischarge results, 385 (4%) met our screening criteria of being both clinically important and not treated by an antibiotic to which the organism was found susceptible at the time of discharge from the hospital. After manual review of a random subset of 94 of these screen‐positive cases, 50 (53%) required follow‐up (Figure 2). The interrater reliability for the reviewers was found to be kappa = 0.58 (P < 0.001). From our results, we estimated that 2.4% of the postdischarge microbiology results required follow‐up and potential change in therapy.
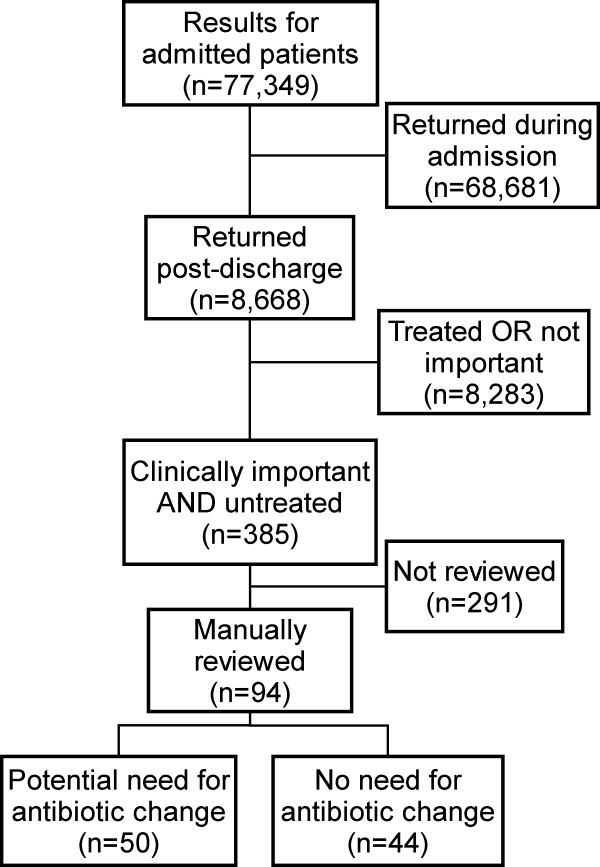
Potential need for antibiotic change was present in 30 of 45 (67%) urine cultures, 12 of 32 (38%) blood cultures, 8 of 16 (50%) sputum cultures, and 0 of 1 (0%) CSF cultures. By primary service, reviewers identified a potential need for antibiotic change in 19 of 25 (76%) of results from surgical services, 17 of 29 (59%) from general medicine, 6 of 16 (38%) from oncology, and 8 of 23 (35%) from medical subspecialties. Examples of cases that potentially required antibiotic change are shown in Table 2.
| Culture Type | Scenario |
|---|---|
| Urine | 42‐year‐old woman with dysuria after admission for hysterectomy; no empiric antibiotic treatment given; postdischarge urine culture grew Klebsiella pneumoniae |
| Blood | 81‐year‐old man with Crohn's disease on total parenteral nutrition (TPN) who was initially treated for sepsis from suspected line infection, but discharged without antibiotics, given negative cultures during admission; postdischarge blood culture grew Klebsiella pneumoniae |
| Sputum | 46‐year‐old woman prescribed levofloxacin for pneumonia; sputum culture returns postdischarge with Pseudomonas aeruginosa resistant to levofloxacin |
In our logistic regression model, both the type of culture and the primary hospital service were found to be significant predictors of a potential need for antibiotic change in the manually reviewed cases. Urine cultures were more likely than non‐urine cultures to potentially require antibiotic change (P = 0.03; OR 2.8, 95% CI 1.1‐7.2). Results from surgical services were most likely to potentially require antibiotic change, followed by general medicine, oncology, and medical subspecialties (Table 3).
| Variable | Results Potentially Requiring Change in Therapy (n = 50) | Results Not Requiring Change in Therapy (n = 44) | Odds Ratio (95% CI)* | Adjusted P‐value* |
|---|---|---|---|---|
| ||||
| Type of culture, n (%) | ||||
| Urine | 30 (60) | 15 (34) | 2.84 (1.13‐7.17) | 0.03 |
| Non‐urine | 20 (40) | 29 (66) | Ref | |
| Hospital service at discharge, n (%) | ||||
| General Medicine | 17 (34) | 12 (27) | Ref | |
| Oncology | 6 (12) | 10 (23) | 0.41 (0.11‐1.56) | 0.02 |
| Medical subspecialties | 8 (16) | 16 (36) | 0.34 (0.10‐1.16) | |
| Surgery | 19 (38) | 6 (14) | 2.40 (0.65‐8.89) | |
| Age, mean (SD) | 61 (20) | 59 (21) | 1.01 (0.98‐1.04) | 0.62 |
| Female, n (%) | 29 (58) | 21 (42) | 1.15 (0.44‐2.98) | 0.77 |
| Insurance, n (%) | ||||
| Commercial | 17 (34) | 19 (43) | Ref | |
| Medicare | 25 (50) | 19 (43) | 1.60 (0.42‐6.11) | 0.65 |
| Medicaid and other | 8 (16) | 6 (14) | 1.78 (0.43‐7.36) | |
Discussion
We performed a retrospective analysis of all blood, urine, sputum, and CSF cultures finalized at our institution in 2007 and found that many returned after patients were discharged. Overall, we estimated that 2.4% of these postdischarge results potentially required a change in antibiotic. This proportion varied by culture type and by primary hospital service at the time of discharge, with urine cultures and cultures from surgical services being most likely to potentially need change in antibiotic.
We speculate that postdischarge urine cultures may have been more likely to require antibiotic change in part due to different urgency that clinicians assign to different culture types. Urinary tract infections may present with more vague, transient, or minor complaints compared with bacteremia, pneumonia, and cerebrospinal fluid infections. For that reason, clinicians may be more likely to forego empiric antibiotics for pending urine cultures in favor of watchful waiting. Therefore, the postdischarge urine cultures with growth may include a higher proportion of untreated true infections compared with other culture types.
A similar difference in prescription of empiric antibiotics may help explain the differences seen across primary hospital specialties. For example, if patients on surgical services were less likely to receive empiric antibiotics, then the pool of postdischarge results would be more likely to include true infections that require antibiotic change. Furthermore, it is possible that surgical services may tend to order cultures for patients only if they already have convincing evidence of infections. It may be that selecting a group with higher likelihood of infection led to a higher proportion of true infections in surgical patients with cultures with growth.
Prior studies led by Roy and Were illustrated that pending microbiology results from general medicine services were often not communicated and followed up adequately.1, 2 For patients discharged with pending test results, between 47% and 89% of discharge summaries did not mention the pending tests.2, 12, 13, 17 These deficiencies in discharge summaries likely have a substantial impact on the proportion of tests followed up by outpatient clinicians. By extending the analysis hospital‐wide, our study suggests that pending microbiology results occur for a wide range of hospital services. While our study was not designed to determine whether these results were followed up appropriately, opportunities for miscommunication and missed follow‐up likely exist for all specialties.
The potential harms associated with inadequate test follow‐up have gained the attention of the patient safety community. In 2005, the Joint Commission underscored the importance of proper communication of critical lab results.3, 5, 18 Their recommendations included the development of systems to ensure adequate follow‐up of critical results in high‐risk scenarios including the postdischarge period.5 While many of the microbiology results do not fall into the criticalcategory, we feel that these results should be considered for inclusion in hospital efforts to track postdischarge results. These efforts should also address issues specific to microbiology results, such as preliminary status before antibiotic sensitivities are known.
Developing a comprehensive strategy for test result communication is challenging, and more so for results that return after transitions of care. Even defining the proper target of communication interventions can involve complex organizational and cultural issues. As these results span the inpatient and outpatient domains, there may be some ambiguity as to which provider is responsible when the results return. The inpatient clinicians ordering the microbiology cultures are in the best position to put the results into the patient's clinical context. However, these clinicians may no longer be on clinical duty when the results return, or they may not have a system to ensure that they are notified about these results. While the outpatient providers may be available, they have often not seen the patient in follow‐up at the time the results return and would need to repeat a clinical assessment to determine whether a change in antibiotics is required. While many feel that the ordering provider is a logical choice to perform the follow‐up of the result, not all agree and few institutions have developed clear policies on this issue. To avoid this ambiguity, future work will require institutions to clearly outline which party is responsible for test result follow‐up during transitions of care.
Potential solutions to improve communication of these results must be tailored to the local infrastructure of the institution. In hospitals that do not have extensive electronic systems, a solution might involve a registered nurse, nurse practitioner, or lab technician whose responsibilities include identifying postdischarge results and communicating them to the ordering clinician, primary care provider, and patient. In settings with more advanced electronic infrastructure, solutions could be designed to automatically notify the responsible providers electronically, as well as post the results to a patient portal. Regardless of the level of technical sophistication, it is vital to create a system that has is highly reliable to prevent these important results from falling through the cracks.
Our study did have some limitations. First, we evaluated results from only one institution. It is unclear how substantially differences in practice patterns or patient populations would affect the number of postdischarge microbiology results in other settings. Second, we did not assess whether these results were actually followed up or whether treatment regimens were altered. As this study was retrospective in nature, we could not expect clinicians to recall the clinical scenarios surrounding each result and decided that documentation in clinical notes would be an unreliable indicator of whether any follow‐up action had been taken. Even without this information, however, we would submit that our findings represent a substantial near‐miss rate and threat to patient safety (approximately one potentially actionable, postdischarge microbiology result every other day for our hospital), and call for a fail‐safe system to ensure appropriate actions are taken.
In conclusion, microbiology results are often pending at the time patients are discharged from the hospital and roughly 2.4% of these results potentially require a change in therapy. This proportion was highest for urine cultures and cultures drawn from surgical patients. Our results suggest that a hospital‐wide system is warranted to ensure adequate communication of postdischarge microbiology results. Further research is required to evaluate the impact of such a system on the follow‐up rates of pending microbiology tests.
Acknowledgements
The authors thank Deborah Williams from the Brigham and Women's Division of General Medicine for her programming assistance.
- ,,, et al.Patient safety concerns arising from test results that return after hospital discharge.Ann Intern Med.2005;143(2):121–128.
- ,,, et al.Adequacy of hospital discharge summaries in documenting tests with pending results and outpatient follow‐up providers.J Gen Intern Med.2009;24(9):1002–1006.
- ,.Doing better with critical test results.Jt Comm J Qual Patient Saf.2005;31(2):61,66–67.
- .Fumbled handoffs: one dropped ball after another.Ann Intern Med.2005;142(5):352–358.
- ,,,.Communicating critical test results: safe practice recommendations.Jt Comm J Qual Patient Saf.2005;31(2):68–80.
- .Introduction: Communicating critical test results.Jt Comm J Qual Patient Saf.2005;31(2):61,63–65.
- ,,,.Growth in the care of older patients by hospitalists in the United States.N Engl J Med.2009;360(11):1102–1112.
- ,,.Gaps in the continuity of care and progress on patient safety.BMJ.2000;320(7237):791–794.
- .Key legal principles for hospitalists.Am J Med.2001;111(9B):5S–9S.
- ,,.Passing the clinical baton: 6 principles to guide the hospitalist.Am J Med.2001;111(9B):36S–39S.
- ,,.Dissemination of discharge summaries. Not reaching follow‐up physicians.Can Fam Physician.2002;48:737–742.
- ,,, et al.Communication and information deficits in patients discharged to rehabilitation facilities: an evaluation of five acute care hospitals.J Hosp Med.2009;4(8):E28–33.
- , , , , .Pending laboratory tests and the hospital discharge summary in patients discharged to sub‐acute care.J Gen Intern Med.2010;26(4):393–398.
- ,,,,,.Using electronic data to predict the probability of true bacteremia from positive blood cultures.Proc AMIA Symp.2000:893–897.
- ,,, et al.The nature of adverse events in hospitalized patients. Results of the Harvard Medical Practice Study II.N Engl J Med.1991;324(6):377–384.
- ,,, et al.Incidence and types of adverse events and negligent care in Utah and Colorado.Med Care.2000;38(3):261–271.
- ,,,.General practitioner‐hospital communications: a review of discharge summaries.J Qual Clin Pract.2001;21(4):104–108.
- ,,,,,.Failure to recognize and act on abnormal test results: the case of screening bone densitometry.Jt Comm J Qual Patient Saf.2005;31(2):90–97.
Many hospitalized patients have microbiology test results pending at the time of discharge.1, 2 Failure to follow up on these results in a timely fashion can lead to delays in diagnosis and adequate treatment of important infections. Prompt communication of the results of these pending tests to the responsible providers is crucial to minimize these delays.36 As hospitalized patients are increasingly cared for by clinicians other than their primary care providers,7 important information may be lost during the discharge process.8 This increasing fragmentation makes reliable communication of pending tests even more crucial.9, 10
Studies to date have primarily investigated tests from general medical services. In that setting, there is clearly room for improvement in test result communication. Discharge summaries often do not reach the outpatient providers at the time of the patients' follow‐up visits after hospitalization.11 When the discharge summaries are present, the majority of pending tests are not mentioned in them,2, 12, 13 and both inpatient and outpatient physicians are unaware of most of these results when they return.1 However, the specific characteristics of postdischarge microbiology results and the extent to which these results represent potential follow‐up errors in specialties other than general medicine have not been adequately studied.
We aimed to describe the issue of microbiology tests pending at the time of discharge from a hospital‐wide perspective. Specifically, we sought to determine: (1) frequency and characteristics of these results across all admitting services; and (2) how often these results potentially require a change in antimicrobial therapy.
Methods
Study Setting
We conducted our study at a 777‐bed, tertiary‐care academic hospital in Boston, MA with 13 medical and 18 surgical admitting specialties. The human research committee reviewed and approved the study design. For inpatient services, the hospital had well‐established computerized order entry and electronic discharge medication list systems, along with paper clinical notes. The affiliated outpatient practices used an internally developed electronic health record that could access the test results obtained during hospitalization.
Data Collection
We analyzed all 111,331 results of blood, urine, cerebrospinal fluid (CSF), and sputum cultures that were finalized by the hospital's microbiology laboratory in calendar year 2007. For each result, we determined the type of culture, the date of collection, the date of final result, and the identity and antibiotic susceptibility of any organisms isolated in the microbiology lab. For blood and CSF cultures, we also collected the date of preliminary susceptibilities. Preliminary susceptibilities are not reported for urine and sputum cultures at our institution. For cultures collected during hospital admission, we determined the dates of hospital admission and discharge, hospital service caring for the patient at the time of discharge, and the list of medications prescribed to the patient at discharge.
Case Selection Criteria
Our goal was to screen for postdischarge microbiology results that were likely to require action from the clinicians. To this end, we identified cases that were: (1) clinically important, which we defined as likely to represent a true infection or require further evaluation; and (2) were untreated at the time of discharge, which we defined as cases with no antibiotic or inadequate antibiotic therapy. We first excluded cultures obtained while patients were in the outpatient setting. We further excluded all cultures for which the preliminary susceptibilities or final results returned on or before the day of discharge from the hospital.
For each of the four culture types, we developed criteria to identify clinically important results. For blood cultures, we used a prediction model developed and validated at our institution that was based on the identity of the organism, time to first growth, and prior matching culture results.14 For the remaining three culture types, we defined clinical importance based on Centers for Disease Control and Prevention (CDC) definitions of nosocomial infections. These criteria were felt to be adequate to screen for both community‐acquired and nosocomial infections. For urine cultures, we required at least 100,000 colony‐forming units and growth of no more than two distinct organisms. For CSF, any growth was considered clinically important. For sputum, we required a positive culture as well as a discharge diagnosis of pneumonia based on International Classification of Diseases, Ninth Revision (ICD‐9) codes. The discharge diagnosis was included to incorporate the clinical interpretation required to separate true infections from contaminated samples or colonization.
To identify the untreated cultures, we compared the antibiotic susceptibility of the clinically important postdischarge results against the list of antibiotics prescribed to the patients at the time of hospital discharge. We considered the infections treated if there was at least one antibiotic on the discharge medication list to which the organism was found to be susceptible.
Manual Review
We manually reviewed a random sample of 94 of the clinically important and untreated postdischarge results to determine if the results potentially required a change in therapy and therefore required follow‐up. For each case, the electronic patient chart was reviewed by two internal medicine‐trained physicians on the study staff. Each reviewer was blinded to events that occurred after the cultures returned, and determined whether the results necessitated a potential change in antibiotic. The reviewer then indicated the level of certainty of that determination on a 6‐point Likert scale that had been previously used in reviews to identify adverse medical events15, 16: 1 = little or no evidence, 2 = slight evidence, 3 = not quite likely (<50:50 but close call), 4 = more likely than not (>50:50 but close call), 5 = strong evidence, and 6 = virtually certain evidence. To standardize the assignment of certainty for potential need for antibiotic change, we used a set of review guidelines developed by our study staff (Figure 1). A microbiology result was defined as potentially necessitating antibiotic change if both reviewers indicated as such and recorded a certainty with a score 4. Differences in assessments were resolved through discussion of the case between the reviewers.
Statistical Analysis
Using the 94 manually reviewed results, we examined how the proportion of clinically important and untreated microbiology results requiring follow‐up varied by type of culture and primary discharging service. We created a multivariable logistic regression model to predict which of the untreated, postdischarge results required follow‐up. The covariates in our model were selected a priori and included type of culture, hospital service at the time of discharge, patient age, sex, and insurance status. Type of culture and hospital service were included to determine how the distribution of untreated results varied across hospital specialties. Patient age, sex, and insurance status were included to account for differences in the prevalence of antibiotic‐resistant organisms and the clinician's choice of which empiric antimicrobial agent, if any, to initiate based on these patient‐level factors. We calculated a kappa statistic to measure the concordance of the assessments of the two reviewers prior to resolution of disagreements. All analyses were performed using SAS (version 9.2, Cary, NC).
Results
Of the 111,331 blood, urine, sputum, and CSF cultures analyzed, 77,349 (69%) were collected from hospitalized patients. The majority (63%) of the inpatient results were for blood cultures and one quarter (24%) were for urine cultures. Table 1 shows the distribution of the microbiology results across primary services responsible for the patients at the time of discharge. Half (49%) of the patients from whom the specimens were collected were female. The mean age of patients was 55 years. Most (68%) were white and most (86%) had either commercial insurance or Medicare (Table 1).
| Variable | Results for Admitted Patients (n = 77,349) | Results Finalized Postdischarge (n = 8,668) |
|---|---|---|
| ||
| Type of culture, n (%) | ||
| Urine | 18,746 (24) | 2,843 (33) |
| Blood | 48,546 (63) | 4,696 (54) |
| Sputum | 8,466 (11) | 1,059 (12) |
| CSF | 1,591 (2) | 70 (1) |
| Hospital service at discharge, n (%) | ||
| General Medicine | 15,997 (21) | 2,548 (29) |
| Oncology | 13,138 (17) | 1,341 (15) |
| Medical subspecialties | 20,846 (27) | 2,025 (23) |
| Surgery | 23,380 (30) | 2,031 (23) |
| Other | 3,988 (5) | 723 (8) |
| Patient characteristics | ||
| Female, n (%) | 38,125 (49) | 4,539 (52) |
| Age, n (SD) | 55 (21) | 56 (19) |
| Race, n (%) | ||
| White | 52,824 (68) | 5,669 (65) |
| Black | 9,319 (12) | 1,241 (14) |
| Asian | 1,565 (2) | 183 (2) |
| Hispanic | 5,116 (7) | 897 (10) |
| Other | 1,330 (2) | 146 (2) |
| Unavailable | 7,195 (9) | 532 (6) |
| Insurance, n (%) | ||
| Commercial | 35,893 (46) | 3,977 (46) |
| Medicare | 30,553 (40) | 3,473 (40) |
| Medicaid | 9,514 (12) | 1,034 (12) |
| Other | 1,389 (2) | 184 (2) |
Of the 77,349 microbiology tests obtained during hospital stays, 8668 (11%) of the inpatient microbiology results were reported after the patients were discharged from the hospital. Most (54%) of these postdischarge results were for blood cultures. The distribution of results across primary hospital service, patient sex, race, insurance, and mean patient age were similar to those for all inpatient results (Table 1). Of the 8668 postdischarge results, 385 (4%) met our screening criteria of being both clinically important and not treated by an antibiotic to which the organism was found susceptible at the time of discharge from the hospital. After manual review of a random subset of 94 of these screen‐positive cases, 50 (53%) required follow‐up (Figure 2). The interrater reliability for the reviewers was found to be kappa = 0.58 (P < 0.001). From our results, we estimated that 2.4% of the postdischarge microbiology results required follow‐up and potential change in therapy.
Potential need for antibiotic change was present in 30 of 45 (67%) urine cultures, 12 of 32 (38%) blood cultures, 8 of 16 (50%) sputum cultures, and 0 of 1 (0%) CSF cultures. By primary service, reviewers identified a potential need for antibiotic change in 19 of 25 (76%) of results from surgical services, 17 of 29 (59%) from general medicine, 6 of 16 (38%) from oncology, and 8 of 23 (35%) from medical subspecialties. Examples of cases that potentially required antibiotic change are shown in Table 2.
| Culture Type | Scenario |
|---|---|
| Urine | 42‐year‐old woman with dysuria after admission for hysterectomy; no empiric antibiotic treatment given; postdischarge urine culture grew Klebsiella pneumoniae |
| Blood | 81‐year‐old man with Crohn's disease on total parenteral nutrition (TPN) who was initially treated for sepsis from suspected line infection, but discharged without antibiotics, given negative cultures during admission; postdischarge blood culture grew Klebsiella pneumoniae |
| Sputum | 46‐year‐old woman prescribed levofloxacin for pneumonia; sputum culture returns postdischarge with Pseudomonas aeruginosa resistant to levofloxacin |
In our logistic regression model, both the type of culture and the primary hospital service were found to be significant predictors of a potential need for antibiotic change in the manually reviewed cases. Urine cultures were more likely than non‐urine cultures to potentially require antibiotic change (P = 0.03; OR 2.8, 95% CI 1.1‐7.2). Results from surgical services were most likely to potentially require antibiotic change, followed by general medicine, oncology, and medical subspecialties (Table 3).
| Variable | Results Potentially Requiring Change in Therapy (n = 50) | Results Not Requiring Change in Therapy (n = 44) | Odds Ratio (95% CI)* | Adjusted P‐value* |
|---|---|---|---|---|
| ||||
| Type of culture, n (%) | ||||
| Urine | 30 (60) | 15 (34) | 2.84 (1.13‐7.17) | 0.03 |
| Non‐urine | 20 (40) | 29 (66) | Ref | |
| Hospital service at discharge, n (%) | ||||
| General Medicine | 17 (34) | 12 (27) | Ref | |
| Oncology | 6 (12) | 10 (23) | 0.41 (0.11‐1.56) | 0.02 |
| Medical subspecialties | 8 (16) | 16 (36) | 0.34 (0.10‐1.16) | |
| Surgery | 19 (38) | 6 (14) | 2.40 (0.65‐8.89) | |
| Age, mean (SD) | 61 (20) | 59 (21) | 1.01 (0.98‐1.04) | 0.62 |
| Female, n (%) | 29 (58) | 21 (42) | 1.15 (0.44‐2.98) | 0.77 |
| Insurance, n (%) | ||||
| Commercial | 17 (34) | 19 (43) | Ref | |
| Medicare | 25 (50) | 19 (43) | 1.60 (0.42‐6.11) | 0.65 |
| Medicaid and other | 8 (16) | 6 (14) | 1.78 (0.43‐7.36) | |
Discussion
We performed a retrospective analysis of all blood, urine, sputum, and CSF cultures finalized at our institution in 2007 and found that many returned after patients were discharged. Overall, we estimated that 2.4% of these postdischarge results potentially required a change in antibiotic. This proportion varied by culture type and by primary hospital service at the time of discharge, with urine cultures and cultures from surgical services being most likely to potentially need change in antibiotic.
We speculate that postdischarge urine cultures may have been more likely to require antibiotic change in part due to different urgency that clinicians assign to different culture types. Urinary tract infections may present with more vague, transient, or minor complaints compared with bacteremia, pneumonia, and cerebrospinal fluid infections. For that reason, clinicians may be more likely to forego empiric antibiotics for pending urine cultures in favor of watchful waiting. Therefore, the postdischarge urine cultures with growth may include a higher proportion of untreated true infections compared with other culture types.
A similar difference in prescription of empiric antibiotics may help explain the differences seen across primary hospital specialties. For example, if patients on surgical services were less likely to receive empiric antibiotics, then the pool of postdischarge results would be more likely to include true infections that require antibiotic change. Furthermore, it is possible that surgical services may tend to order cultures for patients only if they already have convincing evidence of infections. It may be that selecting a group with higher likelihood of infection led to a higher proportion of true infections in surgical patients with cultures with growth.
Prior studies led by Roy and Were illustrated that pending microbiology results from general medicine services were often not communicated and followed up adequately.1, 2 For patients discharged with pending test results, between 47% and 89% of discharge summaries did not mention the pending tests.2, 12, 13, 17 These deficiencies in discharge summaries likely have a substantial impact on the proportion of tests followed up by outpatient clinicians. By extending the analysis hospital‐wide, our study suggests that pending microbiology results occur for a wide range of hospital services. While our study was not designed to determine whether these results were followed up appropriately, opportunities for miscommunication and missed follow‐up likely exist for all specialties.
The potential harms associated with inadequate test follow‐up have gained the attention of the patient safety community. In 2005, the Joint Commission underscored the importance of proper communication of critical lab results.3, 5, 18 Their recommendations included the development of systems to ensure adequate follow‐up of critical results in high‐risk scenarios including the postdischarge period.5 While many of the microbiology results do not fall into the criticalcategory, we feel that these results should be considered for inclusion in hospital efforts to track postdischarge results. These efforts should also address issues specific to microbiology results, such as preliminary status before antibiotic sensitivities are known.
Developing a comprehensive strategy for test result communication is challenging, and more so for results that return after transitions of care. Even defining the proper target of communication interventions can involve complex organizational and cultural issues. As these results span the inpatient and outpatient domains, there may be some ambiguity as to which provider is responsible when the results return. The inpatient clinicians ordering the microbiology cultures are in the best position to put the results into the patient's clinical context. However, these clinicians may no longer be on clinical duty when the results return, or they may not have a system to ensure that they are notified about these results. While the outpatient providers may be available, they have often not seen the patient in follow‐up at the time the results return and would need to repeat a clinical assessment to determine whether a change in antibiotics is required. While many feel that the ordering provider is a logical choice to perform the follow‐up of the result, not all agree and few institutions have developed clear policies on this issue. To avoid this ambiguity, future work will require institutions to clearly outline which party is responsible for test result follow‐up during transitions of care.
Potential solutions to improve communication of these results must be tailored to the local infrastructure of the institution. In hospitals that do not have extensive electronic systems, a solution might involve a registered nurse, nurse practitioner, or lab technician whose responsibilities include identifying postdischarge results and communicating them to the ordering clinician, primary care provider, and patient. In settings with more advanced electronic infrastructure, solutions could be designed to automatically notify the responsible providers electronically, as well as post the results to a patient portal. Regardless of the level of technical sophistication, it is vital to create a system that has is highly reliable to prevent these important results from falling through the cracks.
Our study did have some limitations. First, we evaluated results from only one institution. It is unclear how substantially differences in practice patterns or patient populations would affect the number of postdischarge microbiology results in other settings. Second, we did not assess whether these results were actually followed up or whether treatment regimens were altered. As this study was retrospective in nature, we could not expect clinicians to recall the clinical scenarios surrounding each result and decided that documentation in clinical notes would be an unreliable indicator of whether any follow‐up action had been taken. Even without this information, however, we would submit that our findings represent a substantial near‐miss rate and threat to patient safety (approximately one potentially actionable, postdischarge microbiology result every other day for our hospital), and call for a fail‐safe system to ensure appropriate actions are taken.
In conclusion, microbiology results are often pending at the time patients are discharged from the hospital and roughly 2.4% of these results potentially require a change in therapy. This proportion was highest for urine cultures and cultures drawn from surgical patients. Our results suggest that a hospital‐wide system is warranted to ensure adequate communication of postdischarge microbiology results. Further research is required to evaluate the impact of such a system on the follow‐up rates of pending microbiology tests.
Acknowledgements
The authors thank Deborah Williams from the Brigham and Women's Division of General Medicine for her programming assistance.
Many hospitalized patients have microbiology test results pending at the time of discharge.1, 2 Failure to follow up on these results in a timely fashion can lead to delays in diagnosis and adequate treatment of important infections. Prompt communication of the results of these pending tests to the responsible providers is crucial to minimize these delays.36 As hospitalized patients are increasingly cared for by clinicians other than their primary care providers,7 important information may be lost during the discharge process.8 This increasing fragmentation makes reliable communication of pending tests even more crucial.9, 10
Studies to date have primarily investigated tests from general medical services. In that setting, there is clearly room for improvement in test result communication. Discharge summaries often do not reach the outpatient providers at the time of the patients' follow‐up visits after hospitalization.11 When the discharge summaries are present, the majority of pending tests are not mentioned in them,2, 12, 13 and both inpatient and outpatient physicians are unaware of most of these results when they return.1 However, the specific characteristics of postdischarge microbiology results and the extent to which these results represent potential follow‐up errors in specialties other than general medicine have not been adequately studied.
We aimed to describe the issue of microbiology tests pending at the time of discharge from a hospital‐wide perspective. Specifically, we sought to determine: (1) frequency and characteristics of these results across all admitting services; and (2) how often these results potentially require a change in antimicrobial therapy.
Methods
Study Setting
We conducted our study at a 777‐bed, tertiary‐care academic hospital in Boston, MA with 13 medical and 18 surgical admitting specialties. The human research committee reviewed and approved the study design. For inpatient services, the hospital had well‐established computerized order entry and electronic discharge medication list systems, along with paper clinical notes. The affiliated outpatient practices used an internally developed electronic health record that could access the test results obtained during hospitalization.
Data Collection
We analyzed all 111,331 results of blood, urine, cerebrospinal fluid (CSF), and sputum cultures that were finalized by the hospital's microbiology laboratory in calendar year 2007. For each result, we determined the type of culture, the date of collection, the date of final result, and the identity and antibiotic susceptibility of any organisms isolated in the microbiology lab. For blood and CSF cultures, we also collected the date of preliminary susceptibilities. Preliminary susceptibilities are not reported for urine and sputum cultures at our institution. For cultures collected during hospital admission, we determined the dates of hospital admission and discharge, hospital service caring for the patient at the time of discharge, and the list of medications prescribed to the patient at discharge.
Case Selection Criteria
Our goal was to screen for postdischarge microbiology results that were likely to require action from the clinicians. To this end, we identified cases that were: (1) clinically important, which we defined as likely to represent a true infection or require further evaluation; and (2) were untreated at the time of discharge, which we defined as cases with no antibiotic or inadequate antibiotic therapy. We first excluded cultures obtained while patients were in the outpatient setting. We further excluded all cultures for which the preliminary susceptibilities or final results returned on or before the day of discharge from the hospital.
For each of the four culture types, we developed criteria to identify clinically important results. For blood cultures, we used a prediction model developed and validated at our institution that was based on the identity of the organism, time to first growth, and prior matching culture results.14 For the remaining three culture types, we defined clinical importance based on Centers for Disease Control and Prevention (CDC) definitions of nosocomial infections. These criteria were felt to be adequate to screen for both community‐acquired and nosocomial infections. For urine cultures, we required at least 100,000 colony‐forming units and growth of no more than two distinct organisms. For CSF, any growth was considered clinically important. For sputum, we required a positive culture as well as a discharge diagnosis of pneumonia based on International Classification of Diseases, Ninth Revision (ICD‐9) codes. The discharge diagnosis was included to incorporate the clinical interpretation required to separate true infections from contaminated samples or colonization.
To identify the untreated cultures, we compared the antibiotic susceptibility of the clinically important postdischarge results against the list of antibiotics prescribed to the patients at the time of hospital discharge. We considered the infections treated if there was at least one antibiotic on the discharge medication list to which the organism was found to be susceptible.
Manual Review
We manually reviewed a random sample of 94 of the clinically important and untreated postdischarge results to determine if the results potentially required a change in therapy and therefore required follow‐up. For each case, the electronic patient chart was reviewed by two internal medicine‐trained physicians on the study staff. Each reviewer was blinded to events that occurred after the cultures returned, and determined whether the results necessitated a potential change in antibiotic. The reviewer then indicated the level of certainty of that determination on a 6‐point Likert scale that had been previously used in reviews to identify adverse medical events15, 16: 1 = little or no evidence, 2 = slight evidence, 3 = not quite likely (<50:50 but close call), 4 = more likely than not (>50:50 but close call), 5 = strong evidence, and 6 = virtually certain evidence. To standardize the assignment of certainty for potential need for antibiotic change, we used a set of review guidelines developed by our study staff (Figure 1). A microbiology result was defined as potentially necessitating antibiotic change if both reviewers indicated as such and recorded a certainty with a score 4. Differences in assessments were resolved through discussion of the case between the reviewers.
Statistical Analysis
Using the 94 manually reviewed results, we examined how the proportion of clinically important and untreated microbiology results requiring follow‐up varied by type of culture and primary discharging service. We created a multivariable logistic regression model to predict which of the untreated, postdischarge results required follow‐up. The covariates in our model were selected a priori and included type of culture, hospital service at the time of discharge, patient age, sex, and insurance status. Type of culture and hospital service were included to determine how the distribution of untreated results varied across hospital specialties. Patient age, sex, and insurance status were included to account for differences in the prevalence of antibiotic‐resistant organisms and the clinician's choice of which empiric antimicrobial agent, if any, to initiate based on these patient‐level factors. We calculated a kappa statistic to measure the concordance of the assessments of the two reviewers prior to resolution of disagreements. All analyses were performed using SAS (version 9.2, Cary, NC).
Results
Of the 111,331 blood, urine, sputum, and CSF cultures analyzed, 77,349 (69%) were collected from hospitalized patients. The majority (63%) of the inpatient results were for blood cultures and one quarter (24%) were for urine cultures. Table 1 shows the distribution of the microbiology results across primary services responsible for the patients at the time of discharge. Half (49%) of the patients from whom the specimens were collected were female. The mean age of patients was 55 years. Most (68%) were white and most (86%) had either commercial insurance or Medicare (Table 1).
| Variable | Results for Admitted Patients (n = 77,349) | Results Finalized Postdischarge (n = 8,668) |
|---|---|---|
| ||
| Type of culture, n (%) | ||
| Urine | 18,746 (24) | 2,843 (33) |
| Blood | 48,546 (63) | 4,696 (54) |
| Sputum | 8,466 (11) | 1,059 (12) |
| CSF | 1,591 (2) | 70 (1) |
| Hospital service at discharge, n (%) | ||
| General Medicine | 15,997 (21) | 2,548 (29) |
| Oncology | 13,138 (17) | 1,341 (15) |
| Medical subspecialties | 20,846 (27) | 2,025 (23) |
| Surgery | 23,380 (30) | 2,031 (23) |
| Other | 3,988 (5) | 723 (8) |
| Patient characteristics | ||
| Female, n (%) | 38,125 (49) | 4,539 (52) |
| Age, n (SD) | 55 (21) | 56 (19) |
| Race, n (%) | ||
| White | 52,824 (68) | 5,669 (65) |
| Black | 9,319 (12) | 1,241 (14) |
| Asian | 1,565 (2) | 183 (2) |
| Hispanic | 5,116 (7) | 897 (10) |
| Other | 1,330 (2) | 146 (2) |
| Unavailable | 7,195 (9) | 532 (6) |
| Insurance, n (%) | ||
| Commercial | 35,893 (46) | 3,977 (46) |
| Medicare | 30,553 (40) | 3,473 (40) |
| Medicaid | 9,514 (12) | 1,034 (12) |
| Other | 1,389 (2) | 184 (2) |
Of the 77,349 microbiology tests obtained during hospital stays, 8668 (11%) of the inpatient microbiology results were reported after the patients were discharged from the hospital. Most (54%) of these postdischarge results were for blood cultures. The distribution of results across primary hospital service, patient sex, race, insurance, and mean patient age were similar to those for all inpatient results (Table 1). Of the 8668 postdischarge results, 385 (4%) met our screening criteria of being both clinically important and not treated by an antibiotic to which the organism was found susceptible at the time of discharge from the hospital. After manual review of a random subset of 94 of these screen‐positive cases, 50 (53%) required follow‐up (Figure 2). The interrater reliability for the reviewers was found to be kappa = 0.58 (P < 0.001). From our results, we estimated that 2.4% of the postdischarge microbiology results required follow‐up and potential change in therapy.
Potential need for antibiotic change was present in 30 of 45 (67%) urine cultures, 12 of 32 (38%) blood cultures, 8 of 16 (50%) sputum cultures, and 0 of 1 (0%) CSF cultures. By primary service, reviewers identified a potential need for antibiotic change in 19 of 25 (76%) of results from surgical services, 17 of 29 (59%) from general medicine, 6 of 16 (38%) from oncology, and 8 of 23 (35%) from medical subspecialties. Examples of cases that potentially required antibiotic change are shown in Table 2.
| Culture Type | Scenario |
|---|---|
| Urine | 42‐year‐old woman with dysuria after admission for hysterectomy; no empiric antibiotic treatment given; postdischarge urine culture grew Klebsiella pneumoniae |
| Blood | 81‐year‐old man with Crohn's disease on total parenteral nutrition (TPN) who was initially treated for sepsis from suspected line infection, but discharged without antibiotics, given negative cultures during admission; postdischarge blood culture grew Klebsiella pneumoniae |
| Sputum | 46‐year‐old woman prescribed levofloxacin for pneumonia; sputum culture returns postdischarge with Pseudomonas aeruginosa resistant to levofloxacin |
In our logistic regression model, both the type of culture and the primary hospital service were found to be significant predictors of a potential need for antibiotic change in the manually reviewed cases. Urine cultures were more likely than non‐urine cultures to potentially require antibiotic change (P = 0.03; OR 2.8, 95% CI 1.1‐7.2). Results from surgical services were most likely to potentially require antibiotic change, followed by general medicine, oncology, and medical subspecialties (Table 3).
| Variable | Results Potentially Requiring Change in Therapy (n = 50) | Results Not Requiring Change in Therapy (n = 44) | Odds Ratio (95% CI)* | Adjusted P‐value* |
|---|---|---|---|---|
| ||||
| Type of culture, n (%) | ||||
| Urine | 30 (60) | 15 (34) | 2.84 (1.13‐7.17) | 0.03 |
| Non‐urine | 20 (40) | 29 (66) | Ref | |
| Hospital service at discharge, n (%) | ||||
| General Medicine | 17 (34) | 12 (27) | Ref | |
| Oncology | 6 (12) | 10 (23) | 0.41 (0.11‐1.56) | 0.02 |
| Medical subspecialties | 8 (16) | 16 (36) | 0.34 (0.10‐1.16) | |
| Surgery | 19 (38) | 6 (14) | 2.40 (0.65‐8.89) | |
| Age, mean (SD) | 61 (20) | 59 (21) | 1.01 (0.98‐1.04) | 0.62 |
| Female, n (%) | 29 (58) | 21 (42) | 1.15 (0.44‐2.98) | 0.77 |
| Insurance, n (%) | ||||
| Commercial | 17 (34) | 19 (43) | Ref | |
| Medicare | 25 (50) | 19 (43) | 1.60 (0.42‐6.11) | 0.65 |
| Medicaid and other | 8 (16) | 6 (14) | 1.78 (0.43‐7.36) | |
Discussion
We performed a retrospective analysis of all blood, urine, sputum, and CSF cultures finalized at our institution in 2007 and found that many returned after patients were discharged. Overall, we estimated that 2.4% of these postdischarge results potentially required a change in antibiotic. This proportion varied by culture type and by primary hospital service at the time of discharge, with urine cultures and cultures from surgical services being most likely to potentially need change in antibiotic.
We speculate that postdischarge urine cultures may have been more likely to require antibiotic change in part due to different urgency that clinicians assign to different culture types. Urinary tract infections may present with more vague, transient, or minor complaints compared with bacteremia, pneumonia, and cerebrospinal fluid infections. For that reason, clinicians may be more likely to forego empiric antibiotics for pending urine cultures in favor of watchful waiting. Therefore, the postdischarge urine cultures with growth may include a higher proportion of untreated true infections compared with other culture types.
A similar difference in prescription of empiric antibiotics may help explain the differences seen across primary hospital specialties. For example, if patients on surgical services were less likely to receive empiric antibiotics, then the pool of postdischarge results would be more likely to include true infections that require antibiotic change. Furthermore, it is possible that surgical services may tend to order cultures for patients only if they already have convincing evidence of infections. It may be that selecting a group with higher likelihood of infection led to a higher proportion of true infections in surgical patients with cultures with growth.
Prior studies led by Roy and Were illustrated that pending microbiology results from general medicine services were often not communicated and followed up adequately.1, 2 For patients discharged with pending test results, between 47% and 89% of discharge summaries did not mention the pending tests.2, 12, 13, 17 These deficiencies in discharge summaries likely have a substantial impact on the proportion of tests followed up by outpatient clinicians. By extending the analysis hospital‐wide, our study suggests that pending microbiology results occur for a wide range of hospital services. While our study was not designed to determine whether these results were followed up appropriately, opportunities for miscommunication and missed follow‐up likely exist for all specialties.
The potential harms associated with inadequate test follow‐up have gained the attention of the patient safety community. In 2005, the Joint Commission underscored the importance of proper communication of critical lab results.3, 5, 18 Their recommendations included the development of systems to ensure adequate follow‐up of critical results in high‐risk scenarios including the postdischarge period.5 While many of the microbiology results do not fall into the criticalcategory, we feel that these results should be considered for inclusion in hospital efforts to track postdischarge results. These efforts should also address issues specific to microbiology results, such as preliminary status before antibiotic sensitivities are known.
Developing a comprehensive strategy for test result communication is challenging, and more so for results that return after transitions of care. Even defining the proper target of communication interventions can involve complex organizational and cultural issues. As these results span the inpatient and outpatient domains, there may be some ambiguity as to which provider is responsible when the results return. The inpatient clinicians ordering the microbiology cultures are in the best position to put the results into the patient's clinical context. However, these clinicians may no longer be on clinical duty when the results return, or they may not have a system to ensure that they are notified about these results. While the outpatient providers may be available, they have often not seen the patient in follow‐up at the time the results return and would need to repeat a clinical assessment to determine whether a change in antibiotics is required. While many feel that the ordering provider is a logical choice to perform the follow‐up of the result, not all agree and few institutions have developed clear policies on this issue. To avoid this ambiguity, future work will require institutions to clearly outline which party is responsible for test result follow‐up during transitions of care.
Potential solutions to improve communication of these results must be tailored to the local infrastructure of the institution. In hospitals that do not have extensive electronic systems, a solution might involve a registered nurse, nurse practitioner, or lab technician whose responsibilities include identifying postdischarge results and communicating them to the ordering clinician, primary care provider, and patient. In settings with more advanced electronic infrastructure, solutions could be designed to automatically notify the responsible providers electronically, as well as post the results to a patient portal. Regardless of the level of technical sophistication, it is vital to create a system that has is highly reliable to prevent these important results from falling through the cracks.
Our study did have some limitations. First, we evaluated results from only one institution. It is unclear how substantially differences in practice patterns or patient populations would affect the number of postdischarge microbiology results in other settings. Second, we did not assess whether these results were actually followed up or whether treatment regimens were altered. As this study was retrospective in nature, we could not expect clinicians to recall the clinical scenarios surrounding each result and decided that documentation in clinical notes would be an unreliable indicator of whether any follow‐up action had been taken. Even without this information, however, we would submit that our findings represent a substantial near‐miss rate and threat to patient safety (approximately one potentially actionable, postdischarge microbiology result every other day for our hospital), and call for a fail‐safe system to ensure appropriate actions are taken.
In conclusion, microbiology results are often pending at the time patients are discharged from the hospital and roughly 2.4% of these results potentially require a change in therapy. This proportion was highest for urine cultures and cultures drawn from surgical patients. Our results suggest that a hospital‐wide system is warranted to ensure adequate communication of postdischarge microbiology results. Further research is required to evaluate the impact of such a system on the follow‐up rates of pending microbiology tests.
Acknowledgements
The authors thank Deborah Williams from the Brigham and Women's Division of General Medicine for her programming assistance.
- ,,, et al.Patient safety concerns arising from test results that return after hospital discharge.Ann Intern Med.2005;143(2):121–128.
- ,,, et al.Adequacy of hospital discharge summaries in documenting tests with pending results and outpatient follow‐up providers.J Gen Intern Med.2009;24(9):1002–1006.
- ,.Doing better with critical test results.Jt Comm J Qual Patient Saf.2005;31(2):61,66–67.
- .Fumbled handoffs: one dropped ball after another.Ann Intern Med.2005;142(5):352–358.
- ,,,.Communicating critical test results: safe practice recommendations.Jt Comm J Qual Patient Saf.2005;31(2):68–80.
- .Introduction: Communicating critical test results.Jt Comm J Qual Patient Saf.2005;31(2):61,63–65.
- ,,,.Growth in the care of older patients by hospitalists in the United States.N Engl J Med.2009;360(11):1102–1112.
- ,,.Gaps in the continuity of care and progress on patient safety.BMJ.2000;320(7237):791–794.
- .Key legal principles for hospitalists.Am J Med.2001;111(9B):5S–9S.
- ,,.Passing the clinical baton: 6 principles to guide the hospitalist.Am J Med.2001;111(9B):36S–39S.
- ,,.Dissemination of discharge summaries. Not reaching follow‐up physicians.Can Fam Physician.2002;48:737–742.
- ,,, et al.Communication and information deficits in patients discharged to rehabilitation facilities: an evaluation of five acute care hospitals.J Hosp Med.2009;4(8):E28–33.
- , , , , .Pending laboratory tests and the hospital discharge summary in patients discharged to sub‐acute care.J Gen Intern Med.2010;26(4):393–398.
- ,,,,,.Using electronic data to predict the probability of true bacteremia from positive blood cultures.Proc AMIA Symp.2000:893–897.
- ,,, et al.The nature of adverse events in hospitalized patients. Results of the Harvard Medical Practice Study II.N Engl J Med.1991;324(6):377–384.
- ,,, et al.Incidence and types of adverse events and negligent care in Utah and Colorado.Med Care.2000;38(3):261–271.
- ,,,.General practitioner‐hospital communications: a review of discharge summaries.J Qual Clin Pract.2001;21(4):104–108.
- ,,,,,.Failure to recognize and act on abnormal test results: the case of screening bone densitometry.Jt Comm J Qual Patient Saf.2005;31(2):90–97.
- ,,, et al.Patient safety concerns arising from test results that return after hospital discharge.Ann Intern Med.2005;143(2):121–128.
- ,,, et al.Adequacy of hospital discharge summaries in documenting tests with pending results and outpatient follow‐up providers.J Gen Intern Med.2009;24(9):1002–1006.
- ,.Doing better with critical test results.Jt Comm J Qual Patient Saf.2005;31(2):61,66–67.
- .Fumbled handoffs: one dropped ball after another.Ann Intern Med.2005;142(5):352–358.
- ,,,.Communicating critical test results: safe practice recommendations.Jt Comm J Qual Patient Saf.2005;31(2):68–80.
- .Introduction: Communicating critical test results.Jt Comm J Qual Patient Saf.2005;31(2):61,63–65.
- ,,,.Growth in the care of older patients by hospitalists in the United States.N Engl J Med.2009;360(11):1102–1112.
- ,,.Gaps in the continuity of care and progress on patient safety.BMJ.2000;320(7237):791–794.
- .Key legal principles for hospitalists.Am J Med.2001;111(9B):5S–9S.
- ,,.Passing the clinical baton: 6 principles to guide the hospitalist.Am J Med.2001;111(9B):36S–39S.
- ,,.Dissemination of discharge summaries. Not reaching follow‐up physicians.Can Fam Physician.2002;48:737–742.
- ,,, et al.Communication and information deficits in patients discharged to rehabilitation facilities: an evaluation of five acute care hospitals.J Hosp Med.2009;4(8):E28–33.
- , , , , .Pending laboratory tests and the hospital discharge summary in patients discharged to sub‐acute care.J Gen Intern Med.2010;26(4):393–398.
- ,,,,,.Using electronic data to predict the probability of true bacteremia from positive blood cultures.Proc AMIA Symp.2000:893–897.
- ,,, et al.The nature of adverse events in hospitalized patients. Results of the Harvard Medical Practice Study II.N Engl J Med.1991;324(6):377–384.
- ,,, et al.Incidence and types of adverse events and negligent care in Utah and Colorado.Med Care.2000;38(3):261–271.
- ,,,.General practitioner‐hospital communications: a review of discharge summaries.J Qual Clin Pract.2001;21(4):104–108.
- ,,,,,.Failure to recognize and act on abnormal test results: the case of screening bone densitometry.Jt Comm J Qual Patient Saf.2005;31(2):90–97.
Copyright © 2010 Society of Hospital Medicine

A Numbers Game
New guidelines from the American College of Physicians (ACP) on the use of intensive insulin therapy (IIT) for glycemic control of hospitalized patients have prompted a backlash from physicians, including an SHM mentor, who think the rules could lead to needless confusion on best practices.
The guidelines, issued in February, recommend against using IIT to strictly control or normalize blood glucose in nonsurgical or medical ICU patients with or without diabetes. It also recommends a target blood-glucose level of 140 mg to 200 mg if insulin therapy is used in those patients.
Hospitalist Pedro Ramos, MD, assistant clinical professor of medicine at the University of California at San Diego and a mentor with SHM’s Glycemic Control Mentored Implementation (GCMI) program, says the first two guidelines are in line with current practice, as laid out by a 2009 consensus statement from the American Association of Clinical Endocrinologists and the American Diabetes Association.
The guideline on glucose levels, however, has generated harsh feedback, with one cardiothoracic surgeon calling for ACP to pull the recommendations. Dr. Ramos doesn’t go that far, but he wonders whether that guideline was necessary, as he believes there is little strong evidence on outcomes from 180 mg to 200 mg.
The third guidelin "didn't really add much, other than confusion," Dr. Ramos says.
Dr. Ramos says it's too early to draw best practices from SHM's GCMI program, but the initiative is drawing attention to the issue. He hopes the ACP guidelines won't impede that growth.
"I want [hospitalists] not to focus on the numbers: 140 to 180, 140 to 200," Dr. Ramos explains. "What I want them to take from it is we need control ... we need safe targets and they need to be achievable."
New guidelines from the American College of Physicians (ACP) on the use of intensive insulin therapy (IIT) for glycemic control of hospitalized patients have prompted a backlash from physicians, including an SHM mentor, who think the rules could lead to needless confusion on best practices.
The guidelines, issued in February, recommend against using IIT to strictly control or normalize blood glucose in nonsurgical or medical ICU patients with or without diabetes. It also recommends a target blood-glucose level of 140 mg to 200 mg if insulin therapy is used in those patients.
Hospitalist Pedro Ramos, MD, assistant clinical professor of medicine at the University of California at San Diego and a mentor with SHM’s Glycemic Control Mentored Implementation (GCMI) program, says the first two guidelines are in line with current practice, as laid out by a 2009 consensus statement from the American Association of Clinical Endocrinologists and the American Diabetes Association.
The guideline on glucose levels, however, has generated harsh feedback, with one cardiothoracic surgeon calling for ACP to pull the recommendations. Dr. Ramos doesn’t go that far, but he wonders whether that guideline was necessary, as he believes there is little strong evidence on outcomes from 180 mg to 200 mg.
The third guidelin "didn't really add much, other than confusion," Dr. Ramos says.
Dr. Ramos says it's too early to draw best practices from SHM's GCMI program, but the initiative is drawing attention to the issue. He hopes the ACP guidelines won't impede that growth.
"I want [hospitalists] not to focus on the numbers: 140 to 180, 140 to 200," Dr. Ramos explains. "What I want them to take from it is we need control ... we need safe targets and they need to be achievable."
New guidelines from the American College of Physicians (ACP) on the use of intensive insulin therapy (IIT) for glycemic control of hospitalized patients have prompted a backlash from physicians, including an SHM mentor, who think the rules could lead to needless confusion on best practices.
The guidelines, issued in February, recommend against using IIT to strictly control or normalize blood glucose in nonsurgical or medical ICU patients with or without diabetes. It also recommends a target blood-glucose level of 140 mg to 200 mg if insulin therapy is used in those patients.
Hospitalist Pedro Ramos, MD, assistant clinical professor of medicine at the University of California at San Diego and a mentor with SHM’s Glycemic Control Mentored Implementation (GCMI) program, says the first two guidelines are in line with current practice, as laid out by a 2009 consensus statement from the American Association of Clinical Endocrinologists and the American Diabetes Association.
The guideline on glucose levels, however, has generated harsh feedback, with one cardiothoracic surgeon calling for ACP to pull the recommendations. Dr. Ramos doesn’t go that far, but he wonders whether that guideline was necessary, as he believes there is little strong evidence on outcomes from 180 mg to 200 mg.
The third guidelin "didn't really add much, other than confusion," Dr. Ramos says.
Dr. Ramos says it's too early to draw best practices from SHM's GCMI program, but the initiative is drawing attention to the issue. He hopes the ACP guidelines won't impede that growth.
"I want [hospitalists] not to focus on the numbers: 140 to 180, 140 to 200," Dr. Ramos explains. "What I want them to take from it is we need control ... we need safe targets and they need to be achievable."