User login
Care Model for ED Boarders
Emergency Department (ED) overcrowding has become an important problem in North American hospitals.13 A national survey identified the prolonged length of stay of admitted patients in the ED as the most frequent reason for overcrowding.4 This complex problem occurs when hospital inpatient census increases and prevents admitted patients from being assigned and transported to hospital beds in a timely manner.5 The practice of holding admitted patients in the ED, known as boarding, is typically defined as the length of stay (LOS) in ED beginning 2 hours after the time of admission to the time of transfer to the wards.
In a study of daily mean ED LOS, Rathlev et al.6 concluded that a 5% increase in hospital occupancy resulted in 14 hours of holding time for all patients in the ED, and an observational study found that when hospital occupancy exceeds a threshold of 90%, the ED LOS for admitted patients correspondingly increased.7 Thus, efforts to decrease overcrowding will need to address both ED and hospital throughput and LOS. Most importantly, overcrowding has important consequences on physician and patient satisfaction and the quality of patient care.811
Between 1995 and 2005, ED visits rose 20% from 96.5 million to 115.3 million visits annually, while the number of hospital EDs decreased from 4176 to 3795, making an overall 7% increase in ED utilization rate.12 Similarly, there was a 12% increase in the total inpatient admissions for all registered hospitals in the United States from 31 million in 1995 to 35.3 million in 2005.13 However, despite this increase in demand of ED utilization and inpatient admissions, there had been a steady decline in the supply of hospital beds, from 874,000 in 1995, to 805,000 in 2006.13 These factors have exacerbated the problem of ED overcrowding and boarding.
Not only does boarding entail additional consumption of space, resources, equipment, and manpower, it also potentially compromises patient safety. Typically, hospitalists and inpatient medical teams are engaged in providing care to patients in the wards, while ED physicians and nurses are busy taking care of newly‐arrived ED patients. Non‐ED physicians may have the false impression that their boarded patients, while in the ED, are receiving continuous care and so may decide to delay seeing these patients, which can jeopardize the quality and timeliness of care. Studies have shown that ED overcrowding may potentially lead to poor patient care and outcomes and increased risk for medical errors.1416 ED overcrowding potentially causes multiple effects, including prolonging patient pain and suffering, long patient waiting time, patient dissatisfaction, ambulance diversions, decreased physician productivity, and increased frustration among medical staff.15 In a report by the Joint Commission Accreditation of Healthcare Organizations,17 ED overcrowding was cited as a significant contributing factor in sentinel event cases of patient death or permanent injury due to delays in treatment. Boarding critically ill patients who are physiologically vulnerable and unstable can allow them to be subjected to treatment delays at a pivotal point when time‐sensitive interventions are necessary, ie, sepsis or cardiogenic shockthe golden hour in trauma.16 Medical errors are usually not caused by individual errors but by complex hospital systems; and ED overcrowding is a prime example of a system problem that creates a high‐risk environment for medical errors and threatens patient safety.18
Our hospital commonly has 5 to 15 boarders and often has 20 to 30 boarders at any time. Approximately 90% of these patients are admitted to the Medical Service. In response to this challenge, our institution has designated a full‐time hospitalist to manage boarded patients. The primary goal of this new role is to ensure patient safety and the delivery of high‐quality care while admitted patients are in the ED (Table 1).
| |
| 1 | Round on all patients admitted to the Department of Medicine located in the ED, including those on the Teaching and Nonteaching Services. Rounds focus on patient safety, such as ensuring vital home and hospital medications are administered and changes in stability are noted. All patient updates are documented in the ED electronic medical records (IBEX). |
| 2 | Identify admitted patients who may be downgraded from telemetry to nontelemetry status. Telemetry and cardiac beds are in high demand, and decreasing utilization facilitates obtaining the appropriate ward bed for ED patients. |
| 3 | Assess admitted patients for possible discharge. The patient's condition may have improved or results may indicate that admission is no longer required. The ED hospitalist communicates with the ED physician and wards teams, facilitates management, implements the discharge, and ensures adequate follow‐up. |
| 4 | Refer patients to an ED social worker as needed. |
| 5 | Facilitate referrals to other medical or surgical specialties if indicated. |
| 6 | Clarify the plan of care with the ED staff and facilitates ED communication with the ward team. Acts as a liaison and a resource for the ED physicians and nursing staff. |
| 7 | Supervise the triage duties of the medical admitting resident. |
| 8 | Provide medical consultation to ED physicians for patients not being admitted to the hospital or who are being admitted to other services (eg, surgery). |
The objectives of the study were to determine: (1) the impact on quality of care by assessing laboratory results acted upon and medication follow‐up by the ED hospitalist, and (2) the impact on throughput by assessing the number of ED discharges and telemetry downgrades.
Methods
Setting
The Mount Sinai Medical Center is a tertiary‐care 1121‐bed acute care teaching hospital located in New York City. The hospital borders East Harlem and the Upper East Side of Manhattan. The Medical Service is composed of a Teaching Service, composed of house staff and attendings, and a non‐Teaching Service, composed of nurse practitioners, physician assistants, and attendings. Hospitalists and private attendings may have patients on either the Teaching or the non‐Teaching Service. In 2007, there were 56,541 patients admitted for a total of 332,368 days. The mean LOS for medical inpatients was 5.89 days. The total ED visit was 79,500 with a total inpatient and critical care admissions of 24,522. The mean and median LOS for all ED patients were 623 minutes and 493 minutes, respectively. There were 11,488 patients who qualified as boarders, averaging 31.5 boarders per 24 hours; with a mean and median LOS per boarder of 288 minutes and 198 minutes, respectively. The ED LOS for admitted patients ranged from 2 minutes to 4074 minutes (2.83 days).
Admission Process
Once an ED attending physician decides that a patient is to be admitted, the patient is placed on a computerized list in the ED's electronic medical record (IBEX software). The Medical Admitting Resident (MAR) evaluates and triages admitted patients, and assigns and gives a verbal report to the appropriate Medicine Service (ie, Teaching, non‐Teaching, cardiac telemetry unit, intensive care, etc.). The Admitting Office searches for and assigns the appropriate unit and bed for the patient. A hospitalist or resident physician performs the patient's initial assessment and evaluation in the ED, and admission orders are placed in the inpatient computerized order entry system (TDS). When the bed is ready, the ED nurse gives a verbal report to the floor nurse, and the patient is transported to the ward.
Responsibilities
The specific responsibilities of the ED hospitalist are listed in Table 1. The primary role is to round on patients admitted to the Medicine Service who are located in the ED. This encompasses a wide array of patients and services, including patients assigned to a hospitalist service attending or who have a private attending, patients admitted to the Teaching or non‐Teaching Service, patients admitted to the intensive care unit, and patients admitted to a general medicine or specialty service (eg, telemetry, oncology, human immunodeficiency virus [HIV]). Rounding includes review of the ED's electronic medical record as well as direct examination of patients. The hospitalist focuses on patients with longer ED LOS and on aspects of care that may lapse while patients remain in the ED for prolonged periods. At our institution, the follow‐up of subsequent tests, laboratory values, and medications for ED boarders is the responsibility of the primary inpatient team, though the ED physicians act on urgent and critical results and continue to deliver all emergency care. Through rounding, the ED hospitalist is able to identify abnormal results in a timely manner, alert the ED physician and primary inpatient team, and address abnormalities. Specific examples of laboratory results acted upon include hypokalemia, hyperglycemia, and elevated cardiac enzymes. The ED hospitalist is also able to determine whether any outpatient medications have not yet been administered (eg, antihypertensives, immune suppressants) and ensure that subsequent doses of medications initiated in the ED (eg, antibiotics) are administered during the appropriate timeframe.
Communication is emphasized, as contact with ED physicians, ward physicians, and often the outpatient primary care physician is required when any change in management is considered. The ED hospitalist also provides the capability of rapid response to changes in patient status (eg, a new complaint or fever). In addition, the hospitalist is available to consult on medical patients who may not require admission and on nonmedical patients for whom an internal medicine consult may be beneficial (eg, preoperative optimization of a surgical patient). The ED hospitalist documents the evaluation in the IBEX system. Bills were submitted for visits in which patients were discharged as these encounters are comprehensive, but not for other encounters.
Data Collection
The ED hospitalist role began March 10, 2008 and is a 10‐hour shift (8 AM to 6 PM) on weekdays. The study period was from March 10, 2008 through June 30, 2008. The study was approved by the hospital's institutional review board.
Data were collected on aspects of care that could have been impacted by the ED hospitalist, including medication and laboratory orders, ED discharges, ED admissions avoided, and telemetry downgrades. Discharges from ED refers to boarded admitted patients in the ED, who by the judgment of the ED hospitalist were ready for discharge. Admissions avoided refers to patients who the ED physician planned to admit but had not yet been admitted, and whose admission was avoided through the recommendations made by the ED hospitalist. The ED LOS was defined as the duration of time from when the patient was admitted to the Medicine Service to the time the patient was transferred to a medical ward. Telemetry downgrades were defined as patients assigned to the cardiac telemetry unit who the hospitalist determined required only telemetry on a general medical unit or did not require telemetry, or patients assigned to telemetry on a general medicine unit who the hospitalist determined no longer required telemetry.
Results were expressed as percentages of patients admitted to a Medicine Service and percentage of patients evaluated by the ED hospitalist, as indicated. 95% confidence intervals (CI) were calculated.
Results
During the study period, there were 4363 patients admitted to the Medicine Service and 3555 patients who qualified as boarders (mean of 29 boarders per 24 hours). The mean boarding time of admitted patients was 440 minutes. A total of 634 patients (17.8% of all boarded patients) were evaluated by the ED hospitalist. The mean daily number of patients seen by the ED hospitalist was 8.0.
The key elements of the delivery of care by the ED hospitalist are summarized in Table 2.
| Elements | Boarders (n = 3555) [n (%)] | Patients Intervened on (n = 634) [n (%)] |
|---|---|---|
| ||
| Laboratory results acted upon | 472 (13.2) | 472 (74.5) |
| Medication follow‐up | 506 (14.2) | 506 (79.8) |
| Discharges from the ED* | 46 (1.3) | 46 (7.3) |
| Admissions avoided | 6 (0.2) | 6 (0.95) |
| Telemetry downgrades | 61 (1.8) | 61 (9.6) |
The care of boarded patients included follow‐up of laboratory tests for 74.5% (95% CI, 71‐78%) and medication orders for 79.8% (95% CI, 77‐83%) of patients. A total of 46 patients were discharged by the ED hospitalist (0.6 discharges/day) and telemetry was discontinued for 61 patients (0.8 downgrades/day). The discharge rate was 7.3% (95% CI, 5‐10%) and telemetry downgrade rate was 9.6% (95% CI, 8‐12%) of those patients assessed by the ED hospitalist. Expressed as a percentage of the total ED boarders (n = 3555), the combined discharge rate and the admissions avoided rate was 1.5%.
Table 3 shows the discharge diagnoses made from the ED. Chest pain was the most common diagnosis, followed by syncope, pneumonia, and chronic obstructive pulmonary disease (COPD).
| Diagnoses | Patients (n = 46) [n (%)] |
|---|---|
| |
| Chest pain | 12 (26) |
| Syncope/dizziness | 7 (15) |
| Pneumonia | 4 (9) |
| COPD | 4 (9) |
| Congestive heart failure | 3 (7) |
| Gastroenteritis | 3 (7) |
| Dermatitis/rash | 3 (7) |
| Alcohol abuse | 3 (7) |
| Abdominal pain | 3 (7) |
| End stage renal disease | 2 (4) |
| Vaginal bleeding | 1 (2) |
| Fall | 1 (2) |
| Asthma | 1 (2) |
Discussion
Our hospital has successfully implemented an innovative strategy utilizing a hospitalist to help provide seamless care to medical patients located in the ED. Other solutions at our hospital had previously been implemented, but had not adequately addressed the problem, including: (1) protocols to monitor length of stay patterns and deviations, (2) discharge planning activities, (3) organized computerized bed tracking, (4) improvement in the timeliness of ancillary services, (5) daily bed briefing among nurse managers, and (6) 24‐hour presence of a MAR to facilitate triage in the ED.
The current study demonstrates the potential for substantial impact on patient care. The substantial number of the assessed boarder patients for whom laboratory tests (74.5%) and medications (79.8%) were ordered by the ED hospitalists suggests that the quality and timeliness of care was enhanced by this initiative. In addition, the considerable number of patients discharged from the ED and downgraded from telemetry (1.5% and 1.8% of all boarder patients, respectively) suggests that an ED hospitalist may have a meaningful impact on bed utilization and thus decrease ED overcrowding. In 2007, there were 11,488 who qualified as boarders; our data suggest that an ED hospitalist would result in approximately 172 boarders not being admitted annually.
Though the ED LOS was higher during the study period compared to 2007, it was lower than the 2 months immediately preceding implementation of the ED hospitalist role. The ED LOS was 732 and 658 minutes for January and February 2008, respectively, which was markedly increased from 2007 (288 minutes), and prompted development of the ED hospitalist role. The ED LOS during the study period subsequently decreased to 440 minutes. Though the wide fluctuations in ED LOS and the short time period with high ED LOS prior to implementation preclude concluding that the ED hospitalist role decreased ED LOS, the data suggest that an ED hospitalist may be able to improve ED throughput.
The majority of the discharges made by the ED hospitalist are patients who had been admitted for chest pain, had improved, and had negative cardiac enzymes and stress tests. Patients with syncope who were discharged were likely patients without any comorbidities. The COPD and pneumonia admissions were likely patients who improved after aggressive treatment in the ED.
The impact of ED overcrowding on the quality of patient care and outcomes may be substantial. Hwang et al.19 found a direct correlation between ED census and time to pain assessment and administration of analgesic medication. A study at an academic medical center found that higher ED volume was associated with less likelihood of antibiotics being administered within 4 hours for patients with community‐acquired pneumonia.20 A comprehensive review of the literature identified 41 studies examining the effects of ED overcrowding on clinical outcomes and the investigators noted that ED overcrowding was associated with increased in‐hospital mortality.8
Causes of poor outcomes during periods of overcrowding may be the high volume of acute patients preventing adequate time and attention for each ED patient, as well as confusion during the transition from ED to ward physicians. For example, a patient may receive their initial dose of antibiotics from the ED physician, but subsequent doses may be overlooked in the transition of care from the ED physician to the inpatient team. In addition, having admitted patients located in the ED for extended periods of time may lead to these patients not being seen as frequently as patients admitted to the inpatient wards. Another potential consequence of prolonged ED stay for admitted patients is delay in inpatient management. Tests done in the ED may prompt further studies that may not be ordered promptly while patients remain in the ED, which subsequently increases LOS. Other potential issues may be an increase in confusion among geriatric patients in a noisy and crowded ED; decreased access to specialized nursing care that may be available on a hospital ward; decreased access to physical therapy and occupational therapy services; and decreased comfort and satisfaction as patients wait in overcrowded EDs for prolonged periods.
Several other potential innovative solutions to ED overcrowding have been proposed, studied, and tested. These measures generally are focused on improving the three interdependent components of ED workflow: INPUT THROUGHPUT OUTPUT.21, 22 However, process redesign and intervention on these 3 interdependent ED workflow components may be difficult to achieve, especially when hospital resources are limited and when inpatient hospital capacity is already maximized. In some institutions, efforts have been reported to successfully streamline the transfer of admitted ED patients to inpatient beds, through transfer‐to‐ward policy interventions (eg, physician coordinators for patient flow and bed management or transfers made within a defined period of time).2326 However, in a study by Quinn et al.,27 implementation of a rapid admission policy resulted in a decrease of only 10.1 minutes in the ED LOS. Several studies have demonstrated the benefits of an acute medical admissions unit in alleviating ED overcrowding.28, 29 Other unconventional solutions by some hospitals include sending admitted patients to the unit's hallways or placing discharged patients in the hallway while waiting for transportation so that the ED bed will be readily available.30
The ED hospitalist is well‐situated to have an impact on several key hospital outcomes. As the ED hospitalist role was shown to affect processes that relate to ED throughput, it is possible that the role will improve ED overcrowding and decrease ED LOS. Specifically, identifying patients who can be discharged and for whom telemetry is no longer indicated decreases unnecessary bed utilization and allows these beds to be available for other ED patients. This initiative also may promote patient satisfaction by assuring patients that their medical and concerns are being fully addressed while they are in the ED. Increased emphasis on hospital reporting will make patient satisfaction a priority for many hospitals, and the ED hospitalist will be in a unique position to meet and greet patients admitted to the Medicine Service and to reassure them that the medical team is present and addressing their concerns. The hospitalist's ability to facilitate diagnostic testing and treatment while patients remain in the ED may also help decrease the total LOS in the hospital. In addition, the ED hospitalist is also in position to recognize social factors at the earliest stage of admission so that they can be immediately addressed. Future studies will need to be done to determine if this model of transitional care impacts these important factors.
Our study has several important limitations. Most notably, the lack of a comparison interval for which a hospitalist was not assigned to this role prevents us from drawing any definitive conclusions on the benefits of the ED hospitalist model. Also, we collected only summary data and do not have demographic data on the patients managed by the ED hospitalist or information on the ED course of patients who were discharged or had telemetry downgraded. This prevents determination of whether discharged patients did not require admission initially or whose condition evolved over a prolonged ED stay. In addition, other key outcomes, such as patient satisfaction and satisfaction of the ED physicians and nursing staff have not yet been formally measured. Future studies will be needed to determine if an ED hospital model can improve important process and clinical outcomes.
The greatest challenge of this initiative was introducing and familiarizing this role to the key stakeholders, including the ED physicians and nursing staff, house staff, and private practice physicians. Though we did not perform structured surveys on satisfaction, through informal discussions we noted that the role was welcomed with enthusiasm by the ED physicians. Notably, several ED physicians expressed appreciation that they were able to focus their care on new ED patients rather than on the boarded ED patients. Through feedback, we noted soon after implementation that ED faculty and nurses needed further clarification about the potential overlapping roles of the ED hospitalist and ED physicians and ward physicians. These concerns were addressed by educational sessions and announcements, including presentations at ED faculty and staff meetings. The hospitalist assigned to the role each month received individualized orientation prior to assuming the role, and an ED Hospitalist Manual was distributed. Possibly due to these focused sessions, the hospitalists assigned to the role became quickly acclimated.
Conclusions
We have found that designating a hospitalist to directly address the care of ED boarders can enhance the quality and timeliness of care and decrease bed and telemetry utilization with the potential to impact ED and hospital LOS. Given the success of the pilot model, the role was expanded at our institution to 10 hours per day, 7 days per week. Hospitals struggling to address the needs of their admitted patients in the ED should consider incorporating an ED hospitalist to enhance clinical care and address issues relating to throughput. A follow‐up study is needed to more precisely describe the impact of the ED hospitalist model.
- , , , et al.Estimating the degree of emergency department overcrowding in academic medical centers: results of the National ED Overcrowding Study (NEDOCS).Acad Emerg Med.2004;11:38–50.
- , , , et al.Frequency, determinants, and impact of overcrowding in emergency departments in Canada: a national survey.Healthc Q.2007;10:32–40.
- , .EMDOC (emergency department overcrowding) internet‐based safety net research.Admin Emerg Med.2008;35:101–107.
- United States General Accounting Office.Hospital Emergency Departments: Crowded Conditions Vary Among Hospitals and Communities. March 2003.Washington, DC:General Accounting Office;2003.
- .Overcrowding in emergency department: increased demand and decreased capacity.Ann Emerg Med.2002;39:430–432.
- , , , et al.Time series analysis of variables associated with daily mean emergency department length of stay.Ann Emerg Med.2007;49:265–271.
- , , , et al.Effect of hospital occupancy on emergency department length of stay and patient disposition.Ann Emerg Med.2003;10:127–133.
- , , , et al.The effect of emergency department crowding on clinically oriented outcomes.Acad Emerg Med.2009;16:1–10.
- , .Emergency department overcrowding: the impact of resource scarcity on physician job satisfaction.J Health Manag.2005;50:327–340.
- , , , , , .The effect of emergency department crowding on patient satisfaction for admitted patients.Acad Emerg Med.2008;15:825–831.
- , .The effect of crowding on access and quality in an academic ED.Am J Emerg Med.2006;24:787–794.
- , , .National Hospital Ambulatory Medical Care Survey: 2005 Emergency Department Summary. Advance Data from Vital and Health Statistics. No. 386.Hyattsville, MD:National Center for Health Statistics;2007.
- American Hospital Association (AHA).Table 1: Historical trends in utilization, personnel, and finances: year 1946–2006.AHA Hospital Statistics.2008 ed.Chicago:Health Forum LLC;2008:3.
- , .Emergency department overcrowding in the US: an emerging threat to patient safety and public health.Emerg Med J.2003;20:402–405.
- , .Overcrowding in the nation's emergency departments: complex causes and disturbing effects.Ann Emerg Med.2000;35:63–68.
- , .Clinical review: emergency department overcrowding and the potential impact on the critically ill.Crit Care.2005;9:291–295.
- Joint Commission on Accreditation of Healthcare Organizations (JCAHO): Sentinel event alert 2002, Issue 26. Available at: http://www.jointcommission.org/SentinelEvents/SentinelEventAlert/sea_26.htm. Accessed October2009.
- , , , et al.Safety net research in emergency medicine: proceedings of the Academic Emergency Consensus Conference on “The Unraveling Safety Net.”Acad Emerg Med.2001;8:1024–1029.
- , , , , , .Emergency department crowding and decreased quality of pain care.Acad Emerg Med.2008;15:1248–1256.
- , , , .Effect of emergency department crowding on time to antibiotics in patients admitted with community‐acquired pneumonia.Ann Emerg Med.2007;50:501–509.
- , , , et al.A conceptual model of emergency department crowding.Ann Emerg Med.2003;42:173–180.
- , , , et al.Emergency department crowding: consensus development of potential measures.Ann Emerg Med.2003;42:824–834.
- , , , et al.Intervention to decrease emergency department crowding: does it have an effect on return visits and hospital readmission?Ann Emerg Med.2003;41:173–185.
- , , , et al.Rapid process design in a university‐based emergency department: decreasing waiting time intervals and improving patient satisfaction.Ann Emerg Med.2002;39:168–177.
- .Emergency department crowding: an action plan.Acad Emerg Med.2001;18:185–187.
- , , .Hospitalists and an innovative emergency department admission process.J Gen Intern Med.2004;19:266–268.
- , , et al.Effects of implementing a rapid admission policy in the ED.Am J Emerg Med.2007;25:559–563.
- , , .Effect of an emergency department managed acute care unit on ED overcrowding and emergency medical services diversion.Acad Emerg Med.2001;8:1085–1100.
- , , , .Emergency department census of patients awaiting admission following reorganization of an admissions process.Emerg Med J.2006;23:363–367.
- .Emergency department flow and the boarded patient: how to get admitted patients upstairs.Ann Emerg Med.2007;49:68–70.
Emergency Department (ED) overcrowding has become an important problem in North American hospitals.13 A national survey identified the prolonged length of stay of admitted patients in the ED as the most frequent reason for overcrowding.4 This complex problem occurs when hospital inpatient census increases and prevents admitted patients from being assigned and transported to hospital beds in a timely manner.5 The practice of holding admitted patients in the ED, known as boarding, is typically defined as the length of stay (LOS) in ED beginning 2 hours after the time of admission to the time of transfer to the wards.
In a study of daily mean ED LOS, Rathlev et al.6 concluded that a 5% increase in hospital occupancy resulted in 14 hours of holding time for all patients in the ED, and an observational study found that when hospital occupancy exceeds a threshold of 90%, the ED LOS for admitted patients correspondingly increased.7 Thus, efforts to decrease overcrowding will need to address both ED and hospital throughput and LOS. Most importantly, overcrowding has important consequences on physician and patient satisfaction and the quality of patient care.811
Between 1995 and 2005, ED visits rose 20% from 96.5 million to 115.3 million visits annually, while the number of hospital EDs decreased from 4176 to 3795, making an overall 7% increase in ED utilization rate.12 Similarly, there was a 12% increase in the total inpatient admissions for all registered hospitals in the United States from 31 million in 1995 to 35.3 million in 2005.13 However, despite this increase in demand of ED utilization and inpatient admissions, there had been a steady decline in the supply of hospital beds, from 874,000 in 1995, to 805,000 in 2006.13 These factors have exacerbated the problem of ED overcrowding and boarding.
Not only does boarding entail additional consumption of space, resources, equipment, and manpower, it also potentially compromises patient safety. Typically, hospitalists and inpatient medical teams are engaged in providing care to patients in the wards, while ED physicians and nurses are busy taking care of newly‐arrived ED patients. Non‐ED physicians may have the false impression that their boarded patients, while in the ED, are receiving continuous care and so may decide to delay seeing these patients, which can jeopardize the quality and timeliness of care. Studies have shown that ED overcrowding may potentially lead to poor patient care and outcomes and increased risk for medical errors.1416 ED overcrowding potentially causes multiple effects, including prolonging patient pain and suffering, long patient waiting time, patient dissatisfaction, ambulance diversions, decreased physician productivity, and increased frustration among medical staff.15 In a report by the Joint Commission Accreditation of Healthcare Organizations,17 ED overcrowding was cited as a significant contributing factor in sentinel event cases of patient death or permanent injury due to delays in treatment. Boarding critically ill patients who are physiologically vulnerable and unstable can allow them to be subjected to treatment delays at a pivotal point when time‐sensitive interventions are necessary, ie, sepsis or cardiogenic shockthe golden hour in trauma.16 Medical errors are usually not caused by individual errors but by complex hospital systems; and ED overcrowding is a prime example of a system problem that creates a high‐risk environment for medical errors and threatens patient safety.18
Our hospital commonly has 5 to 15 boarders and often has 20 to 30 boarders at any time. Approximately 90% of these patients are admitted to the Medical Service. In response to this challenge, our institution has designated a full‐time hospitalist to manage boarded patients. The primary goal of this new role is to ensure patient safety and the delivery of high‐quality care while admitted patients are in the ED (Table 1).
| |
| 1 | Round on all patients admitted to the Department of Medicine located in the ED, including those on the Teaching and Nonteaching Services. Rounds focus on patient safety, such as ensuring vital home and hospital medications are administered and changes in stability are noted. All patient updates are documented in the ED electronic medical records (IBEX). |
| 2 | Identify admitted patients who may be downgraded from telemetry to nontelemetry status. Telemetry and cardiac beds are in high demand, and decreasing utilization facilitates obtaining the appropriate ward bed for ED patients. |
| 3 | Assess admitted patients for possible discharge. The patient's condition may have improved or results may indicate that admission is no longer required. The ED hospitalist communicates with the ED physician and wards teams, facilitates management, implements the discharge, and ensures adequate follow‐up. |
| 4 | Refer patients to an ED social worker as needed. |
| 5 | Facilitate referrals to other medical or surgical specialties if indicated. |
| 6 | Clarify the plan of care with the ED staff and facilitates ED communication with the ward team. Acts as a liaison and a resource for the ED physicians and nursing staff. |
| 7 | Supervise the triage duties of the medical admitting resident. |
| 8 | Provide medical consultation to ED physicians for patients not being admitted to the hospital or who are being admitted to other services (eg, surgery). |
The objectives of the study were to determine: (1) the impact on quality of care by assessing laboratory results acted upon and medication follow‐up by the ED hospitalist, and (2) the impact on throughput by assessing the number of ED discharges and telemetry downgrades.
Methods
Setting
The Mount Sinai Medical Center is a tertiary‐care 1121‐bed acute care teaching hospital located in New York City. The hospital borders East Harlem and the Upper East Side of Manhattan. The Medical Service is composed of a Teaching Service, composed of house staff and attendings, and a non‐Teaching Service, composed of nurse practitioners, physician assistants, and attendings. Hospitalists and private attendings may have patients on either the Teaching or the non‐Teaching Service. In 2007, there were 56,541 patients admitted for a total of 332,368 days. The mean LOS for medical inpatients was 5.89 days. The total ED visit was 79,500 with a total inpatient and critical care admissions of 24,522. The mean and median LOS for all ED patients were 623 minutes and 493 minutes, respectively. There were 11,488 patients who qualified as boarders, averaging 31.5 boarders per 24 hours; with a mean and median LOS per boarder of 288 minutes and 198 minutes, respectively. The ED LOS for admitted patients ranged from 2 minutes to 4074 minutes (2.83 days).
Admission Process
Once an ED attending physician decides that a patient is to be admitted, the patient is placed on a computerized list in the ED's electronic medical record (IBEX software). The Medical Admitting Resident (MAR) evaluates and triages admitted patients, and assigns and gives a verbal report to the appropriate Medicine Service (ie, Teaching, non‐Teaching, cardiac telemetry unit, intensive care, etc.). The Admitting Office searches for and assigns the appropriate unit and bed for the patient. A hospitalist or resident physician performs the patient's initial assessment and evaluation in the ED, and admission orders are placed in the inpatient computerized order entry system (TDS). When the bed is ready, the ED nurse gives a verbal report to the floor nurse, and the patient is transported to the ward.
Responsibilities
The specific responsibilities of the ED hospitalist are listed in Table 1. The primary role is to round on patients admitted to the Medicine Service who are located in the ED. This encompasses a wide array of patients and services, including patients assigned to a hospitalist service attending or who have a private attending, patients admitted to the Teaching or non‐Teaching Service, patients admitted to the intensive care unit, and patients admitted to a general medicine or specialty service (eg, telemetry, oncology, human immunodeficiency virus [HIV]). Rounding includes review of the ED's electronic medical record as well as direct examination of patients. The hospitalist focuses on patients with longer ED LOS and on aspects of care that may lapse while patients remain in the ED for prolonged periods. At our institution, the follow‐up of subsequent tests, laboratory values, and medications for ED boarders is the responsibility of the primary inpatient team, though the ED physicians act on urgent and critical results and continue to deliver all emergency care. Through rounding, the ED hospitalist is able to identify abnormal results in a timely manner, alert the ED physician and primary inpatient team, and address abnormalities. Specific examples of laboratory results acted upon include hypokalemia, hyperglycemia, and elevated cardiac enzymes. The ED hospitalist is also able to determine whether any outpatient medications have not yet been administered (eg, antihypertensives, immune suppressants) and ensure that subsequent doses of medications initiated in the ED (eg, antibiotics) are administered during the appropriate timeframe.
Communication is emphasized, as contact with ED physicians, ward physicians, and often the outpatient primary care physician is required when any change in management is considered. The ED hospitalist also provides the capability of rapid response to changes in patient status (eg, a new complaint or fever). In addition, the hospitalist is available to consult on medical patients who may not require admission and on nonmedical patients for whom an internal medicine consult may be beneficial (eg, preoperative optimization of a surgical patient). The ED hospitalist documents the evaluation in the IBEX system. Bills were submitted for visits in which patients were discharged as these encounters are comprehensive, but not for other encounters.
Data Collection
The ED hospitalist role began March 10, 2008 and is a 10‐hour shift (8 AM to 6 PM) on weekdays. The study period was from March 10, 2008 through June 30, 2008. The study was approved by the hospital's institutional review board.
Data were collected on aspects of care that could have been impacted by the ED hospitalist, including medication and laboratory orders, ED discharges, ED admissions avoided, and telemetry downgrades. Discharges from ED refers to boarded admitted patients in the ED, who by the judgment of the ED hospitalist were ready for discharge. Admissions avoided refers to patients who the ED physician planned to admit but had not yet been admitted, and whose admission was avoided through the recommendations made by the ED hospitalist. The ED LOS was defined as the duration of time from when the patient was admitted to the Medicine Service to the time the patient was transferred to a medical ward. Telemetry downgrades were defined as patients assigned to the cardiac telemetry unit who the hospitalist determined required only telemetry on a general medical unit or did not require telemetry, or patients assigned to telemetry on a general medicine unit who the hospitalist determined no longer required telemetry.
Results were expressed as percentages of patients admitted to a Medicine Service and percentage of patients evaluated by the ED hospitalist, as indicated. 95% confidence intervals (CI) were calculated.
Results
During the study period, there were 4363 patients admitted to the Medicine Service and 3555 patients who qualified as boarders (mean of 29 boarders per 24 hours). The mean boarding time of admitted patients was 440 minutes. A total of 634 patients (17.8% of all boarded patients) were evaluated by the ED hospitalist. The mean daily number of patients seen by the ED hospitalist was 8.0.
The key elements of the delivery of care by the ED hospitalist are summarized in Table 2.
| Elements | Boarders (n = 3555) [n (%)] | Patients Intervened on (n = 634) [n (%)] |
|---|---|---|
| ||
| Laboratory results acted upon | 472 (13.2) | 472 (74.5) |
| Medication follow‐up | 506 (14.2) | 506 (79.8) |
| Discharges from the ED* | 46 (1.3) | 46 (7.3) |
| Admissions avoided | 6 (0.2) | 6 (0.95) |
| Telemetry downgrades | 61 (1.8) | 61 (9.6) |
The care of boarded patients included follow‐up of laboratory tests for 74.5% (95% CI, 71‐78%) and medication orders for 79.8% (95% CI, 77‐83%) of patients. A total of 46 patients were discharged by the ED hospitalist (0.6 discharges/day) and telemetry was discontinued for 61 patients (0.8 downgrades/day). The discharge rate was 7.3% (95% CI, 5‐10%) and telemetry downgrade rate was 9.6% (95% CI, 8‐12%) of those patients assessed by the ED hospitalist. Expressed as a percentage of the total ED boarders (n = 3555), the combined discharge rate and the admissions avoided rate was 1.5%.
Table 3 shows the discharge diagnoses made from the ED. Chest pain was the most common diagnosis, followed by syncope, pneumonia, and chronic obstructive pulmonary disease (COPD).
| Diagnoses | Patients (n = 46) [n (%)] |
|---|---|
| |
| Chest pain | 12 (26) |
| Syncope/dizziness | 7 (15) |
| Pneumonia | 4 (9) |
| COPD | 4 (9) |
| Congestive heart failure | 3 (7) |
| Gastroenteritis | 3 (7) |
| Dermatitis/rash | 3 (7) |
| Alcohol abuse | 3 (7) |
| Abdominal pain | 3 (7) |
| End stage renal disease | 2 (4) |
| Vaginal bleeding | 1 (2) |
| Fall | 1 (2) |
| Asthma | 1 (2) |
Discussion
Our hospital has successfully implemented an innovative strategy utilizing a hospitalist to help provide seamless care to medical patients located in the ED. Other solutions at our hospital had previously been implemented, but had not adequately addressed the problem, including: (1) protocols to monitor length of stay patterns and deviations, (2) discharge planning activities, (3) organized computerized bed tracking, (4) improvement in the timeliness of ancillary services, (5) daily bed briefing among nurse managers, and (6) 24‐hour presence of a MAR to facilitate triage in the ED.
The current study demonstrates the potential for substantial impact on patient care. The substantial number of the assessed boarder patients for whom laboratory tests (74.5%) and medications (79.8%) were ordered by the ED hospitalists suggests that the quality and timeliness of care was enhanced by this initiative. In addition, the considerable number of patients discharged from the ED and downgraded from telemetry (1.5% and 1.8% of all boarder patients, respectively) suggests that an ED hospitalist may have a meaningful impact on bed utilization and thus decrease ED overcrowding. In 2007, there were 11,488 who qualified as boarders; our data suggest that an ED hospitalist would result in approximately 172 boarders not being admitted annually.
Though the ED LOS was higher during the study period compared to 2007, it was lower than the 2 months immediately preceding implementation of the ED hospitalist role. The ED LOS was 732 and 658 minutes for January and February 2008, respectively, which was markedly increased from 2007 (288 minutes), and prompted development of the ED hospitalist role. The ED LOS during the study period subsequently decreased to 440 minutes. Though the wide fluctuations in ED LOS and the short time period with high ED LOS prior to implementation preclude concluding that the ED hospitalist role decreased ED LOS, the data suggest that an ED hospitalist may be able to improve ED throughput.
The majority of the discharges made by the ED hospitalist are patients who had been admitted for chest pain, had improved, and had negative cardiac enzymes and stress tests. Patients with syncope who were discharged were likely patients without any comorbidities. The COPD and pneumonia admissions were likely patients who improved after aggressive treatment in the ED.
The impact of ED overcrowding on the quality of patient care and outcomes may be substantial. Hwang et al.19 found a direct correlation between ED census and time to pain assessment and administration of analgesic medication. A study at an academic medical center found that higher ED volume was associated with less likelihood of antibiotics being administered within 4 hours for patients with community‐acquired pneumonia.20 A comprehensive review of the literature identified 41 studies examining the effects of ED overcrowding on clinical outcomes and the investigators noted that ED overcrowding was associated with increased in‐hospital mortality.8
Causes of poor outcomes during periods of overcrowding may be the high volume of acute patients preventing adequate time and attention for each ED patient, as well as confusion during the transition from ED to ward physicians. For example, a patient may receive their initial dose of antibiotics from the ED physician, but subsequent doses may be overlooked in the transition of care from the ED physician to the inpatient team. In addition, having admitted patients located in the ED for extended periods of time may lead to these patients not being seen as frequently as patients admitted to the inpatient wards. Another potential consequence of prolonged ED stay for admitted patients is delay in inpatient management. Tests done in the ED may prompt further studies that may not be ordered promptly while patients remain in the ED, which subsequently increases LOS. Other potential issues may be an increase in confusion among geriatric patients in a noisy and crowded ED; decreased access to specialized nursing care that may be available on a hospital ward; decreased access to physical therapy and occupational therapy services; and decreased comfort and satisfaction as patients wait in overcrowded EDs for prolonged periods.
Several other potential innovative solutions to ED overcrowding have been proposed, studied, and tested. These measures generally are focused on improving the three interdependent components of ED workflow: INPUT THROUGHPUT OUTPUT.21, 22 However, process redesign and intervention on these 3 interdependent ED workflow components may be difficult to achieve, especially when hospital resources are limited and when inpatient hospital capacity is already maximized. In some institutions, efforts have been reported to successfully streamline the transfer of admitted ED patients to inpatient beds, through transfer‐to‐ward policy interventions (eg, physician coordinators for patient flow and bed management or transfers made within a defined period of time).2326 However, in a study by Quinn et al.,27 implementation of a rapid admission policy resulted in a decrease of only 10.1 minutes in the ED LOS. Several studies have demonstrated the benefits of an acute medical admissions unit in alleviating ED overcrowding.28, 29 Other unconventional solutions by some hospitals include sending admitted patients to the unit's hallways or placing discharged patients in the hallway while waiting for transportation so that the ED bed will be readily available.30
The ED hospitalist is well‐situated to have an impact on several key hospital outcomes. As the ED hospitalist role was shown to affect processes that relate to ED throughput, it is possible that the role will improve ED overcrowding and decrease ED LOS. Specifically, identifying patients who can be discharged and for whom telemetry is no longer indicated decreases unnecessary bed utilization and allows these beds to be available for other ED patients. This initiative also may promote patient satisfaction by assuring patients that their medical and concerns are being fully addressed while they are in the ED. Increased emphasis on hospital reporting will make patient satisfaction a priority for many hospitals, and the ED hospitalist will be in a unique position to meet and greet patients admitted to the Medicine Service and to reassure them that the medical team is present and addressing their concerns. The hospitalist's ability to facilitate diagnostic testing and treatment while patients remain in the ED may also help decrease the total LOS in the hospital. In addition, the ED hospitalist is also in position to recognize social factors at the earliest stage of admission so that they can be immediately addressed. Future studies will need to be done to determine if this model of transitional care impacts these important factors.
Our study has several important limitations. Most notably, the lack of a comparison interval for which a hospitalist was not assigned to this role prevents us from drawing any definitive conclusions on the benefits of the ED hospitalist model. Also, we collected only summary data and do not have demographic data on the patients managed by the ED hospitalist or information on the ED course of patients who were discharged or had telemetry downgraded. This prevents determination of whether discharged patients did not require admission initially or whose condition evolved over a prolonged ED stay. In addition, other key outcomes, such as patient satisfaction and satisfaction of the ED physicians and nursing staff have not yet been formally measured. Future studies will be needed to determine if an ED hospital model can improve important process and clinical outcomes.
The greatest challenge of this initiative was introducing and familiarizing this role to the key stakeholders, including the ED physicians and nursing staff, house staff, and private practice physicians. Though we did not perform structured surveys on satisfaction, through informal discussions we noted that the role was welcomed with enthusiasm by the ED physicians. Notably, several ED physicians expressed appreciation that they were able to focus their care on new ED patients rather than on the boarded ED patients. Through feedback, we noted soon after implementation that ED faculty and nurses needed further clarification about the potential overlapping roles of the ED hospitalist and ED physicians and ward physicians. These concerns were addressed by educational sessions and announcements, including presentations at ED faculty and staff meetings. The hospitalist assigned to the role each month received individualized orientation prior to assuming the role, and an ED Hospitalist Manual was distributed. Possibly due to these focused sessions, the hospitalists assigned to the role became quickly acclimated.
Conclusions
We have found that designating a hospitalist to directly address the care of ED boarders can enhance the quality and timeliness of care and decrease bed and telemetry utilization with the potential to impact ED and hospital LOS. Given the success of the pilot model, the role was expanded at our institution to 10 hours per day, 7 days per week. Hospitals struggling to address the needs of their admitted patients in the ED should consider incorporating an ED hospitalist to enhance clinical care and address issues relating to throughput. A follow‐up study is needed to more precisely describe the impact of the ED hospitalist model.
Emergency Department (ED) overcrowding has become an important problem in North American hospitals.13 A national survey identified the prolonged length of stay of admitted patients in the ED as the most frequent reason for overcrowding.4 This complex problem occurs when hospital inpatient census increases and prevents admitted patients from being assigned and transported to hospital beds in a timely manner.5 The practice of holding admitted patients in the ED, known as boarding, is typically defined as the length of stay (LOS) in ED beginning 2 hours after the time of admission to the time of transfer to the wards.
In a study of daily mean ED LOS, Rathlev et al.6 concluded that a 5% increase in hospital occupancy resulted in 14 hours of holding time for all patients in the ED, and an observational study found that when hospital occupancy exceeds a threshold of 90%, the ED LOS for admitted patients correspondingly increased.7 Thus, efforts to decrease overcrowding will need to address both ED and hospital throughput and LOS. Most importantly, overcrowding has important consequences on physician and patient satisfaction and the quality of patient care.811
Between 1995 and 2005, ED visits rose 20% from 96.5 million to 115.3 million visits annually, while the number of hospital EDs decreased from 4176 to 3795, making an overall 7% increase in ED utilization rate.12 Similarly, there was a 12% increase in the total inpatient admissions for all registered hospitals in the United States from 31 million in 1995 to 35.3 million in 2005.13 However, despite this increase in demand of ED utilization and inpatient admissions, there had been a steady decline in the supply of hospital beds, from 874,000 in 1995, to 805,000 in 2006.13 These factors have exacerbated the problem of ED overcrowding and boarding.
Not only does boarding entail additional consumption of space, resources, equipment, and manpower, it also potentially compromises patient safety. Typically, hospitalists and inpatient medical teams are engaged in providing care to patients in the wards, while ED physicians and nurses are busy taking care of newly‐arrived ED patients. Non‐ED physicians may have the false impression that their boarded patients, while in the ED, are receiving continuous care and so may decide to delay seeing these patients, which can jeopardize the quality and timeliness of care. Studies have shown that ED overcrowding may potentially lead to poor patient care and outcomes and increased risk for medical errors.1416 ED overcrowding potentially causes multiple effects, including prolonging patient pain and suffering, long patient waiting time, patient dissatisfaction, ambulance diversions, decreased physician productivity, and increased frustration among medical staff.15 In a report by the Joint Commission Accreditation of Healthcare Organizations,17 ED overcrowding was cited as a significant contributing factor in sentinel event cases of patient death or permanent injury due to delays in treatment. Boarding critically ill patients who are physiologically vulnerable and unstable can allow them to be subjected to treatment delays at a pivotal point when time‐sensitive interventions are necessary, ie, sepsis or cardiogenic shockthe golden hour in trauma.16 Medical errors are usually not caused by individual errors but by complex hospital systems; and ED overcrowding is a prime example of a system problem that creates a high‐risk environment for medical errors and threatens patient safety.18
Our hospital commonly has 5 to 15 boarders and often has 20 to 30 boarders at any time. Approximately 90% of these patients are admitted to the Medical Service. In response to this challenge, our institution has designated a full‐time hospitalist to manage boarded patients. The primary goal of this new role is to ensure patient safety and the delivery of high‐quality care while admitted patients are in the ED (Table 1).
| |
| 1 | Round on all patients admitted to the Department of Medicine located in the ED, including those on the Teaching and Nonteaching Services. Rounds focus on patient safety, such as ensuring vital home and hospital medications are administered and changes in stability are noted. All patient updates are documented in the ED electronic medical records (IBEX). |
| 2 | Identify admitted patients who may be downgraded from telemetry to nontelemetry status. Telemetry and cardiac beds are in high demand, and decreasing utilization facilitates obtaining the appropriate ward bed for ED patients. |
| 3 | Assess admitted patients for possible discharge. The patient's condition may have improved or results may indicate that admission is no longer required. The ED hospitalist communicates with the ED physician and wards teams, facilitates management, implements the discharge, and ensures adequate follow‐up. |
| 4 | Refer patients to an ED social worker as needed. |
| 5 | Facilitate referrals to other medical or surgical specialties if indicated. |
| 6 | Clarify the plan of care with the ED staff and facilitates ED communication with the ward team. Acts as a liaison and a resource for the ED physicians and nursing staff. |
| 7 | Supervise the triage duties of the medical admitting resident. |
| 8 | Provide medical consultation to ED physicians for patients not being admitted to the hospital or who are being admitted to other services (eg, surgery). |
The objectives of the study were to determine: (1) the impact on quality of care by assessing laboratory results acted upon and medication follow‐up by the ED hospitalist, and (2) the impact on throughput by assessing the number of ED discharges and telemetry downgrades.
Methods
Setting
The Mount Sinai Medical Center is a tertiary‐care 1121‐bed acute care teaching hospital located in New York City. The hospital borders East Harlem and the Upper East Side of Manhattan. The Medical Service is composed of a Teaching Service, composed of house staff and attendings, and a non‐Teaching Service, composed of nurse practitioners, physician assistants, and attendings. Hospitalists and private attendings may have patients on either the Teaching or the non‐Teaching Service. In 2007, there were 56,541 patients admitted for a total of 332,368 days. The mean LOS for medical inpatients was 5.89 days. The total ED visit was 79,500 with a total inpatient and critical care admissions of 24,522. The mean and median LOS for all ED patients were 623 minutes and 493 minutes, respectively. There were 11,488 patients who qualified as boarders, averaging 31.5 boarders per 24 hours; with a mean and median LOS per boarder of 288 minutes and 198 minutes, respectively. The ED LOS for admitted patients ranged from 2 minutes to 4074 minutes (2.83 days).
Admission Process
Once an ED attending physician decides that a patient is to be admitted, the patient is placed on a computerized list in the ED's electronic medical record (IBEX software). The Medical Admitting Resident (MAR) evaluates and triages admitted patients, and assigns and gives a verbal report to the appropriate Medicine Service (ie, Teaching, non‐Teaching, cardiac telemetry unit, intensive care, etc.). The Admitting Office searches for and assigns the appropriate unit and bed for the patient. A hospitalist or resident physician performs the patient's initial assessment and evaluation in the ED, and admission orders are placed in the inpatient computerized order entry system (TDS). When the bed is ready, the ED nurse gives a verbal report to the floor nurse, and the patient is transported to the ward.
Responsibilities
The specific responsibilities of the ED hospitalist are listed in Table 1. The primary role is to round on patients admitted to the Medicine Service who are located in the ED. This encompasses a wide array of patients and services, including patients assigned to a hospitalist service attending or who have a private attending, patients admitted to the Teaching or non‐Teaching Service, patients admitted to the intensive care unit, and patients admitted to a general medicine or specialty service (eg, telemetry, oncology, human immunodeficiency virus [HIV]). Rounding includes review of the ED's electronic medical record as well as direct examination of patients. The hospitalist focuses on patients with longer ED LOS and on aspects of care that may lapse while patients remain in the ED for prolonged periods. At our institution, the follow‐up of subsequent tests, laboratory values, and medications for ED boarders is the responsibility of the primary inpatient team, though the ED physicians act on urgent and critical results and continue to deliver all emergency care. Through rounding, the ED hospitalist is able to identify abnormal results in a timely manner, alert the ED physician and primary inpatient team, and address abnormalities. Specific examples of laboratory results acted upon include hypokalemia, hyperglycemia, and elevated cardiac enzymes. The ED hospitalist is also able to determine whether any outpatient medications have not yet been administered (eg, antihypertensives, immune suppressants) and ensure that subsequent doses of medications initiated in the ED (eg, antibiotics) are administered during the appropriate timeframe.
Communication is emphasized, as contact with ED physicians, ward physicians, and often the outpatient primary care physician is required when any change in management is considered. The ED hospitalist also provides the capability of rapid response to changes in patient status (eg, a new complaint or fever). In addition, the hospitalist is available to consult on medical patients who may not require admission and on nonmedical patients for whom an internal medicine consult may be beneficial (eg, preoperative optimization of a surgical patient). The ED hospitalist documents the evaluation in the IBEX system. Bills were submitted for visits in which patients were discharged as these encounters are comprehensive, but not for other encounters.
Data Collection
The ED hospitalist role began March 10, 2008 and is a 10‐hour shift (8 AM to 6 PM) on weekdays. The study period was from March 10, 2008 through June 30, 2008. The study was approved by the hospital's institutional review board.
Data were collected on aspects of care that could have been impacted by the ED hospitalist, including medication and laboratory orders, ED discharges, ED admissions avoided, and telemetry downgrades. Discharges from ED refers to boarded admitted patients in the ED, who by the judgment of the ED hospitalist were ready for discharge. Admissions avoided refers to patients who the ED physician planned to admit but had not yet been admitted, and whose admission was avoided through the recommendations made by the ED hospitalist. The ED LOS was defined as the duration of time from when the patient was admitted to the Medicine Service to the time the patient was transferred to a medical ward. Telemetry downgrades were defined as patients assigned to the cardiac telemetry unit who the hospitalist determined required only telemetry on a general medical unit or did not require telemetry, or patients assigned to telemetry on a general medicine unit who the hospitalist determined no longer required telemetry.
Results were expressed as percentages of patients admitted to a Medicine Service and percentage of patients evaluated by the ED hospitalist, as indicated. 95% confidence intervals (CI) were calculated.
Results
During the study period, there were 4363 patients admitted to the Medicine Service and 3555 patients who qualified as boarders (mean of 29 boarders per 24 hours). The mean boarding time of admitted patients was 440 minutes. A total of 634 patients (17.8% of all boarded patients) were evaluated by the ED hospitalist. The mean daily number of patients seen by the ED hospitalist was 8.0.
The key elements of the delivery of care by the ED hospitalist are summarized in Table 2.
| Elements | Boarders (n = 3555) [n (%)] | Patients Intervened on (n = 634) [n (%)] |
|---|---|---|
| ||
| Laboratory results acted upon | 472 (13.2) | 472 (74.5) |
| Medication follow‐up | 506 (14.2) | 506 (79.8) |
| Discharges from the ED* | 46 (1.3) | 46 (7.3) |
| Admissions avoided | 6 (0.2) | 6 (0.95) |
| Telemetry downgrades | 61 (1.8) | 61 (9.6) |
The care of boarded patients included follow‐up of laboratory tests for 74.5% (95% CI, 71‐78%) and medication orders for 79.8% (95% CI, 77‐83%) of patients. A total of 46 patients were discharged by the ED hospitalist (0.6 discharges/day) and telemetry was discontinued for 61 patients (0.8 downgrades/day). The discharge rate was 7.3% (95% CI, 5‐10%) and telemetry downgrade rate was 9.6% (95% CI, 8‐12%) of those patients assessed by the ED hospitalist. Expressed as a percentage of the total ED boarders (n = 3555), the combined discharge rate and the admissions avoided rate was 1.5%.
Table 3 shows the discharge diagnoses made from the ED. Chest pain was the most common diagnosis, followed by syncope, pneumonia, and chronic obstructive pulmonary disease (COPD).
| Diagnoses | Patients (n = 46) [n (%)] |
|---|---|
| |
| Chest pain | 12 (26) |
| Syncope/dizziness | 7 (15) |
| Pneumonia | 4 (9) |
| COPD | 4 (9) |
| Congestive heart failure | 3 (7) |
| Gastroenteritis | 3 (7) |
| Dermatitis/rash | 3 (7) |
| Alcohol abuse | 3 (7) |
| Abdominal pain | 3 (7) |
| End stage renal disease | 2 (4) |
| Vaginal bleeding | 1 (2) |
| Fall | 1 (2) |
| Asthma | 1 (2) |
Discussion
Our hospital has successfully implemented an innovative strategy utilizing a hospitalist to help provide seamless care to medical patients located in the ED. Other solutions at our hospital had previously been implemented, but had not adequately addressed the problem, including: (1) protocols to monitor length of stay patterns and deviations, (2) discharge planning activities, (3) organized computerized bed tracking, (4) improvement in the timeliness of ancillary services, (5) daily bed briefing among nurse managers, and (6) 24‐hour presence of a MAR to facilitate triage in the ED.
The current study demonstrates the potential for substantial impact on patient care. The substantial number of the assessed boarder patients for whom laboratory tests (74.5%) and medications (79.8%) were ordered by the ED hospitalists suggests that the quality and timeliness of care was enhanced by this initiative. In addition, the considerable number of patients discharged from the ED and downgraded from telemetry (1.5% and 1.8% of all boarder patients, respectively) suggests that an ED hospitalist may have a meaningful impact on bed utilization and thus decrease ED overcrowding. In 2007, there were 11,488 who qualified as boarders; our data suggest that an ED hospitalist would result in approximately 172 boarders not being admitted annually.
Though the ED LOS was higher during the study period compared to 2007, it was lower than the 2 months immediately preceding implementation of the ED hospitalist role. The ED LOS was 732 and 658 minutes for January and February 2008, respectively, which was markedly increased from 2007 (288 minutes), and prompted development of the ED hospitalist role. The ED LOS during the study period subsequently decreased to 440 minutes. Though the wide fluctuations in ED LOS and the short time period with high ED LOS prior to implementation preclude concluding that the ED hospitalist role decreased ED LOS, the data suggest that an ED hospitalist may be able to improve ED throughput.
The majority of the discharges made by the ED hospitalist are patients who had been admitted for chest pain, had improved, and had negative cardiac enzymes and stress tests. Patients with syncope who were discharged were likely patients without any comorbidities. The COPD and pneumonia admissions were likely patients who improved after aggressive treatment in the ED.
The impact of ED overcrowding on the quality of patient care and outcomes may be substantial. Hwang et al.19 found a direct correlation between ED census and time to pain assessment and administration of analgesic medication. A study at an academic medical center found that higher ED volume was associated with less likelihood of antibiotics being administered within 4 hours for patients with community‐acquired pneumonia.20 A comprehensive review of the literature identified 41 studies examining the effects of ED overcrowding on clinical outcomes and the investigators noted that ED overcrowding was associated with increased in‐hospital mortality.8
Causes of poor outcomes during periods of overcrowding may be the high volume of acute patients preventing adequate time and attention for each ED patient, as well as confusion during the transition from ED to ward physicians. For example, a patient may receive their initial dose of antibiotics from the ED physician, but subsequent doses may be overlooked in the transition of care from the ED physician to the inpatient team. In addition, having admitted patients located in the ED for extended periods of time may lead to these patients not being seen as frequently as patients admitted to the inpatient wards. Another potential consequence of prolonged ED stay for admitted patients is delay in inpatient management. Tests done in the ED may prompt further studies that may not be ordered promptly while patients remain in the ED, which subsequently increases LOS. Other potential issues may be an increase in confusion among geriatric patients in a noisy and crowded ED; decreased access to specialized nursing care that may be available on a hospital ward; decreased access to physical therapy and occupational therapy services; and decreased comfort and satisfaction as patients wait in overcrowded EDs for prolonged periods.
Several other potential innovative solutions to ED overcrowding have been proposed, studied, and tested. These measures generally are focused on improving the three interdependent components of ED workflow: INPUT THROUGHPUT OUTPUT.21, 22 However, process redesign and intervention on these 3 interdependent ED workflow components may be difficult to achieve, especially when hospital resources are limited and when inpatient hospital capacity is already maximized. In some institutions, efforts have been reported to successfully streamline the transfer of admitted ED patients to inpatient beds, through transfer‐to‐ward policy interventions (eg, physician coordinators for patient flow and bed management or transfers made within a defined period of time).2326 However, in a study by Quinn et al.,27 implementation of a rapid admission policy resulted in a decrease of only 10.1 minutes in the ED LOS. Several studies have demonstrated the benefits of an acute medical admissions unit in alleviating ED overcrowding.28, 29 Other unconventional solutions by some hospitals include sending admitted patients to the unit's hallways or placing discharged patients in the hallway while waiting for transportation so that the ED bed will be readily available.30
The ED hospitalist is well‐situated to have an impact on several key hospital outcomes. As the ED hospitalist role was shown to affect processes that relate to ED throughput, it is possible that the role will improve ED overcrowding and decrease ED LOS. Specifically, identifying patients who can be discharged and for whom telemetry is no longer indicated decreases unnecessary bed utilization and allows these beds to be available for other ED patients. This initiative also may promote patient satisfaction by assuring patients that their medical and concerns are being fully addressed while they are in the ED. Increased emphasis on hospital reporting will make patient satisfaction a priority for many hospitals, and the ED hospitalist will be in a unique position to meet and greet patients admitted to the Medicine Service and to reassure them that the medical team is present and addressing their concerns. The hospitalist's ability to facilitate diagnostic testing and treatment while patients remain in the ED may also help decrease the total LOS in the hospital. In addition, the ED hospitalist is also in position to recognize social factors at the earliest stage of admission so that they can be immediately addressed. Future studies will need to be done to determine if this model of transitional care impacts these important factors.
Our study has several important limitations. Most notably, the lack of a comparison interval for which a hospitalist was not assigned to this role prevents us from drawing any definitive conclusions on the benefits of the ED hospitalist model. Also, we collected only summary data and do not have demographic data on the patients managed by the ED hospitalist or information on the ED course of patients who were discharged or had telemetry downgraded. This prevents determination of whether discharged patients did not require admission initially or whose condition evolved over a prolonged ED stay. In addition, other key outcomes, such as patient satisfaction and satisfaction of the ED physicians and nursing staff have not yet been formally measured. Future studies will be needed to determine if an ED hospital model can improve important process and clinical outcomes.
The greatest challenge of this initiative was introducing and familiarizing this role to the key stakeholders, including the ED physicians and nursing staff, house staff, and private practice physicians. Though we did not perform structured surveys on satisfaction, through informal discussions we noted that the role was welcomed with enthusiasm by the ED physicians. Notably, several ED physicians expressed appreciation that they were able to focus their care on new ED patients rather than on the boarded ED patients. Through feedback, we noted soon after implementation that ED faculty and nurses needed further clarification about the potential overlapping roles of the ED hospitalist and ED physicians and ward physicians. These concerns were addressed by educational sessions and announcements, including presentations at ED faculty and staff meetings. The hospitalist assigned to the role each month received individualized orientation prior to assuming the role, and an ED Hospitalist Manual was distributed. Possibly due to these focused sessions, the hospitalists assigned to the role became quickly acclimated.
Conclusions
We have found that designating a hospitalist to directly address the care of ED boarders can enhance the quality and timeliness of care and decrease bed and telemetry utilization with the potential to impact ED and hospital LOS. Given the success of the pilot model, the role was expanded at our institution to 10 hours per day, 7 days per week. Hospitals struggling to address the needs of their admitted patients in the ED should consider incorporating an ED hospitalist to enhance clinical care and address issues relating to throughput. A follow‐up study is needed to more precisely describe the impact of the ED hospitalist model.
- , , , et al.Estimating the degree of emergency department overcrowding in academic medical centers: results of the National ED Overcrowding Study (NEDOCS).Acad Emerg Med.2004;11:38–50.
- , , , et al.Frequency, determinants, and impact of overcrowding in emergency departments in Canada: a national survey.Healthc Q.2007;10:32–40.
- , .EMDOC (emergency department overcrowding) internet‐based safety net research.Admin Emerg Med.2008;35:101–107.
- United States General Accounting Office.Hospital Emergency Departments: Crowded Conditions Vary Among Hospitals and Communities. March 2003.Washington, DC:General Accounting Office;2003.
- .Overcrowding in emergency department: increased demand and decreased capacity.Ann Emerg Med.2002;39:430–432.
- , , , et al.Time series analysis of variables associated with daily mean emergency department length of stay.Ann Emerg Med.2007;49:265–271.
- , , , et al.Effect of hospital occupancy on emergency department length of stay and patient disposition.Ann Emerg Med.2003;10:127–133.
- , , , et al.The effect of emergency department crowding on clinically oriented outcomes.Acad Emerg Med.2009;16:1–10.
- , .Emergency department overcrowding: the impact of resource scarcity on physician job satisfaction.J Health Manag.2005;50:327–340.
- , , , , , .The effect of emergency department crowding on patient satisfaction for admitted patients.Acad Emerg Med.2008;15:825–831.
- , .The effect of crowding on access and quality in an academic ED.Am J Emerg Med.2006;24:787–794.
- , , .National Hospital Ambulatory Medical Care Survey: 2005 Emergency Department Summary. Advance Data from Vital and Health Statistics. No. 386.Hyattsville, MD:National Center for Health Statistics;2007.
- American Hospital Association (AHA).Table 1: Historical trends in utilization, personnel, and finances: year 1946–2006.AHA Hospital Statistics.2008 ed.Chicago:Health Forum LLC;2008:3.
- , .Emergency department overcrowding in the US: an emerging threat to patient safety and public health.Emerg Med J.2003;20:402–405.
- , .Overcrowding in the nation's emergency departments: complex causes and disturbing effects.Ann Emerg Med.2000;35:63–68.
- , .Clinical review: emergency department overcrowding and the potential impact on the critically ill.Crit Care.2005;9:291–295.
- Joint Commission on Accreditation of Healthcare Organizations (JCAHO): Sentinel event alert 2002, Issue 26. Available at: http://www.jointcommission.org/SentinelEvents/SentinelEventAlert/sea_26.htm. Accessed October2009.
- , , , et al.Safety net research in emergency medicine: proceedings of the Academic Emergency Consensus Conference on “The Unraveling Safety Net.”Acad Emerg Med.2001;8:1024–1029.
- , , , , , .Emergency department crowding and decreased quality of pain care.Acad Emerg Med.2008;15:1248–1256.
- , , , .Effect of emergency department crowding on time to antibiotics in patients admitted with community‐acquired pneumonia.Ann Emerg Med.2007;50:501–509.
- , , , et al.A conceptual model of emergency department crowding.Ann Emerg Med.2003;42:173–180.
- , , , et al.Emergency department crowding: consensus development of potential measures.Ann Emerg Med.2003;42:824–834.
- , , , et al.Intervention to decrease emergency department crowding: does it have an effect on return visits and hospital readmission?Ann Emerg Med.2003;41:173–185.
- , , , et al.Rapid process design in a university‐based emergency department: decreasing waiting time intervals and improving patient satisfaction.Ann Emerg Med.2002;39:168–177.
- .Emergency department crowding: an action plan.Acad Emerg Med.2001;18:185–187.
- , , .Hospitalists and an innovative emergency department admission process.J Gen Intern Med.2004;19:266–268.
- , , et al.Effects of implementing a rapid admission policy in the ED.Am J Emerg Med.2007;25:559–563.
- , , .Effect of an emergency department managed acute care unit on ED overcrowding and emergency medical services diversion.Acad Emerg Med.2001;8:1085–1100.
- , , , .Emergency department census of patients awaiting admission following reorganization of an admissions process.Emerg Med J.2006;23:363–367.
- .Emergency department flow and the boarded patient: how to get admitted patients upstairs.Ann Emerg Med.2007;49:68–70.
- , , , et al.Estimating the degree of emergency department overcrowding in academic medical centers: results of the National ED Overcrowding Study (NEDOCS).Acad Emerg Med.2004;11:38–50.
- , , , et al.Frequency, determinants, and impact of overcrowding in emergency departments in Canada: a national survey.Healthc Q.2007;10:32–40.
- , .EMDOC (emergency department overcrowding) internet‐based safety net research.Admin Emerg Med.2008;35:101–107.
- United States General Accounting Office.Hospital Emergency Departments: Crowded Conditions Vary Among Hospitals and Communities. March 2003.Washington, DC:General Accounting Office;2003.
- .Overcrowding in emergency department: increased demand and decreased capacity.Ann Emerg Med.2002;39:430–432.
- , , , et al.Time series analysis of variables associated with daily mean emergency department length of stay.Ann Emerg Med.2007;49:265–271.
- , , , et al.Effect of hospital occupancy on emergency department length of stay and patient disposition.Ann Emerg Med.2003;10:127–133.
- , , , et al.The effect of emergency department crowding on clinically oriented outcomes.Acad Emerg Med.2009;16:1–10.
- , .Emergency department overcrowding: the impact of resource scarcity on physician job satisfaction.J Health Manag.2005;50:327–340.
- , , , , , .The effect of emergency department crowding on patient satisfaction for admitted patients.Acad Emerg Med.2008;15:825–831.
- , .The effect of crowding on access and quality in an academic ED.Am J Emerg Med.2006;24:787–794.
- , , .National Hospital Ambulatory Medical Care Survey: 2005 Emergency Department Summary. Advance Data from Vital and Health Statistics. No. 386.Hyattsville, MD:National Center for Health Statistics;2007.
- American Hospital Association (AHA).Table 1: Historical trends in utilization, personnel, and finances: year 1946–2006.AHA Hospital Statistics.2008 ed.Chicago:Health Forum LLC;2008:3.
- , .Emergency department overcrowding in the US: an emerging threat to patient safety and public health.Emerg Med J.2003;20:402–405.
- , .Overcrowding in the nation's emergency departments: complex causes and disturbing effects.Ann Emerg Med.2000;35:63–68.
- , .Clinical review: emergency department overcrowding and the potential impact on the critically ill.Crit Care.2005;9:291–295.
- Joint Commission on Accreditation of Healthcare Organizations (JCAHO): Sentinel event alert 2002, Issue 26. Available at: http://www.jointcommission.org/SentinelEvents/SentinelEventAlert/sea_26.htm. Accessed October2009.
- , , , et al.Safety net research in emergency medicine: proceedings of the Academic Emergency Consensus Conference on “The Unraveling Safety Net.”Acad Emerg Med.2001;8:1024–1029.
- , , , , , .Emergency department crowding and decreased quality of pain care.Acad Emerg Med.2008;15:1248–1256.
- , , , .Effect of emergency department crowding on time to antibiotics in patients admitted with community‐acquired pneumonia.Ann Emerg Med.2007;50:501–509.
- , , , et al.A conceptual model of emergency department crowding.Ann Emerg Med.2003;42:173–180.
- , , , et al.Emergency department crowding: consensus development of potential measures.Ann Emerg Med.2003;42:824–834.
- , , , et al.Intervention to decrease emergency department crowding: does it have an effect on return visits and hospital readmission?Ann Emerg Med.2003;41:173–185.
- , , , et al.Rapid process design in a university‐based emergency department: decreasing waiting time intervals and improving patient satisfaction.Ann Emerg Med.2002;39:168–177.
- .Emergency department crowding: an action plan.Acad Emerg Med.2001;18:185–187.
- , , .Hospitalists and an innovative emergency department admission process.J Gen Intern Med.2004;19:266–268.
- , , et al.Effects of implementing a rapid admission policy in the ED.Am J Emerg Med.2007;25:559–563.
- , , .Effect of an emergency department managed acute care unit on ED overcrowding and emergency medical services diversion.Acad Emerg Med.2001;8:1085–1100.
- , , , .Emergency department census of patients awaiting admission following reorganization of an admissions process.Emerg Med J.2006;23:363–367.
- .Emergency department flow and the boarded patient: how to get admitted patients upstairs.Ann Emerg Med.2007;49:68–70.
Copyright © 2009 Society of Hospital Medicine
Effectiveness of Course to Teach Handoffs
Communication failures are well‐recognized as causes of medical errors.1, 2 Specifically, handoffs of patient care responsibilities, which are increasingly prevalent in academic medical centers,3 have been cited as the most frequent cause of teamwork breakdown resulting in the harmful medical errors found in malpractice claims.1 The Institute of Medicine has recently identified patient handoffs as the moment where patient care errors are most likely to occur.4 A survey of 125 U.S. medical schools, however, found that only 8% specifically taught students how to hand off patient care.3
In July 2003, the American Council of Graduate Medical Education (ACGME) mandated that residency programs decrease resident work hours to improve patient care and safety by reducing fatigue,5 and a recent Institute of Medicine report suggests that they be decreased even further.4 Studies examining outcomes during the first 2 years after reducing duty hours did not find reductions in risk‐adjusted mortality.68 One proposed explanation for this lack of improvement is that the reduction in fatigue‐related medical errors is being offset by discontinuity of care with due to the increased number of patient handoffs resulting from shortened duty hours,911 one recent study found that omission of key information during patient sign outs frequently resulted in adverse patient care outcomes.12
In 2007, the Joint Commission developed a new National Patient Safety Goal that requires organizations to improve communication between caregivers.13 We recently developed an approach by which Internal Medicine residents hand off patient care using a structured process, written and verbal templates, formal training about handoffs, and direct attending supervision.14 Because fourth‐year medical students perform the duties of interns when working as subinterns, we recognized that education about handoffs should occur prior to the time students became interns. Accordingly, we developed a course designed to teach patient handoffs to medical students at the transition between their third and fourth years of training.
Setting
The Handoff Selective was developed by faculty of Denver Health and the University of Colorado Denver School of Medicine.
Program Description
The Selective was first offered in April 2007 as part of an Integrated Clinician's Course (ICC), a 2‐week course for students beginning their fourth year, which starts in April at the University of Colorado. The ICC includes both mandatory and selective sessions that are focused on developing clinical skills and preparing them for their subinternships. The Handoff Selective was conducted in a computerized teaching laboratory, lasted a total of 2 hours and consisted of 2 parts. Each of the 5 Denver Health Hospital Medicine faculty members versed in handoff education taught 2 sessions of 6 to 8 students.
Part 1: Didactic
During the first hour of class, the faculty presented a lecture that summarized the relevant literature on handoffs and explained the importance of the topic. The objectives of the didactic were to: (1) understand the importance of handoffs; (2) explore different communication elements and structures; (3) gain exposure to handoffs outside of healthcare; and (4) learn a structure for handoffs of patient care in hospitalized patients.
We used 3 video clips of handoffs from 2 football games to demonstrate the importance of practice, training, and 2‐way communications in handoffs. The first video clip showed a runner trying to make a spontaneous handoff while being tackled. The receiver was not expecting the handoff and was preoccupied with blocking another player. This attempted handoff resulted in a fumble, which we related to an adverse patient event.
The next 2 video clips showed 2 complex, seldom used, but well‐known football handoffsthe hook and lateral and the Statue of Liberty. Both handoffs were successfully executed presumably as a result of education, practice and the active participation of both players (handing off and receiving) in the process. We then related the teaching and practicing of complex communication to the Joint Commission on Accreditation of Healthcare Organizations (JCAHO; now simply the Joint Commission) data suggesting that most sentinel events have their root cause in communication and training failures.2
Basic communication elements and process structures were then explored using scenarios from everyday life and evidence from fields outside of medicine. We emphasized that structures for communication (modes, vehicles, and settings) must be chosen according to the occasion and that handoffs are common and important in all occupations. In discussing modes (verbal, written, or nonverbal), vehicles (paper, telephone, or e‐mail), and settings (face‐to face, virtual, or disconnected), we emphasized that the most effective structures for communication (verbal, face‐to face meetings, with written materials and other visual aids at the patient's bedside) were also the most time‐consuming (Figure 1). While our standard for resident handoffs is a face‐to‐face verbal interaction with preprinted written materials as an aid, we also emphasized that for complex patients (eg, mental status changes, concern for an acute abdomen) more robust communication is often needed. Accordingly, a more time‐consuming bedside handoff with simultaneous, focused physical exam and history‐taking by both oncoming and off‐going providers may be most appropriate.
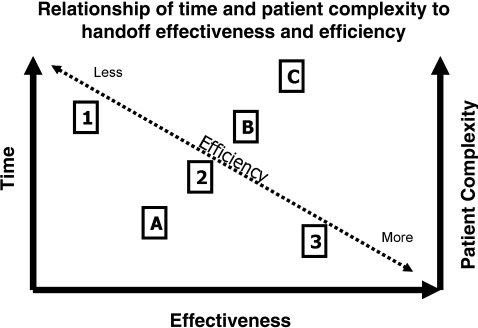
As real‐life examples, we asked our students to communicate a happy birthday wish to their mother, who lives in another state. Almost uniformly, in addition to a written aid (birthday card), they choose the telephone as a vehicle for their verbal mode in a virtual setting with 2‐way communication possible. In contrast, when asked to propose marriage to a significant other in another state, students felt that a face‐to‐face meeting with verbal and nonverbal (ie, ring) modes was appropriate. This time‐consuming mode of communication was felt to be necessary to create a sentiment of importance and avert any possible miscommunication.
The didactic session concluded by demonstrating how to use standardized written and verbal templates for handoffs of the care of a hospitalized patient. We explore the differentiation between written and verbal handoffs in our discussion below.
Part 2: Practicum
The second hour was devoted to practicing handoffs as a group. The faculty developed 6 case scenarios that differed with respect to diagnosis, length of stay, active medical issues, and anticipated discharge (Table 1). The scenarios included extensive admission information as well as evolving issues for each patient that were specific to the day of the intended handoff. Students were given Microsoft Word table‐based handoff templates to use when creating written sign‐outs for their patients. Verbal handoffs were performed between students and sign‐outs were exchanged. The faculty then role‐played cross‐cover calls that were specific for each scenario to test the students' inclusion of integral information in their handoffs and their ability to create contingency plans.
| Diagnosis | LOS | Active Issues | Cross‐Cover |
|---|---|---|---|
| |||
| CP | 1 | CP, HTN, DM | CP, HTN, headache |
| GIB | 1 | GIB, alcohol withdrawal | Poor response to red call transfusion, coagulopathy |
| Acute pancreatitis | 2 | Pain, possible pancreatic abscess | Fever, agitation, hypoxia |
| CHF | 2 | CHF, DM, nausea | Lack of diuresis, CP, hypoglycemia |
| Acute kidney injury | 3 | None, ready for discharge | HTN, hyperglycemia |
| Community acquired pneumonia | 3 | Anxiety, discharge pending | Confusion, emesis with hypoxia |
Program Evaluation
We developed a 2‐part survey to evaluate the effectiveness of the Selective and to solicit feedback about the didactic and practicum portions of the course. The first part of the survey (Table 2) contained 16 items to assess the students' knowledge of, and attitudes toward handing off patient care, along with their comfort with the handoff process. Responses to this section were scored using a 5‐point Likert scale with 1 indicating strongly disagree and 5 indicating strongly agree. This part of the survey was administered both prior to and after the Selective.
| Competency | Selective | |
|---|---|---|
| Before | After | |
| ||
| I know how to hand off patients | 2.3 0.8 | 4.2 0.6* |
| I know how to make contingency plans for my patients | 2.1 0.8 | 3.9 0.7* |
| I know what a read‐back is | 2.3 1.3 | 4.4 0.9* |
| I know how to perform a read‐back | 2.0 1.2 | 4.2 0.9* |
| I know when to perform a read‐back | 1.6 0.8 | 4.1 1.0* |
| I am efficient at communicating patient information | 2.2 0.9 | 3.6 0.7* |
| I am effective at communicating patient information | 2.2 0.8 | 3.8 0.6* |
| I know a standard written structure for handoffs | 2.1 1.1 | 4.4 0.6* |
| I know a standard verbal structure for handoffs | 2.0 1.1 | 4.2 0.6* |
| I can choose appropriate modes of communication | 2.7 1.1 | 4.4 0.6* |
| I can choose appropriate vehicles of communication | 2.6 1.1 | 4.5 0.6* |
| I can choose appropriate settings for communication | 2.9 1.1 | 4.4 0.6* |
| Handoffs are well taught in my medical school | 1.6 0.8 | 3.5 1.0* |
| Standardization is important in handoffs | 4.3 0.9 | 4.6 0.5 |
| Handoffs are safer with attending supervision | 3.7 1.0 | 3.9 0.8 |
| I feel comfortable cross‐covering on patients | 1.6 0.7 | 3.0 1.0* |
The second part (Table 3) contained 12 items and was designed to evaluate the perceived usefulness of the different components of the class. This section was only administered at the end of the Selective. It utilized a 4‐point Likert scale with 1 indicating that the component was not useful at all, and 4 indicating that it was extremely useful. The first 6 items of the second section allowed students to evaluate the didactic portion of the handoff. The second 6 items allowed students to evaluate the practicum. Responses to all 12 items were then combined to determine an overall composite usefulness for the Selective.
| Useful [n (%)] | |
|---|---|
| |
| Overall composite usefulness | 578 (92) |
| Didactic composite usefulness | 254 (84) |
| Using fumble video clips for discussing handoffs | 32 (64)* |
| Discussion of modes of communication | 46 (88) |
| Discussion of vehicles of communication | 46 (88) |
| Discussion of settings of communication | 48 (96) |
| Choosing handoff structures for nonhealthcare handoffs | 37 (71)* |
| Discussing handoffs in industries outside of healthcare | 45 (94) |
| Practicum composite usefulness | 324(100) |
| Role playing | 54 (100) |
| Patient handoff scenarios | 54 (100) |
| Completing computerized templates | 54 (100) |
| Delivering handoffs to peer | 54 (100) |
| Receiving handoffs from peer | 54 (100) |
| Cross‐cover questions and discussion | 54 (100) |
The Selective was also evaluated qualitatively through the use of open‐ended, written comments that were solicited at the end of the survey. All surveys were administered anonymously.
Data Analysis
Student paired t test was used to compare continuous variables recorded before and after the Selective. A chi‐square test was used to assess the students' perception of the usefulness of the didactic vs. the practicum methods of teaching handoffs.
All analyses were performed using SAS (version 8.1; SAS Institute, Inc., Cary, NC). Bonferroni corrections were used for multiple comparisons such that P values of <0.003 and <0.004 were considered to be significant for continuous and categorical variables, respectively. All data are reported as mean standard deviation (SD).
The survey was approved by our local Institutional Review Board.
Results
More students chose the Selective than we had capacity to accommodate (60 of a class of 150). The pre‐ and postcourse survey response rate was 56 of 60 (93%) and 58 of 60 (97%), respectively. After the Selective, the mean score in response to whether handoffs are well taught in medical school increased from 1.6 to 3.5 (P < 0.003). Our students' self‐perceived skills and knowledge about handoffs improved after the Selective (Table 2). The greatest changes in perceived knowledge occurred in questions regarding the what, how, and when of read‐backs, and the knowledge of standard verbal and written handoff structures. The responses to the survey elements which assessed our students' attitudes regarding the importance of standardization and whether they felt handoffs were safer with faculty supervision did not change after the Selective (Table 2).
A total of 92% of the students felt that the course was extremely useful or useful. The role‐playing activity was thought to be more helpful than the didactic, but 84% of the students still rated the didactic portion as useful or extremely useful (Table 3). The element which was the least well received in the didactic portion was the use of video clips to demonstrate successful and unsuccessful (fumbled) college football handoffs, although the majority (64%) of students still found it useful.
The major theme generated from the comments section of the survey was that the Selective should be a required course.
Discussion
We know of no previously published literature that has addressed teaching handoffs to medical students. Horwitz et al.15 developed a sign‐out curriculum for Internal Medicine residents and found that none of their house‐staff had any previous training in handoffs during medical school, consistent with the finding that only 8% of U.S. medical schools provided formal instruction on handoffs.3 Prior to taking the Selective, our students had no knowledge of verbal or written templates for patient handoffs, although both before and after the course they felt that standardization was an important component of the process.
A number of verbal structures for handing off patient care have been described in the literature and there is not a consensus as to which functions best. Perhaps the most cited verbal communication format is SBAR (ie, situation, background, assessment and recommendation).16, 17 This tool was developed by Leonard et al.18 specifically for use by nurses to provide 1‐way communication to physicians pertaining to a change in patient status. We considered teaching the SBAR approach to the students but felt that it did not provide a suitable structure for handoffs because the transfer of care is not generally an event‐based situation and the literature on handoffs indicates that an optimal verbal system includes 2‐way communication.
Additional mnemonics for handoffs found in the literature include SIGNOUT (ie, Sick or DNR, Identifying information, General hospital course, New events of the day, Overall health status, Upcoming possibilities with plan, and Tasks to complete),14 I PASS the BATON (ie, Introduction, Patient, Assessment, Situation, Safety, Background, Actions, Timing, Ownership, Next)19 and the SAIF‐IR system (see boxed text).14
Verbal Structure for Patient Handoffs: SAIF‐IR
Off‐going provider performs a SAIF handoff:
Summary statement(s)
Active issues
If‐then contingency planning
Follow‐up activities
On‐coming provider makes the handoff SAIF‐IR:
Interactive questioning
Read‐backs
We developed the SAIF‐IR mnemonic to maximize efficiency and effectiveness while differentiating the verbal portion of the handoff from the written and incorporating 2‐way communication into its structure. In the Summary statement, we emphasize that this is not a history of present illness. We ask our students to summarize, in 1 to 3 sentences, the patient's presentation and working diagnosis. When discussing patient issues, we ask our students to only verbalize Active issues, although the written template has inactive, chronic issues listed. Here, we also ask our students to express their level of concern for the active issues and patient in general. If‐then's and Follow‐ups are usually verbalized together. Based on the offgoing provider's knowledge of the patient, we encourage the offgoing provider to anticipate potential problems and advise the oncoming provider on potential responses. Much of this advice is difficult to express in the written format and thus may not be found on the written handoff when the verbal handoff occurs. We encourage oncoming providers to take notes on the preprinted handoff sheet as part of the handoff process.
Through Interactive questioning and Read‐backs, we train our students and house‐staff to use the active listening techniques used outside of healthcare, in settings such as nuclear power plants and National Aeronautics and Space Administration mission control, where poor handoff communication may also result in safety concerns and adverse events.20 Interactive questioning allows the oncoming provider to correct or clarify any information given by the off‐going provider. Read‐backs are a method of confirming follow‐up activity or contingency plans. Together, the SAIF‐IR mnemonic builds a 2‐way communication structure into the patient handoff with both offgoing and oncoming providers having predefined roles.
Much of the information on our written handoff (patient identifying information, medications, language preference, code status, admission date) is not verbalized unless it is part of the active issues or the if‐then, follow‐ups (ie, medication titration for a patient admitted with an acute coronary syndrome or cor status in a patient newly made comfort care). By not reading extraneous information, we seek to emphasize the Active issues as well as the If‐then, Follow‐ups. We feel this emphasis maximizes the effectiveness of the handoff, while the purposeful nonverbalization of written materials such as identifying information maximizes its efficiency. Future work may examine which verbal and written structures for patient handoffs most benefit patient care and workflow through standard communication.
While our students found the Handoff Selective to be useful and to improve their self‐perceived ability to perform handoffs, we were not able to determine whether our program affected downstream outcomes such as adverse events relating to failures in handoff communication. Additionally, since we only taught and evaluated our Selective at the University of Colorado Denver School of Medicine, the response of our students may not generalize to other medical schools. Multicentered, prospective, randomized controlled trials may determine whether handoff education programs are successful in reducing patient adverse events related to transfers of care.
While handoffs occur frequently and are increasingly recognized as a vulnerable time in patient care, little is known about how to effectively teach handoffs to medical students during their clinical years. We developed a formal course to teach the importance of handoffs and how the process should be conducted. Our students reported that the Handoff Selective we developed improved their knowledge about the process and their perception of their ability to perform handoffs in a time‐appropriate and effective manner. In response to the feedback we received from our students, the Handoff Selective is the only course in the ICC that has been made mandatory for all students.
- , , .Communication failures: an insidious contributor to medical mishaps.Acad Med.2004;79:186–194.
- Root causes of sentinel events. The Joint Commission. Available at: http://www.jointcommission.org/NR/rdonlyres/FA465646‐5F5F‐4543‐AC8F‐E8AF6571E372/0/root_cause_se.jpg Accessed October2009.
- , , , et al.Lost in translation: challenges‐to‐physician communication during patient handoffs.Acad Med.2005;80:1094–1099.
- Institute of Medicine.Resident Duty Hours: Enhancing Sleep, Supervision and Safety.Washington, DC:National Academies Press;2008.
- ACGME duty hours. Accreditation Council for Graduate Medical Education. http://www.acgme.org/acWebsite/dutyHours/dh_ComProgrRequirmentsDutyHours0707.pdf. Accessed October2009.
- , , , et al.Mortality among hospitalized Medicare beneficiaries in the first 2 years following ACGME duty hour reform.JAMA.2007;298(9):975–983.
- , , , et al.Mortality among patient in VA hospitals in the first 2 years following ACGME duty hour reform.JAMA.2007;298(9):984–992.
- , , , .Changes in outcomes for internal medicine patients after work‐hour regulations.Ann Intern Med.2007;147(2):1–7.
- , , , et al.Transfers of patient care between house staff on internal medicine wards.Arch Intern Med.2006;166:1173–1177.
- , , , .Medical errors involving trainees.Arch Intern Med.2007;167(19):2030–2036.
- .Reducing resident work hours: unproven assumptions and unforeseen outcomes.Ann Intern Med.2006;140:814–815.
- , , et al.Consequences of inadequate sign‐out for patient care.Arch Intern Med.2008;168(16):1755–1760.
- JCAHO Handoff Communication. National patient safety goal. The Joint Commission. http://www.jointcommission.org/GeneralPublic/NPSG/07_npsgs.htm. Accessed October2009.
- , , , et al.A structured handoff program for interns.Acad Med.2009;84:347–352.
- , , .Development and implementation of an oral sign out skills curriculum.J Gen Intern Med.2007;22(10):1470–1474.
- , , , et al.Managing discontinuity in academic medical centers: strategies for a safe and effective sign out.J Hosp Med.2006;1:257–266.
- , , , .A theoretical framework and competency based approach to improving handoffs.Qual Saf Health Care.2008;17:11–14.
- , , .The human factor: the critical importance of effective teamwork in providing safe care.Qual Saf Health Care.2004;13(suppl 1):i85–i90.
- University HealthSystem Consortium Best Practice Recommendation: Patient Handoff Communication. White Paper. May 2006.Oak Brook, IL:University HealthSystem Consortium;2006.
- , , , , .Handoff strategies in settings with high consequences for failure: lessons for health care operations.Int J Qual Health Care.2004;16(2):125–132.
Communication failures are well‐recognized as causes of medical errors.1, 2 Specifically, handoffs of patient care responsibilities, which are increasingly prevalent in academic medical centers,3 have been cited as the most frequent cause of teamwork breakdown resulting in the harmful medical errors found in malpractice claims.1 The Institute of Medicine has recently identified patient handoffs as the moment where patient care errors are most likely to occur.4 A survey of 125 U.S. medical schools, however, found that only 8% specifically taught students how to hand off patient care.3
In July 2003, the American Council of Graduate Medical Education (ACGME) mandated that residency programs decrease resident work hours to improve patient care and safety by reducing fatigue,5 and a recent Institute of Medicine report suggests that they be decreased even further.4 Studies examining outcomes during the first 2 years after reducing duty hours did not find reductions in risk‐adjusted mortality.68 One proposed explanation for this lack of improvement is that the reduction in fatigue‐related medical errors is being offset by discontinuity of care with due to the increased number of patient handoffs resulting from shortened duty hours,911 one recent study found that omission of key information during patient sign outs frequently resulted in adverse patient care outcomes.12
In 2007, the Joint Commission developed a new National Patient Safety Goal that requires organizations to improve communication between caregivers.13 We recently developed an approach by which Internal Medicine residents hand off patient care using a structured process, written and verbal templates, formal training about handoffs, and direct attending supervision.14 Because fourth‐year medical students perform the duties of interns when working as subinterns, we recognized that education about handoffs should occur prior to the time students became interns. Accordingly, we developed a course designed to teach patient handoffs to medical students at the transition between their third and fourth years of training.
Setting
The Handoff Selective was developed by faculty of Denver Health and the University of Colorado Denver School of Medicine.
Program Description
The Selective was first offered in April 2007 as part of an Integrated Clinician's Course (ICC), a 2‐week course for students beginning their fourth year, which starts in April at the University of Colorado. The ICC includes both mandatory and selective sessions that are focused on developing clinical skills and preparing them for their subinternships. The Handoff Selective was conducted in a computerized teaching laboratory, lasted a total of 2 hours and consisted of 2 parts. Each of the 5 Denver Health Hospital Medicine faculty members versed in handoff education taught 2 sessions of 6 to 8 students.
Part 1: Didactic
During the first hour of class, the faculty presented a lecture that summarized the relevant literature on handoffs and explained the importance of the topic. The objectives of the didactic were to: (1) understand the importance of handoffs; (2) explore different communication elements and structures; (3) gain exposure to handoffs outside of healthcare; and (4) learn a structure for handoffs of patient care in hospitalized patients.
We used 3 video clips of handoffs from 2 football games to demonstrate the importance of practice, training, and 2‐way communications in handoffs. The first video clip showed a runner trying to make a spontaneous handoff while being tackled. The receiver was not expecting the handoff and was preoccupied with blocking another player. This attempted handoff resulted in a fumble, which we related to an adverse patient event.
The next 2 video clips showed 2 complex, seldom used, but well‐known football handoffsthe hook and lateral and the Statue of Liberty. Both handoffs were successfully executed presumably as a result of education, practice and the active participation of both players (handing off and receiving) in the process. We then related the teaching and practicing of complex communication to the Joint Commission on Accreditation of Healthcare Organizations (JCAHO; now simply the Joint Commission) data suggesting that most sentinel events have their root cause in communication and training failures.2
Basic communication elements and process structures were then explored using scenarios from everyday life and evidence from fields outside of medicine. We emphasized that structures for communication (modes, vehicles, and settings) must be chosen according to the occasion and that handoffs are common and important in all occupations. In discussing modes (verbal, written, or nonverbal), vehicles (paper, telephone, or e‐mail), and settings (face‐to face, virtual, or disconnected), we emphasized that the most effective structures for communication (verbal, face‐to face meetings, with written materials and other visual aids at the patient's bedside) were also the most time‐consuming (Figure 1). While our standard for resident handoffs is a face‐to‐face verbal interaction with preprinted written materials as an aid, we also emphasized that for complex patients (eg, mental status changes, concern for an acute abdomen) more robust communication is often needed. Accordingly, a more time‐consuming bedside handoff with simultaneous, focused physical exam and history‐taking by both oncoming and off‐going providers may be most appropriate.
As real‐life examples, we asked our students to communicate a happy birthday wish to their mother, who lives in another state. Almost uniformly, in addition to a written aid (birthday card), they choose the telephone as a vehicle for their verbal mode in a virtual setting with 2‐way communication possible. In contrast, when asked to propose marriage to a significant other in another state, students felt that a face‐to‐face meeting with verbal and nonverbal (ie, ring) modes was appropriate. This time‐consuming mode of communication was felt to be necessary to create a sentiment of importance and avert any possible miscommunication.
The didactic session concluded by demonstrating how to use standardized written and verbal templates for handoffs of the care of a hospitalized patient. We explore the differentiation between written and verbal handoffs in our discussion below.
Part 2: Practicum
The second hour was devoted to practicing handoffs as a group. The faculty developed 6 case scenarios that differed with respect to diagnosis, length of stay, active medical issues, and anticipated discharge (Table 1). The scenarios included extensive admission information as well as evolving issues for each patient that were specific to the day of the intended handoff. Students were given Microsoft Word table‐based handoff templates to use when creating written sign‐outs for their patients. Verbal handoffs were performed between students and sign‐outs were exchanged. The faculty then role‐played cross‐cover calls that were specific for each scenario to test the students' inclusion of integral information in their handoffs and their ability to create contingency plans.
| Diagnosis | LOS | Active Issues | Cross‐Cover |
|---|---|---|---|
| |||
| CP | 1 | CP, HTN, DM | CP, HTN, headache |
| GIB | 1 | GIB, alcohol withdrawal | Poor response to red call transfusion, coagulopathy |
| Acute pancreatitis | 2 | Pain, possible pancreatic abscess | Fever, agitation, hypoxia |
| CHF | 2 | CHF, DM, nausea | Lack of diuresis, CP, hypoglycemia |
| Acute kidney injury | 3 | None, ready for discharge | HTN, hyperglycemia |
| Community acquired pneumonia | 3 | Anxiety, discharge pending | Confusion, emesis with hypoxia |
Program Evaluation
We developed a 2‐part survey to evaluate the effectiveness of the Selective and to solicit feedback about the didactic and practicum portions of the course. The first part of the survey (Table 2) contained 16 items to assess the students' knowledge of, and attitudes toward handing off patient care, along with their comfort with the handoff process. Responses to this section were scored using a 5‐point Likert scale with 1 indicating strongly disagree and 5 indicating strongly agree. This part of the survey was administered both prior to and after the Selective.
| Competency | Selective | |
|---|---|---|
| Before | After | |
| ||
| I know how to hand off patients | 2.3 0.8 | 4.2 0.6* |
| I know how to make contingency plans for my patients | 2.1 0.8 | 3.9 0.7* |
| I know what a read‐back is | 2.3 1.3 | 4.4 0.9* |
| I know how to perform a read‐back | 2.0 1.2 | 4.2 0.9* |
| I know when to perform a read‐back | 1.6 0.8 | 4.1 1.0* |
| I am efficient at communicating patient information | 2.2 0.9 | 3.6 0.7* |
| I am effective at communicating patient information | 2.2 0.8 | 3.8 0.6* |
| I know a standard written structure for handoffs | 2.1 1.1 | 4.4 0.6* |
| I know a standard verbal structure for handoffs | 2.0 1.1 | 4.2 0.6* |
| I can choose appropriate modes of communication | 2.7 1.1 | 4.4 0.6* |
| I can choose appropriate vehicles of communication | 2.6 1.1 | 4.5 0.6* |
| I can choose appropriate settings for communication | 2.9 1.1 | 4.4 0.6* |
| Handoffs are well taught in my medical school | 1.6 0.8 | 3.5 1.0* |
| Standardization is important in handoffs | 4.3 0.9 | 4.6 0.5 |
| Handoffs are safer with attending supervision | 3.7 1.0 | 3.9 0.8 |
| I feel comfortable cross‐covering on patients | 1.6 0.7 | 3.0 1.0* |
The second part (Table 3) contained 12 items and was designed to evaluate the perceived usefulness of the different components of the class. This section was only administered at the end of the Selective. It utilized a 4‐point Likert scale with 1 indicating that the component was not useful at all, and 4 indicating that it was extremely useful. The first 6 items of the second section allowed students to evaluate the didactic portion of the handoff. The second 6 items allowed students to evaluate the practicum. Responses to all 12 items were then combined to determine an overall composite usefulness for the Selective.
| Useful [n (%)] | |
|---|---|
| |
| Overall composite usefulness | 578 (92) |
| Didactic composite usefulness | 254 (84) |
| Using fumble video clips for discussing handoffs | 32 (64)* |
| Discussion of modes of communication | 46 (88) |
| Discussion of vehicles of communication | 46 (88) |
| Discussion of settings of communication | 48 (96) |
| Choosing handoff structures for nonhealthcare handoffs | 37 (71)* |
| Discussing handoffs in industries outside of healthcare | 45 (94) |
| Practicum composite usefulness | 324(100) |
| Role playing | 54 (100) |
| Patient handoff scenarios | 54 (100) |
| Completing computerized templates | 54 (100) |
| Delivering handoffs to peer | 54 (100) |
| Receiving handoffs from peer | 54 (100) |
| Cross‐cover questions and discussion | 54 (100) |
The Selective was also evaluated qualitatively through the use of open‐ended, written comments that were solicited at the end of the survey. All surveys were administered anonymously.
Data Analysis
Student paired t test was used to compare continuous variables recorded before and after the Selective. A chi‐square test was used to assess the students' perception of the usefulness of the didactic vs. the practicum methods of teaching handoffs.
All analyses were performed using SAS (version 8.1; SAS Institute, Inc., Cary, NC). Bonferroni corrections were used for multiple comparisons such that P values of <0.003 and <0.004 were considered to be significant for continuous and categorical variables, respectively. All data are reported as mean standard deviation (SD).
The survey was approved by our local Institutional Review Board.
Results
More students chose the Selective than we had capacity to accommodate (60 of a class of 150). The pre‐ and postcourse survey response rate was 56 of 60 (93%) and 58 of 60 (97%), respectively. After the Selective, the mean score in response to whether handoffs are well taught in medical school increased from 1.6 to 3.5 (P < 0.003). Our students' self‐perceived skills and knowledge about handoffs improved after the Selective (Table 2). The greatest changes in perceived knowledge occurred in questions regarding the what, how, and when of read‐backs, and the knowledge of standard verbal and written handoff structures. The responses to the survey elements which assessed our students' attitudes regarding the importance of standardization and whether they felt handoffs were safer with faculty supervision did not change after the Selective (Table 2).
A total of 92% of the students felt that the course was extremely useful or useful. The role‐playing activity was thought to be more helpful than the didactic, but 84% of the students still rated the didactic portion as useful or extremely useful (Table 3). The element which was the least well received in the didactic portion was the use of video clips to demonstrate successful and unsuccessful (fumbled) college football handoffs, although the majority (64%) of students still found it useful.
The major theme generated from the comments section of the survey was that the Selective should be a required course.
Discussion
We know of no previously published literature that has addressed teaching handoffs to medical students. Horwitz et al.15 developed a sign‐out curriculum for Internal Medicine residents and found that none of their house‐staff had any previous training in handoffs during medical school, consistent with the finding that only 8% of U.S. medical schools provided formal instruction on handoffs.3 Prior to taking the Selective, our students had no knowledge of verbal or written templates for patient handoffs, although both before and after the course they felt that standardization was an important component of the process.
A number of verbal structures for handing off patient care have been described in the literature and there is not a consensus as to which functions best. Perhaps the most cited verbal communication format is SBAR (ie, situation, background, assessment and recommendation).16, 17 This tool was developed by Leonard et al.18 specifically for use by nurses to provide 1‐way communication to physicians pertaining to a change in patient status. We considered teaching the SBAR approach to the students but felt that it did not provide a suitable structure for handoffs because the transfer of care is not generally an event‐based situation and the literature on handoffs indicates that an optimal verbal system includes 2‐way communication.
Additional mnemonics for handoffs found in the literature include SIGNOUT (ie, Sick or DNR, Identifying information, General hospital course, New events of the day, Overall health status, Upcoming possibilities with plan, and Tasks to complete),14 I PASS the BATON (ie, Introduction, Patient, Assessment, Situation, Safety, Background, Actions, Timing, Ownership, Next)19 and the SAIF‐IR system (see boxed text).14
Verbal Structure for Patient Handoffs: SAIF‐IR
Off‐going provider performs a SAIF handoff:
Summary statement(s)
Active issues
If‐then contingency planning
Follow‐up activities
On‐coming provider makes the handoff SAIF‐IR:
Interactive questioning
Read‐backs
We developed the SAIF‐IR mnemonic to maximize efficiency and effectiveness while differentiating the verbal portion of the handoff from the written and incorporating 2‐way communication into its structure. In the Summary statement, we emphasize that this is not a history of present illness. We ask our students to summarize, in 1 to 3 sentences, the patient's presentation and working diagnosis. When discussing patient issues, we ask our students to only verbalize Active issues, although the written template has inactive, chronic issues listed. Here, we also ask our students to express their level of concern for the active issues and patient in general. If‐then's and Follow‐ups are usually verbalized together. Based on the offgoing provider's knowledge of the patient, we encourage the offgoing provider to anticipate potential problems and advise the oncoming provider on potential responses. Much of this advice is difficult to express in the written format and thus may not be found on the written handoff when the verbal handoff occurs. We encourage oncoming providers to take notes on the preprinted handoff sheet as part of the handoff process.
Through Interactive questioning and Read‐backs, we train our students and house‐staff to use the active listening techniques used outside of healthcare, in settings such as nuclear power plants and National Aeronautics and Space Administration mission control, where poor handoff communication may also result in safety concerns and adverse events.20 Interactive questioning allows the oncoming provider to correct or clarify any information given by the off‐going provider. Read‐backs are a method of confirming follow‐up activity or contingency plans. Together, the SAIF‐IR mnemonic builds a 2‐way communication structure into the patient handoff with both offgoing and oncoming providers having predefined roles.
Much of the information on our written handoff (patient identifying information, medications, language preference, code status, admission date) is not verbalized unless it is part of the active issues or the if‐then, follow‐ups (ie, medication titration for a patient admitted with an acute coronary syndrome or cor status in a patient newly made comfort care). By not reading extraneous information, we seek to emphasize the Active issues as well as the If‐then, Follow‐ups. We feel this emphasis maximizes the effectiveness of the handoff, while the purposeful nonverbalization of written materials such as identifying information maximizes its efficiency. Future work may examine which verbal and written structures for patient handoffs most benefit patient care and workflow through standard communication.
While our students found the Handoff Selective to be useful and to improve their self‐perceived ability to perform handoffs, we were not able to determine whether our program affected downstream outcomes such as adverse events relating to failures in handoff communication. Additionally, since we only taught and evaluated our Selective at the University of Colorado Denver School of Medicine, the response of our students may not generalize to other medical schools. Multicentered, prospective, randomized controlled trials may determine whether handoff education programs are successful in reducing patient adverse events related to transfers of care.
While handoffs occur frequently and are increasingly recognized as a vulnerable time in patient care, little is known about how to effectively teach handoffs to medical students during their clinical years. We developed a formal course to teach the importance of handoffs and how the process should be conducted. Our students reported that the Handoff Selective we developed improved their knowledge about the process and their perception of their ability to perform handoffs in a time‐appropriate and effective manner. In response to the feedback we received from our students, the Handoff Selective is the only course in the ICC that has been made mandatory for all students.
Communication failures are well‐recognized as causes of medical errors.1, 2 Specifically, handoffs of patient care responsibilities, which are increasingly prevalent in academic medical centers,3 have been cited as the most frequent cause of teamwork breakdown resulting in the harmful medical errors found in malpractice claims.1 The Institute of Medicine has recently identified patient handoffs as the moment where patient care errors are most likely to occur.4 A survey of 125 U.S. medical schools, however, found that only 8% specifically taught students how to hand off patient care.3
In July 2003, the American Council of Graduate Medical Education (ACGME) mandated that residency programs decrease resident work hours to improve patient care and safety by reducing fatigue,5 and a recent Institute of Medicine report suggests that they be decreased even further.4 Studies examining outcomes during the first 2 years after reducing duty hours did not find reductions in risk‐adjusted mortality.68 One proposed explanation for this lack of improvement is that the reduction in fatigue‐related medical errors is being offset by discontinuity of care with due to the increased number of patient handoffs resulting from shortened duty hours,911 one recent study found that omission of key information during patient sign outs frequently resulted in adverse patient care outcomes.12
In 2007, the Joint Commission developed a new National Patient Safety Goal that requires organizations to improve communication between caregivers.13 We recently developed an approach by which Internal Medicine residents hand off patient care using a structured process, written and verbal templates, formal training about handoffs, and direct attending supervision.14 Because fourth‐year medical students perform the duties of interns when working as subinterns, we recognized that education about handoffs should occur prior to the time students became interns. Accordingly, we developed a course designed to teach patient handoffs to medical students at the transition between their third and fourth years of training.
Setting
The Handoff Selective was developed by faculty of Denver Health and the University of Colorado Denver School of Medicine.
Program Description
The Selective was first offered in April 2007 as part of an Integrated Clinician's Course (ICC), a 2‐week course for students beginning their fourth year, which starts in April at the University of Colorado. The ICC includes both mandatory and selective sessions that are focused on developing clinical skills and preparing them for their subinternships. The Handoff Selective was conducted in a computerized teaching laboratory, lasted a total of 2 hours and consisted of 2 parts. Each of the 5 Denver Health Hospital Medicine faculty members versed in handoff education taught 2 sessions of 6 to 8 students.
Part 1: Didactic
During the first hour of class, the faculty presented a lecture that summarized the relevant literature on handoffs and explained the importance of the topic. The objectives of the didactic were to: (1) understand the importance of handoffs; (2) explore different communication elements and structures; (3) gain exposure to handoffs outside of healthcare; and (4) learn a structure for handoffs of patient care in hospitalized patients.
We used 3 video clips of handoffs from 2 football games to demonstrate the importance of practice, training, and 2‐way communications in handoffs. The first video clip showed a runner trying to make a spontaneous handoff while being tackled. The receiver was not expecting the handoff and was preoccupied with blocking another player. This attempted handoff resulted in a fumble, which we related to an adverse patient event.
The next 2 video clips showed 2 complex, seldom used, but well‐known football handoffsthe hook and lateral and the Statue of Liberty. Both handoffs were successfully executed presumably as a result of education, practice and the active participation of both players (handing off and receiving) in the process. We then related the teaching and practicing of complex communication to the Joint Commission on Accreditation of Healthcare Organizations (JCAHO; now simply the Joint Commission) data suggesting that most sentinel events have their root cause in communication and training failures.2
Basic communication elements and process structures were then explored using scenarios from everyday life and evidence from fields outside of medicine. We emphasized that structures for communication (modes, vehicles, and settings) must be chosen according to the occasion and that handoffs are common and important in all occupations. In discussing modes (verbal, written, or nonverbal), vehicles (paper, telephone, or e‐mail), and settings (face‐to face, virtual, or disconnected), we emphasized that the most effective structures for communication (verbal, face‐to face meetings, with written materials and other visual aids at the patient's bedside) were also the most time‐consuming (Figure 1). While our standard for resident handoffs is a face‐to‐face verbal interaction with preprinted written materials as an aid, we also emphasized that for complex patients (eg, mental status changes, concern for an acute abdomen) more robust communication is often needed. Accordingly, a more time‐consuming bedside handoff with simultaneous, focused physical exam and history‐taking by both oncoming and off‐going providers may be most appropriate.
As real‐life examples, we asked our students to communicate a happy birthday wish to their mother, who lives in another state. Almost uniformly, in addition to a written aid (birthday card), they choose the telephone as a vehicle for their verbal mode in a virtual setting with 2‐way communication possible. In contrast, when asked to propose marriage to a significant other in another state, students felt that a face‐to‐face meeting with verbal and nonverbal (ie, ring) modes was appropriate. This time‐consuming mode of communication was felt to be necessary to create a sentiment of importance and avert any possible miscommunication.
The didactic session concluded by demonstrating how to use standardized written and verbal templates for handoffs of the care of a hospitalized patient. We explore the differentiation between written and verbal handoffs in our discussion below.
Part 2: Practicum
The second hour was devoted to practicing handoffs as a group. The faculty developed 6 case scenarios that differed with respect to diagnosis, length of stay, active medical issues, and anticipated discharge (Table 1). The scenarios included extensive admission information as well as evolving issues for each patient that were specific to the day of the intended handoff. Students were given Microsoft Word table‐based handoff templates to use when creating written sign‐outs for their patients. Verbal handoffs were performed between students and sign‐outs were exchanged. The faculty then role‐played cross‐cover calls that were specific for each scenario to test the students' inclusion of integral information in their handoffs and their ability to create contingency plans.
| Diagnosis | LOS | Active Issues | Cross‐Cover |
|---|---|---|---|
| |||
| CP | 1 | CP, HTN, DM | CP, HTN, headache |
| GIB | 1 | GIB, alcohol withdrawal | Poor response to red call transfusion, coagulopathy |
| Acute pancreatitis | 2 | Pain, possible pancreatic abscess | Fever, agitation, hypoxia |
| CHF | 2 | CHF, DM, nausea | Lack of diuresis, CP, hypoglycemia |
| Acute kidney injury | 3 | None, ready for discharge | HTN, hyperglycemia |
| Community acquired pneumonia | 3 | Anxiety, discharge pending | Confusion, emesis with hypoxia |
Program Evaluation
We developed a 2‐part survey to evaluate the effectiveness of the Selective and to solicit feedback about the didactic and practicum portions of the course. The first part of the survey (Table 2) contained 16 items to assess the students' knowledge of, and attitudes toward handing off patient care, along with their comfort with the handoff process. Responses to this section were scored using a 5‐point Likert scale with 1 indicating strongly disagree and 5 indicating strongly agree. This part of the survey was administered both prior to and after the Selective.
| Competency | Selective | |
|---|---|---|
| Before | After | |
| ||
| I know how to hand off patients | 2.3 0.8 | 4.2 0.6* |
| I know how to make contingency plans for my patients | 2.1 0.8 | 3.9 0.7* |
| I know what a read‐back is | 2.3 1.3 | 4.4 0.9* |
| I know how to perform a read‐back | 2.0 1.2 | 4.2 0.9* |
| I know when to perform a read‐back | 1.6 0.8 | 4.1 1.0* |
| I am efficient at communicating patient information | 2.2 0.9 | 3.6 0.7* |
| I am effective at communicating patient information | 2.2 0.8 | 3.8 0.6* |
| I know a standard written structure for handoffs | 2.1 1.1 | 4.4 0.6* |
| I know a standard verbal structure for handoffs | 2.0 1.1 | 4.2 0.6* |
| I can choose appropriate modes of communication | 2.7 1.1 | 4.4 0.6* |
| I can choose appropriate vehicles of communication | 2.6 1.1 | 4.5 0.6* |
| I can choose appropriate settings for communication | 2.9 1.1 | 4.4 0.6* |
| Handoffs are well taught in my medical school | 1.6 0.8 | 3.5 1.0* |
| Standardization is important in handoffs | 4.3 0.9 | 4.6 0.5 |
| Handoffs are safer with attending supervision | 3.7 1.0 | 3.9 0.8 |
| I feel comfortable cross‐covering on patients | 1.6 0.7 | 3.0 1.0* |
The second part (Table 3) contained 12 items and was designed to evaluate the perceived usefulness of the different components of the class. This section was only administered at the end of the Selective. It utilized a 4‐point Likert scale with 1 indicating that the component was not useful at all, and 4 indicating that it was extremely useful. The first 6 items of the second section allowed students to evaluate the didactic portion of the handoff. The second 6 items allowed students to evaluate the practicum. Responses to all 12 items were then combined to determine an overall composite usefulness for the Selective.
| Useful [n (%)] | |
|---|---|
| |
| Overall composite usefulness | 578 (92) |
| Didactic composite usefulness | 254 (84) |
| Using fumble video clips for discussing handoffs | 32 (64)* |
| Discussion of modes of communication | 46 (88) |
| Discussion of vehicles of communication | 46 (88) |
| Discussion of settings of communication | 48 (96) |
| Choosing handoff structures for nonhealthcare handoffs | 37 (71)* |
| Discussing handoffs in industries outside of healthcare | 45 (94) |
| Practicum composite usefulness | 324(100) |
| Role playing | 54 (100) |
| Patient handoff scenarios | 54 (100) |
| Completing computerized templates | 54 (100) |
| Delivering handoffs to peer | 54 (100) |
| Receiving handoffs from peer | 54 (100) |
| Cross‐cover questions and discussion | 54 (100) |
The Selective was also evaluated qualitatively through the use of open‐ended, written comments that were solicited at the end of the survey. All surveys were administered anonymously.
Data Analysis
Student paired t test was used to compare continuous variables recorded before and after the Selective. A chi‐square test was used to assess the students' perception of the usefulness of the didactic vs. the practicum methods of teaching handoffs.
All analyses were performed using SAS (version 8.1; SAS Institute, Inc., Cary, NC). Bonferroni corrections were used for multiple comparisons such that P values of <0.003 and <0.004 were considered to be significant for continuous and categorical variables, respectively. All data are reported as mean standard deviation (SD).
The survey was approved by our local Institutional Review Board.
Results
More students chose the Selective than we had capacity to accommodate (60 of a class of 150). The pre‐ and postcourse survey response rate was 56 of 60 (93%) and 58 of 60 (97%), respectively. After the Selective, the mean score in response to whether handoffs are well taught in medical school increased from 1.6 to 3.5 (P < 0.003). Our students' self‐perceived skills and knowledge about handoffs improved after the Selective (Table 2). The greatest changes in perceived knowledge occurred in questions regarding the what, how, and when of read‐backs, and the knowledge of standard verbal and written handoff structures. The responses to the survey elements which assessed our students' attitudes regarding the importance of standardization and whether they felt handoffs were safer with faculty supervision did not change after the Selective (Table 2).
A total of 92% of the students felt that the course was extremely useful or useful. The role‐playing activity was thought to be more helpful than the didactic, but 84% of the students still rated the didactic portion as useful or extremely useful (Table 3). The element which was the least well received in the didactic portion was the use of video clips to demonstrate successful and unsuccessful (fumbled) college football handoffs, although the majority (64%) of students still found it useful.
The major theme generated from the comments section of the survey was that the Selective should be a required course.
Discussion
We know of no previously published literature that has addressed teaching handoffs to medical students. Horwitz et al.15 developed a sign‐out curriculum for Internal Medicine residents and found that none of their house‐staff had any previous training in handoffs during medical school, consistent with the finding that only 8% of U.S. medical schools provided formal instruction on handoffs.3 Prior to taking the Selective, our students had no knowledge of verbal or written templates for patient handoffs, although both before and after the course they felt that standardization was an important component of the process.
A number of verbal structures for handing off patient care have been described in the literature and there is not a consensus as to which functions best. Perhaps the most cited verbal communication format is SBAR (ie, situation, background, assessment and recommendation).16, 17 This tool was developed by Leonard et al.18 specifically for use by nurses to provide 1‐way communication to physicians pertaining to a change in patient status. We considered teaching the SBAR approach to the students but felt that it did not provide a suitable structure for handoffs because the transfer of care is not generally an event‐based situation and the literature on handoffs indicates that an optimal verbal system includes 2‐way communication.
Additional mnemonics for handoffs found in the literature include SIGNOUT (ie, Sick or DNR, Identifying information, General hospital course, New events of the day, Overall health status, Upcoming possibilities with plan, and Tasks to complete),14 I PASS the BATON (ie, Introduction, Patient, Assessment, Situation, Safety, Background, Actions, Timing, Ownership, Next)19 and the SAIF‐IR system (see boxed text).14
Verbal Structure for Patient Handoffs: SAIF‐IR
Off‐going provider performs a SAIF handoff:
Summary statement(s)
Active issues
If‐then contingency planning
Follow‐up activities
On‐coming provider makes the handoff SAIF‐IR:
Interactive questioning
Read‐backs
We developed the SAIF‐IR mnemonic to maximize efficiency and effectiveness while differentiating the verbal portion of the handoff from the written and incorporating 2‐way communication into its structure. In the Summary statement, we emphasize that this is not a history of present illness. We ask our students to summarize, in 1 to 3 sentences, the patient's presentation and working diagnosis. When discussing patient issues, we ask our students to only verbalize Active issues, although the written template has inactive, chronic issues listed. Here, we also ask our students to express their level of concern for the active issues and patient in general. If‐then's and Follow‐ups are usually verbalized together. Based on the offgoing provider's knowledge of the patient, we encourage the offgoing provider to anticipate potential problems and advise the oncoming provider on potential responses. Much of this advice is difficult to express in the written format and thus may not be found on the written handoff when the verbal handoff occurs. We encourage oncoming providers to take notes on the preprinted handoff sheet as part of the handoff process.
Through Interactive questioning and Read‐backs, we train our students and house‐staff to use the active listening techniques used outside of healthcare, in settings such as nuclear power plants and National Aeronautics and Space Administration mission control, where poor handoff communication may also result in safety concerns and adverse events.20 Interactive questioning allows the oncoming provider to correct or clarify any information given by the off‐going provider. Read‐backs are a method of confirming follow‐up activity or contingency plans. Together, the SAIF‐IR mnemonic builds a 2‐way communication structure into the patient handoff with both offgoing and oncoming providers having predefined roles.
Much of the information on our written handoff (patient identifying information, medications, language preference, code status, admission date) is not verbalized unless it is part of the active issues or the if‐then, follow‐ups (ie, medication titration for a patient admitted with an acute coronary syndrome or cor status in a patient newly made comfort care). By not reading extraneous information, we seek to emphasize the Active issues as well as the If‐then, Follow‐ups. We feel this emphasis maximizes the effectiveness of the handoff, while the purposeful nonverbalization of written materials such as identifying information maximizes its efficiency. Future work may examine which verbal and written structures for patient handoffs most benefit patient care and workflow through standard communication.
While our students found the Handoff Selective to be useful and to improve their self‐perceived ability to perform handoffs, we were not able to determine whether our program affected downstream outcomes such as adverse events relating to failures in handoff communication. Additionally, since we only taught and evaluated our Selective at the University of Colorado Denver School of Medicine, the response of our students may not generalize to other medical schools. Multicentered, prospective, randomized controlled trials may determine whether handoff education programs are successful in reducing patient adverse events related to transfers of care.
While handoffs occur frequently and are increasingly recognized as a vulnerable time in patient care, little is known about how to effectively teach handoffs to medical students during their clinical years. We developed a formal course to teach the importance of handoffs and how the process should be conducted. Our students reported that the Handoff Selective we developed improved their knowledge about the process and their perception of their ability to perform handoffs in a time‐appropriate and effective manner. In response to the feedback we received from our students, the Handoff Selective is the only course in the ICC that has been made mandatory for all students.
- , , .Communication failures: an insidious contributor to medical mishaps.Acad Med.2004;79:186–194.
- Root causes of sentinel events. The Joint Commission. Available at: http://www.jointcommission.org/NR/rdonlyres/FA465646‐5F5F‐4543‐AC8F‐E8AF6571E372/0/root_cause_se.jpg Accessed October2009.
- , , , et al.Lost in translation: challenges‐to‐physician communication during patient handoffs.Acad Med.2005;80:1094–1099.
- Institute of Medicine.Resident Duty Hours: Enhancing Sleep, Supervision and Safety.Washington, DC:National Academies Press;2008.
- ACGME duty hours. Accreditation Council for Graduate Medical Education. http://www.acgme.org/acWebsite/dutyHours/dh_ComProgrRequirmentsDutyHours0707.pdf. Accessed October2009.
- , , , et al.Mortality among hospitalized Medicare beneficiaries in the first 2 years following ACGME duty hour reform.JAMA.2007;298(9):975–983.
- , , , et al.Mortality among patient in VA hospitals in the first 2 years following ACGME duty hour reform.JAMA.2007;298(9):984–992.
- , , , .Changes in outcomes for internal medicine patients after work‐hour regulations.Ann Intern Med.2007;147(2):1–7.
- , , , et al.Transfers of patient care between house staff on internal medicine wards.Arch Intern Med.2006;166:1173–1177.
- , , , .Medical errors involving trainees.Arch Intern Med.2007;167(19):2030–2036.
- .Reducing resident work hours: unproven assumptions and unforeseen outcomes.Ann Intern Med.2006;140:814–815.
- , , et al.Consequences of inadequate sign‐out for patient care.Arch Intern Med.2008;168(16):1755–1760.
- JCAHO Handoff Communication. National patient safety goal. The Joint Commission. http://www.jointcommission.org/GeneralPublic/NPSG/07_npsgs.htm. Accessed October2009.
- , , , et al.A structured handoff program for interns.Acad Med.2009;84:347–352.
- , , .Development and implementation of an oral sign out skills curriculum.J Gen Intern Med.2007;22(10):1470–1474.
- , , , et al.Managing discontinuity in academic medical centers: strategies for a safe and effective sign out.J Hosp Med.2006;1:257–266.
- , , , .A theoretical framework and competency based approach to improving handoffs.Qual Saf Health Care.2008;17:11–14.
- , , .The human factor: the critical importance of effective teamwork in providing safe care.Qual Saf Health Care.2004;13(suppl 1):i85–i90.
- University HealthSystem Consortium Best Practice Recommendation: Patient Handoff Communication. White Paper. May 2006.Oak Brook, IL:University HealthSystem Consortium;2006.
- , , , , .Handoff strategies in settings with high consequences for failure: lessons for health care operations.Int J Qual Health Care.2004;16(2):125–132.
- , , .Communication failures: an insidious contributor to medical mishaps.Acad Med.2004;79:186–194.
- Root causes of sentinel events. The Joint Commission. Available at: http://www.jointcommission.org/NR/rdonlyres/FA465646‐5F5F‐4543‐AC8F‐E8AF6571E372/0/root_cause_se.jpg Accessed October2009.
- , , , et al.Lost in translation: challenges‐to‐physician communication during patient handoffs.Acad Med.2005;80:1094–1099.
- Institute of Medicine.Resident Duty Hours: Enhancing Sleep, Supervision and Safety.Washington, DC:National Academies Press;2008.
- ACGME duty hours. Accreditation Council for Graduate Medical Education. http://www.acgme.org/acWebsite/dutyHours/dh_ComProgrRequirmentsDutyHours0707.pdf. Accessed October2009.
- , , , et al.Mortality among hospitalized Medicare beneficiaries in the first 2 years following ACGME duty hour reform.JAMA.2007;298(9):975–983.
- , , , et al.Mortality among patient in VA hospitals in the first 2 years following ACGME duty hour reform.JAMA.2007;298(9):984–992.
- , , , .Changes in outcomes for internal medicine patients after work‐hour regulations.Ann Intern Med.2007;147(2):1–7.
- , , , et al.Transfers of patient care between house staff on internal medicine wards.Arch Intern Med.2006;166:1173–1177.
- , , , .Medical errors involving trainees.Arch Intern Med.2007;167(19):2030–2036.
- .Reducing resident work hours: unproven assumptions and unforeseen outcomes.Ann Intern Med.2006;140:814–815.
- , , et al.Consequences of inadequate sign‐out for patient care.Arch Intern Med.2008;168(16):1755–1760.
- JCAHO Handoff Communication. National patient safety goal. The Joint Commission. http://www.jointcommission.org/GeneralPublic/NPSG/07_npsgs.htm. Accessed October2009.
- , , , et al.A structured handoff program for interns.Acad Med.2009;84:347–352.
- , , .Development and implementation of an oral sign out skills curriculum.J Gen Intern Med.2007;22(10):1470–1474.
- , , , et al.Managing discontinuity in academic medical centers: strategies for a safe and effective sign out.J Hosp Med.2006;1:257–266.
- , , , .A theoretical framework and competency based approach to improving handoffs.Qual Saf Health Care.2008;17:11–14.
- , , .The human factor: the critical importance of effective teamwork in providing safe care.Qual Saf Health Care.2004;13(suppl 1):i85–i90.
- University HealthSystem Consortium Best Practice Recommendation: Patient Handoff Communication. White Paper. May 2006.Oak Brook, IL:University HealthSystem Consortium;2006.
- , , , , .Handoff strategies in settings with high consequences for failure: lessons for health care operations.Int J Qual Health Care.2004;16(2):125–132.
Copyright © 2010 Society of Hospital Medicine
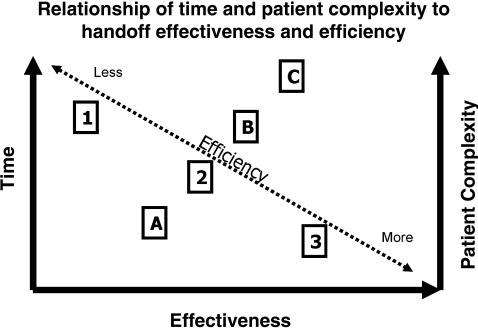
Continuing Medical Education Program in
If you wish to receive credit for this activity, which begins on the next page, please refer to the website:
Accreditation and Designation Statement
Blackwell Futura Media Services designates this educational activity for a 1 AMA PRA Category 1 Credit. Physicians should only claim credit commensurate with the extent of their participation in the activity.
Blackwell Futura Media Services is accredited by the Accreditation Council for Continuing Medical Education to provide continuing medical education for physicians.
Educational Objectives
Continuous participation in the Journal of Hospital Medicine CME program will enable learners to be better able to:
-
Interpret clinical guidelines and their applications for higher quality and more efficient care for all hospitalized patients.
-
Describe the standard of care for common illnesses and conditions treated in the hospital; such as pneumonia, COPD exacerbation, acute coronary syndrome, HF exacerbation, glycemic control, venous thromboembolic disease, stroke, etc.
-
Discuss evidence‐based recommendations involving transitions of care, including the hospital discharge process.
-
Gain insights into the roles of hospitalists as medical educators, researchers, medical ethicists, palliative care providers, and hospital‐based geriatricians.
-
Incorporate best practices for hospitalist administration, including quality improvement, patient safety, practice management, leadership, and demonstrating hospitalist value.
-
Identify evidence‐based best practices and trends for both adult and pediatric hospital medicine.
Instructions on Receiving Credit
For information on applicability and acceptance of continuing medical education credit for this activity, please consult your professional licensing board.
This activity is designed to be completed within the time designated on the title page; physicians should claim only those credits that reflect the time actually spent in the activity. To successfully earn credit, participants must complete the activity during the valid credit period that is noted on the title page.
Follow these steps to earn credit:
-
Log on to
www.blackwellpublishing.com/cme . -
Read the target audience, learning objectives, and author disclosures.
-
Read the article in print or online format.
-
Reflect on the article.
-
Access the CME Exam, and choose the best answer to each question.
-
Complete the required evaluation component of the activity.
If you wish to receive credit for this activity, which begins on the next page, please refer to the website:
Accreditation and Designation Statement
Blackwell Futura Media Services designates this educational activity for a 1 AMA PRA Category 1 Credit. Physicians should only claim credit commensurate with the extent of their participation in the activity.
Blackwell Futura Media Services is accredited by the Accreditation Council for Continuing Medical Education to provide continuing medical education for physicians.
Educational Objectives
Continuous participation in the Journal of Hospital Medicine CME program will enable learners to be better able to:
-
Interpret clinical guidelines and their applications for higher quality and more efficient care for all hospitalized patients.
-
Describe the standard of care for common illnesses and conditions treated in the hospital; such as pneumonia, COPD exacerbation, acute coronary syndrome, HF exacerbation, glycemic control, venous thromboembolic disease, stroke, etc.
-
Discuss evidence‐based recommendations involving transitions of care, including the hospital discharge process.
-
Gain insights into the roles of hospitalists as medical educators, researchers, medical ethicists, palliative care providers, and hospital‐based geriatricians.
-
Incorporate best practices for hospitalist administration, including quality improvement, patient safety, practice management, leadership, and demonstrating hospitalist value.
-
Identify evidence‐based best practices and trends for both adult and pediatric hospital medicine.
Instructions on Receiving Credit
For information on applicability and acceptance of continuing medical education credit for this activity, please consult your professional licensing board.
This activity is designed to be completed within the time designated on the title page; physicians should claim only those credits that reflect the time actually spent in the activity. To successfully earn credit, participants must complete the activity during the valid credit period that is noted on the title page.
Follow these steps to earn credit:
-
Log on to
www.blackwellpublishing.com/cme . -
Read the target audience, learning objectives, and author disclosures.
-
Read the article in print or online format.
-
Reflect on the article.
-
Access the CME Exam, and choose the best answer to each question.
-
Complete the required evaluation component of the activity.
If you wish to receive credit for this activity, which begins on the next page, please refer to the website:
Accreditation and Designation Statement
Blackwell Futura Media Services designates this educational activity for a 1 AMA PRA Category 1 Credit. Physicians should only claim credit commensurate with the extent of their participation in the activity.
Blackwell Futura Media Services is accredited by the Accreditation Council for Continuing Medical Education to provide continuing medical education for physicians.
Educational Objectives
Continuous participation in the Journal of Hospital Medicine CME program will enable learners to be better able to:
-
Interpret clinical guidelines and their applications for higher quality and more efficient care for all hospitalized patients.
-
Describe the standard of care for common illnesses and conditions treated in the hospital; such as pneumonia, COPD exacerbation, acute coronary syndrome, HF exacerbation, glycemic control, venous thromboembolic disease, stroke, etc.
-
Discuss evidence‐based recommendations involving transitions of care, including the hospital discharge process.
-
Gain insights into the roles of hospitalists as medical educators, researchers, medical ethicists, palliative care providers, and hospital‐based geriatricians.
-
Incorporate best practices for hospitalist administration, including quality improvement, patient safety, practice management, leadership, and demonstrating hospitalist value.
-
Identify evidence‐based best practices and trends for both adult and pediatric hospital medicine.
Instructions on Receiving Credit
For information on applicability and acceptance of continuing medical education credit for this activity, please consult your professional licensing board.
This activity is designed to be completed within the time designated on the title page; physicians should claim only those credits that reflect the time actually spent in the activity. To successfully earn credit, participants must complete the activity during the valid credit period that is noted on the title page.
Follow these steps to earn credit:
-
Log on to
www.blackwellpublishing.com/cme . -
Read the target audience, learning objectives, and author disclosures.
-
Read the article in print or online format.
-
Reflect on the article.
-
Access the CME Exam, and choose the best answer to each question.
-
Complete the required evaluation component of the activity.
Author Responsibilities and Disclosures
Since its founding in 2006,1 the editors of the Journal of Hospital Medicine (JHM), strongly supported the ethical guidelines and uniform requirements for manuscripts established by the International Committee of Medical Journal Editors (ICMJE).2 These guidelines require authors to verify that they have followed appropriate standards in the conduct of research, meet criteria for authorship, disclose potential conflicts of interest, and respect existing copyrights. With recent publication of editorials in leading medical journals affirming this responsibility for all authors submitting their scholarly work,38 the editors of the Journal echo the importance of following these ethical standards, and wish to update authors and readers on our policies related to authorship and plagiarism.
Disclosure of Competing Interests
Scientific publications commonly require that authors disclose relationships, financial or otherwise, with commercial entities that might have an interest in the subject matter of the article. Historically, biomedical journals varied in the content and format of the information they requested from authors,9 yielding inconsistent reporting by authors depending on the journal. Lack of clarity regarding what relationships authors should report contributed to this variable reporting. For example, an author might submit an article on headache management, and not believe it necessary to report honoraria received from pharmaceutical firms for giving lectures on antibiotic management of pneumonia. Thus, many believed that only funding related to the subject matter in a manuscript needed to be disclosed. While general advice has been to err on the side of disclosure, many authors hesitated to do so.
To clarify and standardize reporting requirements, the ICMJE recommended a uniform format for disclosure of competing interests,3 which was updated recently.10 The document, available online at
JHM strongly supports the ICMJE uniform requirements for manuscripts and has adopted the new form for disclosure of competing interests. Effective immediately, this documentation will be required for all types of manuscripts submitted to JHM. To help reduce the paperwork burden for authors, this documentation will be required only when authors are invited to revise and resubmit their work, after completion of the initial round of reviews. Typically at this stage, JHM also requests each author complete a Copyright Transfer Agreement (CTA). Thus, when a revision is requested by the Journal, we recommend that the corresponding author have each coauthor concurrently complete the CTA and disclosure of competing interests, and return all of the materials to JHM at the same time.
Criteria for Authorship
Authorship of scientific articles has important professional implications. In a field such as Hospital Medicine which explicitly values teamwork, it can sometimes be unclear which members of a team qualify for authorship on an article that may result from the group's work. The ICMJE provides the following guidance:2
-
Authorship credit should be based on (1) substantial contributions to conception and design, acquisition of data, or analysis and interpretation of data; (2) drafting the article or revising it critically for important intellectual content; and (3) final approval of the version to be published. Authors should meet conditions 1, 2, and 3.
The ICMJE notes that authorship is not justified for individuals who simply obtain or provide funding, participate in data collection or general supervision of the research, or serve as head of the group. Members of the team who play roles such as these are more appropriately acknowledged, and their specific contributions noted. The corresponding author should obtain written permission as such acknowledgements may imply endorsement of the work or its conclusions.
Authors, too, should make note of their individual contributions to manuscripts submitted to JHM. The Journal will begin publishing these specific contributions with each article, as do other medical journals.11
Plagiarism
Perhaps the most serious ethical violation that journals confront is plagiarism of copyrighted work. In its 5 years, JHM has detected 4 episodes of plagiarism. Thankfully, the Committee on Publication Ethics (
We recognize that other journals have needed to handle similar episodes of plagiarism,1215 and that self‐plagiarism (recycling of one's own published text) is also a concern.16, 17 Many methods exist to detect these practices.18 One powerful approach gaining popularity among medical journals utilizes CrossCheck. The CrossCheck service has 2 components: (1) a large, full‐text database of scholarly work from leading publishers, maintained by CrossRef (
Any form of plagiarism is inexcusable, and, if detected, is immediately addressed. Additionally, any author who submits plagiarized work will be banned from submitting manuscripts to JHM in the future, and will not be allowed to serve the Journal as a reviewer or in any other capacity. Our notification in selected cases of the individual's supervisor or department chair may elicit additional adverse consequences.
Summary
As the Journal of Hospital Medicine continues to grow and evolve, we are extraordinarily grateful when authors choose to submit their scholarly work to us. But growth does not come without challenges and responsibilities, such as a requirement to uphold ethical standards of biomedical publishing. We believe that the uniform disclosure of competing interests, clear reporting of contributions for authorship, and monitoring for plagiarism will help JHM maintain the standards that its readership and contributing authors deserve. We look forward to your contributions during our next 5 years, and beyond.
- .Hospital medicine's evolution—the next steps.J Hosp Med.2006;1(1):1–2.
- International Committee of Medical Journal Editors. Uniform requirements for manuscripts submitted to biomedical journals. Available at: http://www.icmje.org/. Accessed February 22,2010.
- , , , et al.Uniform format for disclosure of competing interests in ICMJE journals.N Engl J Med.2009;361(19):1896–1897.
- , , , et al.Uniform format for disclosure of competing interests in ICMJE journals.JAMA.2010;303(1):75–76.
- , , , et al.Uniform format for disclosure of competing interests in ICMJE journals.Ann Intern Med.2010;152(2):125–126.
- , , , et al.Uniform format for disclosure of competing interests in ICMJE journals.Lancet.2009;374(9699):1395–1396.
- , , , et al.Disclosure of competing interests.BMJ.2009;339:b4144.
- , , , et al.Uniform format for disclosure of competing interests in ICMJE journals.CMAJ.2009;181(9):565.
- , , , .Requirements and definitions in conflict of interest policies of medical journals.JAMA.2009;302(20):2230–2234.
- , , , , et al.Toward more uniform conflict disclosures ‐ the updated ICMJE conflict of interest reporting form.N Engl J Med.2010;363(2):188–189.
- , , , .Authorship criteria and disclosure of contributions: comparison of 3 general medical journals with different author contribution forms.JAMA.2004;292(1):86–88.
- , .Investigating allegations of scientific misconduct.BMJ.2005;331(7511):245–246.
- .Misconduct in medical research: does it exist in Britain?BMJ.1998;297:1531–1535.
- , .Research misconduct, retraction, and cleansing the medical literature: lessons from the Poehlman case.Annals of Internal Medicine.2006;144(8):609–613.
- .Report from the Scientific Integrity Advisor: issues arising in 2005 and 2006.Neurology.2007;68(21):1841–1842.
- Anonymous.Self‐plagiarism: unintentional, harmless, or fraud?Lancet.2009;374(9691):664.
- .Re‐using text from one's own previously published papers: an exploratory study of potential self‐plagiarism.Psychological Reports.2005;97(1):43–49.
- .Policing plagiarism.BMJ.2007;335(7627):963–964.
Since its founding in 2006,1 the editors of the Journal of Hospital Medicine (JHM), strongly supported the ethical guidelines and uniform requirements for manuscripts established by the International Committee of Medical Journal Editors (ICMJE).2 These guidelines require authors to verify that they have followed appropriate standards in the conduct of research, meet criteria for authorship, disclose potential conflicts of interest, and respect existing copyrights. With recent publication of editorials in leading medical journals affirming this responsibility for all authors submitting their scholarly work,38 the editors of the Journal echo the importance of following these ethical standards, and wish to update authors and readers on our policies related to authorship and plagiarism.
Disclosure of Competing Interests
Scientific publications commonly require that authors disclose relationships, financial or otherwise, with commercial entities that might have an interest in the subject matter of the article. Historically, biomedical journals varied in the content and format of the information they requested from authors,9 yielding inconsistent reporting by authors depending on the journal. Lack of clarity regarding what relationships authors should report contributed to this variable reporting. For example, an author might submit an article on headache management, and not believe it necessary to report honoraria received from pharmaceutical firms for giving lectures on antibiotic management of pneumonia. Thus, many believed that only funding related to the subject matter in a manuscript needed to be disclosed. While general advice has been to err on the side of disclosure, many authors hesitated to do so.
To clarify and standardize reporting requirements, the ICMJE recommended a uniform format for disclosure of competing interests,3 which was updated recently.10 The document, available online at
JHM strongly supports the ICMJE uniform requirements for manuscripts and has adopted the new form for disclosure of competing interests. Effective immediately, this documentation will be required for all types of manuscripts submitted to JHM. To help reduce the paperwork burden for authors, this documentation will be required only when authors are invited to revise and resubmit their work, after completion of the initial round of reviews. Typically at this stage, JHM also requests each author complete a Copyright Transfer Agreement (CTA). Thus, when a revision is requested by the Journal, we recommend that the corresponding author have each coauthor concurrently complete the CTA and disclosure of competing interests, and return all of the materials to JHM at the same time.
Criteria for Authorship
Authorship of scientific articles has important professional implications. In a field such as Hospital Medicine which explicitly values teamwork, it can sometimes be unclear which members of a team qualify for authorship on an article that may result from the group's work. The ICMJE provides the following guidance:2
-
Authorship credit should be based on (1) substantial contributions to conception and design, acquisition of data, or analysis and interpretation of data; (2) drafting the article or revising it critically for important intellectual content; and (3) final approval of the version to be published. Authors should meet conditions 1, 2, and 3.
The ICMJE notes that authorship is not justified for individuals who simply obtain or provide funding, participate in data collection or general supervision of the research, or serve as head of the group. Members of the team who play roles such as these are more appropriately acknowledged, and their specific contributions noted. The corresponding author should obtain written permission as such acknowledgements may imply endorsement of the work or its conclusions.
Authors, too, should make note of their individual contributions to manuscripts submitted to JHM. The Journal will begin publishing these specific contributions with each article, as do other medical journals.11
Plagiarism
Perhaps the most serious ethical violation that journals confront is plagiarism of copyrighted work. In its 5 years, JHM has detected 4 episodes of plagiarism. Thankfully, the Committee on Publication Ethics (
We recognize that other journals have needed to handle similar episodes of plagiarism,1215 and that self‐plagiarism (recycling of one's own published text) is also a concern.16, 17 Many methods exist to detect these practices.18 One powerful approach gaining popularity among medical journals utilizes CrossCheck. The CrossCheck service has 2 components: (1) a large, full‐text database of scholarly work from leading publishers, maintained by CrossRef (
Any form of plagiarism is inexcusable, and, if detected, is immediately addressed. Additionally, any author who submits plagiarized work will be banned from submitting manuscripts to JHM in the future, and will not be allowed to serve the Journal as a reviewer or in any other capacity. Our notification in selected cases of the individual's supervisor or department chair may elicit additional adverse consequences.
Summary
As the Journal of Hospital Medicine continues to grow and evolve, we are extraordinarily grateful when authors choose to submit their scholarly work to us. But growth does not come without challenges and responsibilities, such as a requirement to uphold ethical standards of biomedical publishing. We believe that the uniform disclosure of competing interests, clear reporting of contributions for authorship, and monitoring for plagiarism will help JHM maintain the standards that its readership and contributing authors deserve. We look forward to your contributions during our next 5 years, and beyond.
Since its founding in 2006,1 the editors of the Journal of Hospital Medicine (JHM), strongly supported the ethical guidelines and uniform requirements for manuscripts established by the International Committee of Medical Journal Editors (ICMJE).2 These guidelines require authors to verify that they have followed appropriate standards in the conduct of research, meet criteria for authorship, disclose potential conflicts of interest, and respect existing copyrights. With recent publication of editorials in leading medical journals affirming this responsibility for all authors submitting their scholarly work,38 the editors of the Journal echo the importance of following these ethical standards, and wish to update authors and readers on our policies related to authorship and plagiarism.
Disclosure of Competing Interests
Scientific publications commonly require that authors disclose relationships, financial or otherwise, with commercial entities that might have an interest in the subject matter of the article. Historically, biomedical journals varied in the content and format of the information they requested from authors,9 yielding inconsistent reporting by authors depending on the journal. Lack of clarity regarding what relationships authors should report contributed to this variable reporting. For example, an author might submit an article on headache management, and not believe it necessary to report honoraria received from pharmaceutical firms for giving lectures on antibiotic management of pneumonia. Thus, many believed that only funding related to the subject matter in a manuscript needed to be disclosed. While general advice has been to err on the side of disclosure, many authors hesitated to do so.
To clarify and standardize reporting requirements, the ICMJE recommended a uniform format for disclosure of competing interests,3 which was updated recently.10 The document, available online at
JHM strongly supports the ICMJE uniform requirements for manuscripts and has adopted the new form for disclosure of competing interests. Effective immediately, this documentation will be required for all types of manuscripts submitted to JHM. To help reduce the paperwork burden for authors, this documentation will be required only when authors are invited to revise and resubmit their work, after completion of the initial round of reviews. Typically at this stage, JHM also requests each author complete a Copyright Transfer Agreement (CTA). Thus, when a revision is requested by the Journal, we recommend that the corresponding author have each coauthor concurrently complete the CTA and disclosure of competing interests, and return all of the materials to JHM at the same time.
Criteria for Authorship
Authorship of scientific articles has important professional implications. In a field such as Hospital Medicine which explicitly values teamwork, it can sometimes be unclear which members of a team qualify for authorship on an article that may result from the group's work. The ICMJE provides the following guidance:2
-
Authorship credit should be based on (1) substantial contributions to conception and design, acquisition of data, or analysis and interpretation of data; (2) drafting the article or revising it critically for important intellectual content; and (3) final approval of the version to be published. Authors should meet conditions 1, 2, and 3.
The ICMJE notes that authorship is not justified for individuals who simply obtain or provide funding, participate in data collection or general supervision of the research, or serve as head of the group. Members of the team who play roles such as these are more appropriately acknowledged, and their specific contributions noted. The corresponding author should obtain written permission as such acknowledgements may imply endorsement of the work or its conclusions.
Authors, too, should make note of their individual contributions to manuscripts submitted to JHM. The Journal will begin publishing these specific contributions with each article, as do other medical journals.11
Plagiarism
Perhaps the most serious ethical violation that journals confront is plagiarism of copyrighted work. In its 5 years, JHM has detected 4 episodes of plagiarism. Thankfully, the Committee on Publication Ethics (
We recognize that other journals have needed to handle similar episodes of plagiarism,1215 and that self‐plagiarism (recycling of one's own published text) is also a concern.16, 17 Many methods exist to detect these practices.18 One powerful approach gaining popularity among medical journals utilizes CrossCheck. The CrossCheck service has 2 components: (1) a large, full‐text database of scholarly work from leading publishers, maintained by CrossRef (
Any form of plagiarism is inexcusable, and, if detected, is immediately addressed. Additionally, any author who submits plagiarized work will be banned from submitting manuscripts to JHM in the future, and will not be allowed to serve the Journal as a reviewer or in any other capacity. Our notification in selected cases of the individual's supervisor or department chair may elicit additional adverse consequences.
Summary
As the Journal of Hospital Medicine continues to grow and evolve, we are extraordinarily grateful when authors choose to submit their scholarly work to us. But growth does not come without challenges and responsibilities, such as a requirement to uphold ethical standards of biomedical publishing. We believe that the uniform disclosure of competing interests, clear reporting of contributions for authorship, and monitoring for plagiarism will help JHM maintain the standards that its readership and contributing authors deserve. We look forward to your contributions during our next 5 years, and beyond.
- .Hospital medicine's evolution—the next steps.J Hosp Med.2006;1(1):1–2.
- International Committee of Medical Journal Editors. Uniform requirements for manuscripts submitted to biomedical journals. Available at: http://www.icmje.org/. Accessed February 22,2010.
- , , , et al.Uniform format for disclosure of competing interests in ICMJE journals.N Engl J Med.2009;361(19):1896–1897.
- , , , et al.Uniform format for disclosure of competing interests in ICMJE journals.JAMA.2010;303(1):75–76.
- , , , et al.Uniform format for disclosure of competing interests in ICMJE journals.Ann Intern Med.2010;152(2):125–126.
- , , , et al.Uniform format for disclosure of competing interests in ICMJE journals.Lancet.2009;374(9699):1395–1396.
- , , , et al.Disclosure of competing interests.BMJ.2009;339:b4144.
- , , , et al.Uniform format for disclosure of competing interests in ICMJE journals.CMAJ.2009;181(9):565.
- , , , .Requirements and definitions in conflict of interest policies of medical journals.JAMA.2009;302(20):2230–2234.
- , , , , et al.Toward more uniform conflict disclosures ‐ the updated ICMJE conflict of interest reporting form.N Engl J Med.2010;363(2):188–189.
- , , , .Authorship criteria and disclosure of contributions: comparison of 3 general medical journals with different author contribution forms.JAMA.2004;292(1):86–88.
- , .Investigating allegations of scientific misconduct.BMJ.2005;331(7511):245–246.
- .Misconduct in medical research: does it exist in Britain?BMJ.1998;297:1531–1535.
- , .Research misconduct, retraction, and cleansing the medical literature: lessons from the Poehlman case.Annals of Internal Medicine.2006;144(8):609–613.
- .Report from the Scientific Integrity Advisor: issues arising in 2005 and 2006.Neurology.2007;68(21):1841–1842.
- Anonymous.Self‐plagiarism: unintentional, harmless, or fraud?Lancet.2009;374(9691):664.
- .Re‐using text from one's own previously published papers: an exploratory study of potential self‐plagiarism.Psychological Reports.2005;97(1):43–49.
- .Policing plagiarism.BMJ.2007;335(7627):963–964.
- .Hospital medicine's evolution—the next steps.J Hosp Med.2006;1(1):1–2.
- International Committee of Medical Journal Editors. Uniform requirements for manuscripts submitted to biomedical journals. Available at: http://www.icmje.org/. Accessed February 22,2010.
- , , , et al.Uniform format for disclosure of competing interests in ICMJE journals.N Engl J Med.2009;361(19):1896–1897.
- , , , et al.Uniform format for disclosure of competing interests in ICMJE journals.JAMA.2010;303(1):75–76.
- , , , et al.Uniform format for disclosure of competing interests in ICMJE journals.Ann Intern Med.2010;152(2):125–126.
- , , , et al.Uniform format for disclosure of competing interests in ICMJE journals.Lancet.2009;374(9699):1395–1396.
- , , , et al.Disclosure of competing interests.BMJ.2009;339:b4144.
- , , , et al.Uniform format for disclosure of competing interests in ICMJE journals.CMAJ.2009;181(9):565.
- , , , .Requirements and definitions in conflict of interest policies of medical journals.JAMA.2009;302(20):2230–2234.
- , , , , et al.Toward more uniform conflict disclosures ‐ the updated ICMJE conflict of interest reporting form.N Engl J Med.2010;363(2):188–189.
- , , , .Authorship criteria and disclosure of contributions: comparison of 3 general medical journals with different author contribution forms.JAMA.2004;292(1):86–88.
- , .Investigating allegations of scientific misconduct.BMJ.2005;331(7511):245–246.
- .Misconduct in medical research: does it exist in Britain?BMJ.1998;297:1531–1535.
- , .Research misconduct, retraction, and cleansing the medical literature: lessons from the Poehlman case.Annals of Internal Medicine.2006;144(8):609–613.
- .Report from the Scientific Integrity Advisor: issues arising in 2005 and 2006.Neurology.2007;68(21):1841–1842.
- Anonymous.Self‐plagiarism: unintentional, harmless, or fraud?Lancet.2009;374(9691):664.
- .Re‐using text from one's own previously published papers: an exploratory study of potential self‐plagiarism.Psychological Reports.2005;97(1):43–49.
- .Policing plagiarism.BMJ.2007;335(7627):963–964.
Hospitalist Time Motion Study
Hospital Medicine represents the fastest‐growing specialty in the history of medicine in the United States, with approximately 28,000 hospitalists now working in over half of American hospitals.1 Hospitalists increasingly fill the gap between demand for care of hospitalized patients and the deficit of physicians previously availableprimary care physicians in community hospitals and residents in teaching hospitals.2, 3 This growth has also been driven by hospitalists' ability to increase clinical efficiency. Research consistently demonstrates a reduction in overall costs and length of stay with the use of hospitalists.47 Additionally, many teaching hospitals have implemented nonteaching hospitalist services in an effort to comply with the Accreditation Council for Graduate Medicine Education (ACGME) program requirements regarding resident duty hours.8 Given the potential for improved clinical efficiency and the need to comply with revised ACGME program requirements, the Hospital Medicine Service at Northwestern Memorial Hospital (NMH) was established in 2003. Today, this service cares for more than half of hospitalized medical patients at NMH.
Although extensive research documents that implementation of a hospitalist program improves the efficiency of hospital care delivery,4, 6 there is little data to explain how hospitalists achieve this level of efficiency or how efficiency might be increased further. Several authors have suggested potential explanations for hospitalists' efficiency gains, but none has yet received strong empirical validation.5, 7 The only previously published study to directly observe more than a small portion of the activities of hospitalists was conducted at NMH in 2006.9 O'Leary et al. used time‐motion methodology to study ten hospitalists for 75 hours total. They found that hospitalists spend a large amount of time on communication when compared to nonhospitalist physicians. However, the study only reported partial information about how and with whom this communications was performed. Similarly, the authors reported that documentation occupied about a quarter of hospitalists' time, but did not report more detailed information about what was being documented and how. Additionally, they noted that hospitalists spent 21% of their time multitasking, but did not report what types of activities were performed during these episodes. Finally, at the time of that study hospitalists at NMH saw about 40% fewer patients per day than they do now. Increasing the number of patients each physician sees in a day is an obvious way to increase productivity, but it is unclear how this affects hospitalist workflow and time spent in various clinical activities.
Another important trend in hospital care delivery is the implementation of electronic medical records (EMR).10 NMH was just transitioning to a fully integrated EMR and computerized physician order entry (CPOE) system when the previous time‐motion study was performed. Now that the system is in place, a significant proportion of hospitalists' time has shifted from using a paper‐based record to sitting in front of a computer. However, we do not know exactly how hospitalists interact with the EMR and how this alters workflow; an increasingly important issue as hospitals across the U.S. implement EMRs at the behest of the federal government and aiming to improve patient safety.11
To better understand the workflow of hospitalists and validate the findings of the O'Leary study in a larger sample of hospitalists, we undertook this study seeking to collect data continuously for complete shifts, rather than sampling just a few hours at a time. We hypothesized that this would reduce observer effects and provide us with a more complete and accurate assessment of a day in the life of a hospitalist.
Methods
Study Site
The study was conducted at NMH, an 897‐bed tertiary care teaching hospital in Chicago, IL, and was approved by the Institutional Review Board of Northwestern University. Patients are admitted to the Hospital Medicine Service from the Emergency Department or directly from physicians' offices based on bed availability in a quasi‐randomized fashion. Hospitalists included in the study cared for patients without the assistance of housestaff physicians and worked 7 consecutive days while on service, usually followed by 7 consecutive days off service. During weeks on service, hospitalist shifts started at 7 AM and ended between 5 PM and 7 PM.
Data Collection Tool Development
To facilitate collection of detailed information sought for this study, we developed an electronic data collection tool. A systematic review of the medical literature on time studies performed by our research group indicated a lack of methodological standardization and dissimilar activity categorizations across studies.12 We attempted to develop a standardized method and data collection instrument for future studies, and first created a data dictionary consisting of a list of hospitalist activities and their descriptions. The initial components were drawn from prior time‐motion studies9, 13, 14 and input from experienced hospitalists (KJO and MVW). The activity list was then refined after a preliminary observation period in which five hospitalists were followed for a total of 6 shifts. Observers noted the specific activities being performed by the hospitalists and asked for explanations and clarification when necessary. In order for an activity to be included in the final list, the activity had to be easily observable and identifiable without subjective interpretation from the observer. The preliminary observation period ended once we were satisfied that no new activities were emerging.
The compiled list of activities was then broken down into related groups and separated into additional subcategories to increase the specificity of data collection. The final list of activities was reviewed by several experienced hospitalists to ensure completeness. The data dictionary was then loaded onto a Palm Pilot Tx using WorkStudy+ Plus software. The final activity list consisted of 8 main categories, 32 secondary categories, and 53 tertiary categories (See Appendix). To facilitate comparisons with prior studies, we followed the convention of including the categories of direct and indirect patient care. We defined direct patient care as those activities involving face‐to‐face interaction between the hospitalist and the patient. The more general indirect care category encompassed other categories of activity relevant to the patient's care but not performed in the presence of the patient (ie, professional communication, interaction with the EMR, and other patient related activities like searching for medical knowledge on the Internet or reading telemetry monitors).
Pilot Testing
We trained 6 observers in the use of the data collection tool. Each observer practiced shadowing for more than 20 hours with the tool before collecting study data. During this pilot testing phase we optimized the layout of the tool to facilitate rapid documentation of hospitalist activities and multitasking. Interobserver reliability was confirmed by having 2 observers shadow the same hospitalist for a three hour time period. In all cases, the observers obtained an average interclass correlation coefficient of at least 0.95 with a 95% confidence interval of .85 to 1.0 prior to collecting study data.
Study Design
Data collection occurred between July and September of 2008. A total of 24 hospitalists were observed, each for 2 complete weekday shifts starting at 7 AM and ending between 5 PM and 7 PM. Of note, we only observed hospitalists who were directly caring for patients and not part of a teaching service. Each hospitalist was contacted about the project at least a week prior to any observations and informed consent was obtained. A single observer shadowed a single hospitalist continuously, trading off with a new observer every 3 hours to avoid fatigue. To minimize any observation effect our data collectors were instructed not to initiate and to minimize conversation with the hospitalists. At the end of the hospitalist's shift the following data were tallied: the number of patients in the hospitalist's care at the beginning of the day, the number of patients discharged during the day, and the number of admissions. Patient load was determined by adding the number of admissions to the number of patients at the beginning of the day.
Data Analysis
Minutes were tallied for each of the categories and subcategories. Data is reported as percentages of total duration of observed activities (ie, including multitasking) unless otherwise specified. To explore the effect of patient volume on hospitalist workflow we performed t‐tests comparing the number of minutes hospitalists spent per patient in various activities on days with below average patient volume as compared to those with above average volume. Additionally, we performed a Wilcoxon two‐samples test to check for a difference in length of shift between these 2 groups.
Results
A total of 24 hospitalists were shadowed for a total of approximately 494 hours. For 43 of these hours a hospitalist was observed performing 2 tasks simultaneously, bringing the total duration of observed activities to 537 hours with multitasking. The hospitalists were a mean 34 1.1 years of age and 12 (50%) were female. Twenty (83%) had completed residency 2 or more years prior to the study, 2 (8%) had a year of hospitalist experience since residency, and the remaining 2 (8%) had just completed residency. Sixteen (67%) hospitalists were Asian or Pacific Islanders, 6 (25%) were White, and 2 (8%) were Black. The hospitalists cared for an average of 13.2 0.6 patients per shift and an average shift lasted 10 hours and 19 minutes 52 minutes.
Table 1 lists the mean percentage of time hospitalists spent on the various activities. Subjects spent the most time (34.1%) interacting with the EMR. Communication and direct care were the next most frequent activities at 25.9% and 17.4% of each shift respectively, followed by professional development (6.5%), travel (6.2%), personal time (5.6%), other indirect care (3.9%), and waiting (0.4%). The 3 subcategories included in indirect care time accounted for about 64% of all recorded activities.
| Main Category | % Total Observed Activities | (95% CI)* | Subcategory | % Main Category | (95% CI)* |
|---|---|---|---|---|---|
| |||||
| EMR* | 34.1 | (32.435.9) | |||
| Writing | 58.4 | (55.761.0) | |||
| Orders | 20.2 | (18.521.9) | |||
| Reading/reviewing | 19.4 | (17.321.5) | |||
| Other | 2.1 | (1.82.5) | |||
| Communication* | 25.9 | (24.427.4) | |||
| Outgoing call | 36.9 | (33.640.2) | |||
| Face to face | 28.1 | (25.231.0) | |||
| Incoming call | 14.4 | (12.616.3) | |||
| Sending page | 8.6 | (7.79.4) | |||
| Rounds | 3.8 | (1.85.8) | |||
| Receiving page | 3.4 | (2.94.0) | |||
| E‐mail | 2.9 | (1.83.9) | |||
| Reviewing page | 1.8 | (1.32.3) | |||
| Fax | 0.1 | (0.00.2) | |||
| Direct care | 17.4 | (15.918.9) | |||
| Professional Development | 6.5 | (4.48.5) | |||
| Travel | 6.2 | (5.66.7) | |||
| Personal | 5.7 | (4.17.2) | |||
| Other indirect care* | 3.9 | (3.44.4) | |||
| Wait | 0.4 | (0.20.5) | |||
Of the nearly 4 hours (233 minutes) per shift hospitalists spent using the EMR, the majority (58.4%) was spent documenting (See Table 1). Placing orders and reading/reviewing notes were nearly equal at 20.2% and 19.4% respectively, and other EMR activities took 2.1% of EMR time. Over half of the time (54.1%) hospitalists spent documenting in the EMR system was dedicated to progress notes. The remainder of effort was expended on writing histories and physicals (15.3%), discharge instructions (14.7%), discharge summaries (7.9%), sign‐outs (6.8%), and performing medication reconciliation (1.4%). Of the time spent reading and reviewing documents on the EMR, most was spent reviewing lab results (45.4%) or notes from the current admission (40.4%). Reviewing imaging studies occupied 8.1%, and notes from past encounters accounted for 6.2% of this category's time.
Various modes of communication were used during the nearly three hours (176 minutes) per shift dedicated to communication. Phone calls took up approximately half of the hospitalists' communication time, with 36.8% spent on outgoing calls and 14.2% incoming calls. Face‐to‐face communication was the next most common mode, accounting for 28.2% of the total. Time spent sending pages (8.8%), receiving pages (3.4%), and reviewing pages (1.8%) consumed 14% of all communication time. E‐mail and fax were used sparingly, at 3.1% and 0.1% of communication time, respectively. Finally, meetings involving other hospital staff (interdisciplinary rounds) occupied 3.4% of communication time.
The amount of time hospitalists spent communicating with specific types of individuals is shown in Table 2. Hospitalists spent the most time communicating with other physicians (44.5%) and nurses (18.1%). They spent less time communicating with people from the remaining categories; utilization staff (5.7%), patients' family members (5.6%), case managers (4.2%), primary care physicians (3.4%), ancillary staff (3.1%), and pharmacists (0.6%). Communication with other individuals that did not fit in the above categories accounted for 8.8%, and 5.3% of communication could not be clearly categorized, generally because the hospitalist was communicating by phone or text page and ascertaining with whom would have required significant interruption.
| Subcategory | % Main Category | (95% CI)* |
|---|---|---|
| ||
| Inpatient physician | 44.5 | (41.747.2) |
| Nursing staff | 18.0 | (16.019.9) |
| Other | 8.5 | (6.810.2) |
| Family | 5.8 | (4.07.7) |
| Utilization staff | 5.8 | (4.67.0) |
| Uncategorized | 5.7 | (3.77.6) |
| PCC | 4.0 | (2.35.7) |
| PCP | 3.6 | (2.74.5) |
| Ancillary staff | 2.9 | (2.23.7) |
| Pharmacy | 1.4 | (0.82.0) |
We found that 16% of all recorded activities occurred when another activity was also ongoing. This means that hospitalists were performing more than one activity for approximately 54 minutes per day, or about 9% of the average 10.3‐hour shift. Instances of multitasking occurred frequently, but were usually brief; the hospitalists performed 2 activities simultaneously an average of 75 times per day, but 79% of these occurrences lasted less than 1 minute. Of the 86 hours of multitasking activities recorded, 41% was communication time and another 41% was EMR use. This means that a second activity was being performed during 19% of the time hospitalists spent using the EMR and 26% of the time they spent communicating. Of the time spent on critical documentation activities like writing prescriptions and orders, 24% was recorded during a multitasking event.
The amount of time hospitalists spent per patient on days with above average patient volume as compared to those with below average patient volume is shown in Table 3. Hospitalists with above average patient numbers spent about 3 minutes less per patient interacting with the EMR (a 17% reduction; P < 0.01), and about 2 minutes less per patient communicating (a 14% reduction; P < 0.01). The average length of shift increased by 12 minutes on days when patient volume was above average; P < 0.05.
| Subcategory | Minutes: Below Average Census | (95% CI)* | Minutes: Above Average Census | (95% CI)* | Pr > |t| |
|---|---|---|---|---|---|
| |||||
| EMR | 19.12 | (17.5020.75) | 15.83 | (14.1717.49) | <.001 |
| Communication | 14.28 | (12.8615.71) | 12.21 | (11.0713.36) | 0.002 |
| Direct care | 9.30 | (8.1810.42) | 8.59 | (7.279.91) | 0.293 |
| Professional development | 4.09 | (2.365.81) | 2.57 | (1.263.89) | 0.026 |
| Personal | 3.52 | (2.394.65) | 2.05 | (1.292.82) | 0.032 |
| Travel | 3.32 | (2.863.79) | 2.93 | (2.643.22) | 0.566 |
| Other indirect care | 2.37 | (1.902.84) | 1.65 | (1.321.98) | 0.292 |
| Wait | 0.25 | (0.080.41) | 0.14 | (0.040.25) | 0.881 |
Discussion
To our knowledge, this study represents the largest time‐motion evaluation of hospitalist activities ever undertaken, and provides the most detailed assessment of hospitalists' activities when caring for patients without residents or medical students. We confirmed that hospitalists spend the majority of their time (64%) undertaking care activities away from the patient's bedside, and are involved in direct patient care contact only 17% of their time, averaging about 9 minutes per patient. The hospitalists spent about a quarter (26%) of their time communicating with others. Compared to other physicians, this is an unusually large amount of time. For example, Hollingsworth et al.15 found that emergency medicine physicians spent just half as much (13%) of their time on communication with other providers and staff. This may reflect hospitalists' central role in the coordination of consulting specialists. The other significant portion of hospitalists' effort focuses on documentation in the electronic medical record, with 22% of their time required for CPOE and note writing, and overall a third of their time (34.1%) committed to interacting with the EMR.
In many respects, our results confirm the findings of O'Leary et al.'s previous work. While this current study more precisely identified how hospitalists spend their time, the general proportions of times were similar. Both studies found that indirect care activities occupied about two‐thirds of hospitalists' time (64% in this study and 69% in the previous study). We also documented similar portions of total time for direct patient care (17% vs. 18%) and communication (26% vs. 24%). Interestingly, with complete implementation of the EMR system, the percentage of time spent on documentation appeared to decrease. O'Leary et al. reported that documentation accounted for 26% of hospitalists' time, while the equivalent activities (writing in the EMR or paper prescriptions) accounted for only 21% in the current study. Unfortunately, the significance of this finding is difficult to determine given the concurrent changes in patient volumes and the varying extent of EMR implementation during the earlier study.
Over half of hospitalists' communication time is spent either making or receiving phone calls. This suggests that efforts to facilitate communication (eg, use of mobile phone systems and voicemail) might enhance efficiency. Additionally, we found that nearly half of our hospitalists' communication was with other physicians. Not surprisingly, our study confirmed that an important part of hospitalists' work involves organizing and collaborating with a variety of specialists to provide optimal care for their patients.
Hospitalists spent a great deal of time multitasking. We found that multitasking time accounted for nearly 1 of every 10 minutes during the day. The most common combination of activities involved communication that occurred during a period of EMR use. These interruptions could have serious consequences should physicians lose track of what they are doing while ordering procedures or prescribing medications.
We documented a smaller portion of multitasking time than O'Leary's earlier study. This could be due to differences in how multitasking was defined or recorded in the 2 studies. Our electronic data collection tool allowed us to capture rapid task switching and multitasking to the second, rather than to the minute, as was done with the stopwatch and paper form used in the previous study. This precision was important, especially considering that nearly 80% of the recorded instances of multitasking lasted less than 1 minute.
Our data also suggests that patient census has significant effects on certain parts of hospitalist workflow. Patient volume for our subjects ranged from 10 to 19 patients per shift, with a mean of 13.2 patients. The amount of time our hospitalists spent with each patient did not differ significantly between above and below average census days. However, EMR time per patient was significantly reduced on above average census days. Anecdotally, several of our hospitalists suggested that on high census days they put off less time‐sensitive documentation activities like discharge summaries until after they leave the hospital and complete the work from home or on the following day. Thus, our study likely underestimates the total additional effort on high volume days, but unfortunately we had no direct way of quantifying work performed outside of the hospital or on subsequent days. Communication time was also significantly reduced when patient volumes were above average, suggesting that hospitalists had less time to confer with consultants or answer the questions of nurses and patient family members.
Several factors limit the interpretation and application of our findings. First, our study was conducted at a single urban, academic hospital, which may limit its applicability for hospitalists working at community hospitals. Given that more than 90% of hospital care in the U.S. occurs in the community hospital setting, research to confirm these findings in such hospitals is needed.16 Nonclinical research assistants collected all of the data, so the results may be limited by the accuracy of their interpretations. However, our extensive training and documentation of their accuracy serves as a strength of the study. Finally, we focused exclusively on daytime, weekday activities of hospitalists. Notably, 3 hospitalists work through the night at our facility, and 24‐hour coverage by hospitalists is increasingly common across the U.S. We expect weekend and night shift workflow to be somewhat different from standard day shifts due to the decreased availability of other medical providers for testing, consults, and procedures. Future research should focus on potential differences in activities on nights and weekends compared to weekdays.
This extensive, comprehensive analysis of hospitalist activities and workflow provides a foundation for future research and confirms much of O'Leary et al.'s original study. O'Leary's simpler approach of observing smaller blocks of time rather than full shifts proved effective; the two methodologies produced markedly similar results. The current study also offers some insight into matters of efficiency. We found that hospitalists with higher patient loads cut down on EMR and communication time. We also confirmed that hospitalists spend the largest portion of their time interacting with the EMR. A more efficient EMR system could therefore be especially helpful in providing more time for direct patient care and the communication necessary to coordinate care. Given that most hospitals provide financial support for hospital medicine programs (an average of $95,000 per hospitalist full‐time equivalent (FTE)1), hospital administrators have a keen interest in understanding how hospitalists might be more efficient. For example, if hospitalists could evaluate and manage two additional patients each day by exchanging time focused on medical record documentation for direct care activities, the cost of a hospitalist drops substantively. By understanding current hospitalist activities, efforts at redesigning their workflow can be more successful at addressing issues related to scheduling, communication, and compensation, thus improving the overall model of practice as well as the quality of patient care.17
Acknowledgements
We thank Caitlin Lawes and Stephen Williams for help with data collection, and all the hospitalists who participated in this study.
- Society of Hospital Medicine. About SHM.2008; http://www.hospitalmedicine.org/AM/Template.cfm?Section=About_SHM. Accessed April 2010.
- , .The evolution and future of hospital medicine.Mt Sinai J Med.2008;75(5):418–423.
- , , .Rehospitalizations among patients in the Fee‐for‐Service Medicare Program.N Engl J Med.2009;360(14):1418–1428.
- , , , , , .Outcomes of care by hospitalists, general internists, and family physicians.[see comment].N Engl J Med.2007;357(25):2589–2600.
- , .The hospitalist movement 5 years later.JAMA.2002;287:487–494.
- , .The impact of hospitalists on the cost and quality of inpatient care in the United States: a research synthesis.Med Care Res Rev.2005;62:379–406.
- .Hospitalists and the hospital medicine system of care are good for patient care.Arch Intern Med.2008;168(12):1254–1256; discussion 1259–1260.
- , .Hospitalists in teaching hospitals: opportunities but not without danger.J Gen Intern Med.2004;19:392–393.
- , , .How hospitalists spend their time: insights on efficiency and safety.J Hosp Med.2006;1(2):88–93.
- , , , et al.Use of electronic health records in U.S. hospitals.N Engl J Med.2009;360.
- .Electronic medical records at a crossroads: impetus for change or missed opportunity?JAMA.2009;302(10):1109–1111.
- , , , , .Systematic review of time studies evaluating physicians in the hospital setting.J Hosp Med.2010;5(6):000–000.
- , , , .All in a day's work: an observational study to quantify how and with whom doctors on hospital wards spend their time.Med J Aust.2008;188(9):506–509.
- , , , .Emergency department workplace interruptions: are emergency physicians “interrupt‐driven” and “multitasking”?Acad Emerg Med.2000;7:1239–1243.
- , , , , .How do physicians and nurses spend their time in the emergency department?Ann Emerg Med.1998;31(1):87–91.
- , , , , .The ecology of medical care revisited.N Engl J Med.2001;344(26):2021–2025.
- , .Organizing a hospitalist program: an overview of fundamental concepts.Med Clin North Am.2002;86(4):887–909.
Hospital Medicine represents the fastest‐growing specialty in the history of medicine in the United States, with approximately 28,000 hospitalists now working in over half of American hospitals.1 Hospitalists increasingly fill the gap between demand for care of hospitalized patients and the deficit of physicians previously availableprimary care physicians in community hospitals and residents in teaching hospitals.2, 3 This growth has also been driven by hospitalists' ability to increase clinical efficiency. Research consistently demonstrates a reduction in overall costs and length of stay with the use of hospitalists.47 Additionally, many teaching hospitals have implemented nonteaching hospitalist services in an effort to comply with the Accreditation Council for Graduate Medicine Education (ACGME) program requirements regarding resident duty hours.8 Given the potential for improved clinical efficiency and the need to comply with revised ACGME program requirements, the Hospital Medicine Service at Northwestern Memorial Hospital (NMH) was established in 2003. Today, this service cares for more than half of hospitalized medical patients at NMH.
Although extensive research documents that implementation of a hospitalist program improves the efficiency of hospital care delivery,4, 6 there is little data to explain how hospitalists achieve this level of efficiency or how efficiency might be increased further. Several authors have suggested potential explanations for hospitalists' efficiency gains, but none has yet received strong empirical validation.5, 7 The only previously published study to directly observe more than a small portion of the activities of hospitalists was conducted at NMH in 2006.9 O'Leary et al. used time‐motion methodology to study ten hospitalists for 75 hours total. They found that hospitalists spend a large amount of time on communication when compared to nonhospitalist physicians. However, the study only reported partial information about how and with whom this communications was performed. Similarly, the authors reported that documentation occupied about a quarter of hospitalists' time, but did not report more detailed information about what was being documented and how. Additionally, they noted that hospitalists spent 21% of their time multitasking, but did not report what types of activities were performed during these episodes. Finally, at the time of that study hospitalists at NMH saw about 40% fewer patients per day than they do now. Increasing the number of patients each physician sees in a day is an obvious way to increase productivity, but it is unclear how this affects hospitalist workflow and time spent in various clinical activities.
Another important trend in hospital care delivery is the implementation of electronic medical records (EMR).10 NMH was just transitioning to a fully integrated EMR and computerized physician order entry (CPOE) system when the previous time‐motion study was performed. Now that the system is in place, a significant proportion of hospitalists' time has shifted from using a paper‐based record to sitting in front of a computer. However, we do not know exactly how hospitalists interact with the EMR and how this alters workflow; an increasingly important issue as hospitals across the U.S. implement EMRs at the behest of the federal government and aiming to improve patient safety.11
To better understand the workflow of hospitalists and validate the findings of the O'Leary study in a larger sample of hospitalists, we undertook this study seeking to collect data continuously for complete shifts, rather than sampling just a few hours at a time. We hypothesized that this would reduce observer effects and provide us with a more complete and accurate assessment of a day in the life of a hospitalist.
Methods
Study Site
The study was conducted at NMH, an 897‐bed tertiary care teaching hospital in Chicago, IL, and was approved by the Institutional Review Board of Northwestern University. Patients are admitted to the Hospital Medicine Service from the Emergency Department or directly from physicians' offices based on bed availability in a quasi‐randomized fashion. Hospitalists included in the study cared for patients without the assistance of housestaff physicians and worked 7 consecutive days while on service, usually followed by 7 consecutive days off service. During weeks on service, hospitalist shifts started at 7 AM and ended between 5 PM and 7 PM.
Data Collection Tool Development
To facilitate collection of detailed information sought for this study, we developed an electronic data collection tool. A systematic review of the medical literature on time studies performed by our research group indicated a lack of methodological standardization and dissimilar activity categorizations across studies.12 We attempted to develop a standardized method and data collection instrument for future studies, and first created a data dictionary consisting of a list of hospitalist activities and their descriptions. The initial components were drawn from prior time‐motion studies9, 13, 14 and input from experienced hospitalists (KJO and MVW). The activity list was then refined after a preliminary observation period in which five hospitalists were followed for a total of 6 shifts. Observers noted the specific activities being performed by the hospitalists and asked for explanations and clarification when necessary. In order for an activity to be included in the final list, the activity had to be easily observable and identifiable without subjective interpretation from the observer. The preliminary observation period ended once we were satisfied that no new activities were emerging.
The compiled list of activities was then broken down into related groups and separated into additional subcategories to increase the specificity of data collection. The final list of activities was reviewed by several experienced hospitalists to ensure completeness. The data dictionary was then loaded onto a Palm Pilot Tx using WorkStudy+ Plus software. The final activity list consisted of 8 main categories, 32 secondary categories, and 53 tertiary categories (See Appendix). To facilitate comparisons with prior studies, we followed the convention of including the categories of direct and indirect patient care. We defined direct patient care as those activities involving face‐to‐face interaction between the hospitalist and the patient. The more general indirect care category encompassed other categories of activity relevant to the patient's care but not performed in the presence of the patient (ie, professional communication, interaction with the EMR, and other patient related activities like searching for medical knowledge on the Internet or reading telemetry monitors).
Pilot Testing
We trained 6 observers in the use of the data collection tool. Each observer practiced shadowing for more than 20 hours with the tool before collecting study data. During this pilot testing phase we optimized the layout of the tool to facilitate rapid documentation of hospitalist activities and multitasking. Interobserver reliability was confirmed by having 2 observers shadow the same hospitalist for a three hour time period. In all cases, the observers obtained an average interclass correlation coefficient of at least 0.95 with a 95% confidence interval of .85 to 1.0 prior to collecting study data.
Study Design
Data collection occurred between July and September of 2008. A total of 24 hospitalists were observed, each for 2 complete weekday shifts starting at 7 AM and ending between 5 PM and 7 PM. Of note, we only observed hospitalists who were directly caring for patients and not part of a teaching service. Each hospitalist was contacted about the project at least a week prior to any observations and informed consent was obtained. A single observer shadowed a single hospitalist continuously, trading off with a new observer every 3 hours to avoid fatigue. To minimize any observation effect our data collectors were instructed not to initiate and to minimize conversation with the hospitalists. At the end of the hospitalist's shift the following data were tallied: the number of patients in the hospitalist's care at the beginning of the day, the number of patients discharged during the day, and the number of admissions. Patient load was determined by adding the number of admissions to the number of patients at the beginning of the day.
Data Analysis
Minutes were tallied for each of the categories and subcategories. Data is reported as percentages of total duration of observed activities (ie, including multitasking) unless otherwise specified. To explore the effect of patient volume on hospitalist workflow we performed t‐tests comparing the number of minutes hospitalists spent per patient in various activities on days with below average patient volume as compared to those with above average volume. Additionally, we performed a Wilcoxon two‐samples test to check for a difference in length of shift between these 2 groups.
Results
A total of 24 hospitalists were shadowed for a total of approximately 494 hours. For 43 of these hours a hospitalist was observed performing 2 tasks simultaneously, bringing the total duration of observed activities to 537 hours with multitasking. The hospitalists were a mean 34 1.1 years of age and 12 (50%) were female. Twenty (83%) had completed residency 2 or more years prior to the study, 2 (8%) had a year of hospitalist experience since residency, and the remaining 2 (8%) had just completed residency. Sixteen (67%) hospitalists were Asian or Pacific Islanders, 6 (25%) were White, and 2 (8%) were Black. The hospitalists cared for an average of 13.2 0.6 patients per shift and an average shift lasted 10 hours and 19 minutes 52 minutes.
Table 1 lists the mean percentage of time hospitalists spent on the various activities. Subjects spent the most time (34.1%) interacting with the EMR. Communication and direct care were the next most frequent activities at 25.9% and 17.4% of each shift respectively, followed by professional development (6.5%), travel (6.2%), personal time (5.6%), other indirect care (3.9%), and waiting (0.4%). The 3 subcategories included in indirect care time accounted for about 64% of all recorded activities.
| Main Category | % Total Observed Activities | (95% CI)* | Subcategory | % Main Category | (95% CI)* |
|---|---|---|---|---|---|
| |||||
| EMR* | 34.1 | (32.435.9) | |||
| Writing | 58.4 | (55.761.0) | |||
| Orders | 20.2 | (18.521.9) | |||
| Reading/reviewing | 19.4 | (17.321.5) | |||
| Other | 2.1 | (1.82.5) | |||
| Communication* | 25.9 | (24.427.4) | |||
| Outgoing call | 36.9 | (33.640.2) | |||
| Face to face | 28.1 | (25.231.0) | |||
| Incoming call | 14.4 | (12.616.3) | |||
| Sending page | 8.6 | (7.79.4) | |||
| Rounds | 3.8 | (1.85.8) | |||
| Receiving page | 3.4 | (2.94.0) | |||
| E‐mail | 2.9 | (1.83.9) | |||
| Reviewing page | 1.8 | (1.32.3) | |||
| Fax | 0.1 | (0.00.2) | |||
| Direct care | 17.4 | (15.918.9) | |||
| Professional Development | 6.5 | (4.48.5) | |||
| Travel | 6.2 | (5.66.7) | |||
| Personal | 5.7 | (4.17.2) | |||
| Other indirect care* | 3.9 | (3.44.4) | |||
| Wait | 0.4 | (0.20.5) | |||
Of the nearly 4 hours (233 minutes) per shift hospitalists spent using the EMR, the majority (58.4%) was spent documenting (See Table 1). Placing orders and reading/reviewing notes were nearly equal at 20.2% and 19.4% respectively, and other EMR activities took 2.1% of EMR time. Over half of the time (54.1%) hospitalists spent documenting in the EMR system was dedicated to progress notes. The remainder of effort was expended on writing histories and physicals (15.3%), discharge instructions (14.7%), discharge summaries (7.9%), sign‐outs (6.8%), and performing medication reconciliation (1.4%). Of the time spent reading and reviewing documents on the EMR, most was spent reviewing lab results (45.4%) or notes from the current admission (40.4%). Reviewing imaging studies occupied 8.1%, and notes from past encounters accounted for 6.2% of this category's time.
Various modes of communication were used during the nearly three hours (176 minutes) per shift dedicated to communication. Phone calls took up approximately half of the hospitalists' communication time, with 36.8% spent on outgoing calls and 14.2% incoming calls. Face‐to‐face communication was the next most common mode, accounting for 28.2% of the total. Time spent sending pages (8.8%), receiving pages (3.4%), and reviewing pages (1.8%) consumed 14% of all communication time. E‐mail and fax were used sparingly, at 3.1% and 0.1% of communication time, respectively. Finally, meetings involving other hospital staff (interdisciplinary rounds) occupied 3.4% of communication time.
The amount of time hospitalists spent communicating with specific types of individuals is shown in Table 2. Hospitalists spent the most time communicating with other physicians (44.5%) and nurses (18.1%). They spent less time communicating with people from the remaining categories; utilization staff (5.7%), patients' family members (5.6%), case managers (4.2%), primary care physicians (3.4%), ancillary staff (3.1%), and pharmacists (0.6%). Communication with other individuals that did not fit in the above categories accounted for 8.8%, and 5.3% of communication could not be clearly categorized, generally because the hospitalist was communicating by phone or text page and ascertaining with whom would have required significant interruption.
| Subcategory | % Main Category | (95% CI)* |
|---|---|---|
| ||
| Inpatient physician | 44.5 | (41.747.2) |
| Nursing staff | 18.0 | (16.019.9) |
| Other | 8.5 | (6.810.2) |
| Family | 5.8 | (4.07.7) |
| Utilization staff | 5.8 | (4.67.0) |
| Uncategorized | 5.7 | (3.77.6) |
| PCC | 4.0 | (2.35.7) |
| PCP | 3.6 | (2.74.5) |
| Ancillary staff | 2.9 | (2.23.7) |
| Pharmacy | 1.4 | (0.82.0) |
We found that 16% of all recorded activities occurred when another activity was also ongoing. This means that hospitalists were performing more than one activity for approximately 54 minutes per day, or about 9% of the average 10.3‐hour shift. Instances of multitasking occurred frequently, but were usually brief; the hospitalists performed 2 activities simultaneously an average of 75 times per day, but 79% of these occurrences lasted less than 1 minute. Of the 86 hours of multitasking activities recorded, 41% was communication time and another 41% was EMR use. This means that a second activity was being performed during 19% of the time hospitalists spent using the EMR and 26% of the time they spent communicating. Of the time spent on critical documentation activities like writing prescriptions and orders, 24% was recorded during a multitasking event.
The amount of time hospitalists spent per patient on days with above average patient volume as compared to those with below average patient volume is shown in Table 3. Hospitalists with above average patient numbers spent about 3 minutes less per patient interacting with the EMR (a 17% reduction; P < 0.01), and about 2 minutes less per patient communicating (a 14% reduction; P < 0.01). The average length of shift increased by 12 minutes on days when patient volume was above average; P < 0.05.
| Subcategory | Minutes: Below Average Census | (95% CI)* | Minutes: Above Average Census | (95% CI)* | Pr > |t| |
|---|---|---|---|---|---|
| |||||
| EMR | 19.12 | (17.5020.75) | 15.83 | (14.1717.49) | <.001 |
| Communication | 14.28 | (12.8615.71) | 12.21 | (11.0713.36) | 0.002 |
| Direct care | 9.30 | (8.1810.42) | 8.59 | (7.279.91) | 0.293 |
| Professional development | 4.09 | (2.365.81) | 2.57 | (1.263.89) | 0.026 |
| Personal | 3.52 | (2.394.65) | 2.05 | (1.292.82) | 0.032 |
| Travel | 3.32 | (2.863.79) | 2.93 | (2.643.22) | 0.566 |
| Other indirect care | 2.37 | (1.902.84) | 1.65 | (1.321.98) | 0.292 |
| Wait | 0.25 | (0.080.41) | 0.14 | (0.040.25) | 0.881 |
Discussion
To our knowledge, this study represents the largest time‐motion evaluation of hospitalist activities ever undertaken, and provides the most detailed assessment of hospitalists' activities when caring for patients without residents or medical students. We confirmed that hospitalists spend the majority of their time (64%) undertaking care activities away from the patient's bedside, and are involved in direct patient care contact only 17% of their time, averaging about 9 minutes per patient. The hospitalists spent about a quarter (26%) of their time communicating with others. Compared to other physicians, this is an unusually large amount of time. For example, Hollingsworth et al.15 found that emergency medicine physicians spent just half as much (13%) of their time on communication with other providers and staff. This may reflect hospitalists' central role in the coordination of consulting specialists. The other significant portion of hospitalists' effort focuses on documentation in the electronic medical record, with 22% of their time required for CPOE and note writing, and overall a third of their time (34.1%) committed to interacting with the EMR.
In many respects, our results confirm the findings of O'Leary et al.'s previous work. While this current study more precisely identified how hospitalists spend their time, the general proportions of times were similar. Both studies found that indirect care activities occupied about two‐thirds of hospitalists' time (64% in this study and 69% in the previous study). We also documented similar portions of total time for direct patient care (17% vs. 18%) and communication (26% vs. 24%). Interestingly, with complete implementation of the EMR system, the percentage of time spent on documentation appeared to decrease. O'Leary et al. reported that documentation accounted for 26% of hospitalists' time, while the equivalent activities (writing in the EMR or paper prescriptions) accounted for only 21% in the current study. Unfortunately, the significance of this finding is difficult to determine given the concurrent changes in patient volumes and the varying extent of EMR implementation during the earlier study.
Over half of hospitalists' communication time is spent either making or receiving phone calls. This suggests that efforts to facilitate communication (eg, use of mobile phone systems and voicemail) might enhance efficiency. Additionally, we found that nearly half of our hospitalists' communication was with other physicians. Not surprisingly, our study confirmed that an important part of hospitalists' work involves organizing and collaborating with a variety of specialists to provide optimal care for their patients.
Hospitalists spent a great deal of time multitasking. We found that multitasking time accounted for nearly 1 of every 10 minutes during the day. The most common combination of activities involved communication that occurred during a period of EMR use. These interruptions could have serious consequences should physicians lose track of what they are doing while ordering procedures or prescribing medications.
We documented a smaller portion of multitasking time than O'Leary's earlier study. This could be due to differences in how multitasking was defined or recorded in the 2 studies. Our electronic data collection tool allowed us to capture rapid task switching and multitasking to the second, rather than to the minute, as was done with the stopwatch and paper form used in the previous study. This precision was important, especially considering that nearly 80% of the recorded instances of multitasking lasted less than 1 minute.
Our data also suggests that patient census has significant effects on certain parts of hospitalist workflow. Patient volume for our subjects ranged from 10 to 19 patients per shift, with a mean of 13.2 patients. The amount of time our hospitalists spent with each patient did not differ significantly between above and below average census days. However, EMR time per patient was significantly reduced on above average census days. Anecdotally, several of our hospitalists suggested that on high census days they put off less time‐sensitive documentation activities like discharge summaries until after they leave the hospital and complete the work from home or on the following day. Thus, our study likely underestimates the total additional effort on high volume days, but unfortunately we had no direct way of quantifying work performed outside of the hospital or on subsequent days. Communication time was also significantly reduced when patient volumes were above average, suggesting that hospitalists had less time to confer with consultants or answer the questions of nurses and patient family members.
Several factors limit the interpretation and application of our findings. First, our study was conducted at a single urban, academic hospital, which may limit its applicability for hospitalists working at community hospitals. Given that more than 90% of hospital care in the U.S. occurs in the community hospital setting, research to confirm these findings in such hospitals is needed.16 Nonclinical research assistants collected all of the data, so the results may be limited by the accuracy of their interpretations. However, our extensive training and documentation of their accuracy serves as a strength of the study. Finally, we focused exclusively on daytime, weekday activities of hospitalists. Notably, 3 hospitalists work through the night at our facility, and 24‐hour coverage by hospitalists is increasingly common across the U.S. We expect weekend and night shift workflow to be somewhat different from standard day shifts due to the decreased availability of other medical providers for testing, consults, and procedures. Future research should focus on potential differences in activities on nights and weekends compared to weekdays.
This extensive, comprehensive analysis of hospitalist activities and workflow provides a foundation for future research and confirms much of O'Leary et al.'s original study. O'Leary's simpler approach of observing smaller blocks of time rather than full shifts proved effective; the two methodologies produced markedly similar results. The current study also offers some insight into matters of efficiency. We found that hospitalists with higher patient loads cut down on EMR and communication time. We also confirmed that hospitalists spend the largest portion of their time interacting with the EMR. A more efficient EMR system could therefore be especially helpful in providing more time for direct patient care and the communication necessary to coordinate care. Given that most hospitals provide financial support for hospital medicine programs (an average of $95,000 per hospitalist full‐time equivalent (FTE)1), hospital administrators have a keen interest in understanding how hospitalists might be more efficient. For example, if hospitalists could evaluate and manage two additional patients each day by exchanging time focused on medical record documentation for direct care activities, the cost of a hospitalist drops substantively. By understanding current hospitalist activities, efforts at redesigning their workflow can be more successful at addressing issues related to scheduling, communication, and compensation, thus improving the overall model of practice as well as the quality of patient care.17
Acknowledgements
We thank Caitlin Lawes and Stephen Williams for help with data collection, and all the hospitalists who participated in this study.
Hospital Medicine represents the fastest‐growing specialty in the history of medicine in the United States, with approximately 28,000 hospitalists now working in over half of American hospitals.1 Hospitalists increasingly fill the gap between demand for care of hospitalized patients and the deficit of physicians previously availableprimary care physicians in community hospitals and residents in teaching hospitals.2, 3 This growth has also been driven by hospitalists' ability to increase clinical efficiency. Research consistently demonstrates a reduction in overall costs and length of stay with the use of hospitalists.47 Additionally, many teaching hospitals have implemented nonteaching hospitalist services in an effort to comply with the Accreditation Council for Graduate Medicine Education (ACGME) program requirements regarding resident duty hours.8 Given the potential for improved clinical efficiency and the need to comply with revised ACGME program requirements, the Hospital Medicine Service at Northwestern Memorial Hospital (NMH) was established in 2003. Today, this service cares for more than half of hospitalized medical patients at NMH.
Although extensive research documents that implementation of a hospitalist program improves the efficiency of hospital care delivery,4, 6 there is little data to explain how hospitalists achieve this level of efficiency or how efficiency might be increased further. Several authors have suggested potential explanations for hospitalists' efficiency gains, but none has yet received strong empirical validation.5, 7 The only previously published study to directly observe more than a small portion of the activities of hospitalists was conducted at NMH in 2006.9 O'Leary et al. used time‐motion methodology to study ten hospitalists for 75 hours total. They found that hospitalists spend a large amount of time on communication when compared to nonhospitalist physicians. However, the study only reported partial information about how and with whom this communications was performed. Similarly, the authors reported that documentation occupied about a quarter of hospitalists' time, but did not report more detailed information about what was being documented and how. Additionally, they noted that hospitalists spent 21% of their time multitasking, but did not report what types of activities were performed during these episodes. Finally, at the time of that study hospitalists at NMH saw about 40% fewer patients per day than they do now. Increasing the number of patients each physician sees in a day is an obvious way to increase productivity, but it is unclear how this affects hospitalist workflow and time spent in various clinical activities.
Another important trend in hospital care delivery is the implementation of electronic medical records (EMR).10 NMH was just transitioning to a fully integrated EMR and computerized physician order entry (CPOE) system when the previous time‐motion study was performed. Now that the system is in place, a significant proportion of hospitalists' time has shifted from using a paper‐based record to sitting in front of a computer. However, we do not know exactly how hospitalists interact with the EMR and how this alters workflow; an increasingly important issue as hospitals across the U.S. implement EMRs at the behest of the federal government and aiming to improve patient safety.11
To better understand the workflow of hospitalists and validate the findings of the O'Leary study in a larger sample of hospitalists, we undertook this study seeking to collect data continuously for complete shifts, rather than sampling just a few hours at a time. We hypothesized that this would reduce observer effects and provide us with a more complete and accurate assessment of a day in the life of a hospitalist.
Methods
Study Site
The study was conducted at NMH, an 897‐bed tertiary care teaching hospital in Chicago, IL, and was approved by the Institutional Review Board of Northwestern University. Patients are admitted to the Hospital Medicine Service from the Emergency Department or directly from physicians' offices based on bed availability in a quasi‐randomized fashion. Hospitalists included in the study cared for patients without the assistance of housestaff physicians and worked 7 consecutive days while on service, usually followed by 7 consecutive days off service. During weeks on service, hospitalist shifts started at 7 AM and ended between 5 PM and 7 PM.
Data Collection Tool Development
To facilitate collection of detailed information sought for this study, we developed an electronic data collection tool. A systematic review of the medical literature on time studies performed by our research group indicated a lack of methodological standardization and dissimilar activity categorizations across studies.12 We attempted to develop a standardized method and data collection instrument for future studies, and first created a data dictionary consisting of a list of hospitalist activities and their descriptions. The initial components were drawn from prior time‐motion studies9, 13, 14 and input from experienced hospitalists (KJO and MVW). The activity list was then refined after a preliminary observation period in which five hospitalists were followed for a total of 6 shifts. Observers noted the specific activities being performed by the hospitalists and asked for explanations and clarification when necessary. In order for an activity to be included in the final list, the activity had to be easily observable and identifiable without subjective interpretation from the observer. The preliminary observation period ended once we were satisfied that no new activities were emerging.
The compiled list of activities was then broken down into related groups and separated into additional subcategories to increase the specificity of data collection. The final list of activities was reviewed by several experienced hospitalists to ensure completeness. The data dictionary was then loaded onto a Palm Pilot Tx using WorkStudy+ Plus software. The final activity list consisted of 8 main categories, 32 secondary categories, and 53 tertiary categories (See Appendix). To facilitate comparisons with prior studies, we followed the convention of including the categories of direct and indirect patient care. We defined direct patient care as those activities involving face‐to‐face interaction between the hospitalist and the patient. The more general indirect care category encompassed other categories of activity relevant to the patient's care but not performed in the presence of the patient (ie, professional communication, interaction with the EMR, and other patient related activities like searching for medical knowledge on the Internet or reading telemetry monitors).
Pilot Testing
We trained 6 observers in the use of the data collection tool. Each observer practiced shadowing for more than 20 hours with the tool before collecting study data. During this pilot testing phase we optimized the layout of the tool to facilitate rapid documentation of hospitalist activities and multitasking. Interobserver reliability was confirmed by having 2 observers shadow the same hospitalist for a three hour time period. In all cases, the observers obtained an average interclass correlation coefficient of at least 0.95 with a 95% confidence interval of .85 to 1.0 prior to collecting study data.
Study Design
Data collection occurred between July and September of 2008. A total of 24 hospitalists were observed, each for 2 complete weekday shifts starting at 7 AM and ending between 5 PM and 7 PM. Of note, we only observed hospitalists who were directly caring for patients and not part of a teaching service. Each hospitalist was contacted about the project at least a week prior to any observations and informed consent was obtained. A single observer shadowed a single hospitalist continuously, trading off with a new observer every 3 hours to avoid fatigue. To minimize any observation effect our data collectors were instructed not to initiate and to minimize conversation with the hospitalists. At the end of the hospitalist's shift the following data were tallied: the number of patients in the hospitalist's care at the beginning of the day, the number of patients discharged during the day, and the number of admissions. Patient load was determined by adding the number of admissions to the number of patients at the beginning of the day.
Data Analysis
Minutes were tallied for each of the categories and subcategories. Data is reported as percentages of total duration of observed activities (ie, including multitasking) unless otherwise specified. To explore the effect of patient volume on hospitalist workflow we performed t‐tests comparing the number of minutes hospitalists spent per patient in various activities on days with below average patient volume as compared to those with above average volume. Additionally, we performed a Wilcoxon two‐samples test to check for a difference in length of shift between these 2 groups.
Results
A total of 24 hospitalists were shadowed for a total of approximately 494 hours. For 43 of these hours a hospitalist was observed performing 2 tasks simultaneously, bringing the total duration of observed activities to 537 hours with multitasking. The hospitalists were a mean 34 1.1 years of age and 12 (50%) were female. Twenty (83%) had completed residency 2 or more years prior to the study, 2 (8%) had a year of hospitalist experience since residency, and the remaining 2 (8%) had just completed residency. Sixteen (67%) hospitalists were Asian or Pacific Islanders, 6 (25%) were White, and 2 (8%) were Black. The hospitalists cared for an average of 13.2 0.6 patients per shift and an average shift lasted 10 hours and 19 minutes 52 minutes.
Table 1 lists the mean percentage of time hospitalists spent on the various activities. Subjects spent the most time (34.1%) interacting with the EMR. Communication and direct care were the next most frequent activities at 25.9% and 17.4% of each shift respectively, followed by professional development (6.5%), travel (6.2%), personal time (5.6%), other indirect care (3.9%), and waiting (0.4%). The 3 subcategories included in indirect care time accounted for about 64% of all recorded activities.
| Main Category | % Total Observed Activities | (95% CI)* | Subcategory | % Main Category | (95% CI)* |
|---|---|---|---|---|---|
| |||||
| EMR* | 34.1 | (32.435.9) | |||
| Writing | 58.4 | (55.761.0) | |||
| Orders | 20.2 | (18.521.9) | |||
| Reading/reviewing | 19.4 | (17.321.5) | |||
| Other | 2.1 | (1.82.5) | |||
| Communication* | 25.9 | (24.427.4) | |||
| Outgoing call | 36.9 | (33.640.2) | |||
| Face to face | 28.1 | (25.231.0) | |||
| Incoming call | 14.4 | (12.616.3) | |||
| Sending page | 8.6 | (7.79.4) | |||
| Rounds | 3.8 | (1.85.8) | |||
| Receiving page | 3.4 | (2.94.0) | |||
| E‐mail | 2.9 | (1.83.9) | |||
| Reviewing page | 1.8 | (1.32.3) | |||
| Fax | 0.1 | (0.00.2) | |||
| Direct care | 17.4 | (15.918.9) | |||
| Professional Development | 6.5 | (4.48.5) | |||
| Travel | 6.2 | (5.66.7) | |||
| Personal | 5.7 | (4.17.2) | |||
| Other indirect care* | 3.9 | (3.44.4) | |||
| Wait | 0.4 | (0.20.5) | |||
Of the nearly 4 hours (233 minutes) per shift hospitalists spent using the EMR, the majority (58.4%) was spent documenting (See Table 1). Placing orders and reading/reviewing notes were nearly equal at 20.2% and 19.4% respectively, and other EMR activities took 2.1% of EMR time. Over half of the time (54.1%) hospitalists spent documenting in the EMR system was dedicated to progress notes. The remainder of effort was expended on writing histories and physicals (15.3%), discharge instructions (14.7%), discharge summaries (7.9%), sign‐outs (6.8%), and performing medication reconciliation (1.4%). Of the time spent reading and reviewing documents on the EMR, most was spent reviewing lab results (45.4%) or notes from the current admission (40.4%). Reviewing imaging studies occupied 8.1%, and notes from past encounters accounted for 6.2% of this category's time.
Various modes of communication were used during the nearly three hours (176 minutes) per shift dedicated to communication. Phone calls took up approximately half of the hospitalists' communication time, with 36.8% spent on outgoing calls and 14.2% incoming calls. Face‐to‐face communication was the next most common mode, accounting for 28.2% of the total. Time spent sending pages (8.8%), receiving pages (3.4%), and reviewing pages (1.8%) consumed 14% of all communication time. E‐mail and fax were used sparingly, at 3.1% and 0.1% of communication time, respectively. Finally, meetings involving other hospital staff (interdisciplinary rounds) occupied 3.4% of communication time.
The amount of time hospitalists spent communicating with specific types of individuals is shown in Table 2. Hospitalists spent the most time communicating with other physicians (44.5%) and nurses (18.1%). They spent less time communicating with people from the remaining categories; utilization staff (5.7%), patients' family members (5.6%), case managers (4.2%), primary care physicians (3.4%), ancillary staff (3.1%), and pharmacists (0.6%). Communication with other individuals that did not fit in the above categories accounted for 8.8%, and 5.3% of communication could not be clearly categorized, generally because the hospitalist was communicating by phone or text page and ascertaining with whom would have required significant interruption.
| Subcategory | % Main Category | (95% CI)* |
|---|---|---|
| ||
| Inpatient physician | 44.5 | (41.747.2) |
| Nursing staff | 18.0 | (16.019.9) |
| Other | 8.5 | (6.810.2) |
| Family | 5.8 | (4.07.7) |
| Utilization staff | 5.8 | (4.67.0) |
| Uncategorized | 5.7 | (3.77.6) |
| PCC | 4.0 | (2.35.7) |
| PCP | 3.6 | (2.74.5) |
| Ancillary staff | 2.9 | (2.23.7) |
| Pharmacy | 1.4 | (0.82.0) |
We found that 16% of all recorded activities occurred when another activity was also ongoing. This means that hospitalists were performing more than one activity for approximately 54 minutes per day, or about 9% of the average 10.3‐hour shift. Instances of multitasking occurred frequently, but were usually brief; the hospitalists performed 2 activities simultaneously an average of 75 times per day, but 79% of these occurrences lasted less than 1 minute. Of the 86 hours of multitasking activities recorded, 41% was communication time and another 41% was EMR use. This means that a second activity was being performed during 19% of the time hospitalists spent using the EMR and 26% of the time they spent communicating. Of the time spent on critical documentation activities like writing prescriptions and orders, 24% was recorded during a multitasking event.
The amount of time hospitalists spent per patient on days with above average patient volume as compared to those with below average patient volume is shown in Table 3. Hospitalists with above average patient numbers spent about 3 minutes less per patient interacting with the EMR (a 17% reduction; P < 0.01), and about 2 minutes less per patient communicating (a 14% reduction; P < 0.01). The average length of shift increased by 12 minutes on days when patient volume was above average; P < 0.05.
| Subcategory | Minutes: Below Average Census | (95% CI)* | Minutes: Above Average Census | (95% CI)* | Pr > |t| |
|---|---|---|---|---|---|
| |||||
| EMR | 19.12 | (17.5020.75) | 15.83 | (14.1717.49) | <.001 |
| Communication | 14.28 | (12.8615.71) | 12.21 | (11.0713.36) | 0.002 |
| Direct care | 9.30 | (8.1810.42) | 8.59 | (7.279.91) | 0.293 |
| Professional development | 4.09 | (2.365.81) | 2.57 | (1.263.89) | 0.026 |
| Personal | 3.52 | (2.394.65) | 2.05 | (1.292.82) | 0.032 |
| Travel | 3.32 | (2.863.79) | 2.93 | (2.643.22) | 0.566 |
| Other indirect care | 2.37 | (1.902.84) | 1.65 | (1.321.98) | 0.292 |
| Wait | 0.25 | (0.080.41) | 0.14 | (0.040.25) | 0.881 |
Discussion
To our knowledge, this study represents the largest time‐motion evaluation of hospitalist activities ever undertaken, and provides the most detailed assessment of hospitalists' activities when caring for patients without residents or medical students. We confirmed that hospitalists spend the majority of their time (64%) undertaking care activities away from the patient's bedside, and are involved in direct patient care contact only 17% of their time, averaging about 9 minutes per patient. The hospitalists spent about a quarter (26%) of their time communicating with others. Compared to other physicians, this is an unusually large amount of time. For example, Hollingsworth et al.15 found that emergency medicine physicians spent just half as much (13%) of their time on communication with other providers and staff. This may reflect hospitalists' central role in the coordination of consulting specialists. The other significant portion of hospitalists' effort focuses on documentation in the electronic medical record, with 22% of their time required for CPOE and note writing, and overall a third of their time (34.1%) committed to interacting with the EMR.
In many respects, our results confirm the findings of O'Leary et al.'s previous work. While this current study more precisely identified how hospitalists spend their time, the general proportions of times were similar. Both studies found that indirect care activities occupied about two‐thirds of hospitalists' time (64% in this study and 69% in the previous study). We also documented similar portions of total time for direct patient care (17% vs. 18%) and communication (26% vs. 24%). Interestingly, with complete implementation of the EMR system, the percentage of time spent on documentation appeared to decrease. O'Leary et al. reported that documentation accounted for 26% of hospitalists' time, while the equivalent activities (writing in the EMR or paper prescriptions) accounted for only 21% in the current study. Unfortunately, the significance of this finding is difficult to determine given the concurrent changes in patient volumes and the varying extent of EMR implementation during the earlier study.
Over half of hospitalists' communication time is spent either making or receiving phone calls. This suggests that efforts to facilitate communication (eg, use of mobile phone systems and voicemail) might enhance efficiency. Additionally, we found that nearly half of our hospitalists' communication was with other physicians. Not surprisingly, our study confirmed that an important part of hospitalists' work involves organizing and collaborating with a variety of specialists to provide optimal care for their patients.
Hospitalists spent a great deal of time multitasking. We found that multitasking time accounted for nearly 1 of every 10 minutes during the day. The most common combination of activities involved communication that occurred during a period of EMR use. These interruptions could have serious consequences should physicians lose track of what they are doing while ordering procedures or prescribing medications.
We documented a smaller portion of multitasking time than O'Leary's earlier study. This could be due to differences in how multitasking was defined or recorded in the 2 studies. Our electronic data collection tool allowed us to capture rapid task switching and multitasking to the second, rather than to the minute, as was done with the stopwatch and paper form used in the previous study. This precision was important, especially considering that nearly 80% of the recorded instances of multitasking lasted less than 1 minute.
Our data also suggests that patient census has significant effects on certain parts of hospitalist workflow. Patient volume for our subjects ranged from 10 to 19 patients per shift, with a mean of 13.2 patients. The amount of time our hospitalists spent with each patient did not differ significantly between above and below average census days. However, EMR time per patient was significantly reduced on above average census days. Anecdotally, several of our hospitalists suggested that on high census days they put off less time‐sensitive documentation activities like discharge summaries until after they leave the hospital and complete the work from home or on the following day. Thus, our study likely underestimates the total additional effort on high volume days, but unfortunately we had no direct way of quantifying work performed outside of the hospital or on subsequent days. Communication time was also significantly reduced when patient volumes were above average, suggesting that hospitalists had less time to confer with consultants or answer the questions of nurses and patient family members.
Several factors limit the interpretation and application of our findings. First, our study was conducted at a single urban, academic hospital, which may limit its applicability for hospitalists working at community hospitals. Given that more than 90% of hospital care in the U.S. occurs in the community hospital setting, research to confirm these findings in such hospitals is needed.16 Nonclinical research assistants collected all of the data, so the results may be limited by the accuracy of their interpretations. However, our extensive training and documentation of their accuracy serves as a strength of the study. Finally, we focused exclusively on daytime, weekday activities of hospitalists. Notably, 3 hospitalists work through the night at our facility, and 24‐hour coverage by hospitalists is increasingly common across the U.S. We expect weekend and night shift workflow to be somewhat different from standard day shifts due to the decreased availability of other medical providers for testing, consults, and procedures. Future research should focus on potential differences in activities on nights and weekends compared to weekdays.
This extensive, comprehensive analysis of hospitalist activities and workflow provides a foundation for future research and confirms much of O'Leary et al.'s original study. O'Leary's simpler approach of observing smaller blocks of time rather than full shifts proved effective; the two methodologies produced markedly similar results. The current study also offers some insight into matters of efficiency. We found that hospitalists with higher patient loads cut down on EMR and communication time. We also confirmed that hospitalists spend the largest portion of their time interacting with the EMR. A more efficient EMR system could therefore be especially helpful in providing more time for direct patient care and the communication necessary to coordinate care. Given that most hospitals provide financial support for hospital medicine programs (an average of $95,000 per hospitalist full‐time equivalent (FTE)1), hospital administrators have a keen interest in understanding how hospitalists might be more efficient. For example, if hospitalists could evaluate and manage two additional patients each day by exchanging time focused on medical record documentation for direct care activities, the cost of a hospitalist drops substantively. By understanding current hospitalist activities, efforts at redesigning their workflow can be more successful at addressing issues related to scheduling, communication, and compensation, thus improving the overall model of practice as well as the quality of patient care.17
Acknowledgements
We thank Caitlin Lawes and Stephen Williams for help with data collection, and all the hospitalists who participated in this study.
- Society of Hospital Medicine. About SHM.2008; http://www.hospitalmedicine.org/AM/Template.cfm?Section=About_SHM. Accessed April 2010.
- , .The evolution and future of hospital medicine.Mt Sinai J Med.2008;75(5):418–423.
- , , .Rehospitalizations among patients in the Fee‐for‐Service Medicare Program.N Engl J Med.2009;360(14):1418–1428.
- , , , , , .Outcomes of care by hospitalists, general internists, and family physicians.[see comment].N Engl J Med.2007;357(25):2589–2600.
- , .The hospitalist movement 5 years later.JAMA.2002;287:487–494.
- , .The impact of hospitalists on the cost and quality of inpatient care in the United States: a research synthesis.Med Care Res Rev.2005;62:379–406.
- .Hospitalists and the hospital medicine system of care are good for patient care.Arch Intern Med.2008;168(12):1254–1256; discussion 1259–1260.
- , .Hospitalists in teaching hospitals: opportunities but not without danger.J Gen Intern Med.2004;19:392–393.
- , , .How hospitalists spend their time: insights on efficiency and safety.J Hosp Med.2006;1(2):88–93.
- , , , et al.Use of electronic health records in U.S. hospitals.N Engl J Med.2009;360.
- .Electronic medical records at a crossroads: impetus for change or missed opportunity?JAMA.2009;302(10):1109–1111.
- , , , , .Systematic review of time studies evaluating physicians in the hospital setting.J Hosp Med.2010;5(6):000–000.
- , , , .All in a day's work: an observational study to quantify how and with whom doctors on hospital wards spend their time.Med J Aust.2008;188(9):506–509.
- , , , .Emergency department workplace interruptions: are emergency physicians “interrupt‐driven” and “multitasking”?Acad Emerg Med.2000;7:1239–1243.
- , , , , .How do physicians and nurses spend their time in the emergency department?Ann Emerg Med.1998;31(1):87–91.
- , , , , .The ecology of medical care revisited.N Engl J Med.2001;344(26):2021–2025.
- , .Organizing a hospitalist program: an overview of fundamental concepts.Med Clin North Am.2002;86(4):887–909.
- Society of Hospital Medicine. About SHM.2008; http://www.hospitalmedicine.org/AM/Template.cfm?Section=About_SHM. Accessed April 2010.
- , .The evolution and future of hospital medicine.Mt Sinai J Med.2008;75(5):418–423.
- , , .Rehospitalizations among patients in the Fee‐for‐Service Medicare Program.N Engl J Med.2009;360(14):1418–1428.
- , , , , , .Outcomes of care by hospitalists, general internists, and family physicians.[see comment].N Engl J Med.2007;357(25):2589–2600.
- , .The hospitalist movement 5 years later.JAMA.2002;287:487–494.
- , .The impact of hospitalists on the cost and quality of inpatient care in the United States: a research synthesis.Med Care Res Rev.2005;62:379–406.
- .Hospitalists and the hospital medicine system of care are good for patient care.Arch Intern Med.2008;168(12):1254–1256; discussion 1259–1260.
- , .Hospitalists in teaching hospitals: opportunities but not without danger.J Gen Intern Med.2004;19:392–393.
- , , .How hospitalists spend their time: insights on efficiency and safety.J Hosp Med.2006;1(2):88–93.
- , , , et al.Use of electronic health records in U.S. hospitals.N Engl J Med.2009;360.
- .Electronic medical records at a crossroads: impetus for change or missed opportunity?JAMA.2009;302(10):1109–1111.
- , , , , .Systematic review of time studies evaluating physicians in the hospital setting.J Hosp Med.2010;5(6):000–000.
- , , , .All in a day's work: an observational study to quantify how and with whom doctors on hospital wards spend their time.Med J Aust.2008;188(9):506–509.
- , , , .Emergency department workplace interruptions: are emergency physicians “interrupt‐driven” and “multitasking”?Acad Emerg Med.2000;7:1239–1243.
- , , , , .How do physicians and nurses spend their time in the emergency department?Ann Emerg Med.1998;31(1):87–91.
- , , , , .The ecology of medical care revisited.N Engl J Med.2001;344(26):2021–2025.
- , .Organizing a hospitalist program: an overview of fundamental concepts.Med Clin North Am.2002;86(4):887–909.
Copyright © 2010 Society of Hospital Medicine
Community Hospitalist Time‐flow
In 2006, after introducing formal hospitalist programs at both an academic hospital and an affiliated community teaching hospital, we conducted a time study to gain insight into the effect of adopting a community model in an academic environment. This evaluation was conducted to identify similarities and differences between the 2 programs and to highlight opportunities for process and quality improvement. The hospitalist case mix index (CMI) was higher at the academic center (1.3) than at the community center (1.1). At both institutions documentation and most order entry were completed on paper, while lab and test results were electronically available. Both hospitalist programs were nonteaching services with day shifts staffed from 7:00 AM to 7:00 PM. At the academic center, a single hospitalist staffed the service for 7 days in a row with an average daily census of 10 patients. At the community hospital, 2 hospitalists carried the service, alternating days as the primary admitter. These hospitalists each carried an average census of 13 patients for 6 days in a row with staggered start/stop dates to ensure service continuity. The years of experience as a practicing hospitalist were similar between the 2 programs (median 4 years and range 1‐10 years for both programs); all hospitalists completed an internal medicine residency.
Methods
A paper‐based tool was used to collect data at 1‐minute intervals into 5 major categories validated through trial observation, content focus groups, and expert opinion. The 5 categories were Direct Patient Care, Indirect Patient Care, Travel, Personal, and Other (Table 1). Communication, a subcategory of Indirect Patient Care, was further classified by the job‐profession category and communication modality of the individual(s) interacting with the hospitalist. The tool allowed for more than 1 task category to be tracked at a time in order to capture multitasking. Three trained industrial engineers shadowed 9 different hospitalists during the day shifts, between 2 and 5 shifts per hospitalist, gathering approximately 355 hours of observational data over the 8 weeks of the study; 4 weeks at each hospital. Weekend and night shift data were not collected due to observer availability. Results for each setting were reported as the mean and standard deviation percentage of physician time observed for each task category. The results were also reported as the mean and standard deviation volume adjusted time per patient for each task category. The adjustment was made by dividing physician time by the number of patient encounters for that observation. Comparative analyses were calculated using a t‐test with a significance level of 0.05 and confidence intervals were reported at a 95% interval. Since this project was a quality improvement initiative analyzing the introduction of a new clinical service, Institutional Review Board (IRB) approval from our institution was not required.
| Category | Definition |
|---|---|
| |
| Direct patient care | Interviewing patient, examining patient, performing procedure on patient, family meeting |
| Indirect patient care | Subcategories listed below |
| Documentation | Writing rules, filling out forms, dictating |
| Orders | Writing paper orders in patient chart, entering orders in CPOE |
| Reviewing records | Looking up medical records in either electronic or paper chart |
| Medical references | Reviewing text books or using computer to consult UpToDate, do literature search, review Micromedix, or use personal digital assistant (PDA) to look up similar information |
| Other indirect patient care | Looking for paper chart, forms, procedural items or work space; waiting for page return, computer to lead, etc |
| Communication | Subcategories listed below |
| Nurse/tech | Nurse or medical technologist |
| Case manager | Case manager or social worker |
| Primary care physician | Talking with the patient's primary care physician |
| Inpatient physician | Specialist attendings, fellows, residents, medical students, other hospitalists |
| Other staff | Pharmacist, therapist, nurse practitioner, physician assistant, unit clerk |
| Phone | On the phone (attribute of Communication) |
| Emailing or text paging (attribute of Communication) | |
| In person | Face to face discussion (attribute of Communication) |
| Personal | Lunch, restroom, calls |
| Travel | Walking between units |
| Other | Meetings, administrative activities |
Results
Hospitalist time allocations at the 2 programs were comparatively similar (Table 2). At the academic center, hospitalists spent the majority of their time providing indirect patient care (69.8%, CI: 66.3‐73.3%), followed by direct patient care (13.1%, CI: 11.2‐14.9%), with the remaining time distributed among travel, personal, and other administrative duties. Likewise, the community hospitalists spent the majority of their time providing indirect patient care (68.7%, CI: 63.0‐74.5%), followed by direct patient care (16.7%, CI: 14.1‐19.4%), with travel, personal, and administrative duties completing the day. Additionally, the percent of time spent multitasking, defined as more than 1 task category observed at the same time, was strikingly similar between the 2 groups (Academic: 47.6% 16.5%, Community: 47.9% 9.8%).
| Academic (%) | Community (%) | P Value | |||
|---|---|---|---|---|---|
| Mean | Stdev | Mean | Stdev | ||
| Direct patient care | 13.8 | 4.1 | 17.2 | 6.3 | 0.032 |
| Indirect patient care | 68.2 | 8.0 | 68.0 | 13.2 | 0.756 |
| Documentation | 15.4 | 3.3% | 22.0 | 6.2 | 0.000 |
| Orders | 6.3 | 1.5 | 4.7 | 1.6 | 0.011 |
| Community Rev records | 21.3 | 5.0 | 21.7 | 6.2 | 0.000 |
| Medical refs | l.5 | 0.8 | 0.6 | 0.6 | 0.000 |
| Other indirect patient care | 2.0 | 1.3 | 2.6 | 1.6 | 0.210 |
| Communication | 21.7 | 4.2 | 16.5 | 4.7 | 0.000 |
| Nurse/tech | 5.4 | 2.0 | 5.3 | 2.8 | 0.895 |
| Care manager | 2.8 | 1.8 | 3.4 | 1.7 | 0.229 |
| Primary care physician | 1.1 | 1.2 | 1.1 | 1.1 | 0.818 |
| Inpatient physician | 12.5 | 3.9 | 6.7 | 2.6 | 0.000 |
| Other staff | 6.4 | 9.7 | 2.3 | 1.2 | 0.029 |
| Personal | 4.1 | 2.4 | 2.5 | 1.8 | 0.029 |
| Travel | 4.4 | 1.2 | 3.9 | 1.0 | 0.311 |
| Other | 9.5 | 8.9 | 8.4 | 17.4 | 0.850 |
While the difference in total percent of time spent on direct patient care was statistically significant (P = 0.03), the values converged after adjusting for the differences in average daily census (Table 3). On average, both the academic and community hospitalists spent approximately 10 minutes per patient per day interacting face to face with the patient and/or family (10.0 2.9 minutes and 10.1 3.6 minutes respectively, P = 0.89). However, after volume adjusting, other workflow differences became statistically significant, primarily in indirect patient care (Academic: 54.7 11.1 minutes/patient, Community: 41.9 9.8 minutes/patient, P 0.001). The academic hospitalists spent more time writing orders (4.6 1.3 minutes/patient vs. 2.8 1.1 minutes/patient, P 0.001), looking up and reviewing medical reference materials (1.1 0.6 minutes/patient vs. 0.3 0.4 minutes/patient, P 0.001), and communicating with other providers (20.5 7.7 min/patient vs. 11.1 3.1 min/patient, P 0.001) than their community hospitalist counterparts. Nearly half the time that the academic hospitalists spent communicating was dedicated to speaking with other physicians (9.2 3.5 minutes/patient); more than double that of the community hospitalists (4.0 1.6 minutes). Additionally, the academic hospitalists spent more time speaking with pharmacists (0.7 0.6 minutes vs. 0.1 0.2 minutes, P = 0.001).
| Academic | Community | P Value | |||
|---|---|---|---|---|---|
| Mean | Stdev | Mean | Stdev | ||
| Dir pt care | 10.0 | 2.9 | 10.1 | 3.6 | 0.890 |
| Indirect pt care | 50.1 | 8.4 | 40.5 | 9.8 | 0.000 |
| Documentation | 11.3 | 2.7 | 13.1 | 3.9 | 0.101 |
| Orders | 4.6 | 1.3 | 2.8 | 1.1 | 0.000 |
| Rev records | 15.6 | 4.0 | 13.0 | 4.8 | 0.069 |
| Medial refs | 1.1 | 0.6 | 0.3 | 0.4 | 0.000 |
| Other pt care | 1.5 | 1.0 | 1.5 | 1.0 | 0.833 |
| Communication | 16.0 | 3.8 | 9.7 | 2.8 | 0.000 |
| Nurse/tech | 3.9 | 1.4 | 3.1 | 1.6 | 0.102 |
| Case manager | 2.0 | 1.3 | 2.0 | 1.0 | 0.950 |
| Prim care physician | 0.8 | 0.9 | 0.7 | 0.7 | 0.547 |
| Inpatient physician | 9.2 | 3.5 | 4.0 | 1.6 | 0.000 |
| Other staff | 4.6 | 6.8 | 1.4 | 0.7 | 0.049 |
| Personal | 3.0 | 1.8 | 1.5 | 1.0 | 0.002 |
| Travel | 3.2 | 0.9 | 2.3 | 0.6 | 0.001 |
| Other | 6.8 | 6.0 | 4.4 | 8.4 | 0.306 |
Discussion
In 2006, O'Leary et al.1 demonstrated that academic hospitalists spend approximately 20% of their time engaged in direct patient care. Our results are consistent with these data and further expand these findings to a community setting. Although we found subtle workflow differences between the academic and community programs, their similarities were more striking than their differences. We suspect that these differences can be largely attributed to the higher CMI at the academic program as well as the greater complexity and additional communication hand‐offs inherent to this tertiary academic medical center. For example, at the academic medical center, medicine admissions were screened by a medicine triage resident and subsequently handed off to a hospitalist. In most cases, this system did not preclude the need to speak directly with the emergency department (ED) attending, adding a layer of complexity that did not exist in the community hospital. Finally, in contrast to the community hospital, there was little comanagement at the academic medical center, necessitating frequent transfers to and from medical and subspecialty services.
It appears that hospitalists, irrespective of their work environment, spend far more time documenting, communicating, and coordinating care than at the bedside. It is unclear whether this represents a desirable outcome of hospitalists' role as managers of complex hospital stays or inefficient and ineffective effort that should be mitigated through care delivery redesign. Further research to optimize hospital information management, streamline care processes and eliminate low value‐added effort is clearly needed.
Another notable finding of our study is that hospitalists spend roughly half of their time performing more than 1 work category at the same time deemed as multitasking.2 The prevalence and effects of multitasking are well‐characterized in emergency medicine and likely apply to hospitalists.3, 4 Fractured attention due to multitasking may hamper communication, jeopardize care handoffs, and increase risk for medical errors and litigation.46 While it is likely that multitasking is inherent to the practice of hospital medicine, it is unclear how this could be mitigated or better facilitated. Perhaps this could be done through structured communication and information management. This too merits further investigation.
Lastly, this study found that it takes approximately an hour of a hospitalist's time each day to manage 1 patient's care. This in and of itself, is very important from the standpoint of both billing and workload. In today's professional services fee model, there are a number of components that contribute to the level of service that a hospitalist can bill. One of those components is time, specifically the time spent counseling and/or coordinating care, which as this study suggests, dominates a hospitalist's workday. It is therefore critical that hospitalists accurately and consistently document the amount of time they spend with each patient and specifically describe the counseling and/or activities to coordinate care. Additionally, recognizing how much time is required for a hospitalist to care for a patient has important workload implications. If we assume that it takes approximately an hour per patient and a typical workday is around 11 hours after subtracting personal time, then it would be reasonable to expect that a single hospitalist should have, on average, 11 patient encounters per day. This number is, of course, completely dependent on organizational factors such as a specific hospital's support systems and the mix of admissions, follow‐ups, and discharges on that service.
Our study has several limitations. The time study occurred at 2 hospitals, in 1 mid‐sized Midwestern city, and the results may not be generalizable to other settings. However, the congruence of our findings with those of O'Leary et al.1 suggests that our results maintain external validity. Second, at the time of the study the 2 programs were relatively new and workflows were still evolving. Additionally, the academic and community hospitalist programs were under unified management and 2 of the surveyed hospitalists worked at both programs. This may have artificially homogenized the work patterns observed at both programs. Finally, observing hospitalist activities exclusively during the weekday daytime shifts has the potential to bias the results. However, the night and weekend duties and responsibilities of the 2 programs differed significantly, which would have made it very difficult to derive meaningful comparisons for those observations.
Conclusion
We found that hospitalists in both academic and community settings spend the majority of their time multitasking and engaged in indirect patient care. Further studies are necessary to determine the extent to which this is a necessary feature of the hospitalist care model and whether hospitalists should restructure their workflow to improve outcomes.
- , , .How hospitalists spend their time: Insights on efficiency and safety.J Hosp Med.2006;1:88–93.
- , , , .Emergency department workplace interruptions: Are emergency physicians “interrupt‐driven” and “multitasking”?Acad Emerg Med.2008;7:1239–1243.
- , , , .Work interrupted: a comparison of workplace interruptions in the emergency departments and primary care offices.Ann Emerg Med.2001;38:146–151.
- , , , , , .The multitasking clinician: Decision‐making and cognitive demand during and after team handoffs in emergency care.Int J Med Inform.2007;76:801–811.
- , , , , .Communication loads on clinical staff in the emergency department.Med J Aust.2002;176:415–418.
- , , .Why do people sue doctors? A study of patients and relatives taking legal action.Lancet.1994;343:1609–1613.
In 2006, after introducing formal hospitalist programs at both an academic hospital and an affiliated community teaching hospital, we conducted a time study to gain insight into the effect of adopting a community model in an academic environment. This evaluation was conducted to identify similarities and differences between the 2 programs and to highlight opportunities for process and quality improvement. The hospitalist case mix index (CMI) was higher at the academic center (1.3) than at the community center (1.1). At both institutions documentation and most order entry were completed on paper, while lab and test results were electronically available. Both hospitalist programs were nonteaching services with day shifts staffed from 7:00 AM to 7:00 PM. At the academic center, a single hospitalist staffed the service for 7 days in a row with an average daily census of 10 patients. At the community hospital, 2 hospitalists carried the service, alternating days as the primary admitter. These hospitalists each carried an average census of 13 patients for 6 days in a row with staggered start/stop dates to ensure service continuity. The years of experience as a practicing hospitalist were similar between the 2 programs (median 4 years and range 1‐10 years for both programs); all hospitalists completed an internal medicine residency.
Methods
A paper‐based tool was used to collect data at 1‐minute intervals into 5 major categories validated through trial observation, content focus groups, and expert opinion. The 5 categories were Direct Patient Care, Indirect Patient Care, Travel, Personal, and Other (Table 1). Communication, a subcategory of Indirect Patient Care, was further classified by the job‐profession category and communication modality of the individual(s) interacting with the hospitalist. The tool allowed for more than 1 task category to be tracked at a time in order to capture multitasking. Three trained industrial engineers shadowed 9 different hospitalists during the day shifts, between 2 and 5 shifts per hospitalist, gathering approximately 355 hours of observational data over the 8 weeks of the study; 4 weeks at each hospital. Weekend and night shift data were not collected due to observer availability. Results for each setting were reported as the mean and standard deviation percentage of physician time observed for each task category. The results were also reported as the mean and standard deviation volume adjusted time per patient for each task category. The adjustment was made by dividing physician time by the number of patient encounters for that observation. Comparative analyses were calculated using a t‐test with a significance level of 0.05 and confidence intervals were reported at a 95% interval. Since this project was a quality improvement initiative analyzing the introduction of a new clinical service, Institutional Review Board (IRB) approval from our institution was not required.
| Category | Definition |
|---|---|
| |
| Direct patient care | Interviewing patient, examining patient, performing procedure on patient, family meeting |
| Indirect patient care | Subcategories listed below |
| Documentation | Writing rules, filling out forms, dictating |
| Orders | Writing paper orders in patient chart, entering orders in CPOE |
| Reviewing records | Looking up medical records in either electronic or paper chart |
| Medical references | Reviewing text books or using computer to consult UpToDate, do literature search, review Micromedix, or use personal digital assistant (PDA) to look up similar information |
| Other indirect patient care | Looking for paper chart, forms, procedural items or work space; waiting for page return, computer to lead, etc |
| Communication | Subcategories listed below |
| Nurse/tech | Nurse or medical technologist |
| Case manager | Case manager or social worker |
| Primary care physician | Talking with the patient's primary care physician |
| Inpatient physician | Specialist attendings, fellows, residents, medical students, other hospitalists |
| Other staff | Pharmacist, therapist, nurse practitioner, physician assistant, unit clerk |
| Phone | On the phone (attribute of Communication) |
| Emailing or text paging (attribute of Communication) | |
| In person | Face to face discussion (attribute of Communication) |
| Personal | Lunch, restroom, calls |
| Travel | Walking between units |
| Other | Meetings, administrative activities |
Results
Hospitalist time allocations at the 2 programs were comparatively similar (Table 2). At the academic center, hospitalists spent the majority of their time providing indirect patient care (69.8%, CI: 66.3‐73.3%), followed by direct patient care (13.1%, CI: 11.2‐14.9%), with the remaining time distributed among travel, personal, and other administrative duties. Likewise, the community hospitalists spent the majority of their time providing indirect patient care (68.7%, CI: 63.0‐74.5%), followed by direct patient care (16.7%, CI: 14.1‐19.4%), with travel, personal, and administrative duties completing the day. Additionally, the percent of time spent multitasking, defined as more than 1 task category observed at the same time, was strikingly similar between the 2 groups (Academic: 47.6% 16.5%, Community: 47.9% 9.8%).
| Academic (%) | Community (%) | P Value | |||
|---|---|---|---|---|---|
| Mean | Stdev | Mean | Stdev | ||
| Direct patient care | 13.8 | 4.1 | 17.2 | 6.3 | 0.032 |
| Indirect patient care | 68.2 | 8.0 | 68.0 | 13.2 | 0.756 |
| Documentation | 15.4 | 3.3% | 22.0 | 6.2 | 0.000 |
| Orders | 6.3 | 1.5 | 4.7 | 1.6 | 0.011 |
| Community Rev records | 21.3 | 5.0 | 21.7 | 6.2 | 0.000 |
| Medical refs | l.5 | 0.8 | 0.6 | 0.6 | 0.000 |
| Other indirect patient care | 2.0 | 1.3 | 2.6 | 1.6 | 0.210 |
| Communication | 21.7 | 4.2 | 16.5 | 4.7 | 0.000 |
| Nurse/tech | 5.4 | 2.0 | 5.3 | 2.8 | 0.895 |
| Care manager | 2.8 | 1.8 | 3.4 | 1.7 | 0.229 |
| Primary care physician | 1.1 | 1.2 | 1.1 | 1.1 | 0.818 |
| Inpatient physician | 12.5 | 3.9 | 6.7 | 2.6 | 0.000 |
| Other staff | 6.4 | 9.7 | 2.3 | 1.2 | 0.029 |
| Personal | 4.1 | 2.4 | 2.5 | 1.8 | 0.029 |
| Travel | 4.4 | 1.2 | 3.9 | 1.0 | 0.311 |
| Other | 9.5 | 8.9 | 8.4 | 17.4 | 0.850 |
While the difference in total percent of time spent on direct patient care was statistically significant (P = 0.03), the values converged after adjusting for the differences in average daily census (Table 3). On average, both the academic and community hospitalists spent approximately 10 minutes per patient per day interacting face to face with the patient and/or family (10.0 2.9 minutes and 10.1 3.6 minutes respectively, P = 0.89). However, after volume adjusting, other workflow differences became statistically significant, primarily in indirect patient care (Academic: 54.7 11.1 minutes/patient, Community: 41.9 9.8 minutes/patient, P 0.001). The academic hospitalists spent more time writing orders (4.6 1.3 minutes/patient vs. 2.8 1.1 minutes/patient, P 0.001), looking up and reviewing medical reference materials (1.1 0.6 minutes/patient vs. 0.3 0.4 minutes/patient, P 0.001), and communicating with other providers (20.5 7.7 min/patient vs. 11.1 3.1 min/patient, P 0.001) than their community hospitalist counterparts. Nearly half the time that the academic hospitalists spent communicating was dedicated to speaking with other physicians (9.2 3.5 minutes/patient); more than double that of the community hospitalists (4.0 1.6 minutes). Additionally, the academic hospitalists spent more time speaking with pharmacists (0.7 0.6 minutes vs. 0.1 0.2 minutes, P = 0.001).
| Academic | Community | P Value | |||
|---|---|---|---|---|---|
| Mean | Stdev | Mean | Stdev | ||
| Dir pt care | 10.0 | 2.9 | 10.1 | 3.6 | 0.890 |
| Indirect pt care | 50.1 | 8.4 | 40.5 | 9.8 | 0.000 |
| Documentation | 11.3 | 2.7 | 13.1 | 3.9 | 0.101 |
| Orders | 4.6 | 1.3 | 2.8 | 1.1 | 0.000 |
| Rev records | 15.6 | 4.0 | 13.0 | 4.8 | 0.069 |
| Medial refs | 1.1 | 0.6 | 0.3 | 0.4 | 0.000 |
| Other pt care | 1.5 | 1.0 | 1.5 | 1.0 | 0.833 |
| Communication | 16.0 | 3.8 | 9.7 | 2.8 | 0.000 |
| Nurse/tech | 3.9 | 1.4 | 3.1 | 1.6 | 0.102 |
| Case manager | 2.0 | 1.3 | 2.0 | 1.0 | 0.950 |
| Prim care physician | 0.8 | 0.9 | 0.7 | 0.7 | 0.547 |
| Inpatient physician | 9.2 | 3.5 | 4.0 | 1.6 | 0.000 |
| Other staff | 4.6 | 6.8 | 1.4 | 0.7 | 0.049 |
| Personal | 3.0 | 1.8 | 1.5 | 1.0 | 0.002 |
| Travel | 3.2 | 0.9 | 2.3 | 0.6 | 0.001 |
| Other | 6.8 | 6.0 | 4.4 | 8.4 | 0.306 |
Discussion
In 2006, O'Leary et al.1 demonstrated that academic hospitalists spend approximately 20% of their time engaged in direct patient care. Our results are consistent with these data and further expand these findings to a community setting. Although we found subtle workflow differences between the academic and community programs, their similarities were more striking than their differences. We suspect that these differences can be largely attributed to the higher CMI at the academic program as well as the greater complexity and additional communication hand‐offs inherent to this tertiary academic medical center. For example, at the academic medical center, medicine admissions were screened by a medicine triage resident and subsequently handed off to a hospitalist. In most cases, this system did not preclude the need to speak directly with the emergency department (ED) attending, adding a layer of complexity that did not exist in the community hospital. Finally, in contrast to the community hospital, there was little comanagement at the academic medical center, necessitating frequent transfers to and from medical and subspecialty services.
It appears that hospitalists, irrespective of their work environment, spend far more time documenting, communicating, and coordinating care than at the bedside. It is unclear whether this represents a desirable outcome of hospitalists' role as managers of complex hospital stays or inefficient and ineffective effort that should be mitigated through care delivery redesign. Further research to optimize hospital information management, streamline care processes and eliminate low value‐added effort is clearly needed.
Another notable finding of our study is that hospitalists spend roughly half of their time performing more than 1 work category at the same time deemed as multitasking.2 The prevalence and effects of multitasking are well‐characterized in emergency medicine and likely apply to hospitalists.3, 4 Fractured attention due to multitasking may hamper communication, jeopardize care handoffs, and increase risk for medical errors and litigation.46 While it is likely that multitasking is inherent to the practice of hospital medicine, it is unclear how this could be mitigated or better facilitated. Perhaps this could be done through structured communication and information management. This too merits further investigation.
Lastly, this study found that it takes approximately an hour of a hospitalist's time each day to manage 1 patient's care. This in and of itself, is very important from the standpoint of both billing and workload. In today's professional services fee model, there are a number of components that contribute to the level of service that a hospitalist can bill. One of those components is time, specifically the time spent counseling and/or coordinating care, which as this study suggests, dominates a hospitalist's workday. It is therefore critical that hospitalists accurately and consistently document the amount of time they spend with each patient and specifically describe the counseling and/or activities to coordinate care. Additionally, recognizing how much time is required for a hospitalist to care for a patient has important workload implications. If we assume that it takes approximately an hour per patient and a typical workday is around 11 hours after subtracting personal time, then it would be reasonable to expect that a single hospitalist should have, on average, 11 patient encounters per day. This number is, of course, completely dependent on organizational factors such as a specific hospital's support systems and the mix of admissions, follow‐ups, and discharges on that service.
Our study has several limitations. The time study occurred at 2 hospitals, in 1 mid‐sized Midwestern city, and the results may not be generalizable to other settings. However, the congruence of our findings with those of O'Leary et al.1 suggests that our results maintain external validity. Second, at the time of the study the 2 programs were relatively new and workflows were still evolving. Additionally, the academic and community hospitalist programs were under unified management and 2 of the surveyed hospitalists worked at both programs. This may have artificially homogenized the work patterns observed at both programs. Finally, observing hospitalist activities exclusively during the weekday daytime shifts has the potential to bias the results. However, the night and weekend duties and responsibilities of the 2 programs differed significantly, which would have made it very difficult to derive meaningful comparisons for those observations.
Conclusion
We found that hospitalists in both academic and community settings spend the majority of their time multitasking and engaged in indirect patient care. Further studies are necessary to determine the extent to which this is a necessary feature of the hospitalist care model and whether hospitalists should restructure their workflow to improve outcomes.
In 2006, after introducing formal hospitalist programs at both an academic hospital and an affiliated community teaching hospital, we conducted a time study to gain insight into the effect of adopting a community model in an academic environment. This evaluation was conducted to identify similarities and differences between the 2 programs and to highlight opportunities for process and quality improvement. The hospitalist case mix index (CMI) was higher at the academic center (1.3) than at the community center (1.1). At both institutions documentation and most order entry were completed on paper, while lab and test results were electronically available. Both hospitalist programs were nonteaching services with day shifts staffed from 7:00 AM to 7:00 PM. At the academic center, a single hospitalist staffed the service for 7 days in a row with an average daily census of 10 patients. At the community hospital, 2 hospitalists carried the service, alternating days as the primary admitter. These hospitalists each carried an average census of 13 patients for 6 days in a row with staggered start/stop dates to ensure service continuity. The years of experience as a practicing hospitalist were similar between the 2 programs (median 4 years and range 1‐10 years for both programs); all hospitalists completed an internal medicine residency.
Methods
A paper‐based tool was used to collect data at 1‐minute intervals into 5 major categories validated through trial observation, content focus groups, and expert opinion. The 5 categories were Direct Patient Care, Indirect Patient Care, Travel, Personal, and Other (Table 1). Communication, a subcategory of Indirect Patient Care, was further classified by the job‐profession category and communication modality of the individual(s) interacting with the hospitalist. The tool allowed for more than 1 task category to be tracked at a time in order to capture multitasking. Three trained industrial engineers shadowed 9 different hospitalists during the day shifts, between 2 and 5 shifts per hospitalist, gathering approximately 355 hours of observational data over the 8 weeks of the study; 4 weeks at each hospital. Weekend and night shift data were not collected due to observer availability. Results for each setting were reported as the mean and standard deviation percentage of physician time observed for each task category. The results were also reported as the mean and standard deviation volume adjusted time per patient for each task category. The adjustment was made by dividing physician time by the number of patient encounters for that observation. Comparative analyses were calculated using a t‐test with a significance level of 0.05 and confidence intervals were reported at a 95% interval. Since this project was a quality improvement initiative analyzing the introduction of a new clinical service, Institutional Review Board (IRB) approval from our institution was not required.
| Category | Definition |
|---|---|
| |
| Direct patient care | Interviewing patient, examining patient, performing procedure on patient, family meeting |
| Indirect patient care | Subcategories listed below |
| Documentation | Writing rules, filling out forms, dictating |
| Orders | Writing paper orders in patient chart, entering orders in CPOE |
| Reviewing records | Looking up medical records in either electronic or paper chart |
| Medical references | Reviewing text books or using computer to consult UpToDate, do literature search, review Micromedix, or use personal digital assistant (PDA) to look up similar information |
| Other indirect patient care | Looking for paper chart, forms, procedural items or work space; waiting for page return, computer to lead, etc |
| Communication | Subcategories listed below |
| Nurse/tech | Nurse or medical technologist |
| Case manager | Case manager or social worker |
| Primary care physician | Talking with the patient's primary care physician |
| Inpatient physician | Specialist attendings, fellows, residents, medical students, other hospitalists |
| Other staff | Pharmacist, therapist, nurse practitioner, physician assistant, unit clerk |
| Phone | On the phone (attribute of Communication) |
| Emailing or text paging (attribute of Communication) | |
| In person | Face to face discussion (attribute of Communication) |
| Personal | Lunch, restroom, calls |
| Travel | Walking between units |
| Other | Meetings, administrative activities |
Results
Hospitalist time allocations at the 2 programs were comparatively similar (Table 2). At the academic center, hospitalists spent the majority of their time providing indirect patient care (69.8%, CI: 66.3‐73.3%), followed by direct patient care (13.1%, CI: 11.2‐14.9%), with the remaining time distributed among travel, personal, and other administrative duties. Likewise, the community hospitalists spent the majority of their time providing indirect patient care (68.7%, CI: 63.0‐74.5%), followed by direct patient care (16.7%, CI: 14.1‐19.4%), with travel, personal, and administrative duties completing the day. Additionally, the percent of time spent multitasking, defined as more than 1 task category observed at the same time, was strikingly similar between the 2 groups (Academic: 47.6% 16.5%, Community: 47.9% 9.8%).
| Academic (%) | Community (%) | P Value | |||
|---|---|---|---|---|---|
| Mean | Stdev | Mean | Stdev | ||
| Direct patient care | 13.8 | 4.1 | 17.2 | 6.3 | 0.032 |
| Indirect patient care | 68.2 | 8.0 | 68.0 | 13.2 | 0.756 |
| Documentation | 15.4 | 3.3% | 22.0 | 6.2 | 0.000 |
| Orders | 6.3 | 1.5 | 4.7 | 1.6 | 0.011 |
| Community Rev records | 21.3 | 5.0 | 21.7 | 6.2 | 0.000 |
| Medical refs | l.5 | 0.8 | 0.6 | 0.6 | 0.000 |
| Other indirect patient care | 2.0 | 1.3 | 2.6 | 1.6 | 0.210 |
| Communication | 21.7 | 4.2 | 16.5 | 4.7 | 0.000 |
| Nurse/tech | 5.4 | 2.0 | 5.3 | 2.8 | 0.895 |
| Care manager | 2.8 | 1.8 | 3.4 | 1.7 | 0.229 |
| Primary care physician | 1.1 | 1.2 | 1.1 | 1.1 | 0.818 |
| Inpatient physician | 12.5 | 3.9 | 6.7 | 2.6 | 0.000 |
| Other staff | 6.4 | 9.7 | 2.3 | 1.2 | 0.029 |
| Personal | 4.1 | 2.4 | 2.5 | 1.8 | 0.029 |
| Travel | 4.4 | 1.2 | 3.9 | 1.0 | 0.311 |
| Other | 9.5 | 8.9 | 8.4 | 17.4 | 0.850 |
While the difference in total percent of time spent on direct patient care was statistically significant (P = 0.03), the values converged after adjusting for the differences in average daily census (Table 3). On average, both the academic and community hospitalists spent approximately 10 minutes per patient per day interacting face to face with the patient and/or family (10.0 2.9 minutes and 10.1 3.6 minutes respectively, P = 0.89). However, after volume adjusting, other workflow differences became statistically significant, primarily in indirect patient care (Academic: 54.7 11.1 minutes/patient, Community: 41.9 9.8 minutes/patient, P 0.001). The academic hospitalists spent more time writing orders (4.6 1.3 minutes/patient vs. 2.8 1.1 minutes/patient, P 0.001), looking up and reviewing medical reference materials (1.1 0.6 minutes/patient vs. 0.3 0.4 minutes/patient, P 0.001), and communicating with other providers (20.5 7.7 min/patient vs. 11.1 3.1 min/patient, P 0.001) than their community hospitalist counterparts. Nearly half the time that the academic hospitalists spent communicating was dedicated to speaking with other physicians (9.2 3.5 minutes/patient); more than double that of the community hospitalists (4.0 1.6 minutes). Additionally, the academic hospitalists spent more time speaking with pharmacists (0.7 0.6 minutes vs. 0.1 0.2 minutes, P = 0.001).
| Academic | Community | P Value | |||
|---|---|---|---|---|---|
| Mean | Stdev | Mean | Stdev | ||
| Dir pt care | 10.0 | 2.9 | 10.1 | 3.6 | 0.890 |
| Indirect pt care | 50.1 | 8.4 | 40.5 | 9.8 | 0.000 |
| Documentation | 11.3 | 2.7 | 13.1 | 3.9 | 0.101 |
| Orders | 4.6 | 1.3 | 2.8 | 1.1 | 0.000 |
| Rev records | 15.6 | 4.0 | 13.0 | 4.8 | 0.069 |
| Medial refs | 1.1 | 0.6 | 0.3 | 0.4 | 0.000 |
| Other pt care | 1.5 | 1.0 | 1.5 | 1.0 | 0.833 |
| Communication | 16.0 | 3.8 | 9.7 | 2.8 | 0.000 |
| Nurse/tech | 3.9 | 1.4 | 3.1 | 1.6 | 0.102 |
| Case manager | 2.0 | 1.3 | 2.0 | 1.0 | 0.950 |
| Prim care physician | 0.8 | 0.9 | 0.7 | 0.7 | 0.547 |
| Inpatient physician | 9.2 | 3.5 | 4.0 | 1.6 | 0.000 |
| Other staff | 4.6 | 6.8 | 1.4 | 0.7 | 0.049 |
| Personal | 3.0 | 1.8 | 1.5 | 1.0 | 0.002 |
| Travel | 3.2 | 0.9 | 2.3 | 0.6 | 0.001 |
| Other | 6.8 | 6.0 | 4.4 | 8.4 | 0.306 |
Discussion
In 2006, O'Leary et al.1 demonstrated that academic hospitalists spend approximately 20% of their time engaged in direct patient care. Our results are consistent with these data and further expand these findings to a community setting. Although we found subtle workflow differences between the academic and community programs, their similarities were more striking than their differences. We suspect that these differences can be largely attributed to the higher CMI at the academic program as well as the greater complexity and additional communication hand‐offs inherent to this tertiary academic medical center. For example, at the academic medical center, medicine admissions were screened by a medicine triage resident and subsequently handed off to a hospitalist. In most cases, this system did not preclude the need to speak directly with the emergency department (ED) attending, adding a layer of complexity that did not exist in the community hospital. Finally, in contrast to the community hospital, there was little comanagement at the academic medical center, necessitating frequent transfers to and from medical and subspecialty services.
It appears that hospitalists, irrespective of their work environment, spend far more time documenting, communicating, and coordinating care than at the bedside. It is unclear whether this represents a desirable outcome of hospitalists' role as managers of complex hospital stays or inefficient and ineffective effort that should be mitigated through care delivery redesign. Further research to optimize hospital information management, streamline care processes and eliminate low value‐added effort is clearly needed.
Another notable finding of our study is that hospitalists spend roughly half of their time performing more than 1 work category at the same time deemed as multitasking.2 The prevalence and effects of multitasking are well‐characterized in emergency medicine and likely apply to hospitalists.3, 4 Fractured attention due to multitasking may hamper communication, jeopardize care handoffs, and increase risk for medical errors and litigation.46 While it is likely that multitasking is inherent to the practice of hospital medicine, it is unclear how this could be mitigated or better facilitated. Perhaps this could be done through structured communication and information management. This too merits further investigation.
Lastly, this study found that it takes approximately an hour of a hospitalist's time each day to manage 1 patient's care. This in and of itself, is very important from the standpoint of both billing and workload. In today's professional services fee model, there are a number of components that contribute to the level of service that a hospitalist can bill. One of those components is time, specifically the time spent counseling and/or coordinating care, which as this study suggests, dominates a hospitalist's workday. It is therefore critical that hospitalists accurately and consistently document the amount of time they spend with each patient and specifically describe the counseling and/or activities to coordinate care. Additionally, recognizing how much time is required for a hospitalist to care for a patient has important workload implications. If we assume that it takes approximately an hour per patient and a typical workday is around 11 hours after subtracting personal time, then it would be reasonable to expect that a single hospitalist should have, on average, 11 patient encounters per day. This number is, of course, completely dependent on organizational factors such as a specific hospital's support systems and the mix of admissions, follow‐ups, and discharges on that service.
Our study has several limitations. The time study occurred at 2 hospitals, in 1 mid‐sized Midwestern city, and the results may not be generalizable to other settings. However, the congruence of our findings with those of O'Leary et al.1 suggests that our results maintain external validity. Second, at the time of the study the 2 programs were relatively new and workflows were still evolving. Additionally, the academic and community hospitalist programs were under unified management and 2 of the surveyed hospitalists worked at both programs. This may have artificially homogenized the work patterns observed at both programs. Finally, observing hospitalist activities exclusively during the weekday daytime shifts has the potential to bias the results. However, the night and weekend duties and responsibilities of the 2 programs differed significantly, which would have made it very difficult to derive meaningful comparisons for those observations.
Conclusion
We found that hospitalists in both academic and community settings spend the majority of their time multitasking and engaged in indirect patient care. Further studies are necessary to determine the extent to which this is a necessary feature of the hospitalist care model and whether hospitalists should restructure their workflow to improve outcomes.
- , , .How hospitalists spend their time: Insights on efficiency and safety.J Hosp Med.2006;1:88–93.
- , , , .Emergency department workplace interruptions: Are emergency physicians “interrupt‐driven” and “multitasking”?Acad Emerg Med.2008;7:1239–1243.
- , , , .Work interrupted: a comparison of workplace interruptions in the emergency departments and primary care offices.Ann Emerg Med.2001;38:146–151.
- , , , , , .The multitasking clinician: Decision‐making and cognitive demand during and after team handoffs in emergency care.Int J Med Inform.2007;76:801–811.
- , , , , .Communication loads on clinical staff in the emergency department.Med J Aust.2002;176:415–418.
- , , .Why do people sue doctors? A study of patients and relatives taking legal action.Lancet.1994;343:1609–1613.
- , , .How hospitalists spend their time: Insights on efficiency and safety.J Hosp Med.2006;1:88–93.
- , , , .Emergency department workplace interruptions: Are emergency physicians “interrupt‐driven” and “multitasking”?Acad Emerg Med.2008;7:1239–1243.
- , , , .Work interrupted: a comparison of workplace interruptions in the emergency departments and primary care offices.Ann Emerg Med.2001;38:146–151.
- , , , , , .The multitasking clinician: Decision‐making and cognitive demand during and after team handoffs in emergency care.Int J Med Inform.2007;76:801–811.
- , , , , .Communication loads on clinical staff in the emergency department.Med J Aust.2002;176:415–418.
- , , .Why do people sue doctors? A study of patients and relatives taking legal action.Lancet.1994;343:1609–1613.
Unscripted
A 58‐year old man was admitted with generalized weakness and acute deep venous thrombosis (DVT). His past medical history included hypertension and polymyositis/dermatomyositis (PM/DM) with anti‐synthase syndrome, which had been diagnosed 16 months prior when his creatine kinase (CK) was greater than 12,000 U/L. At that time he also was found to have bilateral lower extremity DVT, and had been treated with warfarin for 1 year. 10 days previously, he had been discharged after a 4‐day hospitalization for a polymyositis flare which was treated with methylprednisolone at 60 mg daily for 5 days. He was discharged home with daily prednisone until this follow‐up a week later, where he reported weakness and bilateral edema. Lower extremity ultrasound demonstrated acute thrombus in the right common femoral vein.
This acute extensive DVT may be a consequence of recent hospitalization and a previously damaged venous system, or may reflect ongoing hypercoagulability from an unresolved condition, such as cancer. Bilateral lower extremity edema may suggest right‐sided heart failure due to progressive interstitial lung disease, which occurs in a subset of patients with PM/DM. Edema may alternatively reflect biventricular heart failure, or liver or kidney disease.
Generalized weakness offers little in the way of focused differential diagnosis until it is characterized as motor weakness (eg, attributed to progression of the myopathy), a dyspnea‐equivalent, or an overall sense of fatigue.
His medications included weekly methotrexate, monthly intravenous immunoglobulin (IVIG) infusions, tacrolimus, hydrochlorothiazide, and aerosolized pentamidine. He had been on varying doses of prednisone for 2 years and his present dose was 40 mg daily. He was allergic to sulfa. He was married and stopped smoking 30 years previously, and did not drink alcohol or use illicit drugs.
Various medication toxicities could account for his presentation. Methotrexate causes interstitial lung disease, and IVIG and tacrolimus may cause renal failure (and fluid overload). The heavy degree of immunosuppression renders him susceptible to a wide range of infections. Aerosolized pentamidine provides incomplete protection against Pneumocystis jirovecii, especially in the lung apices.
Evaluation of the status of his myositis with motor strength assessment is important. In addition associated rashes and signs of malignancy (eg, lymphadenopathy) and infection should be sought. Proximal motor weakness would suggest a myositis flare, although care must be given to exclude competing causes of myopathy, including infections, toxins, or endocrinopathies.
His temperature was 36.2C, pulse 103 beats per minute, blood pressure 156/83 mm Hg, and respiratory rate 18 breaths per minute. He had crackles at both lung bases, and 3+ pitting edema in both lower extremities. On neurological exam his motor strength was found to be diminished at 3/5 in the lower extremities and proximal upper extremities and 4/5 in the distal upper extremities. Reflexes were uniformly at 1+/4 and his cognition was intact. Examinations of his head, skin, heart, and abdomen were normal.
The absence of elevated jugular venous pressure argues against right heart failure. He is afebrile but that is minimally reassuring given the immunosuppression. There are no clues to suggest liver or kidney dysfunction. An unrecognized occlusion of the lower abdominal venous or lymphatic system such as upward extension of the DVT into the inferior vena cava (IVC) or a pelvic obstruction of the lower extremity lymphatic vessels could be considered. It appears that his distal weakness closely mirrors his proximal weakness in distinction to most myopathies which are predominantly proximal (with some exceptions, eg, inclusion body myositis).
The white blood cell count was 26,000/L with normal differential, hemoglobin 11.2 gm/dL, and platelet count was 191,000/L (at recent discharge these values were 23,000, 11.9, and 274,000, respectively). Chemistries were normal except for creatinine of 1.4 mg/dL (baseline 1.2), blood urea nitrogen was 42 mg/dL, albumin 2.6 gm/dL (normal, 3.55.0), and CK 3,710 U/L (20220), decreased from 6,943 U/L at recent discharge. Urine dipstick testing was positive for blood and protein; the urine sediment was unremarkable. Chest radiograph revealed normal lungs and heart.
The white blood cell count is quite elevated, perhaps more so than could be attributed to chronic steroid use, and again raises the concern of an undiagnosed infection. The presence of heme (and protein) in the urine without cells is consistent with pigment nephropathy from the recent rhabdomyolysis.
He was admitted to the hospital. Unfractionated heparin and warfarin were started. No changes were made to his immunosuppressive regimen. Blood cultures were negative after 48 hours. Transthoracic echocardiogram showed an ejection fraction of 60%, normal valves, and right ventricular systolic pressure of 32 mm Hg (normal, 1525 mmHg). On hospital day 3, his platelet count was 147,000/L, and on day 5, 101,000/L. His other laboratory values remained unchanged, and there were no new clinical developments.
A declining platelet count and extensive deep vein thrombosis suggest heparin‐induced thrombocytopenia and thrombosis (HITT), especially with the greater than 50% drop in the setting of IV heparin. His platelets have continued on a downward trajectory that was evident at admission and has progressed during this hospitalization. Assuming this is not due to laboratory error or artifact such as platelet clumping, this decline could have occurred if he was sensitized to heparin during the prior hospitalization, such as for DVT prophylaxis. It is increasingly recognized that HITT can manifest even after exposure to heparin is complete, ie, posthospitalization, and there can be an immediate drop in platelet counts if an unrecognized HITT‐mediated thrombosis is treated with IV heparin. Heparin should be discontinued in favor of a direct thrombin inhibitor and tests for heparin‐induced platelet antibodies (HIPA) and serotonin‐release assay (SRA) sent.
Antiphospholipid antibody syndrome (APLS) is associated with hypercoagulability and thrombocytopenia and is more frequent in patients with autoimmune disorders. The drug list should also be examined for associations with thrombocytopenia. The peripheral smear should be scrutinized and hemoglobin and creatinine followed to exclude thrombotic thrombocytopenic purpura‐hemolytic uremic syndrome (TTP‐HUS).
Heparin was stopped on day 5. Warfarin was continued with a therapeutic international normalized ratio (INR). Tests for antiplatelet factor 4 antibodies, HIPA, and SRA were negative. His weakness and edema improved although his CK remained between 2000 and 4000 U/L. On day 5 he developed mild hemoptysis, and a repeat chest radiograph demonstrated a new left hilar infiltrate. Computed tomography (CT) scan of the chest with contrast demonstrated a left lower lobe consolidation, scattered ground glass opacities in both lung bases, and no pulmonary embolus. He was treated with piperacillin/tazobactam and vancomycin. He remained afebrile. The same day, he erroneously received 125 mg (instead of 12.5 mg) of subcutaneous methotrexate. High‐dose leucovorin was administered on days 5 and 6.
The hemoptysis resolved after 2 days. From days 5 to 9, the platelet count dropped to 80,000/L and his hemoglobin gradually decreased to 7.3 g/dL. Anticoagulation was stopped, vitamin K administered, and an IVC filter placed. Two units of packed red blood cells (RBCs) were transfused.
In suspected HITT (which was not verified here), warfarin is typically withheld until the platelets have recovered and thrombin‐inhibitor anticoagulation has reached a steady state, to avoid the transient hypercoagulability of warfarin initiation.
The unusual time course and the 3 negative tests make HITT unlikely. The continued platelet decline after stopping heparin further supports another etiology. The excess methotrexate dosing complicates interpretation of his thrombocytopenia and anemia, which can be explained by mucosal bleeding, microangiopathic hemolytic anemia (MAHA) such as disseminated intravascular coagulation or TTP‐HUS, or autoimmunity (Evans syndrome). Bone marrow toxicity is also a major effect of methotrexate (in addition to elevation of liver enzymes and acute renal failure); however, there is typically a lag between administration and development of cytopenias. The antibiotics could also account for the ongoing (but not original) thrombocytopenia.
With the new pulmonary infiltrate, infections remain a primary concern and should be evaluated with sputum samples and perhaps bronchoscopy. Given the abnormal urine (even without cells), a pulmonary‐renal inflammatory processes should be considered also to explain the infiltrates and hemoptysis.
Haptoglobin was 20 mg/dL (normal, 37246). The direct antiglobulin test (DAT) was negative. Serum lactate dehydrogenase (LDH) was 1657 U/L (normal, 100220), with elevated LD4 and LD5 isoenzymes. Coagulation studies normalized after the administration of vitamin K. Anti‐nuclear antibody was positive at 8.7 (normal 1.5). Tests for antineutrophil cytoplasmic antibodies were negative. No sputum could be obtained. A pathologist reviewed the blood smear and reported neutrophilic leukocytosis without left shift, and thrombocytopenia with normal platelet morphology.
Low haptoglobin in the setting of an elevated LDH is highly suggestive of hemolysis, particularly the intravascular, microangiopathic varieties. Neutrophilia may reflect infection, a primary myeloproliferative process such as chronic myeloid leukemia, steroid use, or a reactive bone marrow in the setting of acute illness. The negative DAT and significant immunosuppressive regimen makes immune‐mediated hemolysis unlikely, although the history of autoimmunity and the small DAT false‐negative rate leaves Evans syndrome as an outside possibility. Medications such as tacrolimus (causing TTP) or IVIG (given the broad spectrum of antibodies it includes) are other plausible causes of the cytopenias.
At this point, I would analyze the red blood cell (RBC) morphology and check the reticulocyte count to help differentiate between hemolysis and a myelotoxin.
After transfusion, his hemoglobin remained at approximately 8.5 gm/dL and LDH remained elevated but stable. By day 12 the platelet count had fallen to 37,000/L.
With physical therapy the patient gained strength. Antibiotics were discontinued on day 12 and a follow‐up chest x‐ray demonstrated no significant disease. From days 10 to 12, his creatinine rose from 1.5 to 1.9 mg/dL, although urine output remained normal.
A hematologist observed minimal fragmentation of red cells on the blood smear. Commenting on the thrombocytopenia, anemia, and LDH isoenzymes (representative of skeletal/hepatic origin rather than hematologic), and clinical improvement after treatment of a presumed pneumonia, he felt that the continued thrombocytopenia was likely due to drug toxicity, and recommended observation, treatment of renal failure, and discontinuation of tacrolimus.
The failure to increase the hemoglobin after transfusion is consistent with (but not specific for) hemolysis. In conjunction with the progressive thrombocytopenia and persistently elevated LDH, TTP remains a consideration. While TTP can be diagnosed with minimal evidence of schistocytes, the duration of this illness, now spanning almost 2 weeks without significant end organ damagenamely more pronounced renal failure, confusion, or feveris unusual for TTP. Therefore, I think it is reasonable to withhold plasma exchange, although if the cytopenias or renal failure progress after the methotrexate, tacrolimus, and antibiotics are stopped, it may have to be undertaken empirically.
The pulmonary process remains undefined. Edema, pneumonitis (eg, aspiration), a modest pneumonia, or pulmonary hemorrhage could normalize on chest x‐ray after 1 week.
Renal ultrasound was normal. Urinalysis dipstick demonstrated 3+ blood, 3+ protein, and no nitrate or leukocyte esterase. The urine sediment showed only granular casts. Fractional excretion of sodium was 6.7%. Urine protein‐to‐creatinine ratio was 7.5, and urine myoglobin was elevated. Serum C3 and C4 complement levels and cryoglobulins were normal. Reticulocyte count was 8.5% (normal, 0.53.2).
There is significant evidence for intrinsic renal failure, starting with the elevated fractional excretion. Marked proteinuria suggests glomerular damage; nephrotic syndrome could provide an explanation for the recurrent DVT. The 3+ blood without RBCs and the markedly elevated urine myoglobin suggest pigment nephropathy from both myoglobinuria and hemoglobinuria. The elevated reticulocyte count further confirms the impression of hemolysis.
Nephrotic syndrome may result from a primary disease process, such as diabetes, systemic lupus erythematosus (SLE), or amyloidosis, for which there is no evidence to date, or as a consequence of indolent infection, malignancy, or drugs, all of which are reasonable possibilities.
The essential elements at this point include thrombocytopenia, kidney failure with proteinuria, and likely intravascular hemolysis. I would repeat the peripheral smear (looking for schistocytes) and discuss with the rheumatologist if any other medications could be discontinued.
A nephrology consultant diagnosed acute tubular necrosis (ATN) from a combination of insults (intravenous contrast, methotrexate, tacrolimus, and myoglobinuria). Over the next several days, his platelet count rose to approximately 60,000/L. The patient continued to generally feel better but the creatinine steadily increased to 4.9 mg/dL.
The hematologist's reassessment of the smear was unchanged with minimal RBC fragmentation noted. Over the next few days the hemoglobin, creatinine, and platelet count remained stable, and there were no fevers or other clinical developments. On day 21 a kidney biopsy specimen revealed evidence of thrombotic microangiopathy (TMA) and segmental glomerular necrosis, with negative immunofluorescent findings. In addition, the glomerular basement membranes were thickened and effacement of the epithelial foot processes was noted.
TTP (or other MAHA) with only a few schistocytes would be unusual at an advanced stage where organ damage has occurred, although the clinical presentation in drug‐induced variety is variable. TTP is also generally a fatal disease, so relative stability over 3 weeks without definitive therapy is atypical, unless prednisone has served as a temporizing measure. The atypical features raise the possibility of a mimic or variant of TTP such as undiagnosed cancer causing DIC or a medication (eg, tacrolimus)‐associated TTP syndrome.
At least 2 other conditions could account for the hemolysis, thrombocytopenia, and TMA. The positive ANA, glomerular disease, and cytopenias are compatible with SLE, although such progression on an intense immunosuppressive regimen would be unusual. The renal histology in a patient with an autoimmune diathesis warrants reconsideration of antiphospholipid antibody syndrome (APLS), especially in light of the earlier DVT.
Tests for antiphospholipid antibodies were negative. After multidisciplinary deliberation, a diagnosis of TMA due to tacrolimus‐associated TTP/HUS was made. Plasmapheresis was initiated and IVIG and steroids were continued. He had a complicated hospital course and required renal replacement therapy, but with pheresis, his platelet counts and hemoglobin began to recover and he was ultimately discharged in good condition. After he was discharged, testing for ADAMTS13 (a von Willebrand factor‐cleaving protease) activity was reported as 54% (normal, >66%)
Discussion
TMA in the microcirculation is the hallmark pathology of TTP‐HUS but is not specific for this disease. TMA is also seen in disseminated intravascular coagulation, sepsis, cancer, malignant hypertension, human immunodeficiency virus infection, autoimmune disorders, pregnancy‐related conditions, and in association with certain drugs.1 The first pharmacological agent to be associated with TMA was mitomycin in 1971, and since then other drug associations have been described, including antiplatelet medications such as ticlopidine and clopidogrel, antibiotics such as quinine and rifampin, interferon, and immunosuppressants such as cyclosporine and tacrolimus.2 Drug‐induced variants of TTP and TMA are challenging to diagnose because the timing of onset, clinical features, and patient factors (eg, receipt of immunosuppressants) may vary widely and mimic other conditions.2, 3 TMA is a rare complication of tacrolimus and is mostly seen in renal transplant patients at a frequency of 1%. In these patients, renal dysfunction is usually the first herald of TMA and TTP; evidence of hemolysis may be absent.3
The clinical diagnosis of TTP has historically been based on the presence of a classic pentad: MAHA, thrombocytopenia, neurological and renal abnormalities, and fever.4 Elevated levels of LDH and indirect bilirubin and the presence of fragmented RBCs and reticulocytes point toward active intravascular hemolysis. The DAT is usually negative. This textbook illness scriptthe template of a disease that is stored in a clinician's memoryis learned by physicians during training, but undergoes little modification given the limited exposure to a rare disease.
In modern practice, the pentad is rarely seen, and the characteristics of the end‐organ findings may vary substantially. For instance, while neurological symptoms including seizures, coma, and transient confusion occur in 90% of cases, renal involvement is seen in about 50% and fever in only 25% of patients.5 Although the presence of 2 or more schistocytes on the blood smear under 100 microscopy supports the diagnosis of MAHA, cases of TTP without significant schistocytosis have been reported.6
Furthermore, TTP is typically described as acute in onset, but in a quarter of patients the symptoms and signs last for weeks before diagnosis.4 This variability in disease presentation coupled with the high mortality of untreated disease has changed the diagnostic and treatment thresholds for TTP. Trials and expert opinion use MAHA, thrombocytopenia, and the exclusion of alternative causes as sufficient criteria to diagnose TTP and begin treatment.7 The measurement of a disintegrin and metalloproteinase with a thrombospondin type 1 motif, member 13 (ADAMTS13) activity (a von Willebrand factor‐cleaving protease) for diagnostic purposes remains controversial because assay techniques are not uniform and there is insufficient correlation between levels and clinical disease.810 For instance, the presence of severe ADAMTS 13 deficiency (ie, 5%) along with the presence of an ADAMTS13 inhibitor is considered to be very specific, but not sensitive, for the laboratory diagnosis of idiopathic TTP.11 In cohort studies, the frequency of severe deficiency among patients with idiopathic TTP ranged from 18% to 100%, and the presence of severe deficiency did not predict the development of acute episodes of TTP.9 In a registry study of 142 patients diagnosed with TTP, 81% of patients with secondary TTP (ie, not classified as idiopathic) had ADAMTS13 levels that were normal to subnormal (>25%), and patients with normal ADAMTS13 levels had a higher incidence of acute renal failure, similar to the findings in this patient.10
Untreated TTP has a mortality rate of greater than 90%, but with plasma exchange, survival has improved dramatically.4, 7 Glucocorticoids are often used in addition to plasma exchange, based on case series and reports.9 The addition of cryoprecipitate or fresh frozen plasma to plasmapheresis has not been shown to be beneficial, but rituximab, an anti CD‐20 monoclonal antibody, has shown promise in a small prospective study.12, 13
TTP is a rare disorder with a classic description but substantial variation in clinical presentation. In this case, the background autoimmune myopathy, immunosuppression, coincident acute DVT, unexplained infiltrates, complex medication regimen, and nephrotic range proteinuria (attributed to focal segmental glomerular sclerosis based on the limited evidence available from the biopsy) led the clinicians to ascribe the patient's thrombocytopenia and renal injury to more common conditions and created a challenging environment for the diagnosis of TTP. TTP is a complex disorder and the simplified understanding of the disease and its time course prevented a prompt match between the patient's clinical course and his diagnosis. The combination of a rare condition with inherent variability arising in the setting of medical complexity challenges the processes of problem representation and scripting the answer for even the most seasoned clinician.
The approach to clinical conundrums by an expert clinician is revealed through presentation of an actual patient's case in an approach typical of morning report. Similar to patient care, sequential pieces of information are provided to the clinician who is unfamiliar with the case. The focus is on the thought processes of both the clinical team caring for the patient and the discussant.
Key Teaching Points
-
The classically described pentad of TTP is seldom seen, and the findings of otherwise unexplained MAHA and thrombocytopenia should prompt consideration of TTP.
-
TTP may be acute and idiopathic, or be secondary to drugs, infections, or other conditions. Medication‐induced TTP may present with a wide range of clinical findings.
-
Therapeutic plasma exchange may be life‐saving in cases of TTP, and when appropriate, should be initiated promptly based on clinical suspicion and without waiting to perform tissue biopsy.
- , , .Thrombotic microangiopathies. In: Tischer CC, Brenner BM, eds.Renal Pathology.2nd ed.Philadelphia, PA:JB Lippincott;1994:1154–1184.
- , , .Drug‐induced thrombotic microangiopathy: incidence, prevention and management.Drug Saf.2001;24(7):491–501.
- , , , , .FK 506‐associated thrombotic microangiopathy: report of two cases and review of the literature.Transplantation.1999;67(4):539–544.
- , .Thrombotic Thrombocytopenic purpura: report of 16 cases and review of the literature.Medicine (Baltimore).1966;45:139–159.
- , , , .Thrombotic thrombocytopenic purpura; early and late responders.Am J Hematol.1997;54:102–107.
- .Atypical presentations of thrombotic thrombocytopenic purpura: a review.J Clin Apheresis.2009;24(1)47–52.
- , , , et al.Comparison of plasma exchange with plasma infusion in the treatment of thrombotic thrombocytopenic purpura.N Engl J Med.1991;325:393–397.
- , , , , , .The incidence of thrombotic thrombocytopenic purpura‐hemolytic uremic syndrome: all patients, idiopathic patients, and patients with severe ADAMTS13deficiency.J Thromb Haemost.2005;3:1432–1436.
- .Thrombotic thrombocytopenic purpura.N Engl J Med.2006;354:1927–1935.
- , , , et al.ADAMTS13 activity in thrombotic thrombocytopenic purpura‐hemolytic uremic syndrome: relation to presenting features and clinical outcomes in a prospective cohort of 142 patients.Blood.2003;102:60–68.
- , , .Thrombotic thrombocytopenic purpura.J Thromb Haemost.2005;3:1663–1675.
- , , , et al.Interventions for hemolytic uremic syndrome and thrombotic thrombocytopenic purpura: a systematic review of randomized controlled trials.Am J Kidney Dis.2009;53:259–272.
- , , , et al.:Efficiency of curative and prophylactic treatment with rituximab in ADAMTS13‐deficient TTP: A study of 11 cases.Blood.2005;105:1932–1937.
A 58‐year old man was admitted with generalized weakness and acute deep venous thrombosis (DVT). His past medical history included hypertension and polymyositis/dermatomyositis (PM/DM) with anti‐synthase syndrome, which had been diagnosed 16 months prior when his creatine kinase (CK) was greater than 12,000 U/L. At that time he also was found to have bilateral lower extremity DVT, and had been treated with warfarin for 1 year. 10 days previously, he had been discharged after a 4‐day hospitalization for a polymyositis flare which was treated with methylprednisolone at 60 mg daily for 5 days. He was discharged home with daily prednisone until this follow‐up a week later, where he reported weakness and bilateral edema. Lower extremity ultrasound demonstrated acute thrombus in the right common femoral vein.
This acute extensive DVT may be a consequence of recent hospitalization and a previously damaged venous system, or may reflect ongoing hypercoagulability from an unresolved condition, such as cancer. Bilateral lower extremity edema may suggest right‐sided heart failure due to progressive interstitial lung disease, which occurs in a subset of patients with PM/DM. Edema may alternatively reflect biventricular heart failure, or liver or kidney disease.
Generalized weakness offers little in the way of focused differential diagnosis until it is characterized as motor weakness (eg, attributed to progression of the myopathy), a dyspnea‐equivalent, or an overall sense of fatigue.
His medications included weekly methotrexate, monthly intravenous immunoglobulin (IVIG) infusions, tacrolimus, hydrochlorothiazide, and aerosolized pentamidine. He had been on varying doses of prednisone for 2 years and his present dose was 40 mg daily. He was allergic to sulfa. He was married and stopped smoking 30 years previously, and did not drink alcohol or use illicit drugs.
Various medication toxicities could account for his presentation. Methotrexate causes interstitial lung disease, and IVIG and tacrolimus may cause renal failure (and fluid overload). The heavy degree of immunosuppression renders him susceptible to a wide range of infections. Aerosolized pentamidine provides incomplete protection against Pneumocystis jirovecii, especially in the lung apices.
Evaluation of the status of his myositis with motor strength assessment is important. In addition associated rashes and signs of malignancy (eg, lymphadenopathy) and infection should be sought. Proximal motor weakness would suggest a myositis flare, although care must be given to exclude competing causes of myopathy, including infections, toxins, or endocrinopathies.
His temperature was 36.2C, pulse 103 beats per minute, blood pressure 156/83 mm Hg, and respiratory rate 18 breaths per minute. He had crackles at both lung bases, and 3+ pitting edema in both lower extremities. On neurological exam his motor strength was found to be diminished at 3/5 in the lower extremities and proximal upper extremities and 4/5 in the distal upper extremities. Reflexes were uniformly at 1+/4 and his cognition was intact. Examinations of his head, skin, heart, and abdomen were normal.
The absence of elevated jugular venous pressure argues against right heart failure. He is afebrile but that is minimally reassuring given the immunosuppression. There are no clues to suggest liver or kidney dysfunction. An unrecognized occlusion of the lower abdominal venous or lymphatic system such as upward extension of the DVT into the inferior vena cava (IVC) or a pelvic obstruction of the lower extremity lymphatic vessels could be considered. It appears that his distal weakness closely mirrors his proximal weakness in distinction to most myopathies which are predominantly proximal (with some exceptions, eg, inclusion body myositis).
The white blood cell count was 26,000/L with normal differential, hemoglobin 11.2 gm/dL, and platelet count was 191,000/L (at recent discharge these values were 23,000, 11.9, and 274,000, respectively). Chemistries were normal except for creatinine of 1.4 mg/dL (baseline 1.2), blood urea nitrogen was 42 mg/dL, albumin 2.6 gm/dL (normal, 3.55.0), and CK 3,710 U/L (20220), decreased from 6,943 U/L at recent discharge. Urine dipstick testing was positive for blood and protein; the urine sediment was unremarkable. Chest radiograph revealed normal lungs and heart.
The white blood cell count is quite elevated, perhaps more so than could be attributed to chronic steroid use, and again raises the concern of an undiagnosed infection. The presence of heme (and protein) in the urine without cells is consistent with pigment nephropathy from the recent rhabdomyolysis.
He was admitted to the hospital. Unfractionated heparin and warfarin were started. No changes were made to his immunosuppressive regimen. Blood cultures were negative after 48 hours. Transthoracic echocardiogram showed an ejection fraction of 60%, normal valves, and right ventricular systolic pressure of 32 mm Hg (normal, 1525 mmHg). On hospital day 3, his platelet count was 147,000/L, and on day 5, 101,000/L. His other laboratory values remained unchanged, and there were no new clinical developments.
A declining platelet count and extensive deep vein thrombosis suggest heparin‐induced thrombocytopenia and thrombosis (HITT), especially with the greater than 50% drop in the setting of IV heparin. His platelets have continued on a downward trajectory that was evident at admission and has progressed during this hospitalization. Assuming this is not due to laboratory error or artifact such as platelet clumping, this decline could have occurred if he was sensitized to heparin during the prior hospitalization, such as for DVT prophylaxis. It is increasingly recognized that HITT can manifest even after exposure to heparin is complete, ie, posthospitalization, and there can be an immediate drop in platelet counts if an unrecognized HITT‐mediated thrombosis is treated with IV heparin. Heparin should be discontinued in favor of a direct thrombin inhibitor and tests for heparin‐induced platelet antibodies (HIPA) and serotonin‐release assay (SRA) sent.
Antiphospholipid antibody syndrome (APLS) is associated with hypercoagulability and thrombocytopenia and is more frequent in patients with autoimmune disorders. The drug list should also be examined for associations with thrombocytopenia. The peripheral smear should be scrutinized and hemoglobin and creatinine followed to exclude thrombotic thrombocytopenic purpura‐hemolytic uremic syndrome (TTP‐HUS).
Heparin was stopped on day 5. Warfarin was continued with a therapeutic international normalized ratio (INR). Tests for antiplatelet factor 4 antibodies, HIPA, and SRA were negative. His weakness and edema improved although his CK remained between 2000 and 4000 U/L. On day 5 he developed mild hemoptysis, and a repeat chest radiograph demonstrated a new left hilar infiltrate. Computed tomography (CT) scan of the chest with contrast demonstrated a left lower lobe consolidation, scattered ground glass opacities in both lung bases, and no pulmonary embolus. He was treated with piperacillin/tazobactam and vancomycin. He remained afebrile. The same day, he erroneously received 125 mg (instead of 12.5 mg) of subcutaneous methotrexate. High‐dose leucovorin was administered on days 5 and 6.
The hemoptysis resolved after 2 days. From days 5 to 9, the platelet count dropped to 80,000/L and his hemoglobin gradually decreased to 7.3 g/dL. Anticoagulation was stopped, vitamin K administered, and an IVC filter placed. Two units of packed red blood cells (RBCs) were transfused.
In suspected HITT (which was not verified here), warfarin is typically withheld until the platelets have recovered and thrombin‐inhibitor anticoagulation has reached a steady state, to avoid the transient hypercoagulability of warfarin initiation.
The unusual time course and the 3 negative tests make HITT unlikely. The continued platelet decline after stopping heparin further supports another etiology. The excess methotrexate dosing complicates interpretation of his thrombocytopenia and anemia, which can be explained by mucosal bleeding, microangiopathic hemolytic anemia (MAHA) such as disseminated intravascular coagulation or TTP‐HUS, or autoimmunity (Evans syndrome). Bone marrow toxicity is also a major effect of methotrexate (in addition to elevation of liver enzymes and acute renal failure); however, there is typically a lag between administration and development of cytopenias. The antibiotics could also account for the ongoing (but not original) thrombocytopenia.
With the new pulmonary infiltrate, infections remain a primary concern and should be evaluated with sputum samples and perhaps bronchoscopy. Given the abnormal urine (even without cells), a pulmonary‐renal inflammatory processes should be considered also to explain the infiltrates and hemoptysis.
Haptoglobin was 20 mg/dL (normal, 37246). The direct antiglobulin test (DAT) was negative. Serum lactate dehydrogenase (LDH) was 1657 U/L (normal, 100220), with elevated LD4 and LD5 isoenzymes. Coagulation studies normalized after the administration of vitamin K. Anti‐nuclear antibody was positive at 8.7 (normal 1.5). Tests for antineutrophil cytoplasmic antibodies were negative. No sputum could be obtained. A pathologist reviewed the blood smear and reported neutrophilic leukocytosis without left shift, and thrombocytopenia with normal platelet morphology.
Low haptoglobin in the setting of an elevated LDH is highly suggestive of hemolysis, particularly the intravascular, microangiopathic varieties. Neutrophilia may reflect infection, a primary myeloproliferative process such as chronic myeloid leukemia, steroid use, or a reactive bone marrow in the setting of acute illness. The negative DAT and significant immunosuppressive regimen makes immune‐mediated hemolysis unlikely, although the history of autoimmunity and the small DAT false‐negative rate leaves Evans syndrome as an outside possibility. Medications such as tacrolimus (causing TTP) or IVIG (given the broad spectrum of antibodies it includes) are other plausible causes of the cytopenias.
At this point, I would analyze the red blood cell (RBC) morphology and check the reticulocyte count to help differentiate between hemolysis and a myelotoxin.
After transfusion, his hemoglobin remained at approximately 8.5 gm/dL and LDH remained elevated but stable. By day 12 the platelet count had fallen to 37,000/L.
With physical therapy the patient gained strength. Antibiotics were discontinued on day 12 and a follow‐up chest x‐ray demonstrated no significant disease. From days 10 to 12, his creatinine rose from 1.5 to 1.9 mg/dL, although urine output remained normal.
A hematologist observed minimal fragmentation of red cells on the blood smear. Commenting on the thrombocytopenia, anemia, and LDH isoenzymes (representative of skeletal/hepatic origin rather than hematologic), and clinical improvement after treatment of a presumed pneumonia, he felt that the continued thrombocytopenia was likely due to drug toxicity, and recommended observation, treatment of renal failure, and discontinuation of tacrolimus.
The failure to increase the hemoglobin after transfusion is consistent with (but not specific for) hemolysis. In conjunction with the progressive thrombocytopenia and persistently elevated LDH, TTP remains a consideration. While TTP can be diagnosed with minimal evidence of schistocytes, the duration of this illness, now spanning almost 2 weeks without significant end organ damagenamely more pronounced renal failure, confusion, or feveris unusual for TTP. Therefore, I think it is reasonable to withhold plasma exchange, although if the cytopenias or renal failure progress after the methotrexate, tacrolimus, and antibiotics are stopped, it may have to be undertaken empirically.
The pulmonary process remains undefined. Edema, pneumonitis (eg, aspiration), a modest pneumonia, or pulmonary hemorrhage could normalize on chest x‐ray after 1 week.
Renal ultrasound was normal. Urinalysis dipstick demonstrated 3+ blood, 3+ protein, and no nitrate or leukocyte esterase. The urine sediment showed only granular casts. Fractional excretion of sodium was 6.7%. Urine protein‐to‐creatinine ratio was 7.5, and urine myoglobin was elevated. Serum C3 and C4 complement levels and cryoglobulins were normal. Reticulocyte count was 8.5% (normal, 0.53.2).
There is significant evidence for intrinsic renal failure, starting with the elevated fractional excretion. Marked proteinuria suggests glomerular damage; nephrotic syndrome could provide an explanation for the recurrent DVT. The 3+ blood without RBCs and the markedly elevated urine myoglobin suggest pigment nephropathy from both myoglobinuria and hemoglobinuria. The elevated reticulocyte count further confirms the impression of hemolysis.
Nephrotic syndrome may result from a primary disease process, such as diabetes, systemic lupus erythematosus (SLE), or amyloidosis, for which there is no evidence to date, or as a consequence of indolent infection, malignancy, or drugs, all of which are reasonable possibilities.
The essential elements at this point include thrombocytopenia, kidney failure with proteinuria, and likely intravascular hemolysis. I would repeat the peripheral smear (looking for schistocytes) and discuss with the rheumatologist if any other medications could be discontinued.
A nephrology consultant diagnosed acute tubular necrosis (ATN) from a combination of insults (intravenous contrast, methotrexate, tacrolimus, and myoglobinuria). Over the next several days, his platelet count rose to approximately 60,000/L. The patient continued to generally feel better but the creatinine steadily increased to 4.9 mg/dL.
The hematologist's reassessment of the smear was unchanged with minimal RBC fragmentation noted. Over the next few days the hemoglobin, creatinine, and platelet count remained stable, and there were no fevers or other clinical developments. On day 21 a kidney biopsy specimen revealed evidence of thrombotic microangiopathy (TMA) and segmental glomerular necrosis, with negative immunofluorescent findings. In addition, the glomerular basement membranes were thickened and effacement of the epithelial foot processes was noted.
TTP (or other MAHA) with only a few schistocytes would be unusual at an advanced stage where organ damage has occurred, although the clinical presentation in drug‐induced variety is variable. TTP is also generally a fatal disease, so relative stability over 3 weeks without definitive therapy is atypical, unless prednisone has served as a temporizing measure. The atypical features raise the possibility of a mimic or variant of TTP such as undiagnosed cancer causing DIC or a medication (eg, tacrolimus)‐associated TTP syndrome.
At least 2 other conditions could account for the hemolysis, thrombocytopenia, and TMA. The positive ANA, glomerular disease, and cytopenias are compatible with SLE, although such progression on an intense immunosuppressive regimen would be unusual. The renal histology in a patient with an autoimmune diathesis warrants reconsideration of antiphospholipid antibody syndrome (APLS), especially in light of the earlier DVT.
Tests for antiphospholipid antibodies were negative. After multidisciplinary deliberation, a diagnosis of TMA due to tacrolimus‐associated TTP/HUS was made. Plasmapheresis was initiated and IVIG and steroids were continued. He had a complicated hospital course and required renal replacement therapy, but with pheresis, his platelet counts and hemoglobin began to recover and he was ultimately discharged in good condition. After he was discharged, testing for ADAMTS13 (a von Willebrand factor‐cleaving protease) activity was reported as 54% (normal, >66%)
Discussion
TMA in the microcirculation is the hallmark pathology of TTP‐HUS but is not specific for this disease. TMA is also seen in disseminated intravascular coagulation, sepsis, cancer, malignant hypertension, human immunodeficiency virus infection, autoimmune disorders, pregnancy‐related conditions, and in association with certain drugs.1 The first pharmacological agent to be associated with TMA was mitomycin in 1971, and since then other drug associations have been described, including antiplatelet medications such as ticlopidine and clopidogrel, antibiotics such as quinine and rifampin, interferon, and immunosuppressants such as cyclosporine and tacrolimus.2 Drug‐induced variants of TTP and TMA are challenging to diagnose because the timing of onset, clinical features, and patient factors (eg, receipt of immunosuppressants) may vary widely and mimic other conditions.2, 3 TMA is a rare complication of tacrolimus and is mostly seen in renal transplant patients at a frequency of 1%. In these patients, renal dysfunction is usually the first herald of TMA and TTP; evidence of hemolysis may be absent.3
The clinical diagnosis of TTP has historically been based on the presence of a classic pentad: MAHA, thrombocytopenia, neurological and renal abnormalities, and fever.4 Elevated levels of LDH and indirect bilirubin and the presence of fragmented RBCs and reticulocytes point toward active intravascular hemolysis. The DAT is usually negative. This textbook illness scriptthe template of a disease that is stored in a clinician's memoryis learned by physicians during training, but undergoes little modification given the limited exposure to a rare disease.
In modern practice, the pentad is rarely seen, and the characteristics of the end‐organ findings may vary substantially. For instance, while neurological symptoms including seizures, coma, and transient confusion occur in 90% of cases, renal involvement is seen in about 50% and fever in only 25% of patients.5 Although the presence of 2 or more schistocytes on the blood smear under 100 microscopy supports the diagnosis of MAHA, cases of TTP without significant schistocytosis have been reported.6
Furthermore, TTP is typically described as acute in onset, but in a quarter of patients the symptoms and signs last for weeks before diagnosis.4 This variability in disease presentation coupled with the high mortality of untreated disease has changed the diagnostic and treatment thresholds for TTP. Trials and expert opinion use MAHA, thrombocytopenia, and the exclusion of alternative causes as sufficient criteria to diagnose TTP and begin treatment.7 The measurement of a disintegrin and metalloproteinase with a thrombospondin type 1 motif, member 13 (ADAMTS13) activity (a von Willebrand factor‐cleaving protease) for diagnostic purposes remains controversial because assay techniques are not uniform and there is insufficient correlation between levels and clinical disease.810 For instance, the presence of severe ADAMTS 13 deficiency (ie, 5%) along with the presence of an ADAMTS13 inhibitor is considered to be very specific, but not sensitive, for the laboratory diagnosis of idiopathic TTP.11 In cohort studies, the frequency of severe deficiency among patients with idiopathic TTP ranged from 18% to 100%, and the presence of severe deficiency did not predict the development of acute episodes of TTP.9 In a registry study of 142 patients diagnosed with TTP, 81% of patients with secondary TTP (ie, not classified as idiopathic) had ADAMTS13 levels that were normal to subnormal (>25%), and patients with normal ADAMTS13 levels had a higher incidence of acute renal failure, similar to the findings in this patient.10
Untreated TTP has a mortality rate of greater than 90%, but with plasma exchange, survival has improved dramatically.4, 7 Glucocorticoids are often used in addition to plasma exchange, based on case series and reports.9 The addition of cryoprecipitate or fresh frozen plasma to plasmapheresis has not been shown to be beneficial, but rituximab, an anti CD‐20 monoclonal antibody, has shown promise in a small prospective study.12, 13
TTP is a rare disorder with a classic description but substantial variation in clinical presentation. In this case, the background autoimmune myopathy, immunosuppression, coincident acute DVT, unexplained infiltrates, complex medication regimen, and nephrotic range proteinuria (attributed to focal segmental glomerular sclerosis based on the limited evidence available from the biopsy) led the clinicians to ascribe the patient's thrombocytopenia and renal injury to more common conditions and created a challenging environment for the diagnosis of TTP. TTP is a complex disorder and the simplified understanding of the disease and its time course prevented a prompt match between the patient's clinical course and his diagnosis. The combination of a rare condition with inherent variability arising in the setting of medical complexity challenges the processes of problem representation and scripting the answer for even the most seasoned clinician.
The approach to clinical conundrums by an expert clinician is revealed through presentation of an actual patient's case in an approach typical of morning report. Similar to patient care, sequential pieces of information are provided to the clinician who is unfamiliar with the case. The focus is on the thought processes of both the clinical team caring for the patient and the discussant.
Key Teaching Points
-
The classically described pentad of TTP is seldom seen, and the findings of otherwise unexplained MAHA and thrombocytopenia should prompt consideration of TTP.
-
TTP may be acute and idiopathic, or be secondary to drugs, infections, or other conditions. Medication‐induced TTP may present with a wide range of clinical findings.
-
Therapeutic plasma exchange may be life‐saving in cases of TTP, and when appropriate, should be initiated promptly based on clinical suspicion and without waiting to perform tissue biopsy.
A 58‐year old man was admitted with generalized weakness and acute deep venous thrombosis (DVT). His past medical history included hypertension and polymyositis/dermatomyositis (PM/DM) with anti‐synthase syndrome, which had been diagnosed 16 months prior when his creatine kinase (CK) was greater than 12,000 U/L. At that time he also was found to have bilateral lower extremity DVT, and had been treated with warfarin for 1 year. 10 days previously, he had been discharged after a 4‐day hospitalization for a polymyositis flare which was treated with methylprednisolone at 60 mg daily for 5 days. He was discharged home with daily prednisone until this follow‐up a week later, where he reported weakness and bilateral edema. Lower extremity ultrasound demonstrated acute thrombus in the right common femoral vein.
This acute extensive DVT may be a consequence of recent hospitalization and a previously damaged venous system, or may reflect ongoing hypercoagulability from an unresolved condition, such as cancer. Bilateral lower extremity edema may suggest right‐sided heart failure due to progressive interstitial lung disease, which occurs in a subset of patients with PM/DM. Edema may alternatively reflect biventricular heart failure, or liver or kidney disease.
Generalized weakness offers little in the way of focused differential diagnosis until it is characterized as motor weakness (eg, attributed to progression of the myopathy), a dyspnea‐equivalent, or an overall sense of fatigue.
His medications included weekly methotrexate, monthly intravenous immunoglobulin (IVIG) infusions, tacrolimus, hydrochlorothiazide, and aerosolized pentamidine. He had been on varying doses of prednisone for 2 years and his present dose was 40 mg daily. He was allergic to sulfa. He was married and stopped smoking 30 years previously, and did not drink alcohol or use illicit drugs.
Various medication toxicities could account for his presentation. Methotrexate causes interstitial lung disease, and IVIG and tacrolimus may cause renal failure (and fluid overload). The heavy degree of immunosuppression renders him susceptible to a wide range of infections. Aerosolized pentamidine provides incomplete protection against Pneumocystis jirovecii, especially in the lung apices.
Evaluation of the status of his myositis with motor strength assessment is important. In addition associated rashes and signs of malignancy (eg, lymphadenopathy) and infection should be sought. Proximal motor weakness would suggest a myositis flare, although care must be given to exclude competing causes of myopathy, including infections, toxins, or endocrinopathies.
His temperature was 36.2C, pulse 103 beats per minute, blood pressure 156/83 mm Hg, and respiratory rate 18 breaths per minute. He had crackles at both lung bases, and 3+ pitting edema in both lower extremities. On neurological exam his motor strength was found to be diminished at 3/5 in the lower extremities and proximal upper extremities and 4/5 in the distal upper extremities. Reflexes were uniformly at 1+/4 and his cognition was intact. Examinations of his head, skin, heart, and abdomen were normal.
The absence of elevated jugular venous pressure argues against right heart failure. He is afebrile but that is minimally reassuring given the immunosuppression. There are no clues to suggest liver or kidney dysfunction. An unrecognized occlusion of the lower abdominal venous or lymphatic system such as upward extension of the DVT into the inferior vena cava (IVC) or a pelvic obstruction of the lower extremity lymphatic vessels could be considered. It appears that his distal weakness closely mirrors his proximal weakness in distinction to most myopathies which are predominantly proximal (with some exceptions, eg, inclusion body myositis).
The white blood cell count was 26,000/L with normal differential, hemoglobin 11.2 gm/dL, and platelet count was 191,000/L (at recent discharge these values were 23,000, 11.9, and 274,000, respectively). Chemistries were normal except for creatinine of 1.4 mg/dL (baseline 1.2), blood urea nitrogen was 42 mg/dL, albumin 2.6 gm/dL (normal, 3.55.0), and CK 3,710 U/L (20220), decreased from 6,943 U/L at recent discharge. Urine dipstick testing was positive for blood and protein; the urine sediment was unremarkable. Chest radiograph revealed normal lungs and heart.
The white blood cell count is quite elevated, perhaps more so than could be attributed to chronic steroid use, and again raises the concern of an undiagnosed infection. The presence of heme (and protein) in the urine without cells is consistent with pigment nephropathy from the recent rhabdomyolysis.
He was admitted to the hospital. Unfractionated heparin and warfarin were started. No changes were made to his immunosuppressive regimen. Blood cultures were negative after 48 hours. Transthoracic echocardiogram showed an ejection fraction of 60%, normal valves, and right ventricular systolic pressure of 32 mm Hg (normal, 1525 mmHg). On hospital day 3, his platelet count was 147,000/L, and on day 5, 101,000/L. His other laboratory values remained unchanged, and there were no new clinical developments.
A declining platelet count and extensive deep vein thrombosis suggest heparin‐induced thrombocytopenia and thrombosis (HITT), especially with the greater than 50% drop in the setting of IV heparin. His platelets have continued on a downward trajectory that was evident at admission and has progressed during this hospitalization. Assuming this is not due to laboratory error or artifact such as platelet clumping, this decline could have occurred if he was sensitized to heparin during the prior hospitalization, such as for DVT prophylaxis. It is increasingly recognized that HITT can manifest even after exposure to heparin is complete, ie, posthospitalization, and there can be an immediate drop in platelet counts if an unrecognized HITT‐mediated thrombosis is treated with IV heparin. Heparin should be discontinued in favor of a direct thrombin inhibitor and tests for heparin‐induced platelet antibodies (HIPA) and serotonin‐release assay (SRA) sent.
Antiphospholipid antibody syndrome (APLS) is associated with hypercoagulability and thrombocytopenia and is more frequent in patients with autoimmune disorders. The drug list should also be examined for associations with thrombocytopenia. The peripheral smear should be scrutinized and hemoglobin and creatinine followed to exclude thrombotic thrombocytopenic purpura‐hemolytic uremic syndrome (TTP‐HUS).
Heparin was stopped on day 5. Warfarin was continued with a therapeutic international normalized ratio (INR). Tests for antiplatelet factor 4 antibodies, HIPA, and SRA were negative. His weakness and edema improved although his CK remained between 2000 and 4000 U/L. On day 5 he developed mild hemoptysis, and a repeat chest radiograph demonstrated a new left hilar infiltrate. Computed tomography (CT) scan of the chest with contrast demonstrated a left lower lobe consolidation, scattered ground glass opacities in both lung bases, and no pulmonary embolus. He was treated with piperacillin/tazobactam and vancomycin. He remained afebrile. The same day, he erroneously received 125 mg (instead of 12.5 mg) of subcutaneous methotrexate. High‐dose leucovorin was administered on days 5 and 6.
The hemoptysis resolved after 2 days. From days 5 to 9, the platelet count dropped to 80,000/L and his hemoglobin gradually decreased to 7.3 g/dL. Anticoagulation was stopped, vitamin K administered, and an IVC filter placed. Two units of packed red blood cells (RBCs) were transfused.
In suspected HITT (which was not verified here), warfarin is typically withheld until the platelets have recovered and thrombin‐inhibitor anticoagulation has reached a steady state, to avoid the transient hypercoagulability of warfarin initiation.
The unusual time course and the 3 negative tests make HITT unlikely. The continued platelet decline after stopping heparin further supports another etiology. The excess methotrexate dosing complicates interpretation of his thrombocytopenia and anemia, which can be explained by mucosal bleeding, microangiopathic hemolytic anemia (MAHA) such as disseminated intravascular coagulation or TTP‐HUS, or autoimmunity (Evans syndrome). Bone marrow toxicity is also a major effect of methotrexate (in addition to elevation of liver enzymes and acute renal failure); however, there is typically a lag between administration and development of cytopenias. The antibiotics could also account for the ongoing (but not original) thrombocytopenia.
With the new pulmonary infiltrate, infections remain a primary concern and should be evaluated with sputum samples and perhaps bronchoscopy. Given the abnormal urine (even without cells), a pulmonary‐renal inflammatory processes should be considered also to explain the infiltrates and hemoptysis.
Haptoglobin was 20 mg/dL (normal, 37246). The direct antiglobulin test (DAT) was negative. Serum lactate dehydrogenase (LDH) was 1657 U/L (normal, 100220), with elevated LD4 and LD5 isoenzymes. Coagulation studies normalized after the administration of vitamin K. Anti‐nuclear antibody was positive at 8.7 (normal 1.5). Tests for antineutrophil cytoplasmic antibodies were negative. No sputum could be obtained. A pathologist reviewed the blood smear and reported neutrophilic leukocytosis without left shift, and thrombocytopenia with normal platelet morphology.
Low haptoglobin in the setting of an elevated LDH is highly suggestive of hemolysis, particularly the intravascular, microangiopathic varieties. Neutrophilia may reflect infection, a primary myeloproliferative process such as chronic myeloid leukemia, steroid use, or a reactive bone marrow in the setting of acute illness. The negative DAT and significant immunosuppressive regimen makes immune‐mediated hemolysis unlikely, although the history of autoimmunity and the small DAT false‐negative rate leaves Evans syndrome as an outside possibility. Medications such as tacrolimus (causing TTP) or IVIG (given the broad spectrum of antibodies it includes) are other plausible causes of the cytopenias.
At this point, I would analyze the red blood cell (RBC) morphology and check the reticulocyte count to help differentiate between hemolysis and a myelotoxin.
After transfusion, his hemoglobin remained at approximately 8.5 gm/dL and LDH remained elevated but stable. By day 12 the platelet count had fallen to 37,000/L.
With physical therapy the patient gained strength. Antibiotics were discontinued on day 12 and a follow‐up chest x‐ray demonstrated no significant disease. From days 10 to 12, his creatinine rose from 1.5 to 1.9 mg/dL, although urine output remained normal.
A hematologist observed minimal fragmentation of red cells on the blood smear. Commenting on the thrombocytopenia, anemia, and LDH isoenzymes (representative of skeletal/hepatic origin rather than hematologic), and clinical improvement after treatment of a presumed pneumonia, he felt that the continued thrombocytopenia was likely due to drug toxicity, and recommended observation, treatment of renal failure, and discontinuation of tacrolimus.
The failure to increase the hemoglobin after transfusion is consistent with (but not specific for) hemolysis. In conjunction with the progressive thrombocytopenia and persistently elevated LDH, TTP remains a consideration. While TTP can be diagnosed with minimal evidence of schistocytes, the duration of this illness, now spanning almost 2 weeks without significant end organ damagenamely more pronounced renal failure, confusion, or feveris unusual for TTP. Therefore, I think it is reasonable to withhold plasma exchange, although if the cytopenias or renal failure progress after the methotrexate, tacrolimus, and antibiotics are stopped, it may have to be undertaken empirically.
The pulmonary process remains undefined. Edema, pneumonitis (eg, aspiration), a modest pneumonia, or pulmonary hemorrhage could normalize on chest x‐ray after 1 week.
Renal ultrasound was normal. Urinalysis dipstick demonstrated 3+ blood, 3+ protein, and no nitrate or leukocyte esterase. The urine sediment showed only granular casts. Fractional excretion of sodium was 6.7%. Urine protein‐to‐creatinine ratio was 7.5, and urine myoglobin was elevated. Serum C3 and C4 complement levels and cryoglobulins were normal. Reticulocyte count was 8.5% (normal, 0.53.2).
There is significant evidence for intrinsic renal failure, starting with the elevated fractional excretion. Marked proteinuria suggests glomerular damage; nephrotic syndrome could provide an explanation for the recurrent DVT. The 3+ blood without RBCs and the markedly elevated urine myoglobin suggest pigment nephropathy from both myoglobinuria and hemoglobinuria. The elevated reticulocyte count further confirms the impression of hemolysis.
Nephrotic syndrome may result from a primary disease process, such as diabetes, systemic lupus erythematosus (SLE), or amyloidosis, for which there is no evidence to date, or as a consequence of indolent infection, malignancy, or drugs, all of which are reasonable possibilities.
The essential elements at this point include thrombocytopenia, kidney failure with proteinuria, and likely intravascular hemolysis. I would repeat the peripheral smear (looking for schistocytes) and discuss with the rheumatologist if any other medications could be discontinued.
A nephrology consultant diagnosed acute tubular necrosis (ATN) from a combination of insults (intravenous contrast, methotrexate, tacrolimus, and myoglobinuria). Over the next several days, his platelet count rose to approximately 60,000/L. The patient continued to generally feel better but the creatinine steadily increased to 4.9 mg/dL.
The hematologist's reassessment of the smear was unchanged with minimal RBC fragmentation noted. Over the next few days the hemoglobin, creatinine, and platelet count remained stable, and there were no fevers or other clinical developments. On day 21 a kidney biopsy specimen revealed evidence of thrombotic microangiopathy (TMA) and segmental glomerular necrosis, with negative immunofluorescent findings. In addition, the glomerular basement membranes were thickened and effacement of the epithelial foot processes was noted.
TTP (or other MAHA) with only a few schistocytes would be unusual at an advanced stage where organ damage has occurred, although the clinical presentation in drug‐induced variety is variable. TTP is also generally a fatal disease, so relative stability over 3 weeks without definitive therapy is atypical, unless prednisone has served as a temporizing measure. The atypical features raise the possibility of a mimic or variant of TTP such as undiagnosed cancer causing DIC or a medication (eg, tacrolimus)‐associated TTP syndrome.
At least 2 other conditions could account for the hemolysis, thrombocytopenia, and TMA. The positive ANA, glomerular disease, and cytopenias are compatible with SLE, although such progression on an intense immunosuppressive regimen would be unusual. The renal histology in a patient with an autoimmune diathesis warrants reconsideration of antiphospholipid antibody syndrome (APLS), especially in light of the earlier DVT.
Tests for antiphospholipid antibodies were negative. After multidisciplinary deliberation, a diagnosis of TMA due to tacrolimus‐associated TTP/HUS was made. Plasmapheresis was initiated and IVIG and steroids were continued. He had a complicated hospital course and required renal replacement therapy, but with pheresis, his platelet counts and hemoglobin began to recover and he was ultimately discharged in good condition. After he was discharged, testing for ADAMTS13 (a von Willebrand factor‐cleaving protease) activity was reported as 54% (normal, >66%)
Discussion
TMA in the microcirculation is the hallmark pathology of TTP‐HUS but is not specific for this disease. TMA is also seen in disseminated intravascular coagulation, sepsis, cancer, malignant hypertension, human immunodeficiency virus infection, autoimmune disorders, pregnancy‐related conditions, and in association with certain drugs.1 The first pharmacological agent to be associated with TMA was mitomycin in 1971, and since then other drug associations have been described, including antiplatelet medications such as ticlopidine and clopidogrel, antibiotics such as quinine and rifampin, interferon, and immunosuppressants such as cyclosporine and tacrolimus.2 Drug‐induced variants of TTP and TMA are challenging to diagnose because the timing of onset, clinical features, and patient factors (eg, receipt of immunosuppressants) may vary widely and mimic other conditions.2, 3 TMA is a rare complication of tacrolimus and is mostly seen in renal transplant patients at a frequency of 1%. In these patients, renal dysfunction is usually the first herald of TMA and TTP; evidence of hemolysis may be absent.3
The clinical diagnosis of TTP has historically been based on the presence of a classic pentad: MAHA, thrombocytopenia, neurological and renal abnormalities, and fever.4 Elevated levels of LDH and indirect bilirubin and the presence of fragmented RBCs and reticulocytes point toward active intravascular hemolysis. The DAT is usually negative. This textbook illness scriptthe template of a disease that is stored in a clinician's memoryis learned by physicians during training, but undergoes little modification given the limited exposure to a rare disease.
In modern practice, the pentad is rarely seen, and the characteristics of the end‐organ findings may vary substantially. For instance, while neurological symptoms including seizures, coma, and transient confusion occur in 90% of cases, renal involvement is seen in about 50% and fever in only 25% of patients.5 Although the presence of 2 or more schistocytes on the blood smear under 100 microscopy supports the diagnosis of MAHA, cases of TTP without significant schistocytosis have been reported.6
Furthermore, TTP is typically described as acute in onset, but in a quarter of patients the symptoms and signs last for weeks before diagnosis.4 This variability in disease presentation coupled with the high mortality of untreated disease has changed the diagnostic and treatment thresholds for TTP. Trials and expert opinion use MAHA, thrombocytopenia, and the exclusion of alternative causes as sufficient criteria to diagnose TTP and begin treatment.7 The measurement of a disintegrin and metalloproteinase with a thrombospondin type 1 motif, member 13 (ADAMTS13) activity (a von Willebrand factor‐cleaving protease) for diagnostic purposes remains controversial because assay techniques are not uniform and there is insufficient correlation between levels and clinical disease.810 For instance, the presence of severe ADAMTS 13 deficiency (ie, 5%) along with the presence of an ADAMTS13 inhibitor is considered to be very specific, but not sensitive, for the laboratory diagnosis of idiopathic TTP.11 In cohort studies, the frequency of severe deficiency among patients with idiopathic TTP ranged from 18% to 100%, and the presence of severe deficiency did not predict the development of acute episodes of TTP.9 In a registry study of 142 patients diagnosed with TTP, 81% of patients with secondary TTP (ie, not classified as idiopathic) had ADAMTS13 levels that were normal to subnormal (>25%), and patients with normal ADAMTS13 levels had a higher incidence of acute renal failure, similar to the findings in this patient.10
Untreated TTP has a mortality rate of greater than 90%, but with plasma exchange, survival has improved dramatically.4, 7 Glucocorticoids are often used in addition to plasma exchange, based on case series and reports.9 The addition of cryoprecipitate or fresh frozen plasma to plasmapheresis has not been shown to be beneficial, but rituximab, an anti CD‐20 monoclonal antibody, has shown promise in a small prospective study.12, 13
TTP is a rare disorder with a classic description but substantial variation in clinical presentation. In this case, the background autoimmune myopathy, immunosuppression, coincident acute DVT, unexplained infiltrates, complex medication regimen, and nephrotic range proteinuria (attributed to focal segmental glomerular sclerosis based on the limited evidence available from the biopsy) led the clinicians to ascribe the patient's thrombocytopenia and renal injury to more common conditions and created a challenging environment for the diagnosis of TTP. TTP is a complex disorder and the simplified understanding of the disease and its time course prevented a prompt match between the patient's clinical course and his diagnosis. The combination of a rare condition with inherent variability arising in the setting of medical complexity challenges the processes of problem representation and scripting the answer for even the most seasoned clinician.
The approach to clinical conundrums by an expert clinician is revealed through presentation of an actual patient's case in an approach typical of morning report. Similar to patient care, sequential pieces of information are provided to the clinician who is unfamiliar with the case. The focus is on the thought processes of both the clinical team caring for the patient and the discussant.
Key Teaching Points
-
The classically described pentad of TTP is seldom seen, and the findings of otherwise unexplained MAHA and thrombocytopenia should prompt consideration of TTP.
-
TTP may be acute and idiopathic, or be secondary to drugs, infections, or other conditions. Medication‐induced TTP may present with a wide range of clinical findings.
-
Therapeutic plasma exchange may be life‐saving in cases of TTP, and when appropriate, should be initiated promptly based on clinical suspicion and without waiting to perform tissue biopsy.
- , , .Thrombotic microangiopathies. In: Tischer CC, Brenner BM, eds.Renal Pathology.2nd ed.Philadelphia, PA:JB Lippincott;1994:1154–1184.
- , , .Drug‐induced thrombotic microangiopathy: incidence, prevention and management.Drug Saf.2001;24(7):491–501.
- , , , , .FK 506‐associated thrombotic microangiopathy: report of two cases and review of the literature.Transplantation.1999;67(4):539–544.
- , .Thrombotic Thrombocytopenic purpura: report of 16 cases and review of the literature.Medicine (Baltimore).1966;45:139–159.
- , , , .Thrombotic thrombocytopenic purpura; early and late responders.Am J Hematol.1997;54:102–107.
- .Atypical presentations of thrombotic thrombocytopenic purpura: a review.J Clin Apheresis.2009;24(1)47–52.
- , , , et al.Comparison of plasma exchange with plasma infusion in the treatment of thrombotic thrombocytopenic purpura.N Engl J Med.1991;325:393–397.
- , , , , , .The incidence of thrombotic thrombocytopenic purpura‐hemolytic uremic syndrome: all patients, idiopathic patients, and patients with severe ADAMTS13deficiency.J Thromb Haemost.2005;3:1432–1436.
- .Thrombotic thrombocytopenic purpura.N Engl J Med.2006;354:1927–1935.
- , , , et al.ADAMTS13 activity in thrombotic thrombocytopenic purpura‐hemolytic uremic syndrome: relation to presenting features and clinical outcomes in a prospective cohort of 142 patients.Blood.2003;102:60–68.
- , , .Thrombotic thrombocytopenic purpura.J Thromb Haemost.2005;3:1663–1675.
- , , , et al.Interventions for hemolytic uremic syndrome and thrombotic thrombocytopenic purpura: a systematic review of randomized controlled trials.Am J Kidney Dis.2009;53:259–272.
- , , , et al.:Efficiency of curative and prophylactic treatment with rituximab in ADAMTS13‐deficient TTP: A study of 11 cases.Blood.2005;105:1932–1937.
- , , .Thrombotic microangiopathies. In: Tischer CC, Brenner BM, eds.Renal Pathology.2nd ed.Philadelphia, PA:JB Lippincott;1994:1154–1184.
- , , .Drug‐induced thrombotic microangiopathy: incidence, prevention and management.Drug Saf.2001;24(7):491–501.
- , , , , .FK 506‐associated thrombotic microangiopathy: report of two cases and review of the literature.Transplantation.1999;67(4):539–544.
- , .Thrombotic Thrombocytopenic purpura: report of 16 cases and review of the literature.Medicine (Baltimore).1966;45:139–159.
- , , , .Thrombotic thrombocytopenic purpura; early and late responders.Am J Hematol.1997;54:102–107.
- .Atypical presentations of thrombotic thrombocytopenic purpura: a review.J Clin Apheresis.2009;24(1)47–52.
- , , , et al.Comparison of plasma exchange with plasma infusion in the treatment of thrombotic thrombocytopenic purpura.N Engl J Med.1991;325:393–397.
- , , , , , .The incidence of thrombotic thrombocytopenic purpura‐hemolytic uremic syndrome: all patients, idiopathic patients, and patients with severe ADAMTS13deficiency.J Thromb Haemost.2005;3:1432–1436.
- .Thrombotic thrombocytopenic purpura.N Engl J Med.2006;354:1927–1935.
- , , , et al.ADAMTS13 activity in thrombotic thrombocytopenic purpura‐hemolytic uremic syndrome: relation to presenting features and clinical outcomes in a prospective cohort of 142 patients.Blood.2003;102:60–68.
- , , .Thrombotic thrombocytopenic purpura.J Thromb Haemost.2005;3:1663–1675.
- , , , et al.Interventions for hemolytic uremic syndrome and thrombotic thrombocytopenic purpura: a systematic review of randomized controlled trials.Am J Kidney Dis.2009;53:259–272.
- , , , et al.:Efficiency of curative and prophylactic treatment with rituximab in ADAMTS13‐deficient TTP: A study of 11 cases.Blood.2005;105:1932–1937.
Hospitalists: Lean leaders for hospitals
Unsustainable increases in health care costs mandate efforts at cost reduction.1 Such efforts necessitate enhanced productivity, especially given the specter of an aging population afflicted by a burgeoning chronic disease burden.2 Productivity is less a choice than an imperative forced upon hospitals and health systems as they attempt to address the competing requirements of diminished resources and increased demands. While the traditional mindset treats the goals of cost reduction and improving quality as tradeoffs, the methodology and philosophy known as Lean provides a proven approach for simultaneously improving both factors.3 Ideally, improved quality should lead to lower cost, and improved productivity should lead to better quality outcomes for patients.
This issue of the Journal of Hospital Medicine (JHM) describes multiple efforts to assess the activities of hospitalists and other hospital‐based physicians through use of time‐flow measurement.47 Understanding how health care workers spend their time and on which tasks that time is spent are essential steps toward applying Lean methodology at the point of care, or gembaa Japanese word that means the place where the work is actually done.8 At many health care institutions this gemba focus has not been integral to healthcare management models, and likely is a contributing factor to the cost and quality levels that exist today. The studies directly observing care delivery published in this issue of JHM provide invaluable lessons on how we might both improve productivity and quality of care delivery in the hospital. In this editorial, we review essential components of Lean methodology and propose how hospitalists and hospitals can benefit from its application.9
Value and Waste
In the Lean model, work and activity are broken down into the general categories of value and waste. The time and activities, as viewed from the customer's (ie, patient in the hospital) perspective, can also be categorized in a similar way. The goal in a Lean environment is to maximize value to the customer while reducing activities that are not value (ie, activities lacking value are waste).
Some define value as the simple mathematical equation of quality divided by cost.10 Better quality and/or lower cost means more value. A classical Lean definition of value requires three criteria to be met.11 First, the customer (patient) must be willing to pay for the given activity, directly or indirectly. When a hospitalist initiates care in the Emergency Department by placing admitting orders for a patient, the patient would view this activity as value because it progressed the care of the patient. However, if the patient is forced to wait 5 hours in the Emergency Room for an available inpatient bed while receiving minimal care, the patient may likely view that time as waste. Second, the activity must move the process forward toward the desired outcome in a meaningful way. Testing and exam activity that leads to a diagnosis would meet this criterion, while unnecessary CT scans might not. Third, the activity must be done properly the first time so as to minimize any rework, an important core quality component of the Lean approach.
All hospitalists perform activities that represent value and others that represent waste during their day. The nomenclature is not meant to be a value judgment on the clinician or their role. Lean provides a formal framework to describe waste in 8 key categories (Table 1), all meant to look at the system related elements of waste instead of the blaming of an individual.12 Common applications of Lean in healthcare focus on reducing waste to free up more time to deliver value, or to ensure that the value work is done at the highest possible level of quality. When hospitalists must take time to locate a colleague or a piece of information, that hunting and gathering time is waste. It distracts them from providing value. Too much waste within a fixed time period may lead to corners being cut or a lack of responsiveness to patient needsresulting in degradation in the quality of care and outcomes.
|
| Defects (correction, rework) |
| Overproduction |
| Transportation |
| Waiting |
| Inventory |
| Motion |
| Overprocessing |
| Human talent |
A simpler way of looking at activity for hospitalists and the care team often classifies any time spent in the patient room or at the bedside as direct value. This time can include clinical activities or time spent simply communicating with a patient and their families about their care or concerns. There may be activity in the room that could be considered waste (searching for information in the EMR), but proximity to patients is often considered valuable for other reasons. In the field of nursing, multiple studies in the past few years focused on identifying the percentage of time that nurses spend in patient rooms (consistently in the 3035% range across health systems and continents).13 The problem of waste is a long‐standing one in hospitals. In 1922 Henry Ford wrote, In the ordinary hospital the nurses must make useless steps. More of their time is spent in walking than in caring for the patient. [A hospital in Detroit] is designed to save steps we have tried to eliminate waste motion in the hospital.14
Activity outside of the patient room may be sometimes considered of indirect value, but this is often a gray area. Charting and medical decision‐making may benefit the patient and move the care process forward, and thus be of clear value. Yet, such activity may have questionable patient value if undertaken solely for billing or regulatory reasons. Effectively coordinating care between different members of the care team from both inside the hospital as well as beyond its walls does have value, but waste typically occurs when information is transferred incompletely or inaccurately.
Reducing waste often requires systemic changes to processes, workflow, and physical space. Motion (walking and searching) is a common form of waste in healthcare. Systemic Lean improvements might include changing the location of equipment and medication storage, or even patients.15 Uneven workloads often cannot be addressed by an individualthere must be a systemic effort to level workloads (the Lean term being heijunka), for example, leveling patient discharges throughout the day instead of doing them all in the late afternoon.
Lean also focuses on not wasting human talent or professional potential, often referred to in the literature as the eighth type of waste because it is missing from some Lean reference books.11 When hospitalists perform work that could be done by a midlevel provider (ie, physician assistant or nurse practitioner), or when a nurse performs work that could be done by a tech, the hospital wastes a scarce resource, human capital. Of note, changing these roles and responsibilities requires systemic effort rather than people just quitting a certain activity because it is below their pay grade; eg, it is better for the wrong person to be taking vital signs than to not have them documented at all.
Subject or Scientist
Toyota describes its management system, the Toyota Way, as having 2 equally important pillars: continuous improvement and what they call respect for humanity.16
If hospitals focus only on the improvement pillar, they run the risk of alienating the clinicians and staff members, undercutting any attempts at quality or productivity improvement. Respect for humanity is a much more sophisticated concept than just making employees happy in a superficial way. Respect, in a Lean sense, includes not robbing people of the opportunity to improve their own work. As participation increases the pride people feel in their work, more improvement resultsa virtuous cycle.17
Importantly, the Lean approach to quality improvement does not mirror the classical approach to improving productivity in a factory. Frederick Taylor (18561915) and Frank Gilbreth (18681924) are considered the fathers of Industrial Engineering, but their philosophy promulgated the belief that workers are not smart enough to participate in improvement.18 While they contributed a number of work analysis and process improvement methods that we use to this day, their philosophy is not one that fits with the respect for humanity principle of a modern professional workplace. Taylor believed a primary workplace problem was that people loafed and did not work hard enough; a seeming defect in their character as opposed to something that management should investigate and understand (for example, asking Why are people no longer motivated?).19 Taylor stood over workers, timing and watching their efforts, devising methods that workers should use to maximize their productivity. The term Taylorist is often used to describe this forced separation between working and thinking. The modern approach to Lean management draws more on the philosophy of Demingpeople want to do quality work, but the system gets in the way. The modern Lean approach emphasizes that every employee has 2 jobsboth to do the work and to improve it. The daily practice of kaizen, or continuous improvement, engages every employee in a problem‐solving dialogue with their leaders. In a Lean hospital, everybody deserves respect for their role, from a night‐time hospitalist to patient transporters, and all can play a role in process improvement.
Having research assistants shadow hospitalists could be done in a Taylorist or Deming way. Ideally, the role of a Lean improvement professional would be to teach those doing the work how to identify waste, allowing the hospitalists to develop and test their own improvements based on their existing professional knowledge combined with Lean principles. While the time‐flow studies published in this issue of JHM identified how the hospital system can be a barrier to hospitalist efficiency, this also potentially represents a wasted opportunity. Ideally, if the observers had been Lean improvement professionals they would not have just shadowed hospitalists without talking to or engaging them. They would have helped identify batching in a process or teaching the hospitalists why that practice is often not optimal. Future research should focus on applying this approach to time‐flow analysis in the hospital.
Simply putLean and process improvement techniques run the risk of being disrespectful, ineffective, and unsustainable when they are done to somebody, (the Taylor/Gilbreth approach) instead of utilized to both assess activities and glean learning from the front‐line staff. To be sustainable, effective, and respectful, hospitals should strive to truly engage in process improvement the people who are actually performing the work. Instead of efficiency experts, we need skilled coaches and mentors who can guide people towards generating their own improvements. Finally, when we have experts like Taylor or Gilbreth leading process improvement, those experts become a crutch and a bottleneck. Only by teaching the clinicians and staff members these skills, combined with patient focus and respect for humanity, can we begin moving a hospital's culture to one of true continuous improvementleading to better patient safety and quality, better access, lower costs, and better staff morale.
Conclusion
Hospitalists seem to be ideal leaders in efforts to generate ideas for improvement to remove waste from the health care system. Efficiency, value, and quality will be the mantra as we head into an era of healthcare where every action will be analyzed as to whether the action provides value to the patient. Hospitalists are well poised as Dr. Peter Pronovost recently stated. I think hospitalists' roles are going to go up dramatically, and I hope the field responds by making sure they put out people who have the skills to lead.20 Hospitalists experience and see waste in the processes of care. Yet, as Lord Kelvin is credited with the saying, If you can not measure it, you can not improve it and future time‐flow studies of hospitalists must take advantage of opportunities to also measure waste and not just document activity.
- .The cost implications of health care reform.N Engl J Med.2010 (in press).
- . The cost of inaction: the urgent need for health reform. Available at: http://www.healthreform.gov/reports/inaction/inactionreportprintmarch2009.pdf. Accessed May2010.
- .Writing the new playbook for U.S. health care: lessons from Wisconsin.Health Aff (Millwood).2009;28(5):1343–1350.
- , , , , .Systematic review of time studies evaluating physicians in the hospital setting.J Hosp Med.2010;5(6):353–359.
- , , , et al.Where did the day go?—A time‐motion study of hospitalists.J Hosp Med.2010;5(6):323–328.
- , , , , .Comparing Academic and Community‐Based Hospitalists.J Hosp Med.2010;5(6):349–352.
- , , , , .Hospitalist time usage and cyclicality: opportunities to improve efficiency.J Hosp Med.2010;5(6):329–334.
- , .Lean Lexicon: A Graphical Glossary for Lean Thinkers.Cambridge, MA:Lean Enterprise Institute;2003.
- , , , .Lean health care: what can hospitals learn from a world‐class automaker?J Hosp Med.2006;1(3):191–199.
- . Evaluating the Impact of Value‐Based Purchasing: A Guide for Purchasers. Available at: http://www.ahrq.gov/about/cods/valuebased/evalvbp1.htm. Accessed May2010.
- .Lean Hospitals: Improving Quality, Patient Safety, and Employee Satisfaction.New York:Productivity Press;2008.
- , .Lean Thinking.New York:Simon and Schuster;1996.
- , .Creating an environment for caring using lean principles of the Virginia Mason Production System.J Nurs Adm.2007;37(6):287–294.
- , .My Life and Work.Garden City, NY:Garden City Publishing;1922.
- , , , et al.Impact of localizing physicians to hospital units on nurse‐physician communication and agreement on the plan of care.J Gen Intern Med.2009;24(11):1223–1227.
- .Toyota Production System: Beyond Large‐Scale Production.New York:Productivity Press;1988.
- .Out of the Crisis.Cambridge:Massachusetts Institute of Technology—Center of Advanced Educational Services;1982.
- .Frederick Taylor and Frank Gilbreth: competition in scientific management.Bus Hist Rev.1957;31(1):23–34.
- .The Principles of Scientific Management.Norwood, MA:The Plimpton Press;1911.
- .The Year Ahead.The hospitalist.2010;14(2):1,4–5.
Unsustainable increases in health care costs mandate efforts at cost reduction.1 Such efforts necessitate enhanced productivity, especially given the specter of an aging population afflicted by a burgeoning chronic disease burden.2 Productivity is less a choice than an imperative forced upon hospitals and health systems as they attempt to address the competing requirements of diminished resources and increased demands. While the traditional mindset treats the goals of cost reduction and improving quality as tradeoffs, the methodology and philosophy known as Lean provides a proven approach for simultaneously improving both factors.3 Ideally, improved quality should lead to lower cost, and improved productivity should lead to better quality outcomes for patients.
This issue of the Journal of Hospital Medicine (JHM) describes multiple efforts to assess the activities of hospitalists and other hospital‐based physicians through use of time‐flow measurement.47 Understanding how health care workers spend their time and on which tasks that time is spent are essential steps toward applying Lean methodology at the point of care, or gembaa Japanese word that means the place where the work is actually done.8 At many health care institutions this gemba focus has not been integral to healthcare management models, and likely is a contributing factor to the cost and quality levels that exist today. The studies directly observing care delivery published in this issue of JHM provide invaluable lessons on how we might both improve productivity and quality of care delivery in the hospital. In this editorial, we review essential components of Lean methodology and propose how hospitalists and hospitals can benefit from its application.9
Value and Waste
In the Lean model, work and activity are broken down into the general categories of value and waste. The time and activities, as viewed from the customer's (ie, patient in the hospital) perspective, can also be categorized in a similar way. The goal in a Lean environment is to maximize value to the customer while reducing activities that are not value (ie, activities lacking value are waste).
Some define value as the simple mathematical equation of quality divided by cost.10 Better quality and/or lower cost means more value. A classical Lean definition of value requires three criteria to be met.11 First, the customer (patient) must be willing to pay for the given activity, directly or indirectly. When a hospitalist initiates care in the Emergency Department by placing admitting orders for a patient, the patient would view this activity as value because it progressed the care of the patient. However, if the patient is forced to wait 5 hours in the Emergency Room for an available inpatient bed while receiving minimal care, the patient may likely view that time as waste. Second, the activity must move the process forward toward the desired outcome in a meaningful way. Testing and exam activity that leads to a diagnosis would meet this criterion, while unnecessary CT scans might not. Third, the activity must be done properly the first time so as to minimize any rework, an important core quality component of the Lean approach.
All hospitalists perform activities that represent value and others that represent waste during their day. The nomenclature is not meant to be a value judgment on the clinician or their role. Lean provides a formal framework to describe waste in 8 key categories (Table 1), all meant to look at the system related elements of waste instead of the blaming of an individual.12 Common applications of Lean in healthcare focus on reducing waste to free up more time to deliver value, or to ensure that the value work is done at the highest possible level of quality. When hospitalists must take time to locate a colleague or a piece of information, that hunting and gathering time is waste. It distracts them from providing value. Too much waste within a fixed time period may lead to corners being cut or a lack of responsiveness to patient needsresulting in degradation in the quality of care and outcomes.
|
| Defects (correction, rework) |
| Overproduction |
| Transportation |
| Waiting |
| Inventory |
| Motion |
| Overprocessing |
| Human talent |
A simpler way of looking at activity for hospitalists and the care team often classifies any time spent in the patient room or at the bedside as direct value. This time can include clinical activities or time spent simply communicating with a patient and their families about their care or concerns. There may be activity in the room that could be considered waste (searching for information in the EMR), but proximity to patients is often considered valuable for other reasons. In the field of nursing, multiple studies in the past few years focused on identifying the percentage of time that nurses spend in patient rooms (consistently in the 3035% range across health systems and continents).13 The problem of waste is a long‐standing one in hospitals. In 1922 Henry Ford wrote, In the ordinary hospital the nurses must make useless steps. More of their time is spent in walking than in caring for the patient. [A hospital in Detroit] is designed to save steps we have tried to eliminate waste motion in the hospital.14
Activity outside of the patient room may be sometimes considered of indirect value, but this is often a gray area. Charting and medical decision‐making may benefit the patient and move the care process forward, and thus be of clear value. Yet, such activity may have questionable patient value if undertaken solely for billing or regulatory reasons. Effectively coordinating care between different members of the care team from both inside the hospital as well as beyond its walls does have value, but waste typically occurs when information is transferred incompletely or inaccurately.
Reducing waste often requires systemic changes to processes, workflow, and physical space. Motion (walking and searching) is a common form of waste in healthcare. Systemic Lean improvements might include changing the location of equipment and medication storage, or even patients.15 Uneven workloads often cannot be addressed by an individualthere must be a systemic effort to level workloads (the Lean term being heijunka), for example, leveling patient discharges throughout the day instead of doing them all in the late afternoon.
Lean also focuses on not wasting human talent or professional potential, often referred to in the literature as the eighth type of waste because it is missing from some Lean reference books.11 When hospitalists perform work that could be done by a midlevel provider (ie, physician assistant or nurse practitioner), or when a nurse performs work that could be done by a tech, the hospital wastes a scarce resource, human capital. Of note, changing these roles and responsibilities requires systemic effort rather than people just quitting a certain activity because it is below their pay grade; eg, it is better for the wrong person to be taking vital signs than to not have them documented at all.
Subject or Scientist
Toyota describes its management system, the Toyota Way, as having 2 equally important pillars: continuous improvement and what they call respect for humanity.16
If hospitals focus only on the improvement pillar, they run the risk of alienating the clinicians and staff members, undercutting any attempts at quality or productivity improvement. Respect for humanity is a much more sophisticated concept than just making employees happy in a superficial way. Respect, in a Lean sense, includes not robbing people of the opportunity to improve their own work. As participation increases the pride people feel in their work, more improvement resultsa virtuous cycle.17
Importantly, the Lean approach to quality improvement does not mirror the classical approach to improving productivity in a factory. Frederick Taylor (18561915) and Frank Gilbreth (18681924) are considered the fathers of Industrial Engineering, but their philosophy promulgated the belief that workers are not smart enough to participate in improvement.18 While they contributed a number of work analysis and process improvement methods that we use to this day, their philosophy is not one that fits with the respect for humanity principle of a modern professional workplace. Taylor believed a primary workplace problem was that people loafed and did not work hard enough; a seeming defect in their character as opposed to something that management should investigate and understand (for example, asking Why are people no longer motivated?).19 Taylor stood over workers, timing and watching their efforts, devising methods that workers should use to maximize their productivity. The term Taylorist is often used to describe this forced separation between working and thinking. The modern approach to Lean management draws more on the philosophy of Demingpeople want to do quality work, but the system gets in the way. The modern Lean approach emphasizes that every employee has 2 jobsboth to do the work and to improve it. The daily practice of kaizen, or continuous improvement, engages every employee in a problem‐solving dialogue with their leaders. In a Lean hospital, everybody deserves respect for their role, from a night‐time hospitalist to patient transporters, and all can play a role in process improvement.
Having research assistants shadow hospitalists could be done in a Taylorist or Deming way. Ideally, the role of a Lean improvement professional would be to teach those doing the work how to identify waste, allowing the hospitalists to develop and test their own improvements based on their existing professional knowledge combined with Lean principles. While the time‐flow studies published in this issue of JHM identified how the hospital system can be a barrier to hospitalist efficiency, this also potentially represents a wasted opportunity. Ideally, if the observers had been Lean improvement professionals they would not have just shadowed hospitalists without talking to or engaging them. They would have helped identify batching in a process or teaching the hospitalists why that practice is often not optimal. Future research should focus on applying this approach to time‐flow analysis in the hospital.
Simply putLean and process improvement techniques run the risk of being disrespectful, ineffective, and unsustainable when they are done to somebody, (the Taylor/Gilbreth approach) instead of utilized to both assess activities and glean learning from the front‐line staff. To be sustainable, effective, and respectful, hospitals should strive to truly engage in process improvement the people who are actually performing the work. Instead of efficiency experts, we need skilled coaches and mentors who can guide people towards generating their own improvements. Finally, when we have experts like Taylor or Gilbreth leading process improvement, those experts become a crutch and a bottleneck. Only by teaching the clinicians and staff members these skills, combined with patient focus and respect for humanity, can we begin moving a hospital's culture to one of true continuous improvementleading to better patient safety and quality, better access, lower costs, and better staff morale.
Conclusion
Hospitalists seem to be ideal leaders in efforts to generate ideas for improvement to remove waste from the health care system. Efficiency, value, and quality will be the mantra as we head into an era of healthcare where every action will be analyzed as to whether the action provides value to the patient. Hospitalists are well poised as Dr. Peter Pronovost recently stated. I think hospitalists' roles are going to go up dramatically, and I hope the field responds by making sure they put out people who have the skills to lead.20 Hospitalists experience and see waste in the processes of care. Yet, as Lord Kelvin is credited with the saying, If you can not measure it, you can not improve it and future time‐flow studies of hospitalists must take advantage of opportunities to also measure waste and not just document activity.
Unsustainable increases in health care costs mandate efforts at cost reduction.1 Such efforts necessitate enhanced productivity, especially given the specter of an aging population afflicted by a burgeoning chronic disease burden.2 Productivity is less a choice than an imperative forced upon hospitals and health systems as they attempt to address the competing requirements of diminished resources and increased demands. While the traditional mindset treats the goals of cost reduction and improving quality as tradeoffs, the methodology and philosophy known as Lean provides a proven approach for simultaneously improving both factors.3 Ideally, improved quality should lead to lower cost, and improved productivity should lead to better quality outcomes for patients.
This issue of the Journal of Hospital Medicine (JHM) describes multiple efforts to assess the activities of hospitalists and other hospital‐based physicians through use of time‐flow measurement.47 Understanding how health care workers spend their time and on which tasks that time is spent are essential steps toward applying Lean methodology at the point of care, or gembaa Japanese word that means the place where the work is actually done.8 At many health care institutions this gemba focus has not been integral to healthcare management models, and likely is a contributing factor to the cost and quality levels that exist today. The studies directly observing care delivery published in this issue of JHM provide invaluable lessons on how we might both improve productivity and quality of care delivery in the hospital. In this editorial, we review essential components of Lean methodology and propose how hospitalists and hospitals can benefit from its application.9
Value and Waste
In the Lean model, work and activity are broken down into the general categories of value and waste. The time and activities, as viewed from the customer's (ie, patient in the hospital) perspective, can also be categorized in a similar way. The goal in a Lean environment is to maximize value to the customer while reducing activities that are not value (ie, activities lacking value are waste).
Some define value as the simple mathematical equation of quality divided by cost.10 Better quality and/or lower cost means more value. A classical Lean definition of value requires three criteria to be met.11 First, the customer (patient) must be willing to pay for the given activity, directly or indirectly. When a hospitalist initiates care in the Emergency Department by placing admitting orders for a patient, the patient would view this activity as value because it progressed the care of the patient. However, if the patient is forced to wait 5 hours in the Emergency Room for an available inpatient bed while receiving minimal care, the patient may likely view that time as waste. Second, the activity must move the process forward toward the desired outcome in a meaningful way. Testing and exam activity that leads to a diagnosis would meet this criterion, while unnecessary CT scans might not. Third, the activity must be done properly the first time so as to minimize any rework, an important core quality component of the Lean approach.
All hospitalists perform activities that represent value and others that represent waste during their day. The nomenclature is not meant to be a value judgment on the clinician or their role. Lean provides a formal framework to describe waste in 8 key categories (Table 1), all meant to look at the system related elements of waste instead of the blaming of an individual.12 Common applications of Lean in healthcare focus on reducing waste to free up more time to deliver value, or to ensure that the value work is done at the highest possible level of quality. When hospitalists must take time to locate a colleague or a piece of information, that hunting and gathering time is waste. It distracts them from providing value. Too much waste within a fixed time period may lead to corners being cut or a lack of responsiveness to patient needsresulting in degradation in the quality of care and outcomes.
|
| Defects (correction, rework) |
| Overproduction |
| Transportation |
| Waiting |
| Inventory |
| Motion |
| Overprocessing |
| Human talent |
A simpler way of looking at activity for hospitalists and the care team often classifies any time spent in the patient room or at the bedside as direct value. This time can include clinical activities or time spent simply communicating with a patient and their families about their care or concerns. There may be activity in the room that could be considered waste (searching for information in the EMR), but proximity to patients is often considered valuable for other reasons. In the field of nursing, multiple studies in the past few years focused on identifying the percentage of time that nurses spend in patient rooms (consistently in the 3035% range across health systems and continents).13 The problem of waste is a long‐standing one in hospitals. In 1922 Henry Ford wrote, In the ordinary hospital the nurses must make useless steps. More of their time is spent in walking than in caring for the patient. [A hospital in Detroit] is designed to save steps we have tried to eliminate waste motion in the hospital.14
Activity outside of the patient room may be sometimes considered of indirect value, but this is often a gray area. Charting and medical decision‐making may benefit the patient and move the care process forward, and thus be of clear value. Yet, such activity may have questionable patient value if undertaken solely for billing or regulatory reasons. Effectively coordinating care between different members of the care team from both inside the hospital as well as beyond its walls does have value, but waste typically occurs when information is transferred incompletely or inaccurately.
Reducing waste often requires systemic changes to processes, workflow, and physical space. Motion (walking and searching) is a common form of waste in healthcare. Systemic Lean improvements might include changing the location of equipment and medication storage, or even patients.15 Uneven workloads often cannot be addressed by an individualthere must be a systemic effort to level workloads (the Lean term being heijunka), for example, leveling patient discharges throughout the day instead of doing them all in the late afternoon.
Lean also focuses on not wasting human talent or professional potential, often referred to in the literature as the eighth type of waste because it is missing from some Lean reference books.11 When hospitalists perform work that could be done by a midlevel provider (ie, physician assistant or nurse practitioner), or when a nurse performs work that could be done by a tech, the hospital wastes a scarce resource, human capital. Of note, changing these roles and responsibilities requires systemic effort rather than people just quitting a certain activity because it is below their pay grade; eg, it is better for the wrong person to be taking vital signs than to not have them documented at all.
Subject or Scientist
Toyota describes its management system, the Toyota Way, as having 2 equally important pillars: continuous improvement and what they call respect for humanity.16
If hospitals focus only on the improvement pillar, they run the risk of alienating the clinicians and staff members, undercutting any attempts at quality or productivity improvement. Respect for humanity is a much more sophisticated concept than just making employees happy in a superficial way. Respect, in a Lean sense, includes not robbing people of the opportunity to improve their own work. As participation increases the pride people feel in their work, more improvement resultsa virtuous cycle.17
Importantly, the Lean approach to quality improvement does not mirror the classical approach to improving productivity in a factory. Frederick Taylor (18561915) and Frank Gilbreth (18681924) are considered the fathers of Industrial Engineering, but their philosophy promulgated the belief that workers are not smart enough to participate in improvement.18 While they contributed a number of work analysis and process improvement methods that we use to this day, their philosophy is not one that fits with the respect for humanity principle of a modern professional workplace. Taylor believed a primary workplace problem was that people loafed and did not work hard enough; a seeming defect in their character as opposed to something that management should investigate and understand (for example, asking Why are people no longer motivated?).19 Taylor stood over workers, timing and watching their efforts, devising methods that workers should use to maximize their productivity. The term Taylorist is often used to describe this forced separation between working and thinking. The modern approach to Lean management draws more on the philosophy of Demingpeople want to do quality work, but the system gets in the way. The modern Lean approach emphasizes that every employee has 2 jobsboth to do the work and to improve it. The daily practice of kaizen, or continuous improvement, engages every employee in a problem‐solving dialogue with their leaders. In a Lean hospital, everybody deserves respect for their role, from a night‐time hospitalist to patient transporters, and all can play a role in process improvement.
Having research assistants shadow hospitalists could be done in a Taylorist or Deming way. Ideally, the role of a Lean improvement professional would be to teach those doing the work how to identify waste, allowing the hospitalists to develop and test their own improvements based on their existing professional knowledge combined with Lean principles. While the time‐flow studies published in this issue of JHM identified how the hospital system can be a barrier to hospitalist efficiency, this also potentially represents a wasted opportunity. Ideally, if the observers had been Lean improvement professionals they would not have just shadowed hospitalists without talking to or engaging them. They would have helped identify batching in a process or teaching the hospitalists why that practice is often not optimal. Future research should focus on applying this approach to time‐flow analysis in the hospital.
Simply putLean and process improvement techniques run the risk of being disrespectful, ineffective, and unsustainable when they are done to somebody, (the Taylor/Gilbreth approach) instead of utilized to both assess activities and glean learning from the front‐line staff. To be sustainable, effective, and respectful, hospitals should strive to truly engage in process improvement the people who are actually performing the work. Instead of efficiency experts, we need skilled coaches and mentors who can guide people towards generating their own improvements. Finally, when we have experts like Taylor or Gilbreth leading process improvement, those experts become a crutch and a bottleneck. Only by teaching the clinicians and staff members these skills, combined with patient focus and respect for humanity, can we begin moving a hospital's culture to one of true continuous improvementleading to better patient safety and quality, better access, lower costs, and better staff morale.
Conclusion
Hospitalists seem to be ideal leaders in efforts to generate ideas for improvement to remove waste from the health care system. Efficiency, value, and quality will be the mantra as we head into an era of healthcare where every action will be analyzed as to whether the action provides value to the patient. Hospitalists are well poised as Dr. Peter Pronovost recently stated. I think hospitalists' roles are going to go up dramatically, and I hope the field responds by making sure they put out people who have the skills to lead.20 Hospitalists experience and see waste in the processes of care. Yet, as Lord Kelvin is credited with the saying, If you can not measure it, you can not improve it and future time‐flow studies of hospitalists must take advantage of opportunities to also measure waste and not just document activity.
- .The cost implications of health care reform.N Engl J Med.2010 (in press).
- . The cost of inaction: the urgent need for health reform. Available at: http://www.healthreform.gov/reports/inaction/inactionreportprintmarch2009.pdf. Accessed May2010.
- .Writing the new playbook for U.S. health care: lessons from Wisconsin.Health Aff (Millwood).2009;28(5):1343–1350.
- , , , , .Systematic review of time studies evaluating physicians in the hospital setting.J Hosp Med.2010;5(6):353–359.
- , , , et al.Where did the day go?—A time‐motion study of hospitalists.J Hosp Med.2010;5(6):323–328.
- , , , , .Comparing Academic and Community‐Based Hospitalists.J Hosp Med.2010;5(6):349–352.
- , , , , .Hospitalist time usage and cyclicality: opportunities to improve efficiency.J Hosp Med.2010;5(6):329–334.
- , .Lean Lexicon: A Graphical Glossary for Lean Thinkers.Cambridge, MA:Lean Enterprise Institute;2003.
- , , , .Lean health care: what can hospitals learn from a world‐class automaker?J Hosp Med.2006;1(3):191–199.
- . Evaluating the Impact of Value‐Based Purchasing: A Guide for Purchasers. Available at: http://www.ahrq.gov/about/cods/valuebased/evalvbp1.htm. Accessed May2010.
- .Lean Hospitals: Improving Quality, Patient Safety, and Employee Satisfaction.New York:Productivity Press;2008.
- , .Lean Thinking.New York:Simon and Schuster;1996.
- , .Creating an environment for caring using lean principles of the Virginia Mason Production System.J Nurs Adm.2007;37(6):287–294.
- , .My Life and Work.Garden City, NY:Garden City Publishing;1922.
- , , , et al.Impact of localizing physicians to hospital units on nurse‐physician communication and agreement on the plan of care.J Gen Intern Med.2009;24(11):1223–1227.
- .Toyota Production System: Beyond Large‐Scale Production.New York:Productivity Press;1988.
- .Out of the Crisis.Cambridge:Massachusetts Institute of Technology—Center of Advanced Educational Services;1982.
- .Frederick Taylor and Frank Gilbreth: competition in scientific management.Bus Hist Rev.1957;31(1):23–34.
- .The Principles of Scientific Management.Norwood, MA:The Plimpton Press;1911.
- .The Year Ahead.The hospitalist.2010;14(2):1,4–5.
- .The cost implications of health care reform.N Engl J Med.2010 (in press).
- . The cost of inaction: the urgent need for health reform. Available at: http://www.healthreform.gov/reports/inaction/inactionreportprintmarch2009.pdf. Accessed May2010.
- .Writing the new playbook for U.S. health care: lessons from Wisconsin.Health Aff (Millwood).2009;28(5):1343–1350.
- , , , , .Systematic review of time studies evaluating physicians in the hospital setting.J Hosp Med.2010;5(6):353–359.
- , , , et al.Where did the day go?—A time‐motion study of hospitalists.J Hosp Med.2010;5(6):323–328.
- , , , , .Comparing Academic and Community‐Based Hospitalists.J Hosp Med.2010;5(6):349–352.
- , , , , .Hospitalist time usage and cyclicality: opportunities to improve efficiency.J Hosp Med.2010;5(6):329–334.
- , .Lean Lexicon: A Graphical Glossary for Lean Thinkers.Cambridge, MA:Lean Enterprise Institute;2003.
- , , , .Lean health care: what can hospitals learn from a world‐class automaker?J Hosp Med.2006;1(3):191–199.
- . Evaluating the Impact of Value‐Based Purchasing: A Guide for Purchasers. Available at: http://www.ahrq.gov/about/cods/valuebased/evalvbp1.htm. Accessed May2010.
- .Lean Hospitals: Improving Quality, Patient Safety, and Employee Satisfaction.New York:Productivity Press;2008.
- , .Lean Thinking.New York:Simon and Schuster;1996.
- , .Creating an environment for caring using lean principles of the Virginia Mason Production System.J Nurs Adm.2007;37(6):287–294.
- , .My Life and Work.Garden City, NY:Garden City Publishing;1922.
- , , , et al.Impact of localizing physicians to hospital units on nurse‐physician communication and agreement on the plan of care.J Gen Intern Med.2009;24(11):1223–1227.
- .Toyota Production System: Beyond Large‐Scale Production.New York:Productivity Press;1988.
- .Out of the Crisis.Cambridge:Massachusetts Institute of Technology—Center of Advanced Educational Services;1982.
- .Frederick Taylor and Frank Gilbreth: competition in scientific management.Bus Hist Rev.1957;31(1):23–34.
- .The Principles of Scientific Management.Norwood, MA:The Plimpton Press;1911.
- .The Year Ahead.The hospitalist.2010;14(2):1,4–5.
Time Studies of Hospital Physicians
Time‐motion studies, introduced by Frederick W. Taylor in the 1880s,1 have been widely implemented across the business world; a Google search of time‐motion study returns approximately 32 million results. Such studies continuously document how workers spend their time and then use this information to identify and eliminate inefficient practices. Work‐sampling is a similar methodology introduced by L.H.C. Tippett in 1935.2 Work‐sampling utilizes a trained observer to document activities at predetermined or random intervals of time. Given a large enough number of observations, this method can be comparable to the continuous observation method used in time‐motion studies.3
Healthcare has begun to utilize these time‐study methodologies to evaluate the activities of physicians and nurses. Researchers have successfully used time‐study methodology in the emergency department, intensive care unit, and ambulatory and surgical settings in the U.S. and around the world to better understand physician activities and to design and assess interventions to improve efficiency.49 Hospitals are also eager to enhance efficiency in the inpatient setting given the current economic environment. Hospitalizations account for over a third of healthcare costs in the United States, making them an attractive target for cost‐cutting measures.10 Acknowledging that healthcare expenditures cannot continue to rise,11 insurers, particularly the Centers for Medicare and Medicaid Services (CMS), increasingly seek to reduce payments to hospitals.12 Compounding these pressures, a major supply of relatively inexpensive labor shrank with the decision by the Accreditation Council for Graduate Medicine Education (ACGME) to restrict the number of hours residents are allowed to work. Efficiency concerns gain new urgency as hospitals scramble to cover their patient loads with reduced physician availability.13
We undertook a systematic review of time‐motion and work‐sampling studies performed in the hospital setting to better understand the available literature describing the activities of physicians caring for hospitalized patients. An additional goal of this review was to determine the extent of available time‐flow literature describing the activity of hospitalists. The hospitalist movement provided one viable solution to the gap between demand for hospital patient care and the reduced supply of available physicianstypically primary care physicians in community hospitals and residents in teaching hospitals.14 Hospital medicine is the fastest‐growing specialty in the history of American medicine.15 More than half of American hospitals now have hospital medicine programs with a total of greater than 25,000 hospitalists in the U.S.15 This popularity has been driven by hospitalists' ability to increase efficiency through decreasing overall cost and length of stay for patients without increasing readmission rates or reducing primary care physician satisfaction.1619 However, exactly how hospitalists accomplish this increase in efficiency is still the subject of debate. One time‐motion study provides a glimpse into the activities of hospitalists at an academic urban hospital,20 but may not be applicable to many other hospitals.
Methods
Data Sources
With assistance from a medical librarian, we searched for English‐language articles published between 1965 and June 2009 using the MEDLINE (
Study Selection
We selected articles that met the following criteria: (1) explicit use of time‐motion methodology or work‐sampling performed via direct observation; (2) study populations including physicians, medical residents, or interns; (3) performance sites on an inpatient hospital ward (ie, not outpatient within the hospital, emergency room (ER), or operating room (OR)); and (4) observation of at least half of a shift. Titles and abstracts of the retrieved citations were first reviewed to identify studies that could potentially meet our criteria. Full‐text versions of the selected articles were then retrieved and analyzed by at least 2 of 4 authors (V.F., K.E., D.M., and M.T.) to determine the final list of articles. Articles that failed to provide sufficient information for one or more criteria were excluded.
Data Extraction
Each article was independently reviewed by at least 2 of 3 authors (V.F., D.M., and M.T.) using a standardized data abstraction form. The form included the following categories: sample population, sample size, hospital type, data collection tool type, time‐motion/observation duration, key categories of activity, and key results. If an article included additional data beyond the scope of this review (eg, data from surgical residents in the OR as well as internal medicine residents) only the qualifying portion of the study was included. Disagreements were resolved through discussion and consensus. Data were then compiled into tables.
Results
Our database search yielded 4270 potential articles. We then reviewed the title and abstract of each of these articles to identify studies that evaluated physicians, were performed on a hospital ward, and explicitly used time‐motion or direct‐observation work‐sampling methodology. For articles lacking an abstract but having a relevant title, we obtained the full text to determine eligibility for additional review. Sixty‐eight articles from this original search were selected for full‐text review. Ten of these articles met the selection criteria. Most of the articles excluded in this step were either conducted in an outpatient OR or ER setting, or used self‐report data instead of direct‐observation data. A secondary search using the reference lists of all obtained articles as well as consultation with experts in the field yielded 11 additional articles of interest. Three of these 11 articles were found to meet our criteria, bringing the total to 13 articles for review (Fig. 1).
These 13 articles included several types of physicians in their samples. Eleven included interns,2131 7 included residents,2123, 2628, 31 and 4 included attending physicians20, 23, 26, 32 (Table 1). Six articles included more than 1 type of subject.2123, 26, 28, 31 The main focus of these articles also varied. Nine of the 13 studies were designed to simply describe how residents, physicians and nurses spend their time.20, 2227, 29, 31 Three studies were primarily concerned with comparing groups from different intern programs, residency rotations, hospital types, or shifts.28, 30, 32 The remaining study attempted to quantify the amount of time physicians spent on tasks that could be performed by non‐physician staff.21 Only 2 articles evaluated hospitalists,20, 32 and we found no articles studying hospitalists in a community, non‐teaching setting. The studies were performed as early as 1961 and as recently as 2009. Just 5 of the 13 articles were published within the last 10 years. 0
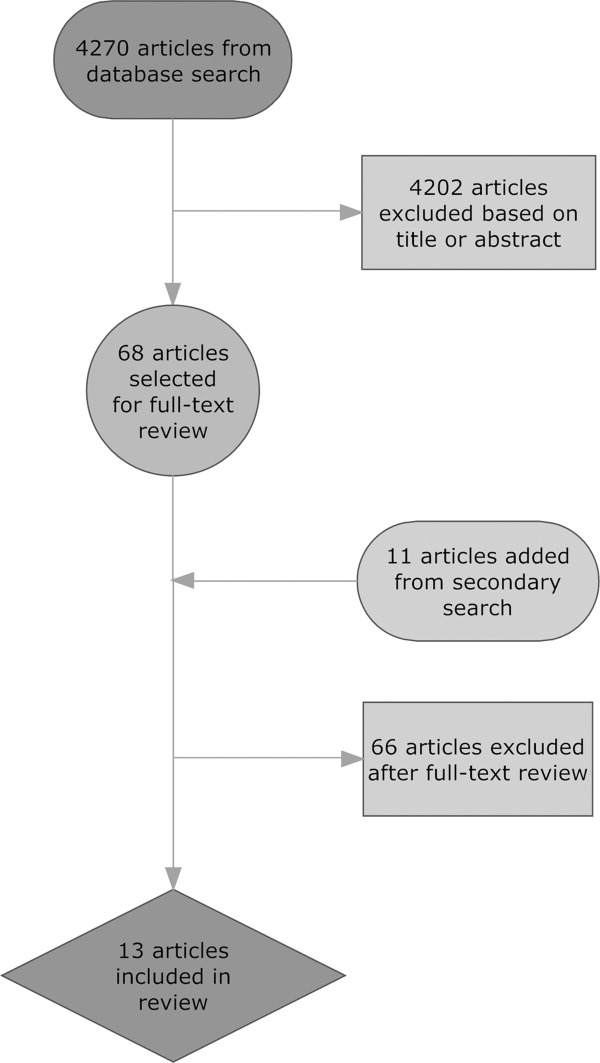
| Reference (Year) | Type of Hospital | Data Collection Tool | Direct/Indirect Care Estimates | Key Activities Reported and Percentage of Time Spent on Each, and Other Results |
|---|---|---|---|---|
| ||||
| Ammenwerth and Spotl (2009) | Academic | Work sampling: paper and stopwatch | Direct care 27.5%; indirect care 62.8% | Documentation tasks 26.6%; direct care 27.5%; communication 36.2%; other tasks 9.7%. Approximately 16% of documentation time was administrative documentation. |
| Arthurson et al. (1976) | Academic | Paper and stopwatch | Direct care 40.8%; indirect care 45.5% | Medical intern: patient care 40.8%; clerical 25.5%; telephone 10%; professional discussion 10.5%; transit/waiting 6.5%, personal 7% |
| Gabow et al. (2006) | Academic | Paper and stopwatch with pedometer | Direct care 19.5%; indirect care: 32% | Attend to/assess patient 17%; charting 9.5%; consult with MD/nurse 9.5%; downtime 6.5%; educational activity 2.5%; family interaction 0.5%; paging/phone 3.5%; procedure 1.5%; review films/laboratory results 9%; rounds 15.5%; sleep 21.5%; travel 3.5% |
| Gillanders et al. (1971) | Academic | Paper and stopwatch | Direct care 19%; indirect care 42.5% | Individual interaction 14.5%; nonverbal communication 20.5%; procedures 10.0%; laboratory work 3.5%; interpersonal communication 18.5%; rounds 9%; direction and supervision 0.5%; nonmedical talk 2%; education 8.5%; ancillary activities 5.5%; personal 7% |
| Knickman et al. (1992) | Academic | Paper and stopwatch | Direct care 8.5%; indirect care 37.7% | Education 20.7%; information gathering 13.7%; personal 13.3%; testing 12%; consulting 12%; documenting 9.8%; transit 8.2%; procedures 5.4%; interacting with patients 3.1%; administration 1.8%. 46.7% of residents' time was spent on tasks that required a physician. |
| Lurie et al. (1989) | Academic | Paper and stopwatch | Direct care 17.4%; indirect care 39.3% | Procedures 3%; patient evaluation 20%; communication 27%; basic 40%; miscellaneous 10%. On average, doctors were interrupted 9 minutes into an H&P, got 230 minutes of sleep per night, and slept 59 minutes before being woken up by some interruption. |
| Magnusson et al. (1998) | Academic | Paper and stopwatch | Could not be determined | Clinical 54%; education 28%; personal 18%. The 3 specialties did not differ significantly in time spent on these categories except for education time: emergency 24%; internal 28%; surgery 18%. |
| Malkenson (unpublished data) | 1 Community; 1 Academic | Paper and stopwatch | Academic: direct care 19%; indirect care 56%. Community: direct care 25%; indirect care 55%. | Direct patient care (25% community, 19% academic); indirect patient care (55% community, 56% academic); personal time (4% community, 6% academic); travel time (10% community, 10% academic); other activities (10% community, 13% academic) |
| Nerenz et al. (1990) | Academic | Work sampling: paper and stopwatch | Direct care 18.9%; indirect care could not be determined | Interns averaged 21 pages over 30 hours of observation, and slept an average of 2.5 hours with 2 interruptions. Attending physicians interacted with the interns for an average of 139 minutes per shift. |
| O'Leary et al. (2006) | Academic | Paper and stopwatch | Direct care 18%; indirect care 69% | Indirect patient care occupied 69% of hospitalists' time. Indirect care included: documentation 37%; communication 35%; reviewing results 21%; orders 7%. Direct care occupied 18%, and included: history and physical 18%; follow‐up visits 53%; family meetings 13%; discharge instructions 16%. Remaining time was spent on personal activities 4%; professional development 3%; education 3%; travel 3%. |
| Parenti et al. (1993) | Academic | Paper and stopwatch | Interns: direct care 39%; indirect care 51%. Residents: direct care 40%; indirect care 47%. | Interns: procedures 4%; patient evaluation 35%; communication 42%; basics 11%; miscellaneous 8%. Residents: procedures 2%; patient evaluation 38%; communication 35%; basics 12%; miscellaneous 13%. |
| Payson et al. (1961) | Academic | Paper and stopwatch | Could not be determined | Communication with staff took up the largest amount of time. Remaining time was evenly distributed between the categories of personal activities, ancillary duties, patient and relative contact, and intravenous therapy. Overall percentages of time were not reported. |
| Westbrook et al. (2008) | Academic | PDA | Attending physicians: direct care 18.0%; indirect care 63.5%. Residents: direct care 16.0%; indirect care 66.7%. Interns: direct care 11%; indirect care 85%. | Communication 33%; social activities 17%; indirect care 17%; direct care 15%; documentation 9%; medication tasks 7%; supervision or education 7%; transit 6%; discharge summary 5%; administrative tasks 2%; answering pager 0.8% |
Methodological quality also varied. Of the 11 time‐motion studies, the total amount of time subjects were observed in the studies ranged from 48 to 720 hours, with a mean of 254 hours. The number of subjects observed varied between 1 and 35, with a mean of 12 subjects. Average time observed per subject ranged from 8 hours to 113.5 hours, with a median of 26 hours. Six of the 11 studies observed subjects continuously for an entire shift.22, 25, 2831 Four studies covered an entire shift over the course of several days, using shorter observation periods.20, 21, 26, 27 One study observed subjects for only part of a shift.32 Ten of the time‐flow articles reported collecting data with a stopwatch and paper‐and‐pencil form2022, 25, 2732 and 1 used a handheld computer system.26 Two studies utilized work‐sampling techniques, both using paper‐and‐pencil forms to collect data during a full shift. Ammenwerth and Spotl23 studied 8 physicians for a total of 40 hours, collecting 5500 observation points. Nerenz et al.24 studied 11 interns for a total of approximately 330 hours, and collected 7858 observations. Both of these studies collected sufficiently large samples to satisfy the power requirements described by Sittig.3
Study sites were relatively uniform. Only one study evaluated physicians at both a teaching community hospital and an academic hospital.32 The remaining 12 observed physicians only in academic hospitals. Two studies were conducted in Australia,25, 26 1 in Austria,23 and the remaining 10 were conducted in the United States.
To provide a rough estimate of the amount of time physicians spend on direct care activities at the patients' bedside vs. indirect care activities, we attempted to calculate these figures for each article using a common definition. For the sake of consistency and to allow us to include as many studies as possible, we used the broadest definition of indirect care found among the articles, which included activities such as professional communication, medication review, documentation, and reviewing test results. Three articles did not provide enough information to calculate these values.24, 27, 29
All 10 articles that did provide sufficient information found that indirect care activities consumed the greater portion of time. Indirect care occupied an average of 50% of physicians' time, ranging from 32% to 69%. Direct care, on the other hand, accounted for an average of 23% of physicians' time, and ranged from 8.5% to 41%. Three articles that included data specific to attending physicians or hospitalists demonstrated an even larger disparity between direct and indirect care.20, 26, 32 In these articles, physicians spent an average of 19% of their time on direct care and 64% on indirect care, suggesting that senior physicians in the academic setting spend less time with patients and more time on care activities away from patients.
Four studies recorded various forms of interruptions of work flow.20, 24, 26, 31 Lurie et al.31 found that interns and residents were interrupted approximately 9 minutes into the performance of every history and physical (H&P). Westbrook et al.26 found that residents were interrupted on average every 21 minutes regardless of the task being performed. Nerenz et al.24 reported that interns received an average of 21 pages over the course of a 30 hour shift. They also noted that, on average, 12 of these pages were merely transient distractions, but 9 pages required some action on the part of the intern.24 Finally, O'leary et al.20 found that hospitalists received an average of 3.5 pages an hour and that 7% of their day was spent returning pages. Two articles recorded events of multitasking. Westbrook et al.26 found that 20% of physicians' time was spent performing more than one activity. Similarly, O'Leary et al.20 reported that 21% of hospitalists' time was spent multitasking. Neither study reported the types of activity performed during multitasking.
One article considered the amount of time physicians spend performing tasks that could be performed by non‐physician staff. Knickman et al.21 reported that in the traditional physician‐centered model of care, approximately 19% of a resident's time is spent on tasks that could be performed by non‐physician staff. They suggested that switching to a mid‐level provider model of care could significantly reduce the impact of resident work hour restrictions.21
Parenti and Lurie28 examined internal medicine residents on both day and night shifts.31 These authors concluded that residents on the night shift have an easier time because they see fewer patients and have more down time than residents on day shifts.28 Additionally, Lurie et al. found that residents got an average of 230 minutes (3.8 hours) of sleep per night and slept, on average, 59 minutes before being awakened by an interruption.31 However, these studies preceded work hour regulations.
Discussion
This systematic review of time studies set in the hospital, the first of which we are aware, revealed a sizable number (13) of articles evaluating physicians. However, the studies almost exclusively focused on academic hospitals (92%) and the majority (69%) analyzed only the activities of physicians in training. The studies were diverse in their methodology, subject populations, and, not surprisingly, their results. Even those studies designed simply to document the activities of physicians in the hospital report widely varying findings. For example, the percentage of time physicians spent on direct‐care activities varied from 8.5% to 41%, while indirect‐care time varied from 32% to 69%. These results likely reflect the heterogeneity of the hospital environment and differences among hospitals, as well as variations in the design and quality of the studies.
Despite this variability, a few observations appear consistent. Physicians perform many tasks that may be readily accomplished by less costly staff. This could partly explain why far more time is spent on activities indirectly related to a patient's care (eg, documentation and coordinating tests), instead of directly interacting with hospitalized patients. Additionally, physicians caring for hospitalized patients experience multiple interruptions and must regularly multitask. Unfortunately, very little research in the hospital setting has evaluated the impact of these interruptions on work efficiency, medical errors, or adverse events.
With the intense national interest in improving the value of healthcare by both enhancing quality and reducing costs, further efforts to optimize the efficiency of hospitalists will be needed.33 As hospitals and hospitalists aim to enhance the efficiency of care delivery to hospitalized patients, and also are increasingly asked to expend time to optimize the hospital discharge process to reduce readmissions,34, 35 time‐motion and work‐sampling studies can provide guidance.
One of the principal difficulties in aggregating data from time studies is the variety of approaches used to analyze activities. Lack of standardization in the approach to assessing physician activities (eg, use of a stopwatch with paper documentation vs. computer) and dissimilar categorizations inhibit efforts to summarize the findings across studies. Categories of activity were generally selected with the specific goals of the study in mind, instead of utilizing a readily available standardized approach. Moreover, the lack of detailed definitions of categories and sub‐categories, along with data for each, produces a significant barrier to comparison. Based on this review of available literature and our own experience conducting time‐motion evaluation of hospitalists, we propose the basic activity categorization in Table 2. Future researchers would be able to more readily compare their findings to other time‐motion studies by utilizing such a standardized approach to categorizing physician activities. Adding custom sub‐categories within this basic set would allow researchers to explore more specific time‐flow questions while maintaining comparability of most data. Electronic data collection tools (eg, handheld or tablet computers) could also facilitate the collection of more detailed and accurate data to increase study reliability.
| Primary | Secondary | Tertiary |
|---|---|---|
| Direct patient care | Daily rounds | Evaluation |
| Education | ||
| Admission history and physical | ||
| Consultation history and physical | ||
| Discharge | Evaluation | |
| Education | ||
| Procedures | ||
| Indirect care | Reviewing test results | |
| Documentation | Orders | |
| History and physical | ||
| Progress notes | ||
| Discharge paperwork | ||
| Communication | Paging | |
| Patient relatives | ||
| Other physicians | ||
| Nurse | ||
| Ancillary staff | ||
| Other | Education | |
| Transit/travel | ||
| Personal (eg, eating, restroom) | ||
| Miscellaneous |
Our systematic review is limited in its scope, as we focused only on the activities of physicians working in the hospital. Our exclusion criteria also eliminated several more focused time studies that evaluated only one small part of a physician's workflow, such as Amusan et al.'s36 evaluation of EMR and CPOE implementation during morning rounds. The available literature itself is also lacking in several important ways. Much of the literature is now limited by its age. The constant advance of medical technology, changes in work hour regulations, and new reimbursement structures have all affected physician workflow, and likely contributed to the variability of time study findings. Additionally, the available literature focuses almost exclusively on academic hospitals and teaching services. All but 1 of the studies collected data exclusively in academic hospitals, despite the fact that more than 90% of hospital care delivery in the U.S. occurs in a non‐academic hospital setting.20, 37 Just 1 study evaluated the activity of hospitalists directly caring for patients without assistance from residents.20 The significantly different workforce composition in community hospitals could mean that most findings are not relevant to the vast majority of U.S. hospitals. For example, the studies documenting that physicians in training (ie, residents) perform many activities that could be performed by a non‐physician are likely not applicable to the community hospital setting. Thus, additional research is needed to better understand how hospitalists can deliver care more efficiently, particularly in the community hospital setting and in the current technological and structural environment of healthcare.
This systematic review of the literature provides insight into published studies attempting to evaluate physician activities in the hospital through time‐motion and work‐sampling studies. Published research to date appears extremely variable in quality, limiting our ability to draw firm conclusions. However, it appears that hospital‐based physicians spend most of their time not interacting with patients, and non‐physician staff could readily complete a sizable portion of their tasks. Given the necessity for multitasking by hospitalists, better documentation of its frequency and impact is needed, as well as information about the types of tasks performed while multitasking, which has yet to be reported. Additionally, the effect of interruptions (including, but not limited to paging) needs further evaluation.
When properly performed, time‐study methodology represents a powerful approach to understanding the activities of hospitalists and how we might reengineer hospital care delivery to be more efficient. Efforts to standardize healthcare delivery and integrate health information technology could benefit dramatically from detailed information regarding physician activities and empirical testing of quality improvement initiatives. Future research using time‐motion or work‐sampling methodology should be careful to define and report categories of activity with enough detail that comparisons with other studies are possible.
Acknowledgements
The authors acknowledge the assistance of Linda O'Dwyer, MA MSLIS, research librarian at the Northwestern University Feinberg School of Medicine for her assistance with the search of the medical literature.
- .Motion and Time Study: Design and Measurement of Work.6th ed.New York:Wiley;1968.
- .Statistical methods in textile research. Uses of the binomial and poissant distributions.J Textile Inst Trans.1935;26:51–55.
- .Work‐sampling: a statistical approach to evaluation of the effect of computers on work patterns in the healthcare industry.Proc Annu Symp Comput Appl Med Care.1992:537–541.
- , , , , , .Time motion study in a pediatric emergency department before and after computer physician order entry.Ann Emerg Med.2009;53(4):462–468, e461.
- , , , .A “time‐and‐motion” study of endoscopic practice: strategies to enhance efficiency.Gastrointest Endosc.2008;68(6):1043–1050.
- , , , , , .Workflow in intensive care unit remote monitoring: A time‐and‐motion study.Crit Care Med.2007;35(9):2057–2063.
- , , , et al.Workflow analysis of medical staff in surgical wards based on time‐motion study data.Jpn Hosp.2008(27):75–80.
- , , , , , .General and visceral surgery practice in German hospitals: a real‐time work analysis on surgeons' work flow.Langenbecks Arch Surg.2010;395(1):81–87.
- , , , et al.Electronic health records in specialty care: a time‐motion study.J Am Med Inform Assoc.2007;14(5):609–615.
- , , , .National health spending in 2007: slower drug spending contributes to lowest rate of overall growth since 1998.Health Aff (Millwood).2009;28(1):246–261.
- , .The challenge of rising health care costs–a view from the Congressional Budget Office.N Engl J Med.2007;357(18):1793–1795.
- .Nonpayment for performance? Medicare's new reimbursement rule.N Engl J Med.2007;357(16):1573–1575.
- , .Hospitalists in teaching hospitals: opportunities but not without danger.J Gen Intern Med.2004;19:392–393.
- .The future of hospital medicine: evolution or revolution?Am J Med.2004;117:446–450.
- , .The evolution and future of hospital medicine.Mt Sinai J Med.2008;75(5):418–423.
- , , , , , .Outcomes of care by hospitalists, general internists, and family physicians.[see comment].N Engl J Med.2007;357(25):2589–2600.
- , .The hospitalist movement 5 years later.JAMA.2002;287:487–494.
- , .The impact of hospitalists on the cost and quality of inpatient care in the United States: a research synthesis.Med Care Res Rev.2005;62:379–406.
- .Hospitalists and the hospital medicine system of care are good for patient care.Arch Intern Med.2008;168(12):1254–1256; discussion 1259–1260.
- , , .How hospitalists spend their time: insights on efficiency and safety.J Hosp Med.2006;1(2):88–93.
- , , , , .The potential for using non‐physicians to compensate for the reduced availability of residents.Acad Med.1992;67(7):429–438.
- , , , , , .Observations of residents' work activities for 24 consecutive hours: Implications for workflow redesign.Acad Med.2006;81(8):766–775.
- , .The time needed for clinical documentation versus direct patient care. A work‐sampling analysis of physicians' activities.Methods Inf Med.2009;48(1):84–91.
- , , , et al.The on‐call experience of interns in internal medicine. Medical Education Task Force of Henry Ford Hospital.Arch Intern Med.1990;150(11):2294–2297.
- , , .What does the intern do?Med J Aust.1976;1(3):63–65.
- , , , .All in a day's work: an observational study to quantify how and with whom doctors on hospital wards spend their time.Med J Aust.2008;188(9):506–509.
- , , , .Resident educational time study: a tale of three specialties.Acad Emerg Med.1998;5(7):718–725.
- , .Are things different in the light of day? A time study of internal medicine house staff days.Am J Med.1993;94(6):654–658.
- , , .Time study of an internship on a university medical service.N Engl J Med.1961;264:439–443.
- , .Time study comparisons of 3 intern programs.J Med Educ.1971;46(2):142–149.
- , , , , .How do house officers spend their nights? A time study of internal medicine house staff on call.N Engl J Med.1989;320(25):1673–1677.
- .The Effect of a Non‐teaching Hospitalist Service in an Academic Hospital Setting: A Comparative Time‐motion and Clinical Outcomes Study. Unpublished Manuscript. Vol2006.
- .A strategy for health care reform—toward a value‐based system.N Engl J Med.2009;361(2):109–112.
- , , .Rehospitalizations among patients in the fee‐for‐service medicare program.N Engl J Med.2009;360(14):1418–1428.
- , .BOOSTing the hospital discharge.J Hosp Med.2009;4(4):209–210.
- , , , .A time‐motion study to evaluate the impact of EMR and CPOE implementation on physician efficiency.J Healthc Inf Manag.2008;22(4):31–37.
- , , , , .The ecology of medical care revisited.N Engl J Med.2001;344(26):2021–2025.
Time‐motion studies, introduced by Frederick W. Taylor in the 1880s,1 have been widely implemented across the business world; a Google search of time‐motion study returns approximately 32 million results. Such studies continuously document how workers spend their time and then use this information to identify and eliminate inefficient practices. Work‐sampling is a similar methodology introduced by L.H.C. Tippett in 1935.2 Work‐sampling utilizes a trained observer to document activities at predetermined or random intervals of time. Given a large enough number of observations, this method can be comparable to the continuous observation method used in time‐motion studies.3
Healthcare has begun to utilize these time‐study methodologies to evaluate the activities of physicians and nurses. Researchers have successfully used time‐study methodology in the emergency department, intensive care unit, and ambulatory and surgical settings in the U.S. and around the world to better understand physician activities and to design and assess interventions to improve efficiency.49 Hospitals are also eager to enhance efficiency in the inpatient setting given the current economic environment. Hospitalizations account for over a third of healthcare costs in the United States, making them an attractive target for cost‐cutting measures.10 Acknowledging that healthcare expenditures cannot continue to rise,11 insurers, particularly the Centers for Medicare and Medicaid Services (CMS), increasingly seek to reduce payments to hospitals.12 Compounding these pressures, a major supply of relatively inexpensive labor shrank with the decision by the Accreditation Council for Graduate Medicine Education (ACGME) to restrict the number of hours residents are allowed to work. Efficiency concerns gain new urgency as hospitals scramble to cover their patient loads with reduced physician availability.13
We undertook a systematic review of time‐motion and work‐sampling studies performed in the hospital setting to better understand the available literature describing the activities of physicians caring for hospitalized patients. An additional goal of this review was to determine the extent of available time‐flow literature describing the activity of hospitalists. The hospitalist movement provided one viable solution to the gap between demand for hospital patient care and the reduced supply of available physicianstypically primary care physicians in community hospitals and residents in teaching hospitals.14 Hospital medicine is the fastest‐growing specialty in the history of American medicine.15 More than half of American hospitals now have hospital medicine programs with a total of greater than 25,000 hospitalists in the U.S.15 This popularity has been driven by hospitalists' ability to increase efficiency through decreasing overall cost and length of stay for patients without increasing readmission rates or reducing primary care physician satisfaction.1619 However, exactly how hospitalists accomplish this increase in efficiency is still the subject of debate. One time‐motion study provides a glimpse into the activities of hospitalists at an academic urban hospital,20 but may not be applicable to many other hospitals.
Methods
Data Sources
With assistance from a medical librarian, we searched for English‐language articles published between 1965 and June 2009 using the MEDLINE (
Study Selection
We selected articles that met the following criteria: (1) explicit use of time‐motion methodology or work‐sampling performed via direct observation; (2) study populations including physicians, medical residents, or interns; (3) performance sites on an inpatient hospital ward (ie, not outpatient within the hospital, emergency room (ER), or operating room (OR)); and (4) observation of at least half of a shift. Titles and abstracts of the retrieved citations were first reviewed to identify studies that could potentially meet our criteria. Full‐text versions of the selected articles were then retrieved and analyzed by at least 2 of 4 authors (V.F., K.E., D.M., and M.T.) to determine the final list of articles. Articles that failed to provide sufficient information for one or more criteria were excluded.
Data Extraction
Each article was independently reviewed by at least 2 of 3 authors (V.F., D.M., and M.T.) using a standardized data abstraction form. The form included the following categories: sample population, sample size, hospital type, data collection tool type, time‐motion/observation duration, key categories of activity, and key results. If an article included additional data beyond the scope of this review (eg, data from surgical residents in the OR as well as internal medicine residents) only the qualifying portion of the study was included. Disagreements were resolved through discussion and consensus. Data were then compiled into tables.
Results
Our database search yielded 4270 potential articles. We then reviewed the title and abstract of each of these articles to identify studies that evaluated physicians, were performed on a hospital ward, and explicitly used time‐motion or direct‐observation work‐sampling methodology. For articles lacking an abstract but having a relevant title, we obtained the full text to determine eligibility for additional review. Sixty‐eight articles from this original search were selected for full‐text review. Ten of these articles met the selection criteria. Most of the articles excluded in this step were either conducted in an outpatient OR or ER setting, or used self‐report data instead of direct‐observation data. A secondary search using the reference lists of all obtained articles as well as consultation with experts in the field yielded 11 additional articles of interest. Three of these 11 articles were found to meet our criteria, bringing the total to 13 articles for review (Fig. 1).
These 13 articles included several types of physicians in their samples. Eleven included interns,2131 7 included residents,2123, 2628, 31 and 4 included attending physicians20, 23, 26, 32 (Table 1). Six articles included more than 1 type of subject.2123, 26, 28, 31 The main focus of these articles also varied. Nine of the 13 studies were designed to simply describe how residents, physicians and nurses spend their time.20, 2227, 29, 31 Three studies were primarily concerned with comparing groups from different intern programs, residency rotations, hospital types, or shifts.28, 30, 32 The remaining study attempted to quantify the amount of time physicians spent on tasks that could be performed by non‐physician staff.21 Only 2 articles evaluated hospitalists,20, 32 and we found no articles studying hospitalists in a community, non‐teaching setting. The studies were performed as early as 1961 and as recently as 2009. Just 5 of the 13 articles were published within the last 10 years. 0
| Reference (Year) | Type of Hospital | Data Collection Tool | Direct/Indirect Care Estimates | Key Activities Reported and Percentage of Time Spent on Each, and Other Results |
|---|---|---|---|---|
| ||||
| Ammenwerth and Spotl (2009) | Academic | Work sampling: paper and stopwatch | Direct care 27.5%; indirect care 62.8% | Documentation tasks 26.6%; direct care 27.5%; communication 36.2%; other tasks 9.7%. Approximately 16% of documentation time was administrative documentation. |
| Arthurson et al. (1976) | Academic | Paper and stopwatch | Direct care 40.8%; indirect care 45.5% | Medical intern: patient care 40.8%; clerical 25.5%; telephone 10%; professional discussion 10.5%; transit/waiting 6.5%, personal 7% |
| Gabow et al. (2006) | Academic | Paper and stopwatch with pedometer | Direct care 19.5%; indirect care: 32% | Attend to/assess patient 17%; charting 9.5%; consult with MD/nurse 9.5%; downtime 6.5%; educational activity 2.5%; family interaction 0.5%; paging/phone 3.5%; procedure 1.5%; review films/laboratory results 9%; rounds 15.5%; sleep 21.5%; travel 3.5% |
| Gillanders et al. (1971) | Academic | Paper and stopwatch | Direct care 19%; indirect care 42.5% | Individual interaction 14.5%; nonverbal communication 20.5%; procedures 10.0%; laboratory work 3.5%; interpersonal communication 18.5%; rounds 9%; direction and supervision 0.5%; nonmedical talk 2%; education 8.5%; ancillary activities 5.5%; personal 7% |
| Knickman et al. (1992) | Academic | Paper and stopwatch | Direct care 8.5%; indirect care 37.7% | Education 20.7%; information gathering 13.7%; personal 13.3%; testing 12%; consulting 12%; documenting 9.8%; transit 8.2%; procedures 5.4%; interacting with patients 3.1%; administration 1.8%. 46.7% of residents' time was spent on tasks that required a physician. |
| Lurie et al. (1989) | Academic | Paper and stopwatch | Direct care 17.4%; indirect care 39.3% | Procedures 3%; patient evaluation 20%; communication 27%; basic 40%; miscellaneous 10%. On average, doctors were interrupted 9 minutes into an H&P, got 230 minutes of sleep per night, and slept 59 minutes before being woken up by some interruption. |
| Magnusson et al. (1998) | Academic | Paper and stopwatch | Could not be determined | Clinical 54%; education 28%; personal 18%. The 3 specialties did not differ significantly in time spent on these categories except for education time: emergency 24%; internal 28%; surgery 18%. |
| Malkenson (unpublished data) | 1 Community; 1 Academic | Paper and stopwatch | Academic: direct care 19%; indirect care 56%. Community: direct care 25%; indirect care 55%. | Direct patient care (25% community, 19% academic); indirect patient care (55% community, 56% academic); personal time (4% community, 6% academic); travel time (10% community, 10% academic); other activities (10% community, 13% academic) |
| Nerenz et al. (1990) | Academic | Work sampling: paper and stopwatch | Direct care 18.9%; indirect care could not be determined | Interns averaged 21 pages over 30 hours of observation, and slept an average of 2.5 hours with 2 interruptions. Attending physicians interacted with the interns for an average of 139 minutes per shift. |
| O'Leary et al. (2006) | Academic | Paper and stopwatch | Direct care 18%; indirect care 69% | Indirect patient care occupied 69% of hospitalists' time. Indirect care included: documentation 37%; communication 35%; reviewing results 21%; orders 7%. Direct care occupied 18%, and included: history and physical 18%; follow‐up visits 53%; family meetings 13%; discharge instructions 16%. Remaining time was spent on personal activities 4%; professional development 3%; education 3%; travel 3%. |
| Parenti et al. (1993) | Academic | Paper and stopwatch | Interns: direct care 39%; indirect care 51%. Residents: direct care 40%; indirect care 47%. | Interns: procedures 4%; patient evaluation 35%; communication 42%; basics 11%; miscellaneous 8%. Residents: procedures 2%; patient evaluation 38%; communication 35%; basics 12%; miscellaneous 13%. |
| Payson et al. (1961) | Academic | Paper and stopwatch | Could not be determined | Communication with staff took up the largest amount of time. Remaining time was evenly distributed between the categories of personal activities, ancillary duties, patient and relative contact, and intravenous therapy. Overall percentages of time were not reported. |
| Westbrook et al. (2008) | Academic | PDA | Attending physicians: direct care 18.0%; indirect care 63.5%. Residents: direct care 16.0%; indirect care 66.7%. Interns: direct care 11%; indirect care 85%. | Communication 33%; social activities 17%; indirect care 17%; direct care 15%; documentation 9%; medication tasks 7%; supervision or education 7%; transit 6%; discharge summary 5%; administrative tasks 2%; answering pager 0.8% |
Methodological quality also varied. Of the 11 time‐motion studies, the total amount of time subjects were observed in the studies ranged from 48 to 720 hours, with a mean of 254 hours. The number of subjects observed varied between 1 and 35, with a mean of 12 subjects. Average time observed per subject ranged from 8 hours to 113.5 hours, with a median of 26 hours. Six of the 11 studies observed subjects continuously for an entire shift.22, 25, 2831 Four studies covered an entire shift over the course of several days, using shorter observation periods.20, 21, 26, 27 One study observed subjects for only part of a shift.32 Ten of the time‐flow articles reported collecting data with a stopwatch and paper‐and‐pencil form2022, 25, 2732 and 1 used a handheld computer system.26 Two studies utilized work‐sampling techniques, both using paper‐and‐pencil forms to collect data during a full shift. Ammenwerth and Spotl23 studied 8 physicians for a total of 40 hours, collecting 5500 observation points. Nerenz et al.24 studied 11 interns for a total of approximately 330 hours, and collected 7858 observations. Both of these studies collected sufficiently large samples to satisfy the power requirements described by Sittig.3
Study sites were relatively uniform. Only one study evaluated physicians at both a teaching community hospital and an academic hospital.32 The remaining 12 observed physicians only in academic hospitals. Two studies were conducted in Australia,25, 26 1 in Austria,23 and the remaining 10 were conducted in the United States.
To provide a rough estimate of the amount of time physicians spend on direct care activities at the patients' bedside vs. indirect care activities, we attempted to calculate these figures for each article using a common definition. For the sake of consistency and to allow us to include as many studies as possible, we used the broadest definition of indirect care found among the articles, which included activities such as professional communication, medication review, documentation, and reviewing test results. Three articles did not provide enough information to calculate these values.24, 27, 29
All 10 articles that did provide sufficient information found that indirect care activities consumed the greater portion of time. Indirect care occupied an average of 50% of physicians' time, ranging from 32% to 69%. Direct care, on the other hand, accounted for an average of 23% of physicians' time, and ranged from 8.5% to 41%. Three articles that included data specific to attending physicians or hospitalists demonstrated an even larger disparity between direct and indirect care.20, 26, 32 In these articles, physicians spent an average of 19% of their time on direct care and 64% on indirect care, suggesting that senior physicians in the academic setting spend less time with patients and more time on care activities away from patients.
Four studies recorded various forms of interruptions of work flow.20, 24, 26, 31 Lurie et al.31 found that interns and residents were interrupted approximately 9 minutes into the performance of every history and physical (H&P). Westbrook et al.26 found that residents were interrupted on average every 21 minutes regardless of the task being performed. Nerenz et al.24 reported that interns received an average of 21 pages over the course of a 30 hour shift. They also noted that, on average, 12 of these pages were merely transient distractions, but 9 pages required some action on the part of the intern.24 Finally, O'leary et al.20 found that hospitalists received an average of 3.5 pages an hour and that 7% of their day was spent returning pages. Two articles recorded events of multitasking. Westbrook et al.26 found that 20% of physicians' time was spent performing more than one activity. Similarly, O'Leary et al.20 reported that 21% of hospitalists' time was spent multitasking. Neither study reported the types of activity performed during multitasking.
One article considered the amount of time physicians spend performing tasks that could be performed by non‐physician staff. Knickman et al.21 reported that in the traditional physician‐centered model of care, approximately 19% of a resident's time is spent on tasks that could be performed by non‐physician staff. They suggested that switching to a mid‐level provider model of care could significantly reduce the impact of resident work hour restrictions.21
Parenti and Lurie28 examined internal medicine residents on both day and night shifts.31 These authors concluded that residents on the night shift have an easier time because they see fewer patients and have more down time than residents on day shifts.28 Additionally, Lurie et al. found that residents got an average of 230 minutes (3.8 hours) of sleep per night and slept, on average, 59 minutes before being awakened by an interruption.31 However, these studies preceded work hour regulations.
Discussion
This systematic review of time studies set in the hospital, the first of which we are aware, revealed a sizable number (13) of articles evaluating physicians. However, the studies almost exclusively focused on academic hospitals (92%) and the majority (69%) analyzed only the activities of physicians in training. The studies were diverse in their methodology, subject populations, and, not surprisingly, their results. Even those studies designed simply to document the activities of physicians in the hospital report widely varying findings. For example, the percentage of time physicians spent on direct‐care activities varied from 8.5% to 41%, while indirect‐care time varied from 32% to 69%. These results likely reflect the heterogeneity of the hospital environment and differences among hospitals, as well as variations in the design and quality of the studies.
Despite this variability, a few observations appear consistent. Physicians perform many tasks that may be readily accomplished by less costly staff. This could partly explain why far more time is spent on activities indirectly related to a patient's care (eg, documentation and coordinating tests), instead of directly interacting with hospitalized patients. Additionally, physicians caring for hospitalized patients experience multiple interruptions and must regularly multitask. Unfortunately, very little research in the hospital setting has evaluated the impact of these interruptions on work efficiency, medical errors, or adverse events.
With the intense national interest in improving the value of healthcare by both enhancing quality and reducing costs, further efforts to optimize the efficiency of hospitalists will be needed.33 As hospitals and hospitalists aim to enhance the efficiency of care delivery to hospitalized patients, and also are increasingly asked to expend time to optimize the hospital discharge process to reduce readmissions,34, 35 time‐motion and work‐sampling studies can provide guidance.
One of the principal difficulties in aggregating data from time studies is the variety of approaches used to analyze activities. Lack of standardization in the approach to assessing physician activities (eg, use of a stopwatch with paper documentation vs. computer) and dissimilar categorizations inhibit efforts to summarize the findings across studies. Categories of activity were generally selected with the specific goals of the study in mind, instead of utilizing a readily available standardized approach. Moreover, the lack of detailed definitions of categories and sub‐categories, along with data for each, produces a significant barrier to comparison. Based on this review of available literature and our own experience conducting time‐motion evaluation of hospitalists, we propose the basic activity categorization in Table 2. Future researchers would be able to more readily compare their findings to other time‐motion studies by utilizing such a standardized approach to categorizing physician activities. Adding custom sub‐categories within this basic set would allow researchers to explore more specific time‐flow questions while maintaining comparability of most data. Electronic data collection tools (eg, handheld or tablet computers) could also facilitate the collection of more detailed and accurate data to increase study reliability.
| Primary | Secondary | Tertiary |
|---|---|---|
| Direct patient care | Daily rounds | Evaluation |
| Education | ||
| Admission history and physical | ||
| Consultation history and physical | ||
| Discharge | Evaluation | |
| Education | ||
| Procedures | ||
| Indirect care | Reviewing test results | |
| Documentation | Orders | |
| History and physical | ||
| Progress notes | ||
| Discharge paperwork | ||
| Communication | Paging | |
| Patient relatives | ||
| Other physicians | ||
| Nurse | ||
| Ancillary staff | ||
| Other | Education | |
| Transit/travel | ||
| Personal (eg, eating, restroom) | ||
| Miscellaneous |
Our systematic review is limited in its scope, as we focused only on the activities of physicians working in the hospital. Our exclusion criteria also eliminated several more focused time studies that evaluated only one small part of a physician's workflow, such as Amusan et al.'s36 evaluation of EMR and CPOE implementation during morning rounds. The available literature itself is also lacking in several important ways. Much of the literature is now limited by its age. The constant advance of medical technology, changes in work hour regulations, and new reimbursement structures have all affected physician workflow, and likely contributed to the variability of time study findings. Additionally, the available literature focuses almost exclusively on academic hospitals and teaching services. All but 1 of the studies collected data exclusively in academic hospitals, despite the fact that more than 90% of hospital care delivery in the U.S. occurs in a non‐academic hospital setting.20, 37 Just 1 study evaluated the activity of hospitalists directly caring for patients without assistance from residents.20 The significantly different workforce composition in community hospitals could mean that most findings are not relevant to the vast majority of U.S. hospitals. For example, the studies documenting that physicians in training (ie, residents) perform many activities that could be performed by a non‐physician are likely not applicable to the community hospital setting. Thus, additional research is needed to better understand how hospitalists can deliver care more efficiently, particularly in the community hospital setting and in the current technological and structural environment of healthcare.
This systematic review of the literature provides insight into published studies attempting to evaluate physician activities in the hospital through time‐motion and work‐sampling studies. Published research to date appears extremely variable in quality, limiting our ability to draw firm conclusions. However, it appears that hospital‐based physicians spend most of their time not interacting with patients, and non‐physician staff could readily complete a sizable portion of their tasks. Given the necessity for multitasking by hospitalists, better documentation of its frequency and impact is needed, as well as information about the types of tasks performed while multitasking, which has yet to be reported. Additionally, the effect of interruptions (including, but not limited to paging) needs further evaluation.
When properly performed, time‐study methodology represents a powerful approach to understanding the activities of hospitalists and how we might reengineer hospital care delivery to be more efficient. Efforts to standardize healthcare delivery and integrate health information technology could benefit dramatically from detailed information regarding physician activities and empirical testing of quality improvement initiatives. Future research using time‐motion or work‐sampling methodology should be careful to define and report categories of activity with enough detail that comparisons with other studies are possible.
Acknowledgements
The authors acknowledge the assistance of Linda O'Dwyer, MA MSLIS, research librarian at the Northwestern University Feinberg School of Medicine for her assistance with the search of the medical literature.
Time‐motion studies, introduced by Frederick W. Taylor in the 1880s,1 have been widely implemented across the business world; a Google search of time‐motion study returns approximately 32 million results. Such studies continuously document how workers spend their time and then use this information to identify and eliminate inefficient practices. Work‐sampling is a similar methodology introduced by L.H.C. Tippett in 1935.2 Work‐sampling utilizes a trained observer to document activities at predetermined or random intervals of time. Given a large enough number of observations, this method can be comparable to the continuous observation method used in time‐motion studies.3
Healthcare has begun to utilize these time‐study methodologies to evaluate the activities of physicians and nurses. Researchers have successfully used time‐study methodology in the emergency department, intensive care unit, and ambulatory and surgical settings in the U.S. and around the world to better understand physician activities and to design and assess interventions to improve efficiency.49 Hospitals are also eager to enhance efficiency in the inpatient setting given the current economic environment. Hospitalizations account for over a third of healthcare costs in the United States, making them an attractive target for cost‐cutting measures.10 Acknowledging that healthcare expenditures cannot continue to rise,11 insurers, particularly the Centers for Medicare and Medicaid Services (CMS), increasingly seek to reduce payments to hospitals.12 Compounding these pressures, a major supply of relatively inexpensive labor shrank with the decision by the Accreditation Council for Graduate Medicine Education (ACGME) to restrict the number of hours residents are allowed to work. Efficiency concerns gain new urgency as hospitals scramble to cover their patient loads with reduced physician availability.13
We undertook a systematic review of time‐motion and work‐sampling studies performed in the hospital setting to better understand the available literature describing the activities of physicians caring for hospitalized patients. An additional goal of this review was to determine the extent of available time‐flow literature describing the activity of hospitalists. The hospitalist movement provided one viable solution to the gap between demand for hospital patient care and the reduced supply of available physicianstypically primary care physicians in community hospitals and residents in teaching hospitals.14 Hospital medicine is the fastest‐growing specialty in the history of American medicine.15 More than half of American hospitals now have hospital medicine programs with a total of greater than 25,000 hospitalists in the U.S.15 This popularity has been driven by hospitalists' ability to increase efficiency through decreasing overall cost and length of stay for patients without increasing readmission rates or reducing primary care physician satisfaction.1619 However, exactly how hospitalists accomplish this increase in efficiency is still the subject of debate. One time‐motion study provides a glimpse into the activities of hospitalists at an academic urban hospital,20 but may not be applicable to many other hospitals.
Methods
Data Sources
With assistance from a medical librarian, we searched for English‐language articles published between 1965 and June 2009 using the MEDLINE (
Study Selection
We selected articles that met the following criteria: (1) explicit use of time‐motion methodology or work‐sampling performed via direct observation; (2) study populations including physicians, medical residents, or interns; (3) performance sites on an inpatient hospital ward (ie, not outpatient within the hospital, emergency room (ER), or operating room (OR)); and (4) observation of at least half of a shift. Titles and abstracts of the retrieved citations were first reviewed to identify studies that could potentially meet our criteria. Full‐text versions of the selected articles were then retrieved and analyzed by at least 2 of 4 authors (V.F., K.E., D.M., and M.T.) to determine the final list of articles. Articles that failed to provide sufficient information for one or more criteria were excluded.
Data Extraction
Each article was independently reviewed by at least 2 of 3 authors (V.F., D.M., and M.T.) using a standardized data abstraction form. The form included the following categories: sample population, sample size, hospital type, data collection tool type, time‐motion/observation duration, key categories of activity, and key results. If an article included additional data beyond the scope of this review (eg, data from surgical residents in the OR as well as internal medicine residents) only the qualifying portion of the study was included. Disagreements were resolved through discussion and consensus. Data were then compiled into tables.
Results
Our database search yielded 4270 potential articles. We then reviewed the title and abstract of each of these articles to identify studies that evaluated physicians, were performed on a hospital ward, and explicitly used time‐motion or direct‐observation work‐sampling methodology. For articles lacking an abstract but having a relevant title, we obtained the full text to determine eligibility for additional review. Sixty‐eight articles from this original search were selected for full‐text review. Ten of these articles met the selection criteria. Most of the articles excluded in this step were either conducted in an outpatient OR or ER setting, or used self‐report data instead of direct‐observation data. A secondary search using the reference lists of all obtained articles as well as consultation with experts in the field yielded 11 additional articles of interest. Three of these 11 articles were found to meet our criteria, bringing the total to 13 articles for review (Fig. 1).
These 13 articles included several types of physicians in their samples. Eleven included interns,2131 7 included residents,2123, 2628, 31 and 4 included attending physicians20, 23, 26, 32 (Table 1). Six articles included more than 1 type of subject.2123, 26, 28, 31 The main focus of these articles also varied. Nine of the 13 studies were designed to simply describe how residents, physicians and nurses spend their time.20, 2227, 29, 31 Three studies were primarily concerned with comparing groups from different intern programs, residency rotations, hospital types, or shifts.28, 30, 32 The remaining study attempted to quantify the amount of time physicians spent on tasks that could be performed by non‐physician staff.21 Only 2 articles evaluated hospitalists,20, 32 and we found no articles studying hospitalists in a community, non‐teaching setting. The studies were performed as early as 1961 and as recently as 2009. Just 5 of the 13 articles were published within the last 10 years. 0
| Reference (Year) | Type of Hospital | Data Collection Tool | Direct/Indirect Care Estimates | Key Activities Reported and Percentage of Time Spent on Each, and Other Results |
|---|---|---|---|---|
| ||||
| Ammenwerth and Spotl (2009) | Academic | Work sampling: paper and stopwatch | Direct care 27.5%; indirect care 62.8% | Documentation tasks 26.6%; direct care 27.5%; communication 36.2%; other tasks 9.7%. Approximately 16% of documentation time was administrative documentation. |
| Arthurson et al. (1976) | Academic | Paper and stopwatch | Direct care 40.8%; indirect care 45.5% | Medical intern: patient care 40.8%; clerical 25.5%; telephone 10%; professional discussion 10.5%; transit/waiting 6.5%, personal 7% |
| Gabow et al. (2006) | Academic | Paper and stopwatch with pedometer | Direct care 19.5%; indirect care: 32% | Attend to/assess patient 17%; charting 9.5%; consult with MD/nurse 9.5%; downtime 6.5%; educational activity 2.5%; family interaction 0.5%; paging/phone 3.5%; procedure 1.5%; review films/laboratory results 9%; rounds 15.5%; sleep 21.5%; travel 3.5% |
| Gillanders et al. (1971) | Academic | Paper and stopwatch | Direct care 19%; indirect care 42.5% | Individual interaction 14.5%; nonverbal communication 20.5%; procedures 10.0%; laboratory work 3.5%; interpersonal communication 18.5%; rounds 9%; direction and supervision 0.5%; nonmedical talk 2%; education 8.5%; ancillary activities 5.5%; personal 7% |
| Knickman et al. (1992) | Academic | Paper and stopwatch | Direct care 8.5%; indirect care 37.7% | Education 20.7%; information gathering 13.7%; personal 13.3%; testing 12%; consulting 12%; documenting 9.8%; transit 8.2%; procedures 5.4%; interacting with patients 3.1%; administration 1.8%. 46.7% of residents' time was spent on tasks that required a physician. |
| Lurie et al. (1989) | Academic | Paper and stopwatch | Direct care 17.4%; indirect care 39.3% | Procedures 3%; patient evaluation 20%; communication 27%; basic 40%; miscellaneous 10%. On average, doctors were interrupted 9 minutes into an H&P, got 230 minutes of sleep per night, and slept 59 minutes before being woken up by some interruption. |
| Magnusson et al. (1998) | Academic | Paper and stopwatch | Could not be determined | Clinical 54%; education 28%; personal 18%. The 3 specialties did not differ significantly in time spent on these categories except for education time: emergency 24%; internal 28%; surgery 18%. |
| Malkenson (unpublished data) | 1 Community; 1 Academic | Paper and stopwatch | Academic: direct care 19%; indirect care 56%. Community: direct care 25%; indirect care 55%. | Direct patient care (25% community, 19% academic); indirect patient care (55% community, 56% academic); personal time (4% community, 6% academic); travel time (10% community, 10% academic); other activities (10% community, 13% academic) |
| Nerenz et al. (1990) | Academic | Work sampling: paper and stopwatch | Direct care 18.9%; indirect care could not be determined | Interns averaged 21 pages over 30 hours of observation, and slept an average of 2.5 hours with 2 interruptions. Attending physicians interacted with the interns for an average of 139 minutes per shift. |
| O'Leary et al. (2006) | Academic | Paper and stopwatch | Direct care 18%; indirect care 69% | Indirect patient care occupied 69% of hospitalists' time. Indirect care included: documentation 37%; communication 35%; reviewing results 21%; orders 7%. Direct care occupied 18%, and included: history and physical 18%; follow‐up visits 53%; family meetings 13%; discharge instructions 16%. Remaining time was spent on personal activities 4%; professional development 3%; education 3%; travel 3%. |
| Parenti et al. (1993) | Academic | Paper and stopwatch | Interns: direct care 39%; indirect care 51%. Residents: direct care 40%; indirect care 47%. | Interns: procedures 4%; patient evaluation 35%; communication 42%; basics 11%; miscellaneous 8%. Residents: procedures 2%; patient evaluation 38%; communication 35%; basics 12%; miscellaneous 13%. |
| Payson et al. (1961) | Academic | Paper and stopwatch | Could not be determined | Communication with staff took up the largest amount of time. Remaining time was evenly distributed between the categories of personal activities, ancillary duties, patient and relative contact, and intravenous therapy. Overall percentages of time were not reported. |
| Westbrook et al. (2008) | Academic | PDA | Attending physicians: direct care 18.0%; indirect care 63.5%. Residents: direct care 16.0%; indirect care 66.7%. Interns: direct care 11%; indirect care 85%. | Communication 33%; social activities 17%; indirect care 17%; direct care 15%; documentation 9%; medication tasks 7%; supervision or education 7%; transit 6%; discharge summary 5%; administrative tasks 2%; answering pager 0.8% |
Methodological quality also varied. Of the 11 time‐motion studies, the total amount of time subjects were observed in the studies ranged from 48 to 720 hours, with a mean of 254 hours. The number of subjects observed varied between 1 and 35, with a mean of 12 subjects. Average time observed per subject ranged from 8 hours to 113.5 hours, with a median of 26 hours. Six of the 11 studies observed subjects continuously for an entire shift.22, 25, 2831 Four studies covered an entire shift over the course of several days, using shorter observation periods.20, 21, 26, 27 One study observed subjects for only part of a shift.32 Ten of the time‐flow articles reported collecting data with a stopwatch and paper‐and‐pencil form2022, 25, 2732 and 1 used a handheld computer system.26 Two studies utilized work‐sampling techniques, both using paper‐and‐pencil forms to collect data during a full shift. Ammenwerth and Spotl23 studied 8 physicians for a total of 40 hours, collecting 5500 observation points. Nerenz et al.24 studied 11 interns for a total of approximately 330 hours, and collected 7858 observations. Both of these studies collected sufficiently large samples to satisfy the power requirements described by Sittig.3
Study sites were relatively uniform. Only one study evaluated physicians at both a teaching community hospital and an academic hospital.32 The remaining 12 observed physicians only in academic hospitals. Two studies were conducted in Australia,25, 26 1 in Austria,23 and the remaining 10 were conducted in the United States.
To provide a rough estimate of the amount of time physicians spend on direct care activities at the patients' bedside vs. indirect care activities, we attempted to calculate these figures for each article using a common definition. For the sake of consistency and to allow us to include as many studies as possible, we used the broadest definition of indirect care found among the articles, which included activities such as professional communication, medication review, documentation, and reviewing test results. Three articles did not provide enough information to calculate these values.24, 27, 29
All 10 articles that did provide sufficient information found that indirect care activities consumed the greater portion of time. Indirect care occupied an average of 50% of physicians' time, ranging from 32% to 69%. Direct care, on the other hand, accounted for an average of 23% of physicians' time, and ranged from 8.5% to 41%. Three articles that included data specific to attending physicians or hospitalists demonstrated an even larger disparity between direct and indirect care.20, 26, 32 In these articles, physicians spent an average of 19% of their time on direct care and 64% on indirect care, suggesting that senior physicians in the academic setting spend less time with patients and more time on care activities away from patients.
Four studies recorded various forms of interruptions of work flow.20, 24, 26, 31 Lurie et al.31 found that interns and residents were interrupted approximately 9 minutes into the performance of every history and physical (H&P). Westbrook et al.26 found that residents were interrupted on average every 21 minutes regardless of the task being performed. Nerenz et al.24 reported that interns received an average of 21 pages over the course of a 30 hour shift. They also noted that, on average, 12 of these pages were merely transient distractions, but 9 pages required some action on the part of the intern.24 Finally, O'leary et al.20 found that hospitalists received an average of 3.5 pages an hour and that 7% of their day was spent returning pages. Two articles recorded events of multitasking. Westbrook et al.26 found that 20% of physicians' time was spent performing more than one activity. Similarly, O'Leary et al.20 reported that 21% of hospitalists' time was spent multitasking. Neither study reported the types of activity performed during multitasking.
One article considered the amount of time physicians spend performing tasks that could be performed by non‐physician staff. Knickman et al.21 reported that in the traditional physician‐centered model of care, approximately 19% of a resident's time is spent on tasks that could be performed by non‐physician staff. They suggested that switching to a mid‐level provider model of care could significantly reduce the impact of resident work hour restrictions.21
Parenti and Lurie28 examined internal medicine residents on both day and night shifts.31 These authors concluded that residents on the night shift have an easier time because they see fewer patients and have more down time than residents on day shifts.28 Additionally, Lurie et al. found that residents got an average of 230 minutes (3.8 hours) of sleep per night and slept, on average, 59 minutes before being awakened by an interruption.31 However, these studies preceded work hour regulations.
Discussion
This systematic review of time studies set in the hospital, the first of which we are aware, revealed a sizable number (13) of articles evaluating physicians. However, the studies almost exclusively focused on academic hospitals (92%) and the majority (69%) analyzed only the activities of physicians in training. The studies were diverse in their methodology, subject populations, and, not surprisingly, their results. Even those studies designed simply to document the activities of physicians in the hospital report widely varying findings. For example, the percentage of time physicians spent on direct‐care activities varied from 8.5% to 41%, while indirect‐care time varied from 32% to 69%. These results likely reflect the heterogeneity of the hospital environment and differences among hospitals, as well as variations in the design and quality of the studies.
Despite this variability, a few observations appear consistent. Physicians perform many tasks that may be readily accomplished by less costly staff. This could partly explain why far more time is spent on activities indirectly related to a patient's care (eg, documentation and coordinating tests), instead of directly interacting with hospitalized patients. Additionally, physicians caring for hospitalized patients experience multiple interruptions and must regularly multitask. Unfortunately, very little research in the hospital setting has evaluated the impact of these interruptions on work efficiency, medical errors, or adverse events.
With the intense national interest in improving the value of healthcare by both enhancing quality and reducing costs, further efforts to optimize the efficiency of hospitalists will be needed.33 As hospitals and hospitalists aim to enhance the efficiency of care delivery to hospitalized patients, and also are increasingly asked to expend time to optimize the hospital discharge process to reduce readmissions,34, 35 time‐motion and work‐sampling studies can provide guidance.
One of the principal difficulties in aggregating data from time studies is the variety of approaches used to analyze activities. Lack of standardization in the approach to assessing physician activities (eg, use of a stopwatch with paper documentation vs. computer) and dissimilar categorizations inhibit efforts to summarize the findings across studies. Categories of activity were generally selected with the specific goals of the study in mind, instead of utilizing a readily available standardized approach. Moreover, the lack of detailed definitions of categories and sub‐categories, along with data for each, produces a significant barrier to comparison. Based on this review of available literature and our own experience conducting time‐motion evaluation of hospitalists, we propose the basic activity categorization in Table 2. Future researchers would be able to more readily compare their findings to other time‐motion studies by utilizing such a standardized approach to categorizing physician activities. Adding custom sub‐categories within this basic set would allow researchers to explore more specific time‐flow questions while maintaining comparability of most data. Electronic data collection tools (eg, handheld or tablet computers) could also facilitate the collection of more detailed and accurate data to increase study reliability.
| Primary | Secondary | Tertiary |
|---|---|---|
| Direct patient care | Daily rounds | Evaluation |
| Education | ||
| Admission history and physical | ||
| Consultation history and physical | ||
| Discharge | Evaluation | |
| Education | ||
| Procedures | ||
| Indirect care | Reviewing test results | |
| Documentation | Orders | |
| History and physical | ||
| Progress notes | ||
| Discharge paperwork | ||
| Communication | Paging | |
| Patient relatives | ||
| Other physicians | ||
| Nurse | ||
| Ancillary staff | ||
| Other | Education | |
| Transit/travel | ||
| Personal (eg, eating, restroom) | ||
| Miscellaneous |
Our systematic review is limited in its scope, as we focused only on the activities of physicians working in the hospital. Our exclusion criteria also eliminated several more focused time studies that evaluated only one small part of a physician's workflow, such as Amusan et al.'s36 evaluation of EMR and CPOE implementation during morning rounds. The available literature itself is also lacking in several important ways. Much of the literature is now limited by its age. The constant advance of medical technology, changes in work hour regulations, and new reimbursement structures have all affected physician workflow, and likely contributed to the variability of time study findings. Additionally, the available literature focuses almost exclusively on academic hospitals and teaching services. All but 1 of the studies collected data exclusively in academic hospitals, despite the fact that more than 90% of hospital care delivery in the U.S. occurs in a non‐academic hospital setting.20, 37 Just 1 study evaluated the activity of hospitalists directly caring for patients without assistance from residents.20 The significantly different workforce composition in community hospitals could mean that most findings are not relevant to the vast majority of U.S. hospitals. For example, the studies documenting that physicians in training (ie, residents) perform many activities that could be performed by a non‐physician are likely not applicable to the community hospital setting. Thus, additional research is needed to better understand how hospitalists can deliver care more efficiently, particularly in the community hospital setting and in the current technological and structural environment of healthcare.
This systematic review of the literature provides insight into published studies attempting to evaluate physician activities in the hospital through time‐motion and work‐sampling studies. Published research to date appears extremely variable in quality, limiting our ability to draw firm conclusions. However, it appears that hospital‐based physicians spend most of their time not interacting with patients, and non‐physician staff could readily complete a sizable portion of their tasks. Given the necessity for multitasking by hospitalists, better documentation of its frequency and impact is needed, as well as information about the types of tasks performed while multitasking, which has yet to be reported. Additionally, the effect of interruptions (including, but not limited to paging) needs further evaluation.
When properly performed, time‐study methodology represents a powerful approach to understanding the activities of hospitalists and how we might reengineer hospital care delivery to be more efficient. Efforts to standardize healthcare delivery and integrate health information technology could benefit dramatically from detailed information regarding physician activities and empirical testing of quality improvement initiatives. Future research using time‐motion or work‐sampling methodology should be careful to define and report categories of activity with enough detail that comparisons with other studies are possible.
Acknowledgements
The authors acknowledge the assistance of Linda O'Dwyer, MA MSLIS, research librarian at the Northwestern University Feinberg School of Medicine for her assistance with the search of the medical literature.
- .Motion and Time Study: Design and Measurement of Work.6th ed.New York:Wiley;1968.
- .Statistical methods in textile research. Uses of the binomial and poissant distributions.J Textile Inst Trans.1935;26:51–55.
- .Work‐sampling: a statistical approach to evaluation of the effect of computers on work patterns in the healthcare industry.Proc Annu Symp Comput Appl Med Care.1992:537–541.
- , , , , , .Time motion study in a pediatric emergency department before and after computer physician order entry.Ann Emerg Med.2009;53(4):462–468, e461.
- , , , .A “time‐and‐motion” study of endoscopic practice: strategies to enhance efficiency.Gastrointest Endosc.2008;68(6):1043–1050.
- , , , , , .Workflow in intensive care unit remote monitoring: A time‐and‐motion study.Crit Care Med.2007;35(9):2057–2063.
- , , , et al.Workflow analysis of medical staff in surgical wards based on time‐motion study data.Jpn Hosp.2008(27):75–80.
- , , , , , .General and visceral surgery practice in German hospitals: a real‐time work analysis on surgeons' work flow.Langenbecks Arch Surg.2010;395(1):81–87.
- , , , et al.Electronic health records in specialty care: a time‐motion study.J Am Med Inform Assoc.2007;14(5):609–615.
- , , , .National health spending in 2007: slower drug spending contributes to lowest rate of overall growth since 1998.Health Aff (Millwood).2009;28(1):246–261.
- , .The challenge of rising health care costs–a view from the Congressional Budget Office.N Engl J Med.2007;357(18):1793–1795.
- .Nonpayment for performance? Medicare's new reimbursement rule.N Engl J Med.2007;357(16):1573–1575.
- , .Hospitalists in teaching hospitals: opportunities but not without danger.J Gen Intern Med.2004;19:392–393.
- .The future of hospital medicine: evolution or revolution?Am J Med.2004;117:446–450.
- , .The evolution and future of hospital medicine.Mt Sinai J Med.2008;75(5):418–423.
- , , , , , .Outcomes of care by hospitalists, general internists, and family physicians.[see comment].N Engl J Med.2007;357(25):2589–2600.
- , .The hospitalist movement 5 years later.JAMA.2002;287:487–494.
- , .The impact of hospitalists on the cost and quality of inpatient care in the United States: a research synthesis.Med Care Res Rev.2005;62:379–406.
- .Hospitalists and the hospital medicine system of care are good for patient care.Arch Intern Med.2008;168(12):1254–1256; discussion 1259–1260.
- , , .How hospitalists spend their time: insights on efficiency and safety.J Hosp Med.2006;1(2):88–93.
- , , , , .The potential for using non‐physicians to compensate for the reduced availability of residents.Acad Med.1992;67(7):429–438.
- , , , , , .Observations of residents' work activities for 24 consecutive hours: Implications for workflow redesign.Acad Med.2006;81(8):766–775.
- , .The time needed for clinical documentation versus direct patient care. A work‐sampling analysis of physicians' activities.Methods Inf Med.2009;48(1):84–91.
- , , , et al.The on‐call experience of interns in internal medicine. Medical Education Task Force of Henry Ford Hospital.Arch Intern Med.1990;150(11):2294–2297.
- , , .What does the intern do?Med J Aust.1976;1(3):63–65.
- , , , .All in a day's work: an observational study to quantify how and with whom doctors on hospital wards spend their time.Med J Aust.2008;188(9):506–509.
- , , , .Resident educational time study: a tale of three specialties.Acad Emerg Med.1998;5(7):718–725.
- , .Are things different in the light of day? A time study of internal medicine house staff days.Am J Med.1993;94(6):654–658.
- , , .Time study of an internship on a university medical service.N Engl J Med.1961;264:439–443.
- , .Time study comparisons of 3 intern programs.J Med Educ.1971;46(2):142–149.
- , , , , .How do house officers spend their nights? A time study of internal medicine house staff on call.N Engl J Med.1989;320(25):1673–1677.
- .The Effect of a Non‐teaching Hospitalist Service in an Academic Hospital Setting: A Comparative Time‐motion and Clinical Outcomes Study. Unpublished Manuscript. Vol2006.
- .A strategy for health care reform—toward a value‐based system.N Engl J Med.2009;361(2):109–112.
- , , .Rehospitalizations among patients in the fee‐for‐service medicare program.N Engl J Med.2009;360(14):1418–1428.
- , .BOOSTing the hospital discharge.J Hosp Med.2009;4(4):209–210.
- , , , .A time‐motion study to evaluate the impact of EMR and CPOE implementation on physician efficiency.J Healthc Inf Manag.2008;22(4):31–37.
- , , , , .The ecology of medical care revisited.N Engl J Med.2001;344(26):2021–2025.
- .Motion and Time Study: Design and Measurement of Work.6th ed.New York:Wiley;1968.
- .Statistical methods in textile research. Uses of the binomial and poissant distributions.J Textile Inst Trans.1935;26:51–55.
- .Work‐sampling: a statistical approach to evaluation of the effect of computers on work patterns in the healthcare industry.Proc Annu Symp Comput Appl Med Care.1992:537–541.
- , , , , , .Time motion study in a pediatric emergency department before and after computer physician order entry.Ann Emerg Med.2009;53(4):462–468, e461.
- , , , .A “time‐and‐motion” study of endoscopic practice: strategies to enhance efficiency.Gastrointest Endosc.2008;68(6):1043–1050.
- , , , , , .Workflow in intensive care unit remote monitoring: A time‐and‐motion study.Crit Care Med.2007;35(9):2057–2063.
- , , , et al.Workflow analysis of medical staff in surgical wards based on time‐motion study data.Jpn Hosp.2008(27):75–80.
- , , , , , .General and visceral surgery practice in German hospitals: a real‐time work analysis on surgeons' work flow.Langenbecks Arch Surg.2010;395(1):81–87.
- , , , et al.Electronic health records in specialty care: a time‐motion study.J Am Med Inform Assoc.2007;14(5):609–615.
- , , , .National health spending in 2007: slower drug spending contributes to lowest rate of overall growth since 1998.Health Aff (Millwood).2009;28(1):246–261.
- , .The challenge of rising health care costs–a view from the Congressional Budget Office.N Engl J Med.2007;357(18):1793–1795.
- .Nonpayment for performance? Medicare's new reimbursement rule.N Engl J Med.2007;357(16):1573–1575.
- , .Hospitalists in teaching hospitals: opportunities but not without danger.J Gen Intern Med.2004;19:392–393.
- .The future of hospital medicine: evolution or revolution?Am J Med.2004;117:446–450.
- , .The evolution and future of hospital medicine.Mt Sinai J Med.2008;75(5):418–423.
- , , , , , .Outcomes of care by hospitalists, general internists, and family physicians.[see comment].N Engl J Med.2007;357(25):2589–2600.
- , .The hospitalist movement 5 years later.JAMA.2002;287:487–494.
- , .The impact of hospitalists on the cost and quality of inpatient care in the United States: a research synthesis.Med Care Res Rev.2005;62:379–406.
- .Hospitalists and the hospital medicine system of care are good for patient care.Arch Intern Med.2008;168(12):1254–1256; discussion 1259–1260.
- , , .How hospitalists spend their time: insights on efficiency and safety.J Hosp Med.2006;1(2):88–93.
- , , , , .The potential for using non‐physicians to compensate for the reduced availability of residents.Acad Med.1992;67(7):429–438.
- , , , , , .Observations of residents' work activities for 24 consecutive hours: Implications for workflow redesign.Acad Med.2006;81(8):766–775.
- , .The time needed for clinical documentation versus direct patient care. A work‐sampling analysis of physicians' activities.Methods Inf Med.2009;48(1):84–91.
- , , , et al.The on‐call experience of interns in internal medicine. Medical Education Task Force of Henry Ford Hospital.Arch Intern Med.1990;150(11):2294–2297.
- , , .What does the intern do?Med J Aust.1976;1(3):63–65.
- , , , .All in a day's work: an observational study to quantify how and with whom doctors on hospital wards spend their time.Med J Aust.2008;188(9):506–509.
- , , , .Resident educational time study: a tale of three specialties.Acad Emerg Med.1998;5(7):718–725.
- , .Are things different in the light of day? A time study of internal medicine house staff days.Am J Med.1993;94(6):654–658.
- , , .Time study of an internship on a university medical service.N Engl J Med.1961;264:439–443.
- , .Time study comparisons of 3 intern programs.J Med Educ.1971;46(2):142–149.
- , , , , .How do house officers spend their nights? A time study of internal medicine house staff on call.N Engl J Med.1989;320(25):1673–1677.
- .The Effect of a Non‐teaching Hospitalist Service in an Academic Hospital Setting: A Comparative Time‐motion and Clinical Outcomes Study. Unpublished Manuscript. Vol2006.
- .A strategy for health care reform—toward a value‐based system.N Engl J Med.2009;361(2):109–112.
- , , .Rehospitalizations among patients in the fee‐for‐service medicare program.N Engl J Med.2009;360(14):1418–1428.
- , .BOOSTing the hospital discharge.J Hosp Med.2009;4(4):209–210.
- , , , .A time‐motion study to evaluate the impact of EMR and CPOE implementation on physician efficiency.J Healthc Inf Manag.2008;22(4):31–37.
- , , , , .The ecology of medical care revisited.N Engl J Med.2001;344(26):2021–2025.
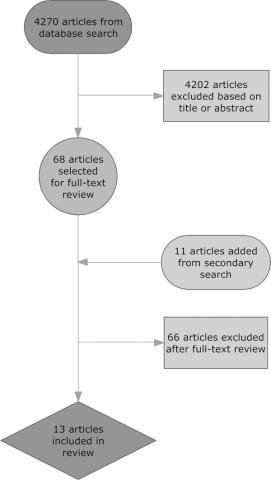
Hospitalist Time Usage and Cyclicality
Many academic medical centers (AMCs) employ hospitalists to provide care for patients on resident services as supervising attendings,1, 2 as well as on nonresident services.3 The number of hospitalists working on nonresident services at AMCs has grown exponentially, as the Accreditation Council for Graduate Medical Education (ACGME) implemented duty‐hour standards for residents.3 According to the latest Society of Hospital Medicine (SHM) estimates, the number of practicing hospitalists is projected to grow to 30,000 by 2010.4 As astonishing as this growth may sound, it is anticipated that more hospitalists will be needed to meet the demand for these physicians.5 Further, as financial realities require AMCs to be increasingly efficient without compromising patient care, and hospitalists provide a greater range of clinical services, it is important to better understand how hospitalists spend their time in the hospital. Understanding the daily work flow of hospitalists can identify how these physicians can be better supported. A previous report by O'Leary et al.6 highlighted how hospitalists spent their time during their usual day shifts at an AMC. It is important to validate their study to determine broadly applicable findings. We performed a time‐motion study where we followed the admitting hospitalists during the day and night shifts. We felt it was important to focus on hospitalists who are admitting patients, as this has potential patient safety and quality implications related to multitasking, triaging, and helping patients navigate through a complex admission process involving multiple clinical services. Our goal was to better understand how the flow of patients impacted these physicians, and determine how our hospitalists spent their time providing direct and indirect patient care‐related activities. In addition, we looked for predictable variations in activities throughout the day that might be associated with the timely care of patients.
Materials and Methods
Setting
The University of Michigan Health System (UMHS) is a tertiary care AMC, with more than 800 beds, and over 34,000 annual adult discharges. Internal Medicine services comprise a large proportion of those discharged, accounting for over 17,000 discharges per year; and is projected to grow at an annual rate of 4%. As service caps and work‐hour restrictions have limited the total number of patients that medical residents are able to care for, our hospitalist group has increased the number of physicians on the nonresident hospitalist service. At the time of the study, there were 23 hospitalists, equivalent to 18.25 full‐time equivalents (FTEs), staffing the service. The hospitalists provide in‐house patient care 24 hours a day and 7 days a week. Hospitalists also provide general medicine consult services, surgical comanagement and perioperative care, procedures, inpatient cardiopulmonary arrest response, rapid response team supervision, and observation care; and are also the primary inpatient physicians for many of the hospitalized interventional radiology and dermatology patients. These direct patient care activities account for 4500 annual discharges from the nonresident service.
Data Collection
Four university undergraduate business administration program students shadowed 11 hospitalists over a 3‐week period in 4‐hour to 12‐hour time blocks. The students followed the hospitalist on the shift that was taking admission calls, during day and night. A data collection tool was designed to track physicians' actions in 1‐minute increments, using categories similar to those used in a previously published time‐motion study of hospitalists' activities (Table 1).6 Physicians' activities each minute were assigned to a single category that most represented their action during that time period. At our AMC, 6 hospitalists work during the day shifts, and 2 on the night shifts. Our hospitalists may have patients in any of the 14 general care units in the hospital, as our hospitalists' services are not geographically based. The day hospitalists' shifts are scheduled from 7 AM to 7 PM. Two of the 6 hospitalists rotate through a 3‐day cycle as the admitting physician. Their duties include triaging and admitting patients until 2 PM, providing the day‐to‐day care for their patients until 7 PM, and occasionally cross‐covering for the other day‐shift hospitalists that have left for the day. The 4 other day‐shift hospitalists, not on their rotation as the admitting physician, may sign out and leave as early as 4 PM if their work for the day is done. At 2 PM, a separate swing‐shift hospitalist takes over the role of triaging and admitting until 7 PM. During the day shift, consults and perioperative management of patients are provided by a separate hospitalist on the consult service. At 7 PM, 2 nocturnists arrive for their 7 PM to 7 AM shift. The nocturnists, in addition to cross‐covering service patients, admit a maximum of 6 patients each, or until midnightwhichever comes first.
| Category | Code | Description |
|---|---|---|
| Direct patient care | DPIH | Initial history |
| DPDI | Discharge instructions | |
| DPFM | Family meetings | |
| DPRV | Revisit | |
| DPCC | Cross‐cover | |
| Indirect patient care | ||
| Documentation | IDGD | General documentation |
| IDDN | Daily notes | |
| IDDD | Discharge navigator | |
| Records/Results | IPMR | Review medical records |
| Communication | ICHH | Patient handoffs |
| ICFF | Face‐to‐face | |
| ICIP | Incoming page | |
| ICOP | Outgoing page | |
| ICIC | Incoming call | |
| ICOC | Outgoing call | |
| ICEE | E‐mail communications | |
| ICDP | Discharge planner | |
| Orders | IOWO | Writing orders |
| Professional development | PDRR | Reading articles, textbooks, references |
| Education | EEWR | Teaching during work rounds |
| Travel | TTTT | Travel |
| Personal | PPPP | Personal |
| Down time | DDDD | Downtime |
The students observed 11 different hospitalists, and followed these physicians during 9 weekday shifts, 5 weekday swing shifts, 10 weekday night shifts, and 4 weekend night shifts. The variance in the number of each type of shifts monitored was likely due to scheduling limitations of the students. In total, they collected data on 8,915 minutes of hospitalists' activities. The students monitored the hospitalists representing time periods from 7 AM to 2 AM. Analysis from 2 AM to 7 AM was excluded, because after 2 AM the hospitalists did not routinely evaluate new patients with the exception of emergent requests. New admissions after midnight are handled by a night float service staffed by residents.
Results
Overall, time spent on patient care activities comprised the bulk of hospitalists' shifts (82%) (Figure 1). Patient care activities were further categorized as direct patient caredefined as face‐to‐face patient or family time; and indirect patient caredefined as activities related to patient care, but without patient or family contact. Direct and indirect patient care accounted for 15% and 67% of the hospitalists' time, respectively. The other 18% of the hospitalists' time spent in the hospital were broadly categorized into: professional development, education, personal, downtime, and travel. Professional development included activities such as looking up information (eg, literature search); education included times that hospitalists spent with residents or medical students; personal time included only restroom and food breaks; and travel included time spent moving from 1 area to the next during their shift.
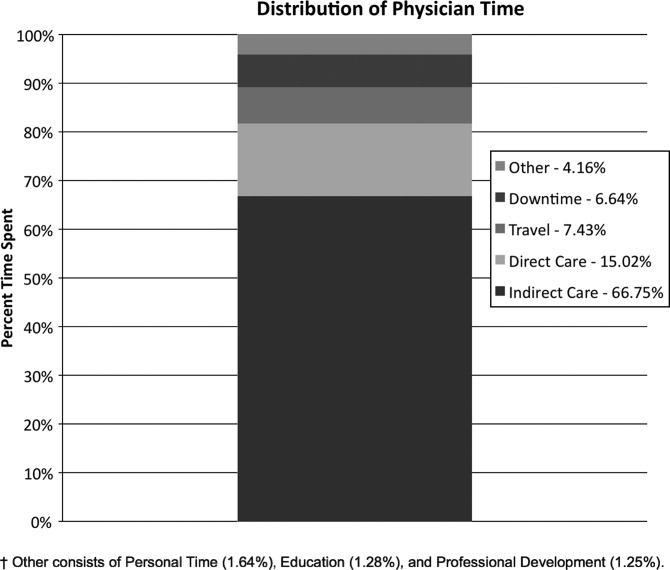
The majority of the hospitalists' direct patient care time was spent on evaluating new patients (79%). Significantly smaller amounts of time were spent on other direct care activities: cross‐covering other patients (8%), follow‐up visits (7%), family meetings (4%), and discharge instructions (2%) (Figure 2).
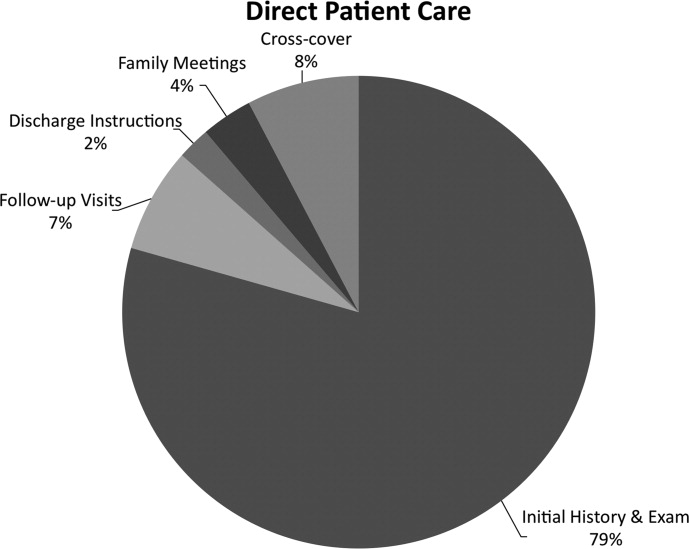
Indirect patient care activities included, 41% of time used to communicate with other healthcare providers, 26% on medical documentation, 20% reviewing medical records and results, and 13% of time writing orders (Figure 3). Communication accounted for a large proportion of a hospitalists' work, and included telephone conversations with Emergency Department (ED) or other admitting providers, handoffs, paging, face‐to‐face conversations with consultants and other support staff, and e‐mail.
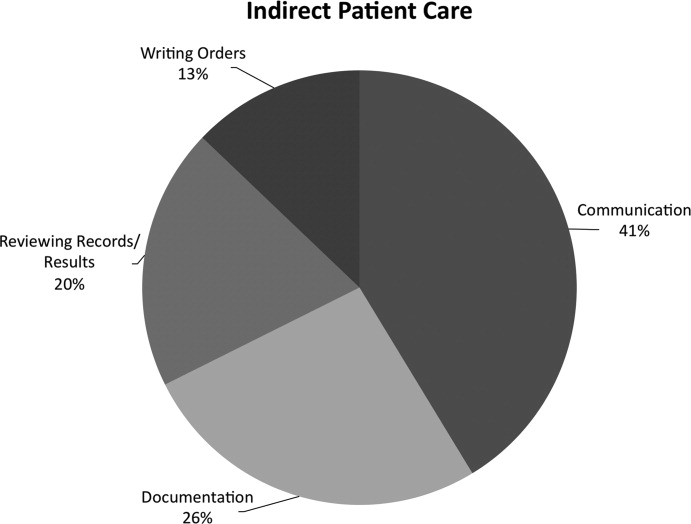
Figure 4 shows the hourly distribution of time spent on direct and indirect patient care by a hospitalist throughout the day. The day‐time hospitalists pick up their signout from the nocturnists at 7 AM to begin their shift. The swing hospitalists arrive at 2 PM during the weekdays, and their primary duty is to triage and admit patients until 7 PM. The nocturnists start their shift at 7 PM, at which time the daytime and swing‐shift hospitalists all sign out for the night.
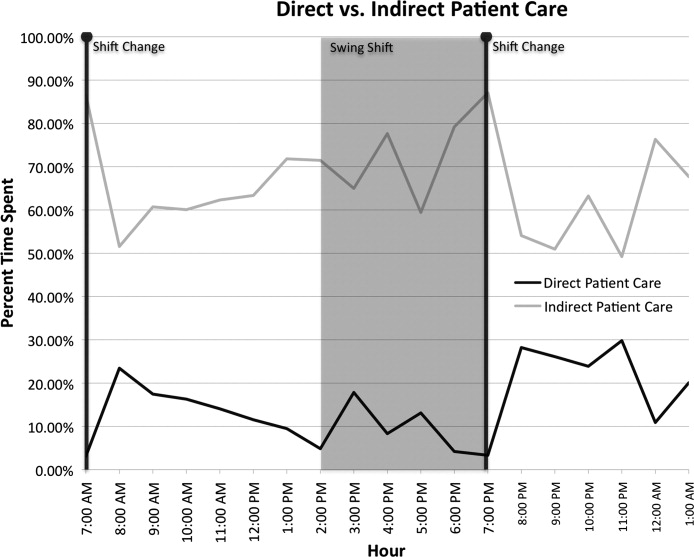
Discussion
Hospitalists on the nonresident service at our AMC utilize about 15% of their time on face‐to‐face patient care activities, 67% on indirect patient care activities, and 7% of time on moving from 1 part of the hospital to another. Hospitalists are valuable members of the physician work force who address the increasing patient care demands in the face of increasing limitations on residency work‐hours, a growing aging population, and existing inefficiencies in AMCs. The only other work‐flow study of hospitalists of which we are aware provided a single institution's perspective on time utilization by hospitalists. Our study in a different AMC setting revealed strong consistency with the O'Leary et al.6 study in the fraction of time hospitalists spent on direct patient care (15% and 18%, respectively), indirect patient care (67% and 69%); and within indirect patient care the time spent on documentation (26% and 37% of total time) and communications (41% and 35%). While travel in the O'Leary et al.6 study took up only 3% of hospitalists' time, the conclusions in that paper clearly suggest that the authors consider it an area of concern. Our study found that travel accounted for over 7% of hospitalists' time, confirming that intuition. The significant travel time may in part reflect the effects of a non‐geographically‐located hospitalist service. From these 2 studies we can be more confident that in large, tertiary care AMCs the time hospitalists spend on indirect patient care dominates that for direct patient care (by a factor of 4 in these studies), that within indirect patient care documentation and communication are dominant activities, and that travel can take a significant amount of time when patients are dispersed throughout the facility.
Both studies demonstrated that communication accounted for a significant proportion of a hospitalist's time. In our study communication accounted for 28% of their total time in the hospital, and 41% of the indirect patient care portion (Figure 3). A closer look within our communication category revealed that phone calls and handoffs accounted for two‐thirds of all communication time observed. As the hospitalists who carry the admitting pager, they receive the pages to take admission calls, but also take calls from consultants who have recommendations, as well as from nursing and other hospital staff. Depending on the nature of the conversation, the phone calls can last several minutes. While ensuring the communication between health care providers is complete and thorough, there may be opportunities to develop novel approaches to the way hospitalists communicate with other care providers. For example, at the UMHS, alternative communication methods with nursing staff have been proposed such as utilizing a website or a handheld device to help hospitalists prioritize their communications back to the nursing staff7; while standardizing the intake information from the ED or other admitting providers may help reduce the total time spent on phone calls. We will need to further explore the potential benefits of these ideas in future work.
Our data also reveal an interesting cyclicality of daily activities for the hospitalists, as shown in Figure 4. We identified batching behaviors throughout the day, which cause delays in seeing patients and can be deleterious to smooth workflows in support services. Spikes in indirect patient care, followed closely by spikes in direct patient care, occur regularly at shift changes (7 AM, 2 PM, and 7 PM). Also, in the night shift, indirect patient care drops to its lowest levels (in % of time spent) throughout the day, and direct patient care reaches its highest levels. The day‐shift indirect care profile is counter‐cyclical with direct care, as the hospitalist shifts between direct care and indirect care depending on the time of the day. We discuss these phenomena in turn.
It is known that variability in any operation causes congestion and delay, as an unavoidable consequence of the physics of material and information flows.8 Indeed, an entire subindustry based on Lean manufacturing principles has evolved from the Toyota Production System based on the elimination of unnecessary variability in operations.9 Lean processes have been ongoing in manufacturing facilities for decades, and these efforts are just recently being embraced by the service sector in general, and health care specifically.10, 11 Batching is an extreme form of variability, where there is a lull in the amount of work being done and then a burst of work is done over a short period of time. This means that jobs pile up in the queue waiting for the next spike of activity. Our data indicate batching seems to be a common phenomenon for our hospitalists. The majority of the patients admitted to our hospitalist service are unscheduled admissions that arrive primarily through the ED. One potential result of the unscheduled admissions is that patients could be referred to our hospitalist service at a pace that is not well predictable on an hour‐to‐hour basis. This could lead to an unintended result of multiple patients admitted over a short period of time. This means that many patients wait for intake, delaying the onset of their care by the inpatient physician. Also, since an initial exam often results in orders for laboratory tests and studies, batching on the floor will translate into batching of orders going to nursing, pathology, radiology, and other hospital support services. This imposes the cost of variability on these other services in the hospital. From a systems perspective, efficiency will improve if these activities can be smoothed throughout the day. This may suggest opportunities to work with the ED, to help smooth the inflow of patients into the hospital system.
Within the hospital, all of the day‐shift hospitalists can be reached about the needs of their respective patients, however, the physician carrying the admission pager also fields calls for admissions, and acts as the default contact person for the hospitalist group. As this hospitalist receives information on new admissions, he/she is aware of patients ready for intake but cannot evaluate them at the rate they are being referred, so the queue builds. This continues into the swing shift, which also fields referrals faster than they can attend to them. The volatility in indirect care during the swing shift, 2 PM to 7 PM, reflects a significant amount of triaging and fielding general calls about hospitalist patients. These activities further reduce the swing shift's ability to clear the intake queue. The night shift finally gets to these patients and, eventually, clears the queue. There may be an opportunity to consider the use of multiple input pagers or other process changes that can smooth this flow and rationalize the recurring tasks of finding patients and the responsible physician.
Another concept in Lean thinking is that variability is costly when it represents a mismatch between demand for a service and the capacity to serve. With regards to admitted patients, when demand outpaces capacity, patients will wait. When capacity outpaces demand, there is excess capacity in the system. The ideal is to match demand and capacity at all times, so nobody waits and the system carries no costly excess capacity. As the intake providers for admitted patients, we can attack this problem from the capacity side. Here, 2 generic Lean tactics are to: (1) reallocate resources to a bottleneck that is holding up the entire system, and (2) relieve workers of time‐consuming but non‐value‐adding work so they have more capacity to devote to serving demand. In our study, carrying multiple input pagers is an example of tactic (1), and efficient communication technologies and practices that reduce indirect time is an example of (2). Systemwide improvements would require further investigation by working with the variability on the input side (eg, ED admissions).
Our study also found that a significant percent of the time observed was spent traveling (7.4%) from room to room between different floors in the hospital. Travel time, which is non‐value‐adding, is one of the major forms of waste Lean thinking.12 Our hospitalists can provide care to patients at any of the general medical‐surgical beds we have available at our health system. These beds are distributed across 14 units on 5 different floors, as well as in the ED if a bed is not available for an admitted patient. In hospitals routinely operating at high occupancy, such as our AMC, patients often get distributed throughout the facility for lack of beds on the appropriate service's ward. One cost for this is a potential mismatch between a patient's needs and floor nurses' training. Our study reveals another cost, and that is its contribution to the significant amount of time hospitalists spent on travel, which is largely driven by the need to see dispersed patients. Reducing this cost requires a systemic, rather than service‐specific, solution. Our AMC is adding observation‐status beds to relieve some of the pressure on licensed beds, and considering bed management (including parts of the admissions and discharge processes) changes designed to promote better collocation of patients with services. Further study on these and other collocation tactics is warranted.
The spike in indirect activities at 4 PM represents, in part, an early signout by 1 or more of the hospitalists who are not scheduled to hold the admission pager, and have completed their work for the day. This handoff will be replicated at 7 PM when the nocturnists arrive for their night shift. In addition to a significant indirect load on physicians, multiple handoffs have been associated with decreased quality of care.13 Again, it is worthwhile considering the feasibility of alternative shift schedules that can minimize handoffs.
Finally, our findings revealed that a low percentage of time was dedicated to providing discharge instructions (2.24% of direct patient care time, and 0.34% of total time). Because the task of discharging patients falls primarily on the day‐shift hospitalists, when combined with swing‐shift and night‐shift hospitalists' data, the low percentage measured on discharge instructions may have been diluted. Nonetheless, this may point to the need for further investigation on how hospitalists provide direct patient encounter time during this critical phase of transition out of the hospital.
Our study is not without limitations. The student observers shadowed a representative group of hospitalists, but they were not able to follow everyone in the group. More specifically, their observations were made on the hospitalist who was carrying the primary hospitalist service admitting pager. Although it was the intent of our study to focus on the hospitalists we felt would be the busiest, our results may not be generalizable to all hospitalists. Although our research supports the previous findings by O'Leary et al.,6 a second limitation to our study is that our analysis was done at a single hospitalist group in an AMC, and hence the results may not be generalizable to other hospitalist groups. Another limitation may be that we did not do an evaluation of the hours between 2 AM to 7 AM. This period of time is used to catch up on medical documentation and to be available for medical emergencies. As more hospitalist programs are employing the use of nocturnists, it may be informative to have this time period tracked for activities.
Conclusions
Our study supports the broad allocation of hospitalist time found in an earlier study at a different AMC,6 suggesting that these might be generally representative in other AMCs. We found that travel constitutes a significant claim in hospitalists' time, due in part to the inability to collocate hospitalist service patients. Remedies are not likely to be service‐specific, but will require systemwide analyses of admission and discharge processes. Communication takes a significant amount of hospitalist time, with pages and phone calls related to handoffs accounting for most of the total communication time. As hospitalists working at non‐AMC settings may experience different work flow issues, we would like to see time‐motion studies of hospitalists in other types of hospitals. Future studies should also seek to better understand the how hospitals at high occupancy may reduce batching and streamline both the discharge and admission process, determine the factors that account for the significant communication time and how these processes could be streamlined, and evaluate the potential benefits of geographical localization of hospitalists' patients.
Acknowledgements
The authors thank Tracey Jackson, Michael Paulsen, Deepak Srinivasin, and Ryan Werblow, who were students in the undergraduate business school program, for their invaluable contribution in shadowing hospitalists to collect the time study data.
- , , , .Where should hospitalists sit within the academic medical center?J Gen Intern Med.2008;23:1269–1272.
- , .Hospitalists in teaching hospitals: opportunities but not without danger.J Gen Intern Med.2004;19:392–393.
- , , , , .Non‐housestaff medicine services in academic centers: models and challenges.J Hosp Med.2008;3:247–255.
- Society of Hospital Medicine. Society of Hospital Medicine Releases Results of the 2007–2008 Survey on the State of the Hospital Medicine Movement.2008. Available at: http://www.hospitalmedicine.org/AM/Template.cfm? Section=Press_Releases3:398–402.
- , , .How hospitalists spend their time: insights on efficiency and safety.J Hosp Med.2006;1:88–93.
- , .MCOMM: Redefining Medical Communication in the 21st Century, University of Michigan Health System. In: Society of Hospital Medicine Annual Meeting, Best of Innovations Presentation; 2009; Chicago, IL;2009.
- , .Factory Physics: Foundations of Manufacturing Management.Boston:Irwin, McGraw‐Hill;1996.
- .The Toyota Way.1st ed.Madison, WI:McGraw‐Hill;2004.
- Going Lean in Health Care.White Paper.Boston, MA:Institute for Healthcare Improvement;2005 January and February, 2005. Available at: http://www.ihconline.org/toolkits/LeanInHealthcare/GoingLeaninHealth CareWhitePaper.pdf. Accessed September 2009.
- , , , .Lean health care: what can hospitals learn from a world‐class automaker?J Hosp Med.2006;1:191–199.
- , , , , .Managing Business Process Flows.Upper Saddle River, NJ:Prentice Hall;2006.
- , .The patient handoff: medicine's Formula One moment.Chest.2008;134:9–12.
Many academic medical centers (AMCs) employ hospitalists to provide care for patients on resident services as supervising attendings,1, 2 as well as on nonresident services.3 The number of hospitalists working on nonresident services at AMCs has grown exponentially, as the Accreditation Council for Graduate Medical Education (ACGME) implemented duty‐hour standards for residents.3 According to the latest Society of Hospital Medicine (SHM) estimates, the number of practicing hospitalists is projected to grow to 30,000 by 2010.4 As astonishing as this growth may sound, it is anticipated that more hospitalists will be needed to meet the demand for these physicians.5 Further, as financial realities require AMCs to be increasingly efficient without compromising patient care, and hospitalists provide a greater range of clinical services, it is important to better understand how hospitalists spend their time in the hospital. Understanding the daily work flow of hospitalists can identify how these physicians can be better supported. A previous report by O'Leary et al.6 highlighted how hospitalists spent their time during their usual day shifts at an AMC. It is important to validate their study to determine broadly applicable findings. We performed a time‐motion study where we followed the admitting hospitalists during the day and night shifts. We felt it was important to focus on hospitalists who are admitting patients, as this has potential patient safety and quality implications related to multitasking, triaging, and helping patients navigate through a complex admission process involving multiple clinical services. Our goal was to better understand how the flow of patients impacted these physicians, and determine how our hospitalists spent their time providing direct and indirect patient care‐related activities. In addition, we looked for predictable variations in activities throughout the day that might be associated with the timely care of patients.
Materials and Methods
Setting
The University of Michigan Health System (UMHS) is a tertiary care AMC, with more than 800 beds, and over 34,000 annual adult discharges. Internal Medicine services comprise a large proportion of those discharged, accounting for over 17,000 discharges per year; and is projected to grow at an annual rate of 4%. As service caps and work‐hour restrictions have limited the total number of patients that medical residents are able to care for, our hospitalist group has increased the number of physicians on the nonresident hospitalist service. At the time of the study, there were 23 hospitalists, equivalent to 18.25 full‐time equivalents (FTEs), staffing the service. The hospitalists provide in‐house patient care 24 hours a day and 7 days a week. Hospitalists also provide general medicine consult services, surgical comanagement and perioperative care, procedures, inpatient cardiopulmonary arrest response, rapid response team supervision, and observation care; and are also the primary inpatient physicians for many of the hospitalized interventional radiology and dermatology patients. These direct patient care activities account for 4500 annual discharges from the nonresident service.
Data Collection
Four university undergraduate business administration program students shadowed 11 hospitalists over a 3‐week period in 4‐hour to 12‐hour time blocks. The students followed the hospitalist on the shift that was taking admission calls, during day and night. A data collection tool was designed to track physicians' actions in 1‐minute increments, using categories similar to those used in a previously published time‐motion study of hospitalists' activities (Table 1).6 Physicians' activities each minute were assigned to a single category that most represented their action during that time period. At our AMC, 6 hospitalists work during the day shifts, and 2 on the night shifts. Our hospitalists may have patients in any of the 14 general care units in the hospital, as our hospitalists' services are not geographically based. The day hospitalists' shifts are scheduled from 7 AM to 7 PM. Two of the 6 hospitalists rotate through a 3‐day cycle as the admitting physician. Their duties include triaging and admitting patients until 2 PM, providing the day‐to‐day care for their patients until 7 PM, and occasionally cross‐covering for the other day‐shift hospitalists that have left for the day. The 4 other day‐shift hospitalists, not on their rotation as the admitting physician, may sign out and leave as early as 4 PM if their work for the day is done. At 2 PM, a separate swing‐shift hospitalist takes over the role of triaging and admitting until 7 PM. During the day shift, consults and perioperative management of patients are provided by a separate hospitalist on the consult service. At 7 PM, 2 nocturnists arrive for their 7 PM to 7 AM shift. The nocturnists, in addition to cross‐covering service patients, admit a maximum of 6 patients each, or until midnightwhichever comes first.
| Category | Code | Description |
|---|---|---|
| Direct patient care | DPIH | Initial history |
| DPDI | Discharge instructions | |
| DPFM | Family meetings | |
| DPRV | Revisit | |
| DPCC | Cross‐cover | |
| Indirect patient care | ||
| Documentation | IDGD | General documentation |
| IDDN | Daily notes | |
| IDDD | Discharge navigator | |
| Records/Results | IPMR | Review medical records |
| Communication | ICHH | Patient handoffs |
| ICFF | Face‐to‐face | |
| ICIP | Incoming page | |
| ICOP | Outgoing page | |
| ICIC | Incoming call | |
| ICOC | Outgoing call | |
| ICEE | E‐mail communications | |
| ICDP | Discharge planner | |
| Orders | IOWO | Writing orders |
| Professional development | PDRR | Reading articles, textbooks, references |
| Education | EEWR | Teaching during work rounds |
| Travel | TTTT | Travel |
| Personal | PPPP | Personal |
| Down time | DDDD | Downtime |
The students observed 11 different hospitalists, and followed these physicians during 9 weekday shifts, 5 weekday swing shifts, 10 weekday night shifts, and 4 weekend night shifts. The variance in the number of each type of shifts monitored was likely due to scheduling limitations of the students. In total, they collected data on 8,915 minutes of hospitalists' activities. The students monitored the hospitalists representing time periods from 7 AM to 2 AM. Analysis from 2 AM to 7 AM was excluded, because after 2 AM the hospitalists did not routinely evaluate new patients with the exception of emergent requests. New admissions after midnight are handled by a night float service staffed by residents.
Results
Overall, time spent on patient care activities comprised the bulk of hospitalists' shifts (82%) (Figure 1). Patient care activities were further categorized as direct patient caredefined as face‐to‐face patient or family time; and indirect patient caredefined as activities related to patient care, but without patient or family contact. Direct and indirect patient care accounted for 15% and 67% of the hospitalists' time, respectively. The other 18% of the hospitalists' time spent in the hospital were broadly categorized into: professional development, education, personal, downtime, and travel. Professional development included activities such as looking up information (eg, literature search); education included times that hospitalists spent with residents or medical students; personal time included only restroom and food breaks; and travel included time spent moving from 1 area to the next during their shift.
The majority of the hospitalists' direct patient care time was spent on evaluating new patients (79%). Significantly smaller amounts of time were spent on other direct care activities: cross‐covering other patients (8%), follow‐up visits (7%), family meetings (4%), and discharge instructions (2%) (Figure 2).
Indirect patient care activities included, 41% of time used to communicate with other healthcare providers, 26% on medical documentation, 20% reviewing medical records and results, and 13% of time writing orders (Figure 3). Communication accounted for a large proportion of a hospitalists' work, and included telephone conversations with Emergency Department (ED) or other admitting providers, handoffs, paging, face‐to‐face conversations with consultants and other support staff, and e‐mail.
Figure 4 shows the hourly distribution of time spent on direct and indirect patient care by a hospitalist throughout the day. The day‐time hospitalists pick up their signout from the nocturnists at 7 AM to begin their shift. The swing hospitalists arrive at 2 PM during the weekdays, and their primary duty is to triage and admit patients until 7 PM. The nocturnists start their shift at 7 PM, at which time the daytime and swing‐shift hospitalists all sign out for the night.
Discussion
Hospitalists on the nonresident service at our AMC utilize about 15% of their time on face‐to‐face patient care activities, 67% on indirect patient care activities, and 7% of time on moving from 1 part of the hospital to another. Hospitalists are valuable members of the physician work force who address the increasing patient care demands in the face of increasing limitations on residency work‐hours, a growing aging population, and existing inefficiencies in AMCs. The only other work‐flow study of hospitalists of which we are aware provided a single institution's perspective on time utilization by hospitalists. Our study in a different AMC setting revealed strong consistency with the O'Leary et al.6 study in the fraction of time hospitalists spent on direct patient care (15% and 18%, respectively), indirect patient care (67% and 69%); and within indirect patient care the time spent on documentation (26% and 37% of total time) and communications (41% and 35%). While travel in the O'Leary et al.6 study took up only 3% of hospitalists' time, the conclusions in that paper clearly suggest that the authors consider it an area of concern. Our study found that travel accounted for over 7% of hospitalists' time, confirming that intuition. The significant travel time may in part reflect the effects of a non‐geographically‐located hospitalist service. From these 2 studies we can be more confident that in large, tertiary care AMCs the time hospitalists spend on indirect patient care dominates that for direct patient care (by a factor of 4 in these studies), that within indirect patient care documentation and communication are dominant activities, and that travel can take a significant amount of time when patients are dispersed throughout the facility.
Both studies demonstrated that communication accounted for a significant proportion of a hospitalist's time. In our study communication accounted for 28% of their total time in the hospital, and 41% of the indirect patient care portion (Figure 3). A closer look within our communication category revealed that phone calls and handoffs accounted for two‐thirds of all communication time observed. As the hospitalists who carry the admitting pager, they receive the pages to take admission calls, but also take calls from consultants who have recommendations, as well as from nursing and other hospital staff. Depending on the nature of the conversation, the phone calls can last several minutes. While ensuring the communication between health care providers is complete and thorough, there may be opportunities to develop novel approaches to the way hospitalists communicate with other care providers. For example, at the UMHS, alternative communication methods with nursing staff have been proposed such as utilizing a website or a handheld device to help hospitalists prioritize their communications back to the nursing staff7; while standardizing the intake information from the ED or other admitting providers may help reduce the total time spent on phone calls. We will need to further explore the potential benefits of these ideas in future work.
Our data also reveal an interesting cyclicality of daily activities for the hospitalists, as shown in Figure 4. We identified batching behaviors throughout the day, which cause delays in seeing patients and can be deleterious to smooth workflows in support services. Spikes in indirect patient care, followed closely by spikes in direct patient care, occur regularly at shift changes (7 AM, 2 PM, and 7 PM). Also, in the night shift, indirect patient care drops to its lowest levels (in % of time spent) throughout the day, and direct patient care reaches its highest levels. The day‐shift indirect care profile is counter‐cyclical with direct care, as the hospitalist shifts between direct care and indirect care depending on the time of the day. We discuss these phenomena in turn.
It is known that variability in any operation causes congestion and delay, as an unavoidable consequence of the physics of material and information flows.8 Indeed, an entire subindustry based on Lean manufacturing principles has evolved from the Toyota Production System based on the elimination of unnecessary variability in operations.9 Lean processes have been ongoing in manufacturing facilities for decades, and these efforts are just recently being embraced by the service sector in general, and health care specifically.10, 11 Batching is an extreme form of variability, where there is a lull in the amount of work being done and then a burst of work is done over a short period of time. This means that jobs pile up in the queue waiting for the next spike of activity. Our data indicate batching seems to be a common phenomenon for our hospitalists. The majority of the patients admitted to our hospitalist service are unscheduled admissions that arrive primarily through the ED. One potential result of the unscheduled admissions is that patients could be referred to our hospitalist service at a pace that is not well predictable on an hour‐to‐hour basis. This could lead to an unintended result of multiple patients admitted over a short period of time. This means that many patients wait for intake, delaying the onset of their care by the inpatient physician. Also, since an initial exam often results in orders for laboratory tests and studies, batching on the floor will translate into batching of orders going to nursing, pathology, radiology, and other hospital support services. This imposes the cost of variability on these other services in the hospital. From a systems perspective, efficiency will improve if these activities can be smoothed throughout the day. This may suggest opportunities to work with the ED, to help smooth the inflow of patients into the hospital system.
Within the hospital, all of the day‐shift hospitalists can be reached about the needs of their respective patients, however, the physician carrying the admission pager also fields calls for admissions, and acts as the default contact person for the hospitalist group. As this hospitalist receives information on new admissions, he/she is aware of patients ready for intake but cannot evaluate them at the rate they are being referred, so the queue builds. This continues into the swing shift, which also fields referrals faster than they can attend to them. The volatility in indirect care during the swing shift, 2 PM to 7 PM, reflects a significant amount of triaging and fielding general calls about hospitalist patients. These activities further reduce the swing shift's ability to clear the intake queue. The night shift finally gets to these patients and, eventually, clears the queue. There may be an opportunity to consider the use of multiple input pagers or other process changes that can smooth this flow and rationalize the recurring tasks of finding patients and the responsible physician.
Another concept in Lean thinking is that variability is costly when it represents a mismatch between demand for a service and the capacity to serve. With regards to admitted patients, when demand outpaces capacity, patients will wait. When capacity outpaces demand, there is excess capacity in the system. The ideal is to match demand and capacity at all times, so nobody waits and the system carries no costly excess capacity. As the intake providers for admitted patients, we can attack this problem from the capacity side. Here, 2 generic Lean tactics are to: (1) reallocate resources to a bottleneck that is holding up the entire system, and (2) relieve workers of time‐consuming but non‐value‐adding work so they have more capacity to devote to serving demand. In our study, carrying multiple input pagers is an example of tactic (1), and efficient communication technologies and practices that reduce indirect time is an example of (2). Systemwide improvements would require further investigation by working with the variability on the input side (eg, ED admissions).
Our study also found that a significant percent of the time observed was spent traveling (7.4%) from room to room between different floors in the hospital. Travel time, which is non‐value‐adding, is one of the major forms of waste Lean thinking.12 Our hospitalists can provide care to patients at any of the general medical‐surgical beds we have available at our health system. These beds are distributed across 14 units on 5 different floors, as well as in the ED if a bed is not available for an admitted patient. In hospitals routinely operating at high occupancy, such as our AMC, patients often get distributed throughout the facility for lack of beds on the appropriate service's ward. One cost for this is a potential mismatch between a patient's needs and floor nurses' training. Our study reveals another cost, and that is its contribution to the significant amount of time hospitalists spent on travel, which is largely driven by the need to see dispersed patients. Reducing this cost requires a systemic, rather than service‐specific, solution. Our AMC is adding observation‐status beds to relieve some of the pressure on licensed beds, and considering bed management (including parts of the admissions and discharge processes) changes designed to promote better collocation of patients with services. Further study on these and other collocation tactics is warranted.
The spike in indirect activities at 4 PM represents, in part, an early signout by 1 or more of the hospitalists who are not scheduled to hold the admission pager, and have completed their work for the day. This handoff will be replicated at 7 PM when the nocturnists arrive for their night shift. In addition to a significant indirect load on physicians, multiple handoffs have been associated with decreased quality of care.13 Again, it is worthwhile considering the feasibility of alternative shift schedules that can minimize handoffs.
Finally, our findings revealed that a low percentage of time was dedicated to providing discharge instructions (2.24% of direct patient care time, and 0.34% of total time). Because the task of discharging patients falls primarily on the day‐shift hospitalists, when combined with swing‐shift and night‐shift hospitalists' data, the low percentage measured on discharge instructions may have been diluted. Nonetheless, this may point to the need for further investigation on how hospitalists provide direct patient encounter time during this critical phase of transition out of the hospital.
Our study is not without limitations. The student observers shadowed a representative group of hospitalists, but they were not able to follow everyone in the group. More specifically, their observations were made on the hospitalist who was carrying the primary hospitalist service admitting pager. Although it was the intent of our study to focus on the hospitalists we felt would be the busiest, our results may not be generalizable to all hospitalists. Although our research supports the previous findings by O'Leary et al.,6 a second limitation to our study is that our analysis was done at a single hospitalist group in an AMC, and hence the results may not be generalizable to other hospitalist groups. Another limitation may be that we did not do an evaluation of the hours between 2 AM to 7 AM. This period of time is used to catch up on medical documentation and to be available for medical emergencies. As more hospitalist programs are employing the use of nocturnists, it may be informative to have this time period tracked for activities.
Conclusions
Our study supports the broad allocation of hospitalist time found in an earlier study at a different AMC,6 suggesting that these might be generally representative in other AMCs. We found that travel constitutes a significant claim in hospitalists' time, due in part to the inability to collocate hospitalist service patients. Remedies are not likely to be service‐specific, but will require systemwide analyses of admission and discharge processes. Communication takes a significant amount of hospitalist time, with pages and phone calls related to handoffs accounting for most of the total communication time. As hospitalists working at non‐AMC settings may experience different work flow issues, we would like to see time‐motion studies of hospitalists in other types of hospitals. Future studies should also seek to better understand the how hospitals at high occupancy may reduce batching and streamline both the discharge and admission process, determine the factors that account for the significant communication time and how these processes could be streamlined, and evaluate the potential benefits of geographical localization of hospitalists' patients.
Acknowledgements
The authors thank Tracey Jackson, Michael Paulsen, Deepak Srinivasin, and Ryan Werblow, who were students in the undergraduate business school program, for their invaluable contribution in shadowing hospitalists to collect the time study data.
Many academic medical centers (AMCs) employ hospitalists to provide care for patients on resident services as supervising attendings,1, 2 as well as on nonresident services.3 The number of hospitalists working on nonresident services at AMCs has grown exponentially, as the Accreditation Council for Graduate Medical Education (ACGME) implemented duty‐hour standards for residents.3 According to the latest Society of Hospital Medicine (SHM) estimates, the number of practicing hospitalists is projected to grow to 30,000 by 2010.4 As astonishing as this growth may sound, it is anticipated that more hospitalists will be needed to meet the demand for these physicians.5 Further, as financial realities require AMCs to be increasingly efficient without compromising patient care, and hospitalists provide a greater range of clinical services, it is important to better understand how hospitalists spend their time in the hospital. Understanding the daily work flow of hospitalists can identify how these physicians can be better supported. A previous report by O'Leary et al.6 highlighted how hospitalists spent their time during their usual day shifts at an AMC. It is important to validate their study to determine broadly applicable findings. We performed a time‐motion study where we followed the admitting hospitalists during the day and night shifts. We felt it was important to focus on hospitalists who are admitting patients, as this has potential patient safety and quality implications related to multitasking, triaging, and helping patients navigate through a complex admission process involving multiple clinical services. Our goal was to better understand how the flow of patients impacted these physicians, and determine how our hospitalists spent their time providing direct and indirect patient care‐related activities. In addition, we looked for predictable variations in activities throughout the day that might be associated with the timely care of patients.
Materials and Methods
Setting
The University of Michigan Health System (UMHS) is a tertiary care AMC, with more than 800 beds, and over 34,000 annual adult discharges. Internal Medicine services comprise a large proportion of those discharged, accounting for over 17,000 discharges per year; and is projected to grow at an annual rate of 4%. As service caps and work‐hour restrictions have limited the total number of patients that medical residents are able to care for, our hospitalist group has increased the number of physicians on the nonresident hospitalist service. At the time of the study, there were 23 hospitalists, equivalent to 18.25 full‐time equivalents (FTEs), staffing the service. The hospitalists provide in‐house patient care 24 hours a day and 7 days a week. Hospitalists also provide general medicine consult services, surgical comanagement and perioperative care, procedures, inpatient cardiopulmonary arrest response, rapid response team supervision, and observation care; and are also the primary inpatient physicians for many of the hospitalized interventional radiology and dermatology patients. These direct patient care activities account for 4500 annual discharges from the nonresident service.
Data Collection
Four university undergraduate business administration program students shadowed 11 hospitalists over a 3‐week period in 4‐hour to 12‐hour time blocks. The students followed the hospitalist on the shift that was taking admission calls, during day and night. A data collection tool was designed to track physicians' actions in 1‐minute increments, using categories similar to those used in a previously published time‐motion study of hospitalists' activities (Table 1).6 Physicians' activities each minute were assigned to a single category that most represented their action during that time period. At our AMC, 6 hospitalists work during the day shifts, and 2 on the night shifts. Our hospitalists may have patients in any of the 14 general care units in the hospital, as our hospitalists' services are not geographically based. The day hospitalists' shifts are scheduled from 7 AM to 7 PM. Two of the 6 hospitalists rotate through a 3‐day cycle as the admitting physician. Their duties include triaging and admitting patients until 2 PM, providing the day‐to‐day care for their patients until 7 PM, and occasionally cross‐covering for the other day‐shift hospitalists that have left for the day. The 4 other day‐shift hospitalists, not on their rotation as the admitting physician, may sign out and leave as early as 4 PM if their work for the day is done. At 2 PM, a separate swing‐shift hospitalist takes over the role of triaging and admitting until 7 PM. During the day shift, consults and perioperative management of patients are provided by a separate hospitalist on the consult service. At 7 PM, 2 nocturnists arrive for their 7 PM to 7 AM shift. The nocturnists, in addition to cross‐covering service patients, admit a maximum of 6 patients each, or until midnightwhichever comes first.
| Category | Code | Description |
|---|---|---|
| Direct patient care | DPIH | Initial history |
| DPDI | Discharge instructions | |
| DPFM | Family meetings | |
| DPRV | Revisit | |
| DPCC | Cross‐cover | |
| Indirect patient care | ||
| Documentation | IDGD | General documentation |
| IDDN | Daily notes | |
| IDDD | Discharge navigator | |
| Records/Results | IPMR | Review medical records |
| Communication | ICHH | Patient handoffs |
| ICFF | Face‐to‐face | |
| ICIP | Incoming page | |
| ICOP | Outgoing page | |
| ICIC | Incoming call | |
| ICOC | Outgoing call | |
| ICEE | E‐mail communications | |
| ICDP | Discharge planner | |
| Orders | IOWO | Writing orders |
| Professional development | PDRR | Reading articles, textbooks, references |
| Education | EEWR | Teaching during work rounds |
| Travel | TTTT | Travel |
| Personal | PPPP | Personal |
| Down time | DDDD | Downtime |
The students observed 11 different hospitalists, and followed these physicians during 9 weekday shifts, 5 weekday swing shifts, 10 weekday night shifts, and 4 weekend night shifts. The variance in the number of each type of shifts monitored was likely due to scheduling limitations of the students. In total, they collected data on 8,915 minutes of hospitalists' activities. The students monitored the hospitalists representing time periods from 7 AM to 2 AM. Analysis from 2 AM to 7 AM was excluded, because after 2 AM the hospitalists did not routinely evaluate new patients with the exception of emergent requests. New admissions after midnight are handled by a night float service staffed by residents.
Results
Overall, time spent on patient care activities comprised the bulk of hospitalists' shifts (82%) (Figure 1). Patient care activities were further categorized as direct patient caredefined as face‐to‐face patient or family time; and indirect patient caredefined as activities related to patient care, but without patient or family contact. Direct and indirect patient care accounted for 15% and 67% of the hospitalists' time, respectively. The other 18% of the hospitalists' time spent in the hospital were broadly categorized into: professional development, education, personal, downtime, and travel. Professional development included activities such as looking up information (eg, literature search); education included times that hospitalists spent with residents or medical students; personal time included only restroom and food breaks; and travel included time spent moving from 1 area to the next during their shift.
The majority of the hospitalists' direct patient care time was spent on evaluating new patients (79%). Significantly smaller amounts of time were spent on other direct care activities: cross‐covering other patients (8%), follow‐up visits (7%), family meetings (4%), and discharge instructions (2%) (Figure 2).
Indirect patient care activities included, 41% of time used to communicate with other healthcare providers, 26% on medical documentation, 20% reviewing medical records and results, and 13% of time writing orders (Figure 3). Communication accounted for a large proportion of a hospitalists' work, and included telephone conversations with Emergency Department (ED) or other admitting providers, handoffs, paging, face‐to‐face conversations with consultants and other support staff, and e‐mail.
Figure 4 shows the hourly distribution of time spent on direct and indirect patient care by a hospitalist throughout the day. The day‐time hospitalists pick up their signout from the nocturnists at 7 AM to begin their shift. The swing hospitalists arrive at 2 PM during the weekdays, and their primary duty is to triage and admit patients until 7 PM. The nocturnists start their shift at 7 PM, at which time the daytime and swing‐shift hospitalists all sign out for the night.
Discussion
Hospitalists on the nonresident service at our AMC utilize about 15% of their time on face‐to‐face patient care activities, 67% on indirect patient care activities, and 7% of time on moving from 1 part of the hospital to another. Hospitalists are valuable members of the physician work force who address the increasing patient care demands in the face of increasing limitations on residency work‐hours, a growing aging population, and existing inefficiencies in AMCs. The only other work‐flow study of hospitalists of which we are aware provided a single institution's perspective on time utilization by hospitalists. Our study in a different AMC setting revealed strong consistency with the O'Leary et al.6 study in the fraction of time hospitalists spent on direct patient care (15% and 18%, respectively), indirect patient care (67% and 69%); and within indirect patient care the time spent on documentation (26% and 37% of total time) and communications (41% and 35%). While travel in the O'Leary et al.6 study took up only 3% of hospitalists' time, the conclusions in that paper clearly suggest that the authors consider it an area of concern. Our study found that travel accounted for over 7% of hospitalists' time, confirming that intuition. The significant travel time may in part reflect the effects of a non‐geographically‐located hospitalist service. From these 2 studies we can be more confident that in large, tertiary care AMCs the time hospitalists spend on indirect patient care dominates that for direct patient care (by a factor of 4 in these studies), that within indirect patient care documentation and communication are dominant activities, and that travel can take a significant amount of time when patients are dispersed throughout the facility.
Both studies demonstrated that communication accounted for a significant proportion of a hospitalist's time. In our study communication accounted for 28% of their total time in the hospital, and 41% of the indirect patient care portion (Figure 3). A closer look within our communication category revealed that phone calls and handoffs accounted for two‐thirds of all communication time observed. As the hospitalists who carry the admitting pager, they receive the pages to take admission calls, but also take calls from consultants who have recommendations, as well as from nursing and other hospital staff. Depending on the nature of the conversation, the phone calls can last several minutes. While ensuring the communication between health care providers is complete and thorough, there may be opportunities to develop novel approaches to the way hospitalists communicate with other care providers. For example, at the UMHS, alternative communication methods with nursing staff have been proposed such as utilizing a website or a handheld device to help hospitalists prioritize their communications back to the nursing staff7; while standardizing the intake information from the ED or other admitting providers may help reduce the total time spent on phone calls. We will need to further explore the potential benefits of these ideas in future work.
Our data also reveal an interesting cyclicality of daily activities for the hospitalists, as shown in Figure 4. We identified batching behaviors throughout the day, which cause delays in seeing patients and can be deleterious to smooth workflows in support services. Spikes in indirect patient care, followed closely by spikes in direct patient care, occur regularly at shift changes (7 AM, 2 PM, and 7 PM). Also, in the night shift, indirect patient care drops to its lowest levels (in % of time spent) throughout the day, and direct patient care reaches its highest levels. The day‐shift indirect care profile is counter‐cyclical with direct care, as the hospitalist shifts between direct care and indirect care depending on the time of the day. We discuss these phenomena in turn.
It is known that variability in any operation causes congestion and delay, as an unavoidable consequence of the physics of material and information flows.8 Indeed, an entire subindustry based on Lean manufacturing principles has evolved from the Toyota Production System based on the elimination of unnecessary variability in operations.9 Lean processes have been ongoing in manufacturing facilities for decades, and these efforts are just recently being embraced by the service sector in general, and health care specifically.10, 11 Batching is an extreme form of variability, where there is a lull in the amount of work being done and then a burst of work is done over a short period of time. This means that jobs pile up in the queue waiting for the next spike of activity. Our data indicate batching seems to be a common phenomenon for our hospitalists. The majority of the patients admitted to our hospitalist service are unscheduled admissions that arrive primarily through the ED. One potential result of the unscheduled admissions is that patients could be referred to our hospitalist service at a pace that is not well predictable on an hour‐to‐hour basis. This could lead to an unintended result of multiple patients admitted over a short period of time. This means that many patients wait for intake, delaying the onset of their care by the inpatient physician. Also, since an initial exam often results in orders for laboratory tests and studies, batching on the floor will translate into batching of orders going to nursing, pathology, radiology, and other hospital support services. This imposes the cost of variability on these other services in the hospital. From a systems perspective, efficiency will improve if these activities can be smoothed throughout the day. This may suggest opportunities to work with the ED, to help smooth the inflow of patients into the hospital system.
Within the hospital, all of the day‐shift hospitalists can be reached about the needs of their respective patients, however, the physician carrying the admission pager also fields calls for admissions, and acts as the default contact person for the hospitalist group. As this hospitalist receives information on new admissions, he/she is aware of patients ready for intake but cannot evaluate them at the rate they are being referred, so the queue builds. This continues into the swing shift, which also fields referrals faster than they can attend to them. The volatility in indirect care during the swing shift, 2 PM to 7 PM, reflects a significant amount of triaging and fielding general calls about hospitalist patients. These activities further reduce the swing shift's ability to clear the intake queue. The night shift finally gets to these patients and, eventually, clears the queue. There may be an opportunity to consider the use of multiple input pagers or other process changes that can smooth this flow and rationalize the recurring tasks of finding patients and the responsible physician.
Another concept in Lean thinking is that variability is costly when it represents a mismatch between demand for a service and the capacity to serve. With regards to admitted patients, when demand outpaces capacity, patients will wait. When capacity outpaces demand, there is excess capacity in the system. The ideal is to match demand and capacity at all times, so nobody waits and the system carries no costly excess capacity. As the intake providers for admitted patients, we can attack this problem from the capacity side. Here, 2 generic Lean tactics are to: (1) reallocate resources to a bottleneck that is holding up the entire system, and (2) relieve workers of time‐consuming but non‐value‐adding work so they have more capacity to devote to serving demand. In our study, carrying multiple input pagers is an example of tactic (1), and efficient communication technologies and practices that reduce indirect time is an example of (2). Systemwide improvements would require further investigation by working with the variability on the input side (eg, ED admissions).
Our study also found that a significant percent of the time observed was spent traveling (7.4%) from room to room between different floors in the hospital. Travel time, which is non‐value‐adding, is one of the major forms of waste Lean thinking.12 Our hospitalists can provide care to patients at any of the general medical‐surgical beds we have available at our health system. These beds are distributed across 14 units on 5 different floors, as well as in the ED if a bed is not available for an admitted patient. In hospitals routinely operating at high occupancy, such as our AMC, patients often get distributed throughout the facility for lack of beds on the appropriate service's ward. One cost for this is a potential mismatch between a patient's needs and floor nurses' training. Our study reveals another cost, and that is its contribution to the significant amount of time hospitalists spent on travel, which is largely driven by the need to see dispersed patients. Reducing this cost requires a systemic, rather than service‐specific, solution. Our AMC is adding observation‐status beds to relieve some of the pressure on licensed beds, and considering bed management (including parts of the admissions and discharge processes) changes designed to promote better collocation of patients with services. Further study on these and other collocation tactics is warranted.
The spike in indirect activities at 4 PM represents, in part, an early signout by 1 or more of the hospitalists who are not scheduled to hold the admission pager, and have completed their work for the day. This handoff will be replicated at 7 PM when the nocturnists arrive for their night shift. In addition to a significant indirect load on physicians, multiple handoffs have been associated with decreased quality of care.13 Again, it is worthwhile considering the feasibility of alternative shift schedules that can minimize handoffs.
Finally, our findings revealed that a low percentage of time was dedicated to providing discharge instructions (2.24% of direct patient care time, and 0.34% of total time). Because the task of discharging patients falls primarily on the day‐shift hospitalists, when combined with swing‐shift and night‐shift hospitalists' data, the low percentage measured on discharge instructions may have been diluted. Nonetheless, this may point to the need for further investigation on how hospitalists provide direct patient encounter time during this critical phase of transition out of the hospital.
Our study is not without limitations. The student observers shadowed a representative group of hospitalists, but they were not able to follow everyone in the group. More specifically, their observations were made on the hospitalist who was carrying the primary hospitalist service admitting pager. Although it was the intent of our study to focus on the hospitalists we felt would be the busiest, our results may not be generalizable to all hospitalists. Although our research supports the previous findings by O'Leary et al.,6 a second limitation to our study is that our analysis was done at a single hospitalist group in an AMC, and hence the results may not be generalizable to other hospitalist groups. Another limitation may be that we did not do an evaluation of the hours between 2 AM to 7 AM. This period of time is used to catch up on medical documentation and to be available for medical emergencies. As more hospitalist programs are employing the use of nocturnists, it may be informative to have this time period tracked for activities.
Conclusions
Our study supports the broad allocation of hospitalist time found in an earlier study at a different AMC,6 suggesting that these might be generally representative in other AMCs. We found that travel constitutes a significant claim in hospitalists' time, due in part to the inability to collocate hospitalist service patients. Remedies are not likely to be service‐specific, but will require systemwide analyses of admission and discharge processes. Communication takes a significant amount of hospitalist time, with pages and phone calls related to handoffs accounting for most of the total communication time. As hospitalists working at non‐AMC settings may experience different work flow issues, we would like to see time‐motion studies of hospitalists in other types of hospitals. Future studies should also seek to better understand the how hospitals at high occupancy may reduce batching and streamline both the discharge and admission process, determine the factors that account for the significant communication time and how these processes could be streamlined, and evaluate the potential benefits of geographical localization of hospitalists' patients.
Acknowledgements
The authors thank Tracey Jackson, Michael Paulsen, Deepak Srinivasin, and Ryan Werblow, who were students in the undergraduate business school program, for their invaluable contribution in shadowing hospitalists to collect the time study data.
- , , , .Where should hospitalists sit within the academic medical center?J Gen Intern Med.2008;23:1269–1272.
- , .Hospitalists in teaching hospitals: opportunities but not without danger.J Gen Intern Med.2004;19:392–393.
- , , , , .Non‐housestaff medicine services in academic centers: models and challenges.J Hosp Med.2008;3:247–255.
- Society of Hospital Medicine. Society of Hospital Medicine Releases Results of the 2007–2008 Survey on the State of the Hospital Medicine Movement.2008. Available at: http://www.hospitalmedicine.org/AM/Template.cfm? Section=Press_Releases3:398–402.
- , , .How hospitalists spend their time: insights on efficiency and safety.J Hosp Med.2006;1:88–93.
- , .MCOMM: Redefining Medical Communication in the 21st Century, University of Michigan Health System. In: Society of Hospital Medicine Annual Meeting, Best of Innovations Presentation; 2009; Chicago, IL;2009.
- , .Factory Physics: Foundations of Manufacturing Management.Boston:Irwin, McGraw‐Hill;1996.
- .The Toyota Way.1st ed.Madison, WI:McGraw‐Hill;2004.
- Going Lean in Health Care.White Paper.Boston, MA:Institute for Healthcare Improvement;2005 January and February, 2005. Available at: http://www.ihconline.org/toolkits/LeanInHealthcare/GoingLeaninHealth CareWhitePaper.pdf. Accessed September 2009.
- , , , .Lean health care: what can hospitals learn from a world‐class automaker?J Hosp Med.2006;1:191–199.
- , , , , .Managing Business Process Flows.Upper Saddle River, NJ:Prentice Hall;2006.
- , .The patient handoff: medicine's Formula One moment.Chest.2008;134:9–12.
- , , , .Where should hospitalists sit within the academic medical center?J Gen Intern Med.2008;23:1269–1272.
- , .Hospitalists in teaching hospitals: opportunities but not without danger.J Gen Intern Med.2004;19:392–393.
- , , , , .Non‐housestaff medicine services in academic centers: models and challenges.J Hosp Med.2008;3:247–255.
- Society of Hospital Medicine. Society of Hospital Medicine Releases Results of the 2007–2008 Survey on the State of the Hospital Medicine Movement.2008. Available at: http://www.hospitalmedicine.org/AM/Template.cfm? Section=Press_Releases3:398–402.
- , , .How hospitalists spend their time: insights on efficiency and safety.J Hosp Med.2006;1:88–93.
- , .MCOMM: Redefining Medical Communication in the 21st Century, University of Michigan Health System. In: Society of Hospital Medicine Annual Meeting, Best of Innovations Presentation; 2009; Chicago, IL;2009.
- , .Factory Physics: Foundations of Manufacturing Management.Boston:Irwin, McGraw‐Hill;1996.
- .The Toyota Way.1st ed.Madison, WI:McGraw‐Hill;2004.
- Going Lean in Health Care.White Paper.Boston, MA:Institute for Healthcare Improvement;2005 January and February, 2005. Available at: http://www.ihconline.org/toolkits/LeanInHealthcare/GoingLeaninHealth CareWhitePaper.pdf. Accessed September 2009.
- , , , .Lean health care: what can hospitals learn from a world‐class automaker?J Hosp Med.2006;1:191–199.
- , , , , .Managing Business Process Flows.Upper Saddle River, NJ:Prentice Hall;2006.
- , .The patient handoff: medicine's Formula One moment.Chest.2008;134:9–12.
Copyright © 2010 Society of Hospital Medicine