User login
European experts envy U.S. pediatric flu vaccination approach
MALMO, SWEDEN – When American physicians think about health care in Europe, what typically comes to mind are government-funded, single-payer national health services with cradle-to-grave coverage of essential services, a strong public health bent, and perhaps some queuing.

“It’s complicated. There is no common strategic approach,” Hanna Nohynek, MD, PhD, observed at a session on childhood immunization against flu held during the annual meeting of the European Society for Paediatric Infectious Diseases.
“In real life, influenza coverage among [European] children is either not known or quite low. Impact assessments in children are done in only a few countries,” said Dr. Nohynek, chief physician in the infectious diseases control and vaccinations unit of the National Institute for Health and Welfare in Helsinki, Finland.
“The only country doing as well coverage-wise as the U.S. is the U.K., with rates of 50%-65%. In Finland it’s less than 40%,” according to Dr. Nohynek.
“We have 28 countries today in the E.U. [European Union], and we have 28 different recommendations in Europe. So where do we go from here? It’s really not easy,” observed session cochair Alberticus Osterhaus, DVM, PhD, emeritus professor of virology at Erasmus University in Rotterdam, the Netherlands.
For all the oft-cited shortcomings of health care in the United States, That’s why Jon S. Abramson, MD, a former chair of the Centers for Disease Control and Prevention’s Advisory Committee on Immunization Practices (ACIP), was invited to explain how the U.S. strategy was accomplished.
The U.S. approach
The current U.S. policy, implemented in 2010, is to recommend an annual flu shot for all persons older than 6 months of age.

Influenza vaccination has been part of the U.S. public health program since 1960. Children aged 6-23 months, as well as their household contacts and women who will be pregnant during flu season, were added in 2004. In 2006, the flu vaccine recommendation was expanded to include children aged 6-59 months as a result of persuasive data showing that the rate of flu-associated hospitalizations and deaths in children up to 4 years old was second only to the rate in the elderly population.
The rationale for expanding the recommendation to include all school-age children and adolescents stemmed from evidence that the highest average flu-related illness rate in the United States was in that age group, which confirmed that schools are a powerful vector for the spread of influenza. Vaccinating this age-group also was seen as having an indirect benefit for their household contacts.
The current policy of recommending vaccination of everyone over age 6 months was adopted because it checked off a lot of boxes: “It’s a single recommendation, easy to apply; it eliminates the need to look for indications and risk factors; it increases vaccination coverage rates; annual vaccination is safe and effective; and flu-related morbidity and mortality occur in all age groups,” Dr. Abramson continued.
The rate of influenza vaccine coverage in pregnant women has improved over time from less than 15% to about 50%. To place that in perspective, however, the rate in Argentina is 95%, the pediatrician noted.
“We’re doing better in children than we are in adults in terms of seasonal coverage rates,” he added. “In 2015, it was 59%, versus 42% in adults.”
Dr. Abramson said there remains some skepticism in the United States regarding the effectiveness of flu vaccines in preventing flu-related illness. That’s because of the difficulty in communicating that vaccine effectiveness varies from year to year, sometimes substantially, depending upon two factors: the transmission characteristics of the circulating strains and how well the vaccines match up against those strains.
“I think we have to learn to live with that. I don’t think we’ll see a universal flu vaccine that we can give once every 10 years,” he said.
“The bottom line is, even if a vaccine is only 50% efficacious overall, we’re still impacting huge numbers,” the pediatrician added.
Dr. Abramson cited a CDC estimate that, for the 2012-2013 season, where the vaccine was 49% efficacious, the result of vaccination was 6.6 million fewer cases of influenza-associated illnesses nationally, 3.2 million fewer flu-associated medical visits, and 79,000 hospitalizations avoided.
“I think we have a fairly good program in the United States. We’re doing well in children. We certainly could be doing better. Not having FluMist for the past 2 seasons probably hurt us some,” according to Dr. Abramson.
The FluMist experience
The FluMist episode is viewed by many European pediatric infectious disease experts as a debacle. Europeans eager to develop a pan-European strategy for seasonal immunization against influenza in children and adolescents viewed the U.S. FluMist episode with dismay. For the 2016-2017 and 2017-2018 flu seasons, the ACIP recommended against FluMist, a previously approved intranasally administered quadrivalent live attenuated virus vaccine, on the basis of a single study showing subpar effectiveness against influenza A H1NI. Then at its October 2017 meeting, ACIP reversed itself and reinstated FluMist for the 2018-2019 season after viewing data from Finland and several other countries demonstrating that, in countries where it hadn’t been taken off the market, the vaccine had performed as well as injectable inactivated influenza vaccines in the 2016-2017 flu season.
“I think from the European side, it’s been a bit of a sorry spectacle,” commented Dr. Osterhaus, referring to the ACIP’s waffling. After all, authorities in Canada and European countries where FluMist was available had looked at the same data that caused ACIP to derecommend the vaccine but hadn’t found it convincing.
“We’re very happy to see ACIP has reinstated the vaccine,” Dr. Nohynek said.
Dr. Abramson declined to defend the ACIP decision to drop FluMist.
“From my standpoint, knowing that influenza B kills more children than A does, if I had been on the ACIP committee – and I’m not anymore – that would not have been my vote,” he said. “Whatever you want to say about the live attenuated influenza vaccine, about how good it is against some A strains or not, it’s better than other vaccines against influenza B. And the death rate is higher from B than A in children, although that is not true in adults.”
Plus, FluMist was an important option for people avoiding immunization because they dislike shots.
“The vast majority of deaths due to flu in children in 2010-2016 have been in kids who didn’t get vaccinated,” he noted.
Dr. Nohynek said the Finnish real-world experience recorded in comprehensive national registries for the 2017-2018 flu season – a bad year for vaccine/virus mismatch in Europe – confirmed Dr. Abramson’s comments about the superiority of quadrivalent live attenuated influenza vaccine against influenza B. Among 54,611 Finnish children aged 24-35 months, the laboratory-confirmed vaccine effectiveness of trivalent inactivated virus vaccine, with 9% coverage, was 4.5% for influenza A and 12.2% for influenza B. In contrast, the vaccine effectiveness for the intranasal quadrivalent live attenuated influenza vaccine was 32% for A and a whopping 80% for B.
“It’s quite amazing, at least to me, to see figures like this in real world data,” she commented.
Session cochair Adam Finn, MD, PhD, said he has found it instructive to take a closer look at the U.K. data for the past several flu seasons.
“We’ve seen greater control of the epidemic in Scotland and Northern Ireland, where coverage in primary school kids was higher, in the 60%-70% area, and lower in England and Wales, where it was more like 50%. So we’re beginning to think that’s the kind of level of annual coverage in children we might need to suppress an epidemic. I think that’s a really important message that people should understand: We’re not looking for 95% coverage,” observed Dr. Finn, aprofessor of pediatrics at the University of Bristol (England).
Vaccine effectiveness will improve
Dr. Osterhaus predicted better times are coming in terms of vaccine effectiveness. Vaccine production times will become shorter as recombinant technologies replace the traditional lengthy chicken egg-based vaccine production; as a result, there will be less drift-associated mismatch. Improved surveillance, including the ability to follow strain mobility patterns and population-based antibody landscapes, are another important advance.
“We’ve always been looking at one side of the coin: the virus. Once or twice a year eminent gray people sitting together in Geneva at WHO decide which strains should be selected for the next vaccine. But if you know what antibodies are present in the population, this can be quite important information as well,” he said.
Dr. Nohynek reported receiving research funding from GlaxoSmithKline and Pfizer. The other speakers reported having no relevant financial conflicts of interest.
MALMO, SWEDEN – When American physicians think about health care in Europe, what typically comes to mind are government-funded, single-payer national health services with cradle-to-grave coverage of essential services, a strong public health bent, and perhaps some queuing.
“It’s complicated. There is no common strategic approach,” Hanna Nohynek, MD, PhD, observed at a session on childhood immunization against flu held during the annual meeting of the European Society for Paediatric Infectious Diseases.
“In real life, influenza coverage among [European] children is either not known or quite low. Impact assessments in children are done in only a few countries,” said Dr. Nohynek, chief physician in the infectious diseases control and vaccinations unit of the National Institute for Health and Welfare in Helsinki, Finland.
“The only country doing as well coverage-wise as the U.S. is the U.K., with rates of 50%-65%. In Finland it’s less than 40%,” according to Dr. Nohynek.
“We have 28 countries today in the E.U. [European Union], and we have 28 different recommendations in Europe. So where do we go from here? It’s really not easy,” observed session cochair Alberticus Osterhaus, DVM, PhD, emeritus professor of virology at Erasmus University in Rotterdam, the Netherlands.
For all the oft-cited shortcomings of health care in the United States, That’s why Jon S. Abramson, MD, a former chair of the Centers for Disease Control and Prevention’s Advisory Committee on Immunization Practices (ACIP), was invited to explain how the U.S. strategy was accomplished.
The U.S. approach
The current U.S. policy, implemented in 2010, is to recommend an annual flu shot for all persons older than 6 months of age.
Influenza vaccination has been part of the U.S. public health program since 1960. Children aged 6-23 months, as well as their household contacts and women who will be pregnant during flu season, were added in 2004. In 2006, the flu vaccine recommendation was expanded to include children aged 6-59 months as a result of persuasive data showing that the rate of flu-associated hospitalizations and deaths in children up to 4 years old was second only to the rate in the elderly population.
The rationale for expanding the recommendation to include all school-age children and adolescents stemmed from evidence that the highest average flu-related illness rate in the United States was in that age group, which confirmed that schools are a powerful vector for the spread of influenza. Vaccinating this age-group also was seen as having an indirect benefit for their household contacts.
The current policy of recommending vaccination of everyone over age 6 months was adopted because it checked off a lot of boxes: “It’s a single recommendation, easy to apply; it eliminates the need to look for indications and risk factors; it increases vaccination coverage rates; annual vaccination is safe and effective; and flu-related morbidity and mortality occur in all age groups,” Dr. Abramson continued.
The rate of influenza vaccine coverage in pregnant women has improved over time from less than 15% to about 50%. To place that in perspective, however, the rate in Argentina is 95%, the pediatrician noted.
“We’re doing better in children than we are in adults in terms of seasonal coverage rates,” he added. “In 2015, it was 59%, versus 42% in adults.”
Dr. Abramson said there remains some skepticism in the United States regarding the effectiveness of flu vaccines in preventing flu-related illness. That’s because of the difficulty in communicating that vaccine effectiveness varies from year to year, sometimes substantially, depending upon two factors: the transmission characteristics of the circulating strains and how well the vaccines match up against those strains.
“I think we have to learn to live with that. I don’t think we’ll see a universal flu vaccine that we can give once every 10 years,” he said.
“The bottom line is, even if a vaccine is only 50% efficacious overall, we’re still impacting huge numbers,” the pediatrician added.
Dr. Abramson cited a CDC estimate that, for the 2012-2013 season, where the vaccine was 49% efficacious, the result of vaccination was 6.6 million fewer cases of influenza-associated illnesses nationally, 3.2 million fewer flu-associated medical visits, and 79,000 hospitalizations avoided.
“I think we have a fairly good program in the United States. We’re doing well in children. We certainly could be doing better. Not having FluMist for the past 2 seasons probably hurt us some,” according to Dr. Abramson.
The FluMist experience
The FluMist episode is viewed by many European pediatric infectious disease experts as a debacle. Europeans eager to develop a pan-European strategy for seasonal immunization against influenza in children and adolescents viewed the U.S. FluMist episode with dismay. For the 2016-2017 and 2017-2018 flu seasons, the ACIP recommended against FluMist, a previously approved intranasally administered quadrivalent live attenuated virus vaccine, on the basis of a single study showing subpar effectiveness against influenza A H1NI. Then at its October 2017 meeting, ACIP reversed itself and reinstated FluMist for the 2018-2019 season after viewing data from Finland and several other countries demonstrating that, in countries where it hadn’t been taken off the market, the vaccine had performed as well as injectable inactivated influenza vaccines in the 2016-2017 flu season.
“I think from the European side, it’s been a bit of a sorry spectacle,” commented Dr. Osterhaus, referring to the ACIP’s waffling. After all, authorities in Canada and European countries where FluMist was available had looked at the same data that caused ACIP to derecommend the vaccine but hadn’t found it convincing.
“We’re very happy to see ACIP has reinstated the vaccine,” Dr. Nohynek said.
Dr. Abramson declined to defend the ACIP decision to drop FluMist.
“From my standpoint, knowing that influenza B kills more children than A does, if I had been on the ACIP committee – and I’m not anymore – that would not have been my vote,” he said. “Whatever you want to say about the live attenuated influenza vaccine, about how good it is against some A strains or not, it’s better than other vaccines against influenza B. And the death rate is higher from B than A in children, although that is not true in adults.”
Plus, FluMist was an important option for people avoiding immunization because they dislike shots.
“The vast majority of deaths due to flu in children in 2010-2016 have been in kids who didn’t get vaccinated,” he noted.
Dr. Nohynek said the Finnish real-world experience recorded in comprehensive national registries for the 2017-2018 flu season – a bad year for vaccine/virus mismatch in Europe – confirmed Dr. Abramson’s comments about the superiority of quadrivalent live attenuated influenza vaccine against influenza B. Among 54,611 Finnish children aged 24-35 months, the laboratory-confirmed vaccine effectiveness of trivalent inactivated virus vaccine, with 9% coverage, was 4.5% for influenza A and 12.2% for influenza B. In contrast, the vaccine effectiveness for the intranasal quadrivalent live attenuated influenza vaccine was 32% for A and a whopping 80% for B.
“It’s quite amazing, at least to me, to see figures like this in real world data,” she commented.
Session cochair Adam Finn, MD, PhD, said he has found it instructive to take a closer look at the U.K. data for the past several flu seasons.
“We’ve seen greater control of the epidemic in Scotland and Northern Ireland, where coverage in primary school kids was higher, in the 60%-70% area, and lower in England and Wales, where it was more like 50%. So we’re beginning to think that’s the kind of level of annual coverage in children we might need to suppress an epidemic. I think that’s a really important message that people should understand: We’re not looking for 95% coverage,” observed Dr. Finn, aprofessor of pediatrics at the University of Bristol (England).
Vaccine effectiveness will improve
Dr. Osterhaus predicted better times are coming in terms of vaccine effectiveness. Vaccine production times will become shorter as recombinant technologies replace the traditional lengthy chicken egg-based vaccine production; as a result, there will be less drift-associated mismatch. Improved surveillance, including the ability to follow strain mobility patterns and population-based antibody landscapes, are another important advance.
“We’ve always been looking at one side of the coin: the virus. Once or twice a year eminent gray people sitting together in Geneva at WHO decide which strains should be selected for the next vaccine. But if you know what antibodies are present in the population, this can be quite important information as well,” he said.
Dr. Nohynek reported receiving research funding from GlaxoSmithKline and Pfizer. The other speakers reported having no relevant financial conflicts of interest.
EXPERT ANALYSIS FROM ESPID 2018
AAP: Food additives inadequately regulated, pose risks to children
The regulation of food additives needs an overhaul in the United States because of the risks these compounds pose to children and infants, according to a new policy statement by the American Academy of Pediatrics.

suggested members of the AAP Council on Environmental Health.
Among the additives of greatest concern, the statement notes, are bisphenols (including bisphenol A), phthalates, certain pesticides, perfluoroalkyl chemicals, perchlorate, artificial food colors, nitrates, and nitrites. A technical report accompanying the policy statement reviewed existing evidence on these compounds.
The statement, authored by the council led by Leonardo Trasande, MD, of New York University, noted that many of the more than 10,000 chemicals added to food and food packaging were grandfathered into use prior to current regulations. Further, approximately 1,000 of these chemicals fall under the Food and Drug Administration’s designation of “generally recognized as safe,” which does not require FDA approval for use.
“Current requirements for a ‘generally recognized as safe’ [GRAS] designation are insufficient to ensure the safety of food additives and do not contain sufficient protections against conflict of interest,” they wrote. “Additionally, the FDA does not have authority to obtain data on or reassess the safety of chemicals already on the market.” The FDA does not regularly consider cumulative effects of food additives or the synergistic effects of chemicals found in foods.
The authors noted that concerns about food additives have increased in the past 20 years as new research has identified adverse health effects, including endocrine disruption, associated with these chemicals.
Dr. Trasande and his associates also acknowledged the limited evidence available on food additives particularly for children and infants, but noted this population’s greater vulnerability to chemical exposures.
Compounds addressed in the statement
- Bisphenols. Health concerns tied to these chemicals are endocrine/neurodevelopmental disruption and obesogenic activity.
- Phthalates. Health concerns linked to these chemicals are endocrine disruption, obesogenic activity, oxidative stress, and cardiotoxicity.
- Perfluoroalkyl chemicals. Health concerns associated with these chemicals are immunosuppression, endocrine disruption, obesogenic activity, and decreased birth weight.
- Perchlorate. The health concern tied to this chemical is thyroid hormone disruption.
- Nitrates and nitrites. Use of these as a preservative and color enhancer has been linked to carcinogenicity and thyroid hormone disruption.
Of these, only nitrates and nitrites are directly added to food while the other chemicals are indirect additives via their use in food packaging that directly touches the food.
How health care providers can help parents and children
“Insofar as these modifications can pose additional costs, barriers may exist for low-income families to reduce their exposure to food additives of concern,” the authors wrote. Health care providers “may wish to tailor guidance in the context of practicality, especially because food insecurity remains a substantial child health concern.”
Their recommendations on guidance for parents include:
- Prioritize fresh or frozen vegetables in meals. “Develop a list of low-cost sources for fresh fruits and vegetables” in the area.
- Avoid processed meats (particularly for mothers during pregnancy).
- Avoid microwaving food in plastic. This includes infant formula and pumped human milk.
- Avoid washing plastics in the dishwasher.
- Use plastic alternatives such as glass or stainless steel.
- Encourage both hand-washing and washing all fruits and vegetables.
- Look at recycling codes on products and avoid plastics with codes 3 (phthalates), 6 (styrene), and 7 (bisphenols) unless labeled as “biobased” or “greenware.”
The statement also encourages health care providers to advocate for updating and strengthening the Toxic Substances Control Act.
The committee also made multiple recommendations for government.
Dr. Trasande and coauthor Rachel M. Shaffer, MPH, received funding from some National Institutes of Health grants. The authors had no relevant financial disclosures.
SOURCES: Trasande L et al. Pediatrics. 2018 Jun 23. doi: 10.1542/peds.2018-1408; doi: 10.1542/ peds. 2018-1410.
The regulation of food additives needs an overhaul in the United States because of the risks these compounds pose to children and infants, according to a new policy statement by the American Academy of Pediatrics.
suggested members of the AAP Council on Environmental Health.
Among the additives of greatest concern, the statement notes, are bisphenols (including bisphenol A), phthalates, certain pesticides, perfluoroalkyl chemicals, perchlorate, artificial food colors, nitrates, and nitrites. A technical report accompanying the policy statement reviewed existing evidence on these compounds.
The statement, authored by the council led by Leonardo Trasande, MD, of New York University, noted that many of the more than 10,000 chemicals added to food and food packaging were grandfathered into use prior to current regulations. Further, approximately 1,000 of these chemicals fall under the Food and Drug Administration’s designation of “generally recognized as safe,” which does not require FDA approval for use.
“Current requirements for a ‘generally recognized as safe’ [GRAS] designation are insufficient to ensure the safety of food additives and do not contain sufficient protections against conflict of interest,” they wrote. “Additionally, the FDA does not have authority to obtain data on or reassess the safety of chemicals already on the market.” The FDA does not regularly consider cumulative effects of food additives or the synergistic effects of chemicals found in foods.
The authors noted that concerns about food additives have increased in the past 20 years as new research has identified adverse health effects, including endocrine disruption, associated with these chemicals.
Dr. Trasande and his associates also acknowledged the limited evidence available on food additives particularly for children and infants, but noted this population’s greater vulnerability to chemical exposures.
Compounds addressed in the statement
- Bisphenols. Health concerns tied to these chemicals are endocrine/neurodevelopmental disruption and obesogenic activity.
- Phthalates. Health concerns linked to these chemicals are endocrine disruption, obesogenic activity, oxidative stress, and cardiotoxicity.
- Perfluoroalkyl chemicals. Health concerns associated with these chemicals are immunosuppression, endocrine disruption, obesogenic activity, and decreased birth weight.
- Perchlorate. The health concern tied to this chemical is thyroid hormone disruption.
- Nitrates and nitrites. Use of these as a preservative and color enhancer has been linked to carcinogenicity and thyroid hormone disruption.
Of these, only nitrates and nitrites are directly added to food while the other chemicals are indirect additives via their use in food packaging that directly touches the food.
How health care providers can help parents and children
“Insofar as these modifications can pose additional costs, barriers may exist for low-income families to reduce their exposure to food additives of concern,” the authors wrote. Health care providers “may wish to tailor guidance in the context of practicality, especially because food insecurity remains a substantial child health concern.”
Their recommendations on guidance for parents include:
- Prioritize fresh or frozen vegetables in meals. “Develop a list of low-cost sources for fresh fruits and vegetables” in the area.
- Avoid processed meats (particularly for mothers during pregnancy).
- Avoid microwaving food in plastic. This includes infant formula and pumped human milk.
- Avoid washing plastics in the dishwasher.
- Use plastic alternatives such as glass or stainless steel.
- Encourage both hand-washing and washing all fruits and vegetables.
- Look at recycling codes on products and avoid plastics with codes 3 (phthalates), 6 (styrene), and 7 (bisphenols) unless labeled as “biobased” or “greenware.”
The statement also encourages health care providers to advocate for updating and strengthening the Toxic Substances Control Act.
The committee also made multiple recommendations for government.
Dr. Trasande and coauthor Rachel M. Shaffer, MPH, received funding from some National Institutes of Health grants. The authors had no relevant financial disclosures.
SOURCES: Trasande L et al. Pediatrics. 2018 Jun 23. doi: 10.1542/peds.2018-1408; doi: 10.1542/ peds. 2018-1410.
FROM PEDIATRICS
MHPAEA lowers out-of-pocket spending for families of children with mental illnesses
Families of children with mental health conditions had lower spending when enrolled in insurance plans under the Mental Health Parity and Addiction Equity Act, but these cost savings did not represent a “substantial improvement” for families at the higher end of mental health spending, according to results of a study published in Pediatrics.

They found children in plans subject to MHPAEA spent an average of $140 less on mental health care (95% confidence interval, −$196 to −$84), compared with expected “changes in the comparison group.” In families with a high level of spending for mental health, those who were insured with plans subject to parity had an average annual OOP mental health spending of $234 less (95% confidence interval, −$391 to −$76) than the comparison group.
In the first year after MHPAEA, all children subject to parity had $112 average lower spending (95% CI, −$167 to −$57), with $171 average lower spending (95% CI, −$241 to −$101) in the second year than the comparison group. Among high spenders, OOP spending was $210 lower (95% CI, −$414 to −$5) in the first year and $258 lower (95% CI, −$401 to −$114) in the second year than the comparison group.
Among patients with high mental health spending, there was a 0.5 increase in number of inpatient mental health days per year (95% CI, 0.1-0.9), according to the researchers. In addition, total mental health spending increased overall for high-spending families: Those who were self-insured paid an average of $5,302 preparity, compared with $8,708 postparity, whereas a comparison group of fully insured patients paid an average of $5,460 preparity, compared with $9,177 postparity.
“Our finding of a reduction in OOP mental health spending attributable to parity among all children with mental health conditions is consistent with the limited body of literature focused on children,” Dr. Kennedy-Hendricks and her colleagues wrote. “Although the estimated reduction in OOP spending was larger for children with high spending than among children with mental health conditions more broadly, given the much higher average annual OOP spending preparity among the high-spending group, this constitutes a relatively small reduction in OOP spending attributable to the law.”
The researchers noted as potential limitations that there may be differences in the children in the exposed and comparison group; selection of the high-spending group was based on both preparity and postparity; and there may be potential differences in other states not studied.
This study was funded by the National Institutes of Health and supported by a grant from the National Institute of Mental Health. The authors reported no relevant financial disclosures.
SOURCE: Kennedy-Hendricks A et al. Pediatrics. 2018 Jul 23. doi: 10.1542/peds.2017-2618.
While “we all hoped” mental health parity would achieve cost savings and improve payment of mental and physical health services, as well as workforce and access issues, there are limited savings seen when applying parity to these services for children. In addition, the study by Dr. Kennedy-Hendricks and associates revealed overall mental health spending and use more than doubled, which remains unexplained by parity, James M. Perrin, MD, said in an editorial.
He said, “the bottom line is that parity has some (but only limited) impact on the access to and costs of mental health services.” Other efforts, such as those to help prevent mental health conditions and integrate treatment of mental and behavioral health with the rest of pediatric health care, should be considered.
Can mental health parity still play a role? “The current study offers some hope, although it also suggests the need to monitor and enforce parity better than what seems to have occurred at least in its early years,” Dr. Perrin said. “Parity seems less likely to improve preventive efforts unless mental health benefits clearly support the many effective preventive interventions.”
“With a growing emphasis on the importance of mental and behavioral health and their influences on many other aspects of the health of children and adults, it may be time to think more imaginatively about health care financing that can better ensure attention to mental health concerns broadly,” he said. While new alternative payment models may help bridge the gap, this study emphasizes the need to improve the way in which mental and behavioral health care is paid.
Dr. Perrin is at the MassGeneral Hospital for Children and Harvard Medical School, both in Boston. He reported no relevant conflicts of interest. These comments summarize his editorial accompanying the article by Dr. Kennedy-Hendricks and associates. (Pediatrics. 2018 Jul 23. doi: 10.1542/peds.2018-1572 ).
Families of children with mental health conditions had lower spending when enrolled in insurance plans under the Mental Health Parity and Addiction Equity Act, but these cost savings did not represent a “substantial improvement” for families at the higher end of mental health spending, according to results of a study published in Pediatrics.
They found children in plans subject to MHPAEA spent an average of $140 less on mental health care (95% confidence interval, −$196 to −$84), compared with expected “changes in the comparison group.” In families with a high level of spending for mental health, those who were insured with plans subject to parity had an average annual OOP mental health spending of $234 less (95% confidence interval, −$391 to −$76) than the comparison group.
In the first year after MHPAEA, all children subject to parity had $112 average lower spending (95% CI, −$167 to −$57), with $171 average lower spending (95% CI, −$241 to −$101) in the second year than the comparison group. Among high spenders, OOP spending was $210 lower (95% CI, −$414 to −$5) in the first year and $258 lower (95% CI, −$401 to −$114) in the second year than the comparison group.
Among patients with high mental health spending, there was a 0.5 increase in number of inpatient mental health days per year (95% CI, 0.1-0.9), according to the researchers. In addition, total mental health spending increased overall for high-spending families: Those who were self-insured paid an average of $5,302 preparity, compared with $8,708 postparity, whereas a comparison group of fully insured patients paid an average of $5,460 preparity, compared with $9,177 postparity.
“Our finding of a reduction in OOP mental health spending attributable to parity among all children with mental health conditions is consistent with the limited body of literature focused on children,” Dr. Kennedy-Hendricks and her colleagues wrote. “Although the estimated reduction in OOP spending was larger for children with high spending than among children with mental health conditions more broadly, given the much higher average annual OOP spending preparity among the high-spending group, this constitutes a relatively small reduction in OOP spending attributable to the law.”
The researchers noted as potential limitations that there may be differences in the children in the exposed and comparison group; selection of the high-spending group was based on both preparity and postparity; and there may be potential differences in other states not studied.
This study was funded by the National Institutes of Health and supported by a grant from the National Institute of Mental Health. The authors reported no relevant financial disclosures.
SOURCE: Kennedy-Hendricks A et al. Pediatrics. 2018 Jul 23. doi: 10.1542/peds.2017-2618.
FROM PEDIATRICS
Key clinical point:
Major finding: Parity yielded $140 less spending on mental health care–associated costs, compared with expected changes in the comparison group.
Study details: An analysis of inpatient, outpatient, and pharmaceutical claims data of children with mental health conditions from the Health Care Cost Institute between 2008 and 2012.
Disclosures: This study was funded by the National Institutes of Health and supported by a grant from the National Institute of Mental Health. The authors reported no relevant financial disclosures.
Source: Kennedy-Hendricks A et al. Pediatrics. 2018 Jul 23. doi: 10.1542/peds.2017-2618.
Trauma surgeons up for emergency pediatric appendectomy
But a study of 220 children who had emergency appendectomies found only minor differences in outcomes between those operated on by a trauma surgeon and those by a pediatric surgeon.
“These results may be useful in optimizing the surgical workforce to care for a community,” said Derek B. Wall, MD, FACS, and Carlos Ortega, MD, FACS, of NorthShore University HealthSystem in Skokie, Ill. They noted that trauma surgeons in their group were asked to cover appendicitis in children aged 5-10 years because of the surgeons’ in-house availability and because of the difficulty pediatric surgeons often had in getting to the hospital in a timely fashion.
The study was done at Evanston (Ill.) Hospital, a Level 1 trauma center in the northern suburbs of Chicago. This trauma group were all board certified in general surgery, but none had received formal pediatric surgery fellowship training.
The study, published in the Journal of Trauma and Acute Surgery, evaluated appendectomies in children aged 5-10 years from January 2007 to December 2016. A total of 138 were performed by trauma surgeons, while 82 were done by pediatric surgeons. The patients operated on by trauma surgeons were more likely to be female (47% vs. 32%; P = .03), get to surgery more quickly (214 minutes from diagnosis vs. 318 minutes; P = .01), have a laparoscopic operation (70% vs. 55%; P = .04), have a shorter operation (40 minutes vs. 49 minutes; P less than .0001), and leave the hospital sooner (32 hours vs. 41 hours; P less than .0001). They were also more likely to be transferred from an outside hospital (60% vs. 37%; P less than .001) and less likely to be diagnosed without imaging (2% vs. 26%; P less than .0001). The study found no significant differences in complications.
Among the 31 patients who had perforated appendix, the difference in length of stay was even more pronounced: 4 days in the trauma surgery group (n = 21) versus 7.2 days in the pediatric surgery patients.
The investigators explained the rationale for focusing on the population aged 5-10 years: “We focused on a younger, narrower age range than that in previous studies, allowing comparison of outcomes in children of the same age and with equal rates of perforated appendicitis.” They noted that patients younger than age 5 are “well accepted as the domain of the pediatric surgeon,” while children over than 10 are more frequently managed by general surgeons.
At Evanston Hospital, pediatric surgeons had typically performed appendectomy in the targeted age group. But, “they cannot always quickly get to our hospital because of distance and city traffic,” the study authors noted. Therefore, the trauma surgeons were asked to cover for this population group.
They acknowledged the population size of the study was probably too small to identify any significant difference in complication rates between the two surgery groups, especially for patients who had had perforated appendicitis. Also, because of the study’s retrospective nature, most of the pediatric surgery cases were from an earlier period; therefore, later cases may have reflected advances in minimally invasive technology. “Perhaps surgical practice in a more recent time period contributes more to outcomes than specialty,” investigators wrote.
Dr. Wall and Dr. Ortega reported having no financial relationships.
SOURCE: Wall DB, Ortega C. J Trauma Acute Care Surg. 2018:85;118-21.
FROM THE JOURNAL OF TRAUMA AND ACUTE CARE SURGERY
Key clinical point: Trauma surgeons performed emergency pediatric appendectomy as well as pediatric surgeons did.
Major finding: Hospital stays averaged 32 and 41 hours for patients treated by trauma surgeons and pediatric surgeons, respectively.
Study details: Retrospective chart review of 220 children aged 5-10 years who had emergency appendectomy at a suburban Level 1 trauma center during 2007-2016.
Disclosures: The investigators reported having no financial relationships.
Source: Wall DB et al. J Trauma Acute Care Surg. 2018:85;118-21.
Children’s ‘gluten-free’ foods are no healthier than others
Children’s foods labeled as gluten-free (GF) generally had less sodium and fat than other foods marketed for children, but they also had a higher percentage of calories from sugar, a study in Pediatrics found. Further,

Parents and caregivers who are purchasing gluten-free products should carefully assess product labels. Another positive step would be to serve whole, unprocessed food, she wrote in Pediatrics.
Dr. Elliott purchased all child-targeted packaged foods available at two major supermarket chains in Alberta from February 2017 to March 2017, excluding candy, chocolate, potato chips, cheese-flavored snacks, sugary sodas, and similar “junk food” products. Of the 374 foods purchased, 18% had gluten-free claims.
“The intent was to examine the regular foods that have been repackaged to attract children,” she wrote, which she defined as meeting any of the following criteria qualified:
- Contains the word “child” or “kids’” in the product or brand name.
- Has the word “fun” or “play” on the package.
- The foods are linked to children’s TV programs, toys, or movies.
- The foods are promoted for lunch boxes.
- Contains graphics or activities, or promotional offers, intended for children.
- “Presents unusual or child-oriented shapes, unusual colors, or playful product names or tastes.”
Dr. Elliott compared the nutritional content of products labeled as gluten-free with that of products without a gluten-free label based on 100-g servings. She then compared the same GF-labeled products to their equivalent products without a GF label, when possible.
She used the Pan American Health Organization (PAHO) Nutrient Profile Model to evaluate the foods. PAHO criteria for nutritionally poor qualities include the following when applied to “processed” and “ultraprocessed” foods:
- A ratio between sodium and calories greater than or equal to 1.
- Total calories from sugar (glucose, fructose, and disaccharides) at least 10% or more of total calories.
- Contains other nonsugar sweeteners.
- Total calories from fat are at least 30% or more of total calories.
- Total saturated fat is at least at least 10% or more of total calories.
Nearly all the non-gluten free children’s foods (97%) and 88% of the children’s gluten-free foods were considered to have poor nutritional quality (P less than .001). High sugar content was present in 79% of gluten-free products and 81% of their gluten-containing equivalent products (P less than .001).
These foods can be classified as unhealthy because of “their high levels of sugar, sodium, and/or fat, which means that the options for purchasing healthy packaged foods are limited,” Dr. Elliott wrote.
Gluten free–labeled products did have less sodium, total fat, and saturated fat than did those without gluten-free claims, but sugar levels were higher and protein levels lower (nonstatistically significant) in gluten-free products.
“Such findings echo those in other studies of child-targeted supermarket foods and reveal that products marketed as ‘better for you’ for children are as much about marketing as they are about nutrition,” Dr. Elliott wrote. “Given children’s lower daily caloric intake and the challenges associated with consuming a nutrient-rich, gluten-free diet for children with celiac disease in particular, it is important that the products designed for children are held to a higher nutritional standard.”
The study’s biggest limitations are its inability to represent all child-marketed packaged foods available in stores and the fact that many foods labeled as “gluten-free” would not have gluten in them anyway, such as apple sauce and fruit snacks.
“In this case, the use of a gluten-free claim on products that are inherently free of gluten might be understood as a marketing tool directed at consumers who view gluten-free products as healthier than their regular counterparts,” Dr. Elliott noted
The research was funded by the Canadian Institutes of Health Research’s Canada Research Chairs Program. Dr. Elliott had no relevant financial disclosures.
SOURCE: Elliott C. Pediatrics. 2018 Jul 20. doi: 10.1542/peds.2018-0525.
Children’s foods labeled as gluten-free (GF) generally had less sodium and fat than other foods marketed for children, but they also had a higher percentage of calories from sugar, a study in Pediatrics found. Further,
Parents and caregivers who are purchasing gluten-free products should carefully assess product labels. Another positive step would be to serve whole, unprocessed food, she wrote in Pediatrics.
Dr. Elliott purchased all child-targeted packaged foods available at two major supermarket chains in Alberta from February 2017 to March 2017, excluding candy, chocolate, potato chips, cheese-flavored snacks, sugary sodas, and similar “junk food” products. Of the 374 foods purchased, 18% had gluten-free claims.
“The intent was to examine the regular foods that have been repackaged to attract children,” she wrote, which she defined as meeting any of the following criteria qualified:
- Contains the word “child” or “kids’” in the product or brand name.
- Has the word “fun” or “play” on the package.
- The foods are linked to children’s TV programs, toys, or movies.
- The foods are promoted for lunch boxes.
- Contains graphics or activities, or promotional offers, intended for children.
- “Presents unusual or child-oriented shapes, unusual colors, or playful product names or tastes.”
Dr. Elliott compared the nutritional content of products labeled as gluten-free with that of products without a gluten-free label based on 100-g servings. She then compared the same GF-labeled products to their equivalent products without a GF label, when possible.
She used the Pan American Health Organization (PAHO) Nutrient Profile Model to evaluate the foods. PAHO criteria for nutritionally poor qualities include the following when applied to “processed” and “ultraprocessed” foods:
- A ratio between sodium and calories greater than or equal to 1.
- Total calories from sugar (glucose, fructose, and disaccharides) at least 10% or more of total calories.
- Contains other nonsugar sweeteners.
- Total calories from fat are at least 30% or more of total calories.
- Total saturated fat is at least at least 10% or more of total calories.
Nearly all the non-gluten free children’s foods (97%) and 88% of the children’s gluten-free foods were considered to have poor nutritional quality (P less than .001). High sugar content was present in 79% of gluten-free products and 81% of their gluten-containing equivalent products (P less than .001).
These foods can be classified as unhealthy because of “their high levels of sugar, sodium, and/or fat, which means that the options for purchasing healthy packaged foods are limited,” Dr. Elliott wrote.
Gluten free–labeled products did have less sodium, total fat, and saturated fat than did those without gluten-free claims, but sugar levels were higher and protein levels lower (nonstatistically significant) in gluten-free products.
“Such findings echo those in other studies of child-targeted supermarket foods and reveal that products marketed as ‘better for you’ for children are as much about marketing as they are about nutrition,” Dr. Elliott wrote. “Given children’s lower daily caloric intake and the challenges associated with consuming a nutrient-rich, gluten-free diet for children with celiac disease in particular, it is important that the products designed for children are held to a higher nutritional standard.”
The study’s biggest limitations are its inability to represent all child-marketed packaged foods available in stores and the fact that many foods labeled as “gluten-free” would not have gluten in them anyway, such as apple sauce and fruit snacks.
“In this case, the use of a gluten-free claim on products that are inherently free of gluten might be understood as a marketing tool directed at consumers who view gluten-free products as healthier than their regular counterparts,” Dr. Elliott noted
The research was funded by the Canadian Institutes of Health Research’s Canada Research Chairs Program. Dr. Elliott had no relevant financial disclosures.
SOURCE: Elliott C. Pediatrics. 2018 Jul 20. doi: 10.1542/peds.2018-0525.
FROM PEDIATRICS
Key clinical point: Most prepackaged gluten-free foods marketed for children are unhealthy.
Major finding: Of gluten-free packaged children’s foods, 88% had poor nutritional quality, as did 97% of children’s food not labeled as gluten-free.
Study details: The findings are based on a comparison of 374 child-marketed packaged foods, including 66 gluten free–labeled foods and their non-gluten free equivalents and other non-gluten free foods.
Disclosures: The research was funded by the Canadian Institutes of Health Research’s Canada Research Chairs Program. Dr. Elliott had no relevant financial disclosures.
Source: Elliott C. Pediatrics. 2018 Jul 20. doi: 10.1542/peds.2018-0525.
Recommendations aim to reduce pediatric nephrology testing
Evidence-based recommendations for appropriate nephrology testing in children are the latest installment of the American Board of Internal Medicine Foundation’s “Choosing Wisely” campaign.
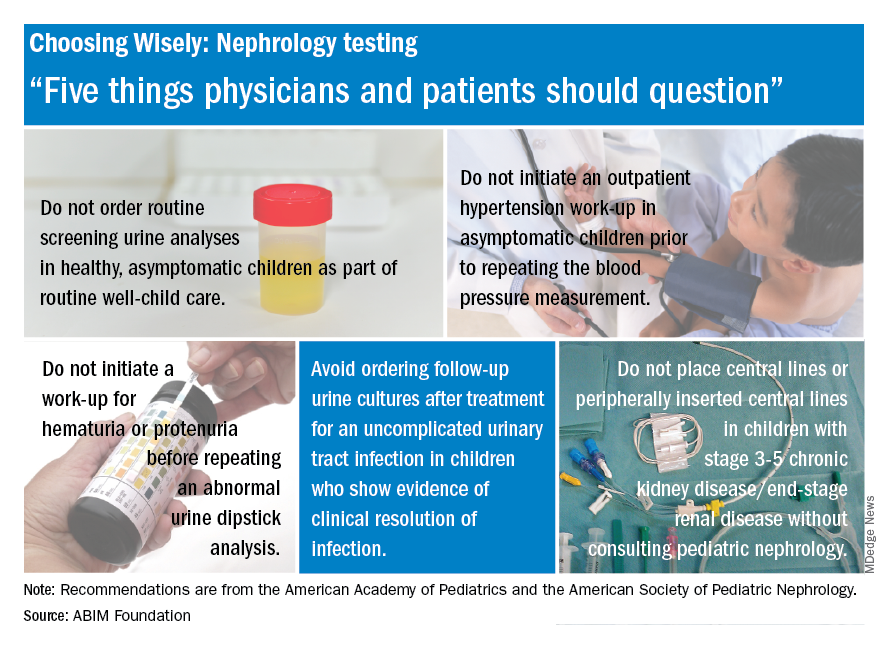
The list includes recommendations on when not to order screening urine analyses and urine cultures, initiate hypertension workups, and place central lines. “Sometimes parents or physicians want to ensure all available testing is done, but unnecessary testing can create more fear, cost, and risk for children. Good communication and discussion of options can help reduce the likelihood of unnecessary testing,” said Doug Silverstein, MD, chairperson of the AAP section on nephrology.
Evidence-based recommendations for appropriate nephrology testing in children are the latest installment of the American Board of Internal Medicine Foundation’s “Choosing Wisely” campaign.
The list includes recommendations on when not to order screening urine analyses and urine cultures, initiate hypertension workups, and place central lines. “Sometimes parents or physicians want to ensure all available testing is done, but unnecessary testing can create more fear, cost, and risk for children. Good communication and discussion of options can help reduce the likelihood of unnecessary testing,” said Doug Silverstein, MD, chairperson of the AAP section on nephrology.
Respiratory illness is the most common pediatric emergency in ambulatory settings
followed by psychiatric and behavioral illness, seizures, and syncope, according to results published July 20 in Pediatrics.
Investigators conducted a retrospective observational study of data from the Indianapolis emergency medical services (EMS) system between Jan. 1, 2012, and Dec. 31, 2014. All patients younger than 18 years were eligible.
Of 38,841 pediatric EMS transports in the Indianapolis metropolitan area during the 3-year period, fewer than 1% (322) were verified as originating from an ambulatory practice, reported Matthew L. Yuknis, MD, and his coauthors at Indiana University, Indianapolis. Respiratory distress was the most common emergency (58%), followed by psychiatric and behavioral illness (6%), seizure (6%), and syncope (5%).
The most common interventions were use of supplemental oxygen (27%), albuterol (26%), and intravascular access (11%). The most common critical care interventions were administration of fluid bolus (2%), benzodiazepine (2%), or racemic or intramuscular epinephrine (1%). None required use of an artificial airway, cardiopulmonary resuscitation, intraosseous access, or bag mask ventilation, Dr. Yuknis and his colleagues said.
The average time from call to on-scene arrival was 6 minutes (ranging from less than 1 to 15 minutes). The average patient transport time was 13 minutes (ranging from less than 1 to 38 minutes). The average annual frequency of pediatric outpatient emergencies was 42 emergencies per 100,000 people under 18 years of age. Lower socioeconomic status was correlated with increased frequency of emergencies in ambulatory settings, the authors reported.
“These findings update and clarify existing literature with regard to the frequency of pediatric emergencies in the ambulatory setting, the conditions these patients present with, and the use of EMS data to define these events,” the authors wrote. Additionally, the findings can be used to “inform future decisions regarding necessary equipment and procedures.”
No relevant financial disclosures were reported. There was no external funding.
SOURCE: Yuknis M et al. Pediatrics. 2018. doi: 10.1542/peds.2017-3082.
FROM PEDIATRICS
Key clinical point: Respiratory illness was the most common pediatric emergency in ambulatory settings.
Major finding: Among pediatric emergency medical services from ambulatory settings, 58% were caused by respiratory illness.
Study details: A retrospective observational study of 38,841 EMS transports in the Indianapolis metropolitan area over 3 years.
Disclosures: No relevant financial disclosures were reported. There was no external funding.
Source: Yuknis M et al. Pediatrics. 2018. doi: 10.1542/peds.2017-3082.
CARRA continues to lead the North American pediatric rheumatology research community
This year’s annual meeting of the Childhood Arthritis & Rheumatology Research Alliance (CARRA) saw a growing number of participants and new developments in collaborative research projects.

CARRA continues to work in unison with the Arthritis Foundation, which has supported an intramural grant program, a pilot program to support registry sites, and a project to develop a clinically useful electronic dashboard to allow patients and clinicians to coproduce care and make treatment decisions. CARRA and the Arthritis Foundation support an externally-led Food and Drug Administration initiative called the Patient-Focused Drug Development program to bring patient voices into the arena of drug development. The Patient-Centered Outcomes Research Institute (PCORI) is also funding development of a patient-centered learning health system within the Patients, Advocates and Rheumatology Teams Network for Research and Service (PARTNERS).

The meeting featured premeetings for patients and parents, fellows, the CARRA registry, and a research basics course. During the meeting, 81 abstracts based on work supported by CARRA were presented and were published in Pediatric Rheumatology (Pediatr Rheumatol. 2018;16[Suppl 1]:42. doi: 10.1186/s12969-018-0252-y). There were 57 workgroup/committee meetings with parents and patients, providing input on the research agenda. This included workgroups addressing juvenile dermatomyositis, JIA, pain, systemic lupus erythematosus, scleroderma, vasculitis, and autoinflammatory and rare diseases. There were also meetings for small centers, translational research, transition to adult care, and early investigators.
The next meeting will be held in Louisville, Ky., April 10-14, 2019.
Dr. Klein-Gitelman is professor of pediatrics at Northwestern University, Chicago, and is a pediatric rheumatologist at the Ann & Robert H. Lurie Children’s Hospital of Chicago. Dr. Kimura is past president of CARRA and is chief of pediatric rheumatology at the Joseph M. Sanzari Children’s Hospital at Hackensack (N.J.) University Medical Center.
This year’s annual meeting of the Childhood Arthritis & Rheumatology Research Alliance (CARRA) saw a growing number of participants and new developments in collaborative research projects.
CARRA continues to work in unison with the Arthritis Foundation, which has supported an intramural grant program, a pilot program to support registry sites, and a project to develop a clinically useful electronic dashboard to allow patients and clinicians to coproduce care and make treatment decisions. CARRA and the Arthritis Foundation support an externally-led Food and Drug Administration initiative called the Patient-Focused Drug Development program to bring patient voices into the arena of drug development. The Patient-Centered Outcomes Research Institute (PCORI) is also funding development of a patient-centered learning health system within the Patients, Advocates and Rheumatology Teams Network for Research and Service (PARTNERS).
The meeting featured premeetings for patients and parents, fellows, the CARRA registry, and a research basics course. During the meeting, 81 abstracts based on work supported by CARRA were presented and were published in Pediatric Rheumatology (Pediatr Rheumatol. 2018;16[Suppl 1]:42. doi: 10.1186/s12969-018-0252-y). There were 57 workgroup/committee meetings with parents and patients, providing input on the research agenda. This included workgroups addressing juvenile dermatomyositis, JIA, pain, systemic lupus erythematosus, scleroderma, vasculitis, and autoinflammatory and rare diseases. There were also meetings for small centers, translational research, transition to adult care, and early investigators.
The next meeting will be held in Louisville, Ky., April 10-14, 2019.
Dr. Klein-Gitelman is professor of pediatrics at Northwestern University, Chicago, and is a pediatric rheumatologist at the Ann & Robert H. Lurie Children’s Hospital of Chicago. Dr. Kimura is past president of CARRA and is chief of pediatric rheumatology at the Joseph M. Sanzari Children’s Hospital at Hackensack (N.J.) University Medical Center.

NAFLD less common, more severe in black children
ORLANDO – according to a review of 503 adolescents at the Yale University pediatric obesity clinic in New Haven, Conn.

As childhood obesity rates have climbed – the prevalence is now estimated to be around 20% – there’s been a corresponding increase in pediatric NAFLD, but it’s not very well characterized in children, and “there are many gaps in our knowledge,” said Nicola Santoro, MD, PhD, an assistant professor of pediatric endocrinology at Yale, and senior author of the review.
The goal of the work was to begin to plug the gaps. The children had baseline abdominal MRIs to quantify their hepatic fat content, along with oral glucose tolerance tests and genotyping for three single nucleotide polymorphisms (SNPs) strongly associated with the condition (PNPLA3 rs738409, GCKR rs1260326, and TM6SF2 rs58542926). MRI and metabolic testing were repeated at a mean of 2.27 years in 133 children.
The subjects were 13 years old on average, with a mean body mass index z-score of 2.52; 191 were white, 134 black, and 178 Hispanic. NAFLD was defined as a hepatic fat content of at least 5.5%.
The prevalence of fatty liver was 41.6% but ranged widely by ethnicity, with NAFLD diagnosed in 60% of Hispanic, 43% of white, but only 16% of black children. Among all three groups, prevalence was higher among boys.
Although NAFLD was least common among black children, when it was present, it was worse. Black children with NAFLD, compared with others, had the highest fasting glucose and 2-hour glucose levels; the highest insulin and C-peptide levels, and the highest hemoglobin A1c, despite similar age and gender distribution across the groups.
The findings translated to a higher prevalence of prediabetes and type 2 diabetes mellitus (66.6%), compared with white (24.4%) and Hispanic children (31.1%) with NAFLD.
Among 76 children who didn’t have NAFLD at baseline, 17 were diagnosed with the condition at follow-up. Progressors, compared with nonprogressors, showed higher baseline C-peptide levels (about 1,250 pmol/L versus 1,000 pmol/L) and greater weight gain (increase, versus a loss of, about 0.1 point on body mass index z-scores). Black children were the least likely to progress to NAFLD.
Increasing BMI z-score, higher baseline fasting C-peptide levels, and nonblack race strongly predicted progression (area under the curve = 0.887). The risk of progression was even higher when a NAFLD SNP was on board (AUC equal to or greater than 0.96).
Of 57 children with NAFLD at baseline, 13 didn’t meet the definition at follow-up, but regression turned out to be harder to predict. Regressors showed lower intrahepatic fat fractions at baseline (about 10% versus 20%), and a lowering of BMI z-scores at follow-up. Adding SNPs didn’t improve the model (AUC = 0.756).
As in adults, weight loss is the single most important factor to reverse NAFLD. “Even if you lose only a few kilos, fatty liver can go away. The liver cleans up pretty easily, but if you keep your weight, or you gain even a little bit, the disease keeps progressing,” Dr. Santoro said at the annual scientific sessions of the American Diabetes Association.
The investigators didn’t have any disclosures. The work was funded by the National Institutes of Health.
*This story was updated on 7/20/2018.
SOURCE: Trico D et al. ADA 2018, Abstract 313-OR.
ORLANDO – according to a review of 503 adolescents at the Yale University pediatric obesity clinic in New Haven, Conn.
As childhood obesity rates have climbed – the prevalence is now estimated to be around 20% – there’s been a corresponding increase in pediatric NAFLD, but it’s not very well characterized in children, and “there are many gaps in our knowledge,” said Nicola Santoro, MD, PhD, an assistant professor of pediatric endocrinology at Yale, and senior author of the review.
The goal of the work was to begin to plug the gaps. The children had baseline abdominal MRIs to quantify their hepatic fat content, along with oral glucose tolerance tests and genotyping for three single nucleotide polymorphisms (SNPs) strongly associated with the condition (PNPLA3 rs738409, GCKR rs1260326, and TM6SF2 rs58542926). MRI and metabolic testing were repeated at a mean of 2.27 years in 133 children.
The subjects were 13 years old on average, with a mean body mass index z-score of 2.52; 191 were white, 134 black, and 178 Hispanic. NAFLD was defined as a hepatic fat content of at least 5.5%.
The prevalence of fatty liver was 41.6% but ranged widely by ethnicity, with NAFLD diagnosed in 60% of Hispanic, 43% of white, but only 16% of black children. Among all three groups, prevalence was higher among boys.
Although NAFLD was least common among black children, when it was present, it was worse. Black children with NAFLD, compared with others, had the highest fasting glucose and 2-hour glucose levels; the highest insulin and C-peptide levels, and the highest hemoglobin A1c, despite similar age and gender distribution across the groups.
The findings translated to a higher prevalence of prediabetes and type 2 diabetes mellitus (66.6%), compared with white (24.4%) and Hispanic children (31.1%) with NAFLD.
Among 76 children who didn’t have NAFLD at baseline, 17 were diagnosed with the condition at follow-up. Progressors, compared with nonprogressors, showed higher baseline C-peptide levels (about 1,250 pmol/L versus 1,000 pmol/L) and greater weight gain (increase, versus a loss of, about 0.1 point on body mass index z-scores). Black children were the least likely to progress to NAFLD.
Increasing BMI z-score, higher baseline fasting C-peptide levels, and nonblack race strongly predicted progression (area under the curve = 0.887). The risk of progression was even higher when a NAFLD SNP was on board (AUC equal to or greater than 0.96).
Of 57 children with NAFLD at baseline, 13 didn’t meet the definition at follow-up, but regression turned out to be harder to predict. Regressors showed lower intrahepatic fat fractions at baseline (about 10% versus 20%), and a lowering of BMI z-scores at follow-up. Adding SNPs didn’t improve the model (AUC = 0.756).
As in adults, weight loss is the single most important factor to reverse NAFLD. “Even if you lose only a few kilos, fatty liver can go away. The liver cleans up pretty easily, but if you keep your weight, or you gain even a little bit, the disease keeps progressing,” Dr. Santoro said at the annual scientific sessions of the American Diabetes Association.
The investigators didn’t have any disclosures. The work was funded by the National Institutes of Health.
*This story was updated on 7/20/2018.
SOURCE: Trico D et al. ADA 2018, Abstract 313-OR.
REPORTING FROM ADA 2018
Key clinical point: Obese black children are less likely than others to develop non-alcoholic fatty liver disease, but more likely to suffer its consequences if they do.
Major finding: Black children with NAFLD had a higher prevalence of prediabetes and type 2 diabetes (66.6%), compared with white (24.4%) and Hispanic children (31.1%).
Study details: Review of 503 obese adolescents
Disclosures: The investigators didn’t have any disclosures. The work was funded by the National Institutes of Health.
Source: Trico D et al. ADA 2018, Abstract 313-OR.
Site of morphea lesions predicts risk of extracutaneous manifestations
LAKE TAHOE, CALIF. – Morphea lesions on the extensor extremities, face, and superior head are associated with higher rates of extracutaneous involvement, results from a multicenter retrospective study showed.

“We know that risk is highest with linear morphea,” lead study author Yvonne E. Chiu, MD, said at the annual meeting of the Society for Pediatric Dermatology. “Specifically, . However, risk stratification within each of those sites has never really been studied before.”
Dr. Chiu, who is a pediatric dermatologist at the Medical College of Wisconsin and Children’s Hospital of Wisconsin in Milwaukee, and her associates carried out a 14-site retrospective study in an effort to characterize morphea lesional distribution and to determine which sites had the highest risk for extracutaneous manifestations. They limited the analysis to patients with pediatric-onset morphea before the age of 18 and adequate lesional photographs in their clinical record. Patients with extragenital lichen sclerosis and atrophoderma were included in the analysis, but those with pansclerotic morphea and eosinophilic fasciitis were excluded. The researchers used custom web-based software to map the morphea lesions, and linked those data to a REDCap database where demographic and clinical information was stored. From this, the researchers tracked neurologic symptoms such as seizures, migraine headaches, other headaches, or any other neurologic signs or symptoms; neurologic testing results from those who underwent MRI, CT, and EEG; musculoskeletal symptoms such as arthritis, arthralgias, joint contracture, leg length discrepancy, and other musculoskeletal issues, as well as ophthalmologic manifestations including uveitis and other ophthalmologic symptoms. Logistic regression was used to analyze association of body sites with extracutaneous involvement.
Dr. Chiu, who also directs the dermatology residency program at the Medical College of Wisconsin, reported findings from 826 patients with 2,467 skin lesions of morphea, or an average of about 1.92 lesions per patient. Consistent with prior reports, most patients were female (73%), and the most prevalent subtype was linear morphea (56%), followed by plaque (29%), generalized (8%), and mixed (7%).
The trunk was the single most commonly affected body site, seen in 36% of cases. “However, if you lumped all body sites together, the extremities were the most commonly affected site (44%), while 16% of lesions involved the head and 4% involved the neck,” Dr. Chiu said. Patients with linear morphea had the highest rate of extracutaneous involvement. Specifically, 34% had musculoskeletal involvement, 24% had neurologic involvement, and 10% had ophthalmologic involvement. There were small rates of extracutaneous manifestations in the other types of morphea as well.
The most common musculoskeletal complications among patients with linear morphea were arthralgias (20%) and joint contractures (17%), followed by other musculoskeletal complications (15%), leg length discrepancy (5%), and arthritis (2%). Contrary to previously published reports, nonmigraine headaches were more common than seizures among patients with linear morphea (17% vs. 4%, respectively), while 4% of subjects had migraine headaches. Of the 134 subjects who underwent neuroimaging, 19% had abnormal results. Ophthalmologic complications were rare among patients overall, with the exception of those who had linear morphea. Of these cases, 1% had uveitis, and 9% had some other ophthalmologic condition.
Among all patients, the researchers found that left-extremity and extensor-extremity lesions had a stronger association with musculoskeletal involvement (odds ratios of 1.26 and 1.94, respectively). “The reasons for this are unclear,” Dr. Chiu said. “We didn’t assess handedness in our study, but that perhaps could explain it; 90% of the general population is right-hand dominant, so perhaps there’s some sort of protective effect if you’re using an extremity more. Joint contractures showed the greatest discrepancy between left and right extremity. So perhaps if you’re using that one side more, you’re less likely to have a joint contracture.”
When the researchers limited the analysis to head lesions, they observed no significant difference in the lesions between the left and right head (OR, 0.72), but anterior head lesions had a stronger association with neurologic signs or symptoms, compared with posterior head lesions (OR, 2.56), as did superior head lesions, compared with inferior head lesions (OR, 2.23). The association between head lesion location and ophthalmologic involvement was not significant.
“The odds of extracutaneous manifestations vary by site of morphea lesions, with higher odds seen on the left extremity, extensor extremity, the anterior head, and the superior head,” Dr. Chiu concluded. “Further research can be done to perhaps help us decide whether this necessitates difference in management or screening.”
The project was funded by the Pediatric Dermatology Research Alliance and the SPD. Dr. Chiu reported having no relevant financial disclosures.
dbrunk@mdedge.com
LAKE TAHOE, CALIF. – Morphea lesions on the extensor extremities, face, and superior head are associated with higher rates of extracutaneous involvement, results from a multicenter retrospective study showed.
“We know that risk is highest with linear morphea,” lead study author Yvonne E. Chiu, MD, said at the annual meeting of the Society for Pediatric Dermatology. “Specifically, . However, risk stratification within each of those sites has never really been studied before.”
Dr. Chiu, who is a pediatric dermatologist at the Medical College of Wisconsin and Children’s Hospital of Wisconsin in Milwaukee, and her associates carried out a 14-site retrospective study in an effort to characterize morphea lesional distribution and to determine which sites had the highest risk for extracutaneous manifestations. They limited the analysis to patients with pediatric-onset morphea before the age of 18 and adequate lesional photographs in their clinical record. Patients with extragenital lichen sclerosis and atrophoderma were included in the analysis, but those with pansclerotic morphea and eosinophilic fasciitis were excluded. The researchers used custom web-based software to map the morphea lesions, and linked those data to a REDCap database where demographic and clinical information was stored. From this, the researchers tracked neurologic symptoms such as seizures, migraine headaches, other headaches, or any other neurologic signs or symptoms; neurologic testing results from those who underwent MRI, CT, and EEG; musculoskeletal symptoms such as arthritis, arthralgias, joint contracture, leg length discrepancy, and other musculoskeletal issues, as well as ophthalmologic manifestations including uveitis and other ophthalmologic symptoms. Logistic regression was used to analyze association of body sites with extracutaneous involvement.
Dr. Chiu, who also directs the dermatology residency program at the Medical College of Wisconsin, reported findings from 826 patients with 2,467 skin lesions of morphea, or an average of about 1.92 lesions per patient. Consistent with prior reports, most patients were female (73%), and the most prevalent subtype was linear morphea (56%), followed by plaque (29%), generalized (8%), and mixed (7%).
The trunk was the single most commonly affected body site, seen in 36% of cases. “However, if you lumped all body sites together, the extremities were the most commonly affected site (44%), while 16% of lesions involved the head and 4% involved the neck,” Dr. Chiu said. Patients with linear morphea had the highest rate of extracutaneous involvement. Specifically, 34% had musculoskeletal involvement, 24% had neurologic involvement, and 10% had ophthalmologic involvement. There were small rates of extracutaneous manifestations in the other types of morphea as well.
The most common musculoskeletal complications among patients with linear morphea were arthralgias (20%) and joint contractures (17%), followed by other musculoskeletal complications (15%), leg length discrepancy (5%), and arthritis (2%). Contrary to previously published reports, nonmigraine headaches were more common than seizures among patients with linear morphea (17% vs. 4%, respectively), while 4% of subjects had migraine headaches. Of the 134 subjects who underwent neuroimaging, 19% had abnormal results. Ophthalmologic complications were rare among patients overall, with the exception of those who had linear morphea. Of these cases, 1% had uveitis, and 9% had some other ophthalmologic condition.
Among all patients, the researchers found that left-extremity and extensor-extremity lesions had a stronger association with musculoskeletal involvement (odds ratios of 1.26 and 1.94, respectively). “The reasons for this are unclear,” Dr. Chiu said. “We didn’t assess handedness in our study, but that perhaps could explain it; 90% of the general population is right-hand dominant, so perhaps there’s some sort of protective effect if you’re using an extremity more. Joint contractures showed the greatest discrepancy between left and right extremity. So perhaps if you’re using that one side more, you’re less likely to have a joint contracture.”
When the researchers limited the analysis to head lesions, they observed no significant difference in the lesions between the left and right head (OR, 0.72), but anterior head lesions had a stronger association with neurologic signs or symptoms, compared with posterior head lesions (OR, 2.56), as did superior head lesions, compared with inferior head lesions (OR, 2.23). The association between head lesion location and ophthalmologic involvement was not significant.
“The odds of extracutaneous manifestations vary by site of morphea lesions, with higher odds seen on the left extremity, extensor extremity, the anterior head, and the superior head,” Dr. Chiu concluded. “Further research can be done to perhaps help us decide whether this necessitates difference in management or screening.”
The project was funded by the Pediatric Dermatology Research Alliance and the SPD. Dr. Chiu reported having no relevant financial disclosures.
dbrunk@mdedge.com
REPORTING FROM SPD 2018
Key clinical point: Extracutaneous involvement is more likely when morphea lesions are present on the extensor extremities, face, and superior head.
Major finding: Patients with linear morphea had the highest rate of extracutaneous involvement. Specifically, 34% had musculoskeletal involvement, 24% had neurologic involvement, and 10% had ophthalmologic involvement.
Study details: A multicenter retrospective study of 826 patients with 2,467 skin lesions of morphea.
Disclosures: The study was funded by the Pediatric Dermatology Research Alliance and the SPD. Dr. Chiu reported having no relevant financial disclosures.