User login
GLP-1 Drugs May Modestly Raise Optic Neuropathy Risk in T2D
GLP-1 Drugs May Modestly Raise Optic Neuropathy Risk in T2D
TOPLINE:
A large cohort study found that the use of GLP-1 receptor agonists (GLP-1 RAs) over 3 years was associated with a modestly increased risk for nonarteritic anterior ischemic optic neuropathy (NAION) compared with the use of SGLT2 inhibitors in veterans with type 2 diabetes (T2D).
METHODOLOGY:
- Pharmacovigilance reports and emerging, but inconsistent, population-based studies suggest that the use of GLP-1 RAs may be linked to ocular adverse events, including a possible increased risk for NAION; however, it remains unclear whether the association is specific to NAION as compared with other optic disorders.
- Researchers conducted a target trial emulation study using nationwide electronic health records from the US Department of Veterans Affairs to compare the 3-year risk for NAION among veterans with T2D who initiated GLP-1 RAs vs SGLT2 inhibitors.
- The study included 588,168 veterans with T2D, of whom 139,546 initiated GLP-1 RA therapy (mean age, 65.33 years; 90.2% male) and 448,622 initiated SGLT2 inhibitor therapy (mean age, 67.94 years; 95.3% male) between 2017 and 2024; groups were subsequently matched using propensity score-based inverse probability weighting.
- Cases of NAION were identified from medical records using standard diagnostic codes; cases diagnosed by an eye care specialist and repeat diagnoses were also evaluated.
- The 3-year cumulative incidence, cumulative incidence difference (CID), and cumulative incidence ratio of NAION were estimated.
TAKEAWAY:
- Over 3 years, individuals who started GLP-1 RAs had a small but statistically significant increase in the risk for NAION compared with those who started SGLT2 inhibitors — 39.07 vs 29.33 cases per 10,000 people (CID, 9.98 per 10,000 people; 95% CI, 3.48-14.03) — and a relative increase of about 35% (cumulative incidence ratio, 1.35; 95% CI, 1.11-1.51).
- The increased risk for NAION with the use of GLP-1 RAs was consistent across definitions: diagnosis by an eye care specialist (CID, 8.73; 95% CI, 2.46-12.89), repeat diagnoses (CID, 6.35; 95% CI, 2.40-9.65), and repeat diagnoses with a specialist (CID, 5.91; 95% CI, 2.00-8.88).
- Compared with the use of SGLT2 inhibitors, the use of GLP-1 RAs was not associated with an increased risk for other optic disorders such as diabetic retinopathy, macular degeneration, retinal vascular occlusion, or optic neuritis.
- The frequency of ophthalmology or optometry clinic visits during follow-up was found to be similar between the two groups, suggesting that the association with NAION was not due to differential surveillance.
IN PRACTICE
“GLP-1 RA use was associated with a modestly increased risk of NAION compared with [SGLT2 inhibitor] use. While the absolute risk remains low, the specificity of this finding may warrant heightened vigilance,” the authors of the study wrote.
SOURCE:
The study was led by Taeyoung Choi, MS, Clinical Epidemiology Center, Research and Development Service, VA St Louis Health Care System, St. Louis. It was published online on April 30, 2026, in JAMA Network Open.
LIMITATIONS:
The study cohort was older and predominantly male, limiting generalizability to other populations. Residual confounding, selection bias, and outcome misclassification could not be fully excluded.
DISCLOSURES:
The study was funded by the US Department of Veterans Affairs. Two authors reported being uncompensated consultants for Pfizer.
This article was created using several editorial tools, including AI, as part of the process. Human editors reviewed this content before publication.
A version of this article first appeared on Medscape.com.
GLP-1 Drugs May Modestly Raise Optic Neuropathy Risk in T2D
GLP-1 Drugs May Modestly Raise Optic Neuropathy Risk in T2D
Efficacy of Subcutaneous Semaglutide Dose Escalation in Reducing Insulin in Patients With Type 2 Diabetes
Efficacy of Subcutaneous Semaglutide Dose Escalation in Reducing Insulin in Patients With Type 2 Diabetes
Type 2 diabetes mellitus (T2DM) is a chronic disease becoming more prevalent each year and is the seventh-leading cause of death in the United States.1 The most common reason for hospitalization for patients with T2DM is uncontrolled glycemic levels.2 Nearly 25% of the US Department of Veterans Affairs (VA) patient population has T2DM.3 T2DM is the leading cause of blindness, end-stage renal disease, and amputation for VA patients.4
According to the 2023 American Diabetes Association (ADA) guidelines, treatment goals of T2DM include eliminating symptoms, preventing or delaying complications, and attaining glycemic goals. A typical hemoglobin A1c (HbA1c) goal range is < 7%, but individual goals can vary up to < 9% due to a multitude of factors, including patient comorbidities and clinical status.5
Initial treatment recommendations are nonpharmacologic and include comprehensive lifestyle interventions such as optimizing nutrition, physical activity, and behavioral therapy. When pharmacologic therapy is required, metformin is the preferred first-line treatment for the majority of newly diagnosed patients with T2DM and should be added to continued lifestyle management.5 If HbA1c levels remains above goal, the 2023 ADA guidelines recommend adding a second medication, including but not limited to insulin, a glucagonlike peptide-1 receptor agonist (GLP-1RA), or a sodium-glucose cotransporter 2 inhibitor. Medication choice is largely based on the patient’s concomitant conditions (eg, atherosclerotic cardiovascular disease, heart failure, or chronic kidney disease). The 2023 ADA guidelines suggest initiating insulin therapy when a patient's blood glucose ≥ 300 mg/dL, HbA1c > 10%, or if the patient has symptoms of hyperglycemia, even at initial diagnosis. Initiating medications to minimize or avoid hypoglycemia is a priority, especially in high-risk individuals.5
Clinical evidence shows that GLP-1RAs may provide similar glycemic control to insulin with lower risk of hypoglycemia.6 Other reported benefits of GLP-1RAs include weight loss, blood pressure reduction, and improved lipid levels. The most common adverse events (AEs) with GLP-1RAs are gastrointestinal. Including GLP-1RAs in T2DM pharmacotherapy may lower the risk of hypoglycemia, especially in patients at high risk of hypoglycemia.
The 2023 ADA guidelines indicate that it is appropriate to initiate GLP-]1RAs in patients on insulin.5 However, while GLP-1RAs do not increase the risk of hypoglycemia independently, combination treatment with GLP-1RAs and insulin can still result in hypoglycemia.6 Insulin is the key suspect of this hypoglycemic risk.7 Thus, if insulin dosage can be reduced or discontinued, this might reduce the risk of hypoglycemia.
The literature is limited on how the addition of a GLP-1RA to insulin treatment will affect the patient's daily insulin doses, particularly for the veteran population. The goal of this study is to examine this gap in current research by examining semaglutide, which is the current formulary preferred GLP-1RA at the VA.
Semaglutide is subcutaneously initiated at a dose of 0.25 mg once weekly for 4 weeks to reduce gastrointestinal symptoms, then increased to 0.5 mg weekly. Additional increases to a maintenance dose of 1 mg or 2 mg weekly can occur to achieve glycemic goals. The SUSTAIN-FORTE randomized controlled trial sought to determine whether there was a difference in HbA1c level reduction and significant weight loss with the 2-mg vs 1-mg dose.8 Patients in the trial were taking metformin but needed additional medication to control their HbA1c. They were not using insulin and may or may not have been taking sulfonylureas prior to semaglutide initiation. Semaglutide 2 mg was found to significantly improve HbA1c control and promote weight loss compared with semaglutide 1 mg, while maintaining a similar safety profile.
Because this study involved patients who required additional HbA1c control, although semaglutide reduced HbA1c, not all patients were able to reduce their other diabetes medications, which depended on the baseline HbA1c level and the level upon completion of semaglutide titration. Dose reductions for the patients’ other T2DM medications were not reported at trial end. SUSTAIN-FORTE established titration up to semaglutide 2 mg as effective for HbA1c reduction, although it did not study patients also on insulin.8
Insulin is associated with hypoglycemic risk, weight gain, and other AEs.7,8 This study analyzed whether increasing semaglutide could reduce insulin doses and therefore reduce risk of AEs in patients with T2DM.
Methods
A retrospective, single-center, chart review was conducted at VA Sioux Falls Health Care System (VASFHCS). Data were collected through manual review of VASFHCS electronic medical records. Patients aged ≥ 18 years with active prescriptions for at least once-daily insulin who were initiated on 2-mg weekly dose of semaglutide at the VASFHCS clinical pharmacy practitioner medication management clinic between January 1, 2021, and September 1, 2023, were included. VASFHCS clinical pharmacy practitioners have a scope of practice that allows them to initiate, modify, or discontinue medication therapy within medication management clinics.
The most frequently used prandial insulin at VASFHCS is insulin aspart, and the most frequently used basal insulin is insulin glargine. Patients were retrospectively monitored as they progressed from baseline (the point in time where semaglutide 0.5 mg was initiated) to ≥ 3 months on semaglutide 2-mg therapy. Patients were excluded if they previously used a GLP-1RA or if they were on sliding scale insulin without an exact daily dosage.
The primary endpoint was the percent change in total daily insulin dose from baseline to each dose increase after receiving semaglutide 2 mg for ≥ 3 months. Secondary endpoints included changes in daily prandial insulin dose, daily basal insulin dose, HbA1c, and number of hypoglycemic events reported. Data collected included age, race, weight, body mass index, total daily prandial insulin dose, total daily basal insulin dose, HbA1c, and hypoglycemic events reported at the visit when semaglutide was initiated.
Statistical Analysis
The sample size was calculated prior to data collection, and it was determined that for α = .05, 47 patients were needed to achieve 95% power. The primary endpoint was assessed using a paired t test, as were each secondary endpoint. Results with P < .05 were considered statistically significant.
Results
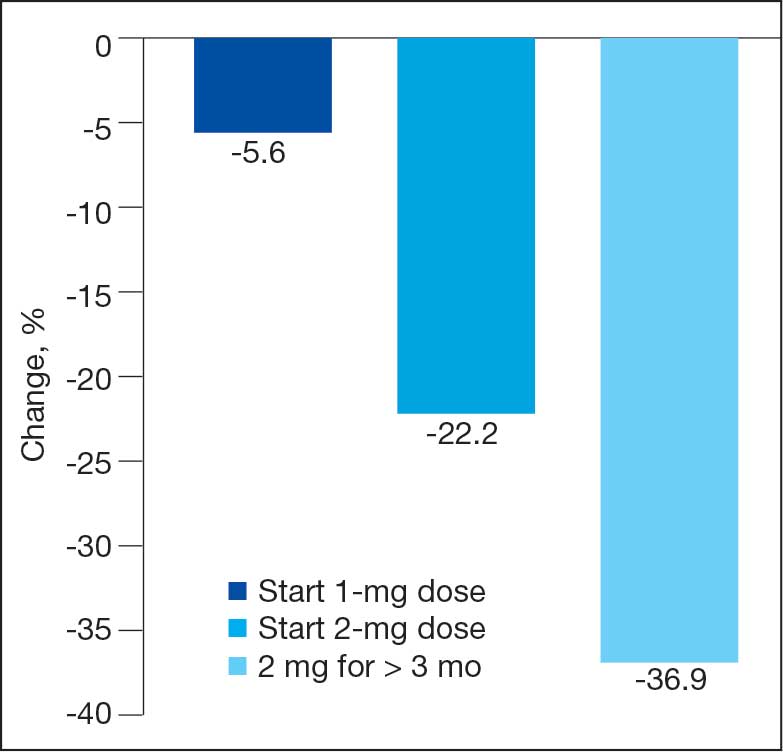
Sixty-two patients were included. The mean HbA1c level at baseline was 7.7%, the baseline mean prandial and insulin daily doses were 41.5 units and 85.1 units, respectively (Table 1) From baseline to initiation of a semaglutide 1-mg dose, the daily insulin dose changed –5.6% (95% CI, 2.2-14.0; P = .008). From baseline to 2-mg dose initiation daily insulin changed -22.2% (95% CI, 22.0-35.1; P < .001) and for patients receiving semaglutide 2 mg for ≥ 3 months it changed -36.9% (95% CI, 37.4-56.5; P < .001) (Figure).
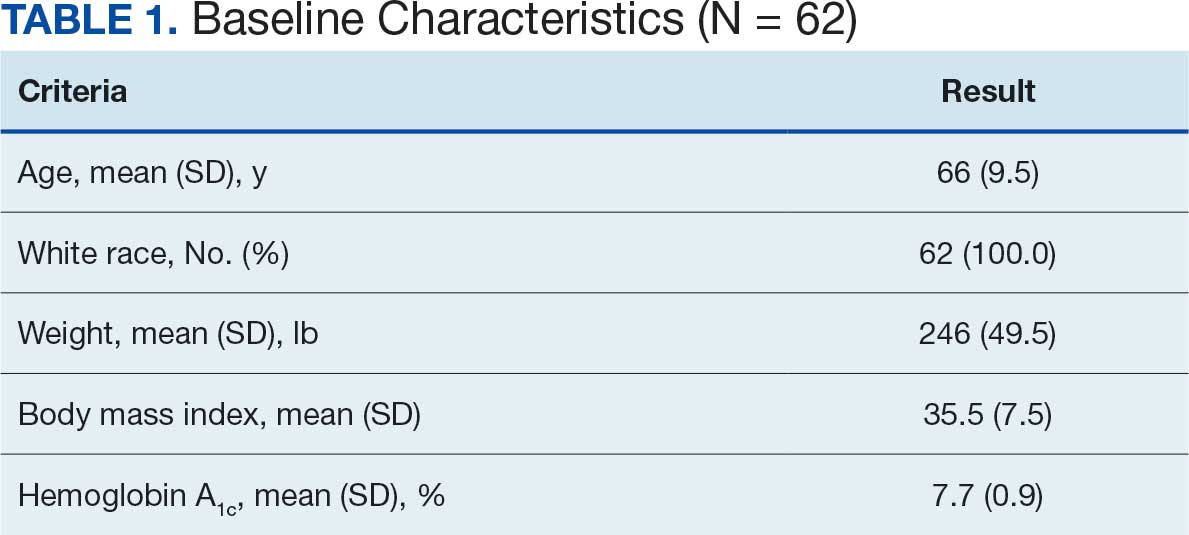
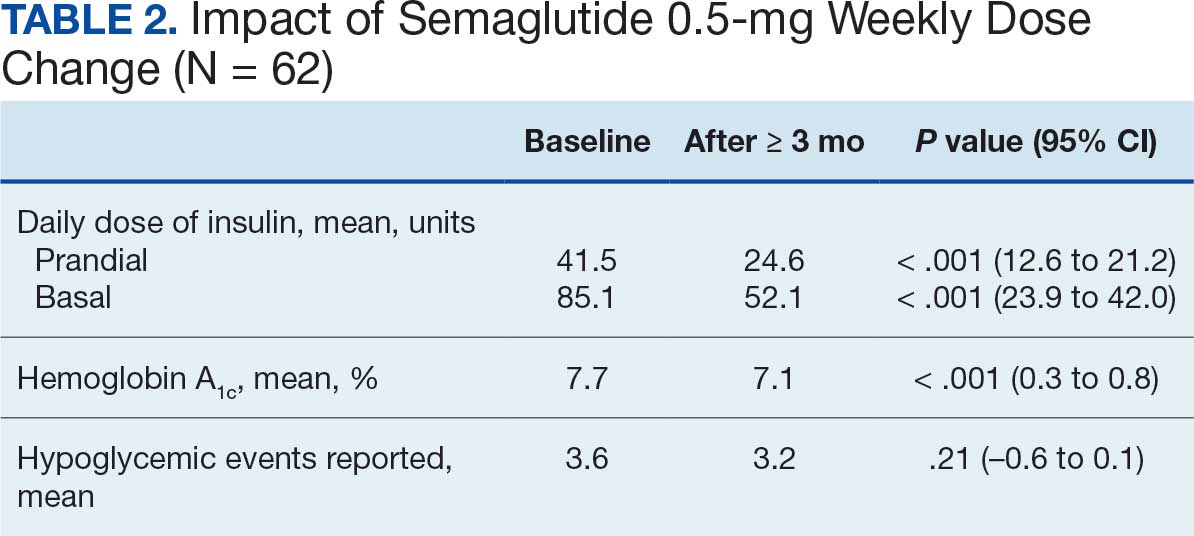
After receiving the 2-mg dose for ≥ 3 months, the mean daily dose of prandial insulin decreased from 41.5 units to 24.6 units (95% CI, 12.6-21.2; P < .001); mean daily dose of basal insulin decreased from 85.1 units to 52.1 units (95% CI, 23.9-42.0; P < .001); and mean HbA1c level decreased from 7.7% to 7.1% (95% CI, 0.3-0.8; P < .001). Mean number of hypoglycemic events reported was not statistically significant, changing from 3.6 to 3.2 (95% CI, –0.6 to 0.1; P = .21) (Table 2).
Discussion
This study investigated the effect of subcutaneous semaglutide dose escalation on total daily insulin dose for patients with T2DM. There was a statistically significant decrease in total daily insulin dose from baseline to 1 mg initiation; this decrease continued with further insulin dose reduction seen at the 2-mg dose initiation and additional insulin dose reduction at ≥ 3 months at this dose. It was hypothesized there would be a significant total daily insulin dose reduction at some point, especially when transitioning from the semaglutide 1-mg to the 2-mg dose, based on previous research. 9,10 The additional reduction in daily insulin dose when continuing on semaglutide 2 mg for ≥ 3 months was an unanticipated but added benefit, showing that if tolerated, maintaining the 2-mg dose will help patients reduce their insulin doses.
In terms of secondary endpoints, there was a statistically significant decrease in mean total daily dose individually for prandial and basal insulin from baseline to ≥ 3 months after semaglutide 2 mg initiation. The change in HbA1c level was also statistically significant and decreased from baseline, even as insulin doses were reduced. This change in HbA1c level was expected; previous literature has shown a significant link between improving HbA1c control when semaglutide doses are increased to 2 mg weekly.10 Due to having been shown in previous trials, it was expected that HbA1c levels would decrease even when the insulin doses were being reduced.10 Insulin dose reduction can potentially be added to the growing evidence of semaglutide benefits. The change in the number of hypoglycemic events was not statistically significant, which was unexpected since previous research show a trend in patients taking GLP-1RAs having fewer hypoglycemic events than those taking insulin.6 Further investigation with a larger sample size and prospective trial could determine whether this result is an outlier. In this study, there was no increase in HbA1c or hypoglycemic events reported with increasing semaglutide doses, which provides further evidence of the safety of semaglutide even at higher doses.
These data suggest that for a patient with T2DM who is already taking insulin, the recommended titration of semaglutide is to start with 0.5 mg and titrate up to a 2-mg subcutaneous weekly dose and to then continue at that dose. As long as the 2-mg dose is tolerated, it will provide patients with the most HbA1c control and lead to a reduction of their total daily insulin doses according to these results.
Strengths and Limitations
This study compared patient data at different points. This method did not require a second distinct control group, which would potentially introduce confounding factors, such as different baseline characteristics. Another strength is that documentation was available for all patients throughout the study so no one was lost to follow-up. This allowed comprehensive data collection and provided a stronger conclusion given the completeness of the data from baseline to follow-up.
Limitations include the retrospective design and small sample size. In addition, the study design did not allow for randomization. There is no documentation of adherence to medication regimen, which was difficult to determine due to the retrospective nature. Other changes to the patients’ medication regimen were not collected in aggregate and thus, it is possible the total daily insulin dose was impacted by other medication changes. There is also potential for inconsistent documentation of the patients’ true total daily insulin dose in the medical record, thus leading to inaccuracy of recorded data.
Conclusions
A small sample of veterans with T2DM had statistically significant reductions in total daily insulin dose when subcutaneous semaglutide was initiated, as well as after each dose increase. There was also a statistically significant reduction in HbA1c levels from baseline even as patient insulin doses were reduced. These results support the current practice of using semaglutide to treat T2DM, suggesting it may be safe and effective at reducing HbA1c levels as the dose is titrated up to 2 mg. There was no statistically significant change in the number of hypoglycemic events reported as semaglutide was titrated up. Thus, when semaglutide is increased to the maximum recommended dose of 2 mg for T2DM, patients may experience a reduction of their total daily dose of insulin and HbA1c levels. These benefits may reduce the risk of insulin-related AEs while maintaining appropriate glycemic control.
- Diabetes mellitus: in federal health care data trends 2017. Fed Pract. 2017:S20. Accessed August 6, 2025. https://www.fedprac-digital.com/federalpractitioner/data_trends_2017
- Centers for Disease Control and Prevention. National diabetes statistics report. May 15, 2024. Accessed September 17, 2025. https://www.cdc.gov/diabetes/php/data-research/index.html
- US Department of Veterans Affairs. VA research on diabetes. Updated January 15, 2021. Accessed August 6, 2025. https://www.research.va.gov/topics/diabetes.cfm
- Liu Y, Sayam S, Shao X, et al. Prevalence of and trends in diabetes among veterans, United States, 2005-2014. Prev Chronic Dis. 2017;14:E135. doi:10.5888/pcd14.170230
- American Diabetes Association. Standards of care in diabetes— 2023 abridged for primary care providers. Clin Diabetes. 2022;41:4-31. doi:10.2337/cd23-as01
- Zhao Z, Tang Y, Hu Y, Zhu H, Chen X, Zhao B. Hypoglycemia following the use of glucagon-like peptide-1 receptor agonists: a real-world analysis of post-marketing surveillance data. Ann Transl Med. 2021;9:1482. doi:10.21037/atm-21-4162
- Workgroup on Hypoglycemia, American Diabetes Association. Defining and reporting hypoglycemia in diabetes: a report from the American Diabetes Association Workgroup on Hypoglycemia. Diabetes Care. 2005;28:1245-1249. doi:10.2337/diacare.28.5.1245
- Frías JP, Auerbach P, Bajaj HS, et al. Efficacy and safety of once-weekly semaglutide 2.0 mg versus 1.0 mg in patients with type 2 diabetes (SUSTAIN FORTE): a double-blind, randomised, phase 3B trial. Lancet Diabetes Endocrinol. 2021;9:563-574. doi:10.1016/S2213-8587(21)00174-1
- Garber AJ, Handelsman Y, Grunberger G, et al. Consensus statement by the American Association of Clinical Endocrinologists and American College of Endocrinology on the comprehensive type 2 diabetes management algorithm - 2020 executive summary. Endocr Pract. 2020;26:107-139. doi:10.4158/CS-2019-0472
- Miles KE, Kerr JL. Semaglutide for the treatment of type 2 diabetes mellitus. J Pharm Technol. 2018;34:281-289. doi:10.1177/8755122518790925
Type 2 diabetes mellitus (T2DM) is a chronic disease becoming more prevalent each year and is the seventh-leading cause of death in the United States.1 The most common reason for hospitalization for patients with T2DM is uncontrolled glycemic levels.2 Nearly 25% of the US Department of Veterans Affairs (VA) patient population has T2DM.3 T2DM is the leading cause of blindness, end-stage renal disease, and amputation for VA patients.4
According to the 2023 American Diabetes Association (ADA) guidelines, treatment goals of T2DM include eliminating symptoms, preventing or delaying complications, and attaining glycemic goals. A typical hemoglobin A1c (HbA1c) goal range is < 7%, but individual goals can vary up to < 9% due to a multitude of factors, including patient comorbidities and clinical status.5
Initial treatment recommendations are nonpharmacologic and include comprehensive lifestyle interventions such as optimizing nutrition, physical activity, and behavioral therapy. When pharmacologic therapy is required, metformin is the preferred first-line treatment for the majority of newly diagnosed patients with T2DM and should be added to continued lifestyle management.5 If HbA1c levels remains above goal, the 2023 ADA guidelines recommend adding a second medication, including but not limited to insulin, a glucagonlike peptide-1 receptor agonist (GLP-1RA), or a sodium-glucose cotransporter 2 inhibitor. Medication choice is largely based on the patient’s concomitant conditions (eg, atherosclerotic cardiovascular disease, heart failure, or chronic kidney disease). The 2023 ADA guidelines suggest initiating insulin therapy when a patient's blood glucose ≥ 300 mg/dL, HbA1c > 10%, or if the patient has symptoms of hyperglycemia, even at initial diagnosis. Initiating medications to minimize or avoid hypoglycemia is a priority, especially in high-risk individuals.5
Clinical evidence shows that GLP-1RAs may provide similar glycemic control to insulin with lower risk of hypoglycemia.6 Other reported benefits of GLP-1RAs include weight loss, blood pressure reduction, and improved lipid levels. The most common adverse events (AEs) with GLP-1RAs are gastrointestinal. Including GLP-1RAs in T2DM pharmacotherapy may lower the risk of hypoglycemia, especially in patients at high risk of hypoglycemia.
The 2023 ADA guidelines indicate that it is appropriate to initiate GLP-]1RAs in patients on insulin.5 However, while GLP-1RAs do not increase the risk of hypoglycemia independently, combination treatment with GLP-1RAs and insulin can still result in hypoglycemia.6 Insulin is the key suspect of this hypoglycemic risk.7 Thus, if insulin dosage can be reduced or discontinued, this might reduce the risk of hypoglycemia.
The literature is limited on how the addition of a GLP-1RA to insulin treatment will affect the patient's daily insulin doses, particularly for the veteran population. The goal of this study is to examine this gap in current research by examining semaglutide, which is the current formulary preferred GLP-1RA at the VA.
Semaglutide is subcutaneously initiated at a dose of 0.25 mg once weekly for 4 weeks to reduce gastrointestinal symptoms, then increased to 0.5 mg weekly. Additional increases to a maintenance dose of 1 mg or 2 mg weekly can occur to achieve glycemic goals. The SUSTAIN-FORTE randomized controlled trial sought to determine whether there was a difference in HbA1c level reduction and significant weight loss with the 2-mg vs 1-mg dose.8 Patients in the trial were taking metformin but needed additional medication to control their HbA1c. They were not using insulin and may or may not have been taking sulfonylureas prior to semaglutide initiation. Semaglutide 2 mg was found to significantly improve HbA1c control and promote weight loss compared with semaglutide 1 mg, while maintaining a similar safety profile.
Because this study involved patients who required additional HbA1c control, although semaglutide reduced HbA1c, not all patients were able to reduce their other diabetes medications, which depended on the baseline HbA1c level and the level upon completion of semaglutide titration. Dose reductions for the patients’ other T2DM medications were not reported at trial end. SUSTAIN-FORTE established titration up to semaglutide 2 mg as effective for HbA1c reduction, although it did not study patients also on insulin.8
Insulin is associated with hypoglycemic risk, weight gain, and other AEs.7,8 This study analyzed whether increasing semaglutide could reduce insulin doses and therefore reduce risk of AEs in patients with T2DM.
Methods
A retrospective, single-center, chart review was conducted at VA Sioux Falls Health Care System (VASFHCS). Data were collected through manual review of VASFHCS electronic medical records. Patients aged ≥ 18 years with active prescriptions for at least once-daily insulin who were initiated on 2-mg weekly dose of semaglutide at the VASFHCS clinical pharmacy practitioner medication management clinic between January 1, 2021, and September 1, 2023, were included. VASFHCS clinical pharmacy practitioners have a scope of practice that allows them to initiate, modify, or discontinue medication therapy within medication management clinics.
The most frequently used prandial insulin at VASFHCS is insulin aspart, and the most frequently used basal insulin is insulin glargine. Patients were retrospectively monitored as they progressed from baseline (the point in time where semaglutide 0.5 mg was initiated) to ≥ 3 months on semaglutide 2-mg therapy. Patients were excluded if they previously used a GLP-1RA or if they were on sliding scale insulin without an exact daily dosage.
The primary endpoint was the percent change in total daily insulin dose from baseline to each dose increase after receiving semaglutide 2 mg for ≥ 3 months. Secondary endpoints included changes in daily prandial insulin dose, daily basal insulin dose, HbA1c, and number of hypoglycemic events reported. Data collected included age, race, weight, body mass index, total daily prandial insulin dose, total daily basal insulin dose, HbA1c, and hypoglycemic events reported at the visit when semaglutide was initiated.
Statistical Analysis
The sample size was calculated prior to data collection, and it was determined that for α = .05, 47 patients were needed to achieve 95% power. The primary endpoint was assessed using a paired t test, as were each secondary endpoint. Results with P < .05 were considered statistically significant.
Results
Sixty-two patients were included. The mean HbA1c level at baseline was 7.7%, the baseline mean prandial and insulin daily doses were 41.5 units and 85.1 units, respectively (Table 1) From baseline to initiation of a semaglutide 1-mg dose, the daily insulin dose changed –5.6% (95% CI, 2.2-14.0; P = .008). From baseline to 2-mg dose initiation daily insulin changed -22.2% (95% CI, 22.0-35.1; P < .001) and for patients receiving semaglutide 2 mg for ≥ 3 months it changed -36.9% (95% CI, 37.4-56.5; P < .001) (Figure).
After receiving the 2-mg dose for ≥ 3 months, the mean daily dose of prandial insulin decreased from 41.5 units to 24.6 units (95% CI, 12.6-21.2; P < .001); mean daily dose of basal insulin decreased from 85.1 units to 52.1 units (95% CI, 23.9-42.0; P < .001); and mean HbA1c level decreased from 7.7% to 7.1% (95% CI, 0.3-0.8; P < .001). Mean number of hypoglycemic events reported was not statistically significant, changing from 3.6 to 3.2 (95% CI, –0.6 to 0.1; P = .21) (Table 2).
Discussion
This study investigated the effect of subcutaneous semaglutide dose escalation on total daily insulin dose for patients with T2DM. There was a statistically significant decrease in total daily insulin dose from baseline to 1 mg initiation; this decrease continued with further insulin dose reduction seen at the 2-mg dose initiation and additional insulin dose reduction at ≥ 3 months at this dose. It was hypothesized there would be a significant total daily insulin dose reduction at some point, especially when transitioning from the semaglutide 1-mg to the 2-mg dose, based on previous research. 9,10 The additional reduction in daily insulin dose when continuing on semaglutide 2 mg for ≥ 3 months was an unanticipated but added benefit, showing that if tolerated, maintaining the 2-mg dose will help patients reduce their insulin doses.
In terms of secondary endpoints, there was a statistically significant decrease in mean total daily dose individually for prandial and basal insulin from baseline to ≥ 3 months after semaglutide 2 mg initiation. The change in HbA1c level was also statistically significant and decreased from baseline, even as insulin doses were reduced. This change in HbA1c level was expected; previous literature has shown a significant link between improving HbA1c control when semaglutide doses are increased to 2 mg weekly.10 Due to having been shown in previous trials, it was expected that HbA1c levels would decrease even when the insulin doses were being reduced.10 Insulin dose reduction can potentially be added to the growing evidence of semaglutide benefits. The change in the number of hypoglycemic events was not statistically significant, which was unexpected since previous research show a trend in patients taking GLP-1RAs having fewer hypoglycemic events than those taking insulin.6 Further investigation with a larger sample size and prospective trial could determine whether this result is an outlier. In this study, there was no increase in HbA1c or hypoglycemic events reported with increasing semaglutide doses, which provides further evidence of the safety of semaglutide even at higher doses.
These data suggest that for a patient with T2DM who is already taking insulin, the recommended titration of semaglutide is to start with 0.5 mg and titrate up to a 2-mg subcutaneous weekly dose and to then continue at that dose. As long as the 2-mg dose is tolerated, it will provide patients with the most HbA1c control and lead to a reduction of their total daily insulin doses according to these results.
Strengths and Limitations
This study compared patient data at different points. This method did not require a second distinct control group, which would potentially introduce confounding factors, such as different baseline characteristics. Another strength is that documentation was available for all patients throughout the study so no one was lost to follow-up. This allowed comprehensive data collection and provided a stronger conclusion given the completeness of the data from baseline to follow-up.
Limitations include the retrospective design and small sample size. In addition, the study design did not allow for randomization. There is no documentation of adherence to medication regimen, which was difficult to determine due to the retrospective nature. Other changes to the patients’ medication regimen were not collected in aggregate and thus, it is possible the total daily insulin dose was impacted by other medication changes. There is also potential for inconsistent documentation of the patients’ true total daily insulin dose in the medical record, thus leading to inaccuracy of recorded data.
Conclusions
A small sample of veterans with T2DM had statistically significant reductions in total daily insulin dose when subcutaneous semaglutide was initiated, as well as after each dose increase. There was also a statistically significant reduction in HbA1c levels from baseline even as patient insulin doses were reduced. These results support the current practice of using semaglutide to treat T2DM, suggesting it may be safe and effective at reducing HbA1c levels as the dose is titrated up to 2 mg. There was no statistically significant change in the number of hypoglycemic events reported as semaglutide was titrated up. Thus, when semaglutide is increased to the maximum recommended dose of 2 mg for T2DM, patients may experience a reduction of their total daily dose of insulin and HbA1c levels. These benefits may reduce the risk of insulin-related AEs while maintaining appropriate glycemic control.
- Diabetes mellitus: in federal health care data trends 2017. Fed Pract. 2017:S20. Accessed August 6, 2025. https://www.fedprac-digital.com/federalpractitioner/data_trends_2017
- Centers for Disease Control and Prevention. National diabetes statistics report. May 15, 2024. Accessed September 17, 2025. https://www.cdc.gov/diabetes/php/data-research/index.html
- US Department of Veterans Affairs. VA research on diabetes. Updated January 15, 2021. Accessed August 6, 2025. https://www.research.va.gov/topics/diabetes.cfm
- Liu Y, Sayam S, Shao X, et al. Prevalence of and trends in diabetes among veterans, United States, 2005-2014. Prev Chronic Dis. 2017;14:E135. doi:10.5888/pcd14.170230
- American Diabetes Association. Standards of care in diabetes— 2023 abridged for primary care providers. Clin Diabetes. 2022;41:4-31. doi:10.2337/cd23-as01
- Zhao Z, Tang Y, Hu Y, Zhu H, Chen X, Zhao B. Hypoglycemia following the use of glucagon-like peptide-1 receptor agonists: a real-world analysis of post-marketing surveillance data. Ann Transl Med. 2021;9:1482. doi:10.21037/atm-21-4162
- Workgroup on Hypoglycemia, American Diabetes Association. Defining and reporting hypoglycemia in diabetes: a report from the American Diabetes Association Workgroup on Hypoglycemia. Diabetes Care. 2005;28:1245-1249. doi:10.2337/diacare.28.5.1245
- Frías JP, Auerbach P, Bajaj HS, et al. Efficacy and safety of once-weekly semaglutide 2.0 mg versus 1.0 mg in patients with type 2 diabetes (SUSTAIN FORTE): a double-blind, randomised, phase 3B trial. Lancet Diabetes Endocrinol. 2021;9:563-574. doi:10.1016/S2213-8587(21)00174-1
- Garber AJ, Handelsman Y, Grunberger G, et al. Consensus statement by the American Association of Clinical Endocrinologists and American College of Endocrinology on the comprehensive type 2 diabetes management algorithm - 2020 executive summary. Endocr Pract. 2020;26:107-139. doi:10.4158/CS-2019-0472
- Miles KE, Kerr JL. Semaglutide for the treatment of type 2 diabetes mellitus. J Pharm Technol. 2018;34:281-289. doi:10.1177/8755122518790925
Efficacy of Subcutaneous Semaglutide Dose Escalation in Reducing Insulin in Patients With Type 2 Diabetes
Efficacy of Subcutaneous Semaglutide Dose Escalation in Reducing Insulin in Patients With Type 2 Diabetes
Impact of Continuous Glucose Monitoring for American Indian/Alaska Native Adults With Type 2 Diabetes Mellitus Not Using Insulin
Impact of Continuous Glucose Monitoring for American Indian/Alaska Native Adults With Type 2 Diabetes Mellitus Not Using Insulin
Diabetes mellitus (DM) is a national health crisis affecting > 38 million people (11.6%) in the United States.1 American Indian and Alaska Native (AI/AN) adults are disproportionately affected, with a prevalence of 14.5%—the highest among all racial and ethnic groups.1 Type 2 DM (T2DM) accounts for 90% to 95% of all DM cases and is a leading cause of morbidity and mortality due to its association with cardiovascular disease, kidney failure, and other complications.2
Maintaining glycemic control is important for managing T2DM and preventing microvascular and macrovascular complications.3 The cornerstone of diabetes self-management has been patient self-monitored blood glucose (SMBG) using finger-stick glucometers.4 However, SMBG provides measurements from a single point in time and requires frequent, painful, and inconvenient finger pricks, leading to decreased adherence.5,6 These limitations negatively affect patient engagement and overall glycemic control.7
Continuous glucose monitors (CGMs) offer real-time, continuous glucose readings and trends.8 CGMs improve glycemic control and reduce hypoglycemic episodes in patients who are insulin-dependent.9,10 Flash glucose monitors, a type of CGM that requires scanning to obtain glucose readings, provide similar benefits.11 Despite these demonstrated advantages, research has primarily focused on insulin-dependent populations, leaving a significant gap in understanding the effect of CGMs on patients with T2DM who are not insulin-dependent.12
Given the high prevalence of T2DM among AI/AN populations and the potential benefits of CGMs, this study sought to evaluate the effect of CGM use on glycemic control and other health metrics in patients with non–insulin-dependent T2DM in an AI/AN population. This focus addresses a critical knowledge gap and may inform clinical practices and policies to improve diabetes management in this high-risk group.
Methods
A retrospective observational study was conducted using deidentified electronic health records (EHRs) from 2019 to 2024 at a federally operated outpatient Indian Health Service (IHS) clinic serving an AI/AN population in the IHS Portland Area (Oregon, Washington, Idaho). The study protocol was reviewed and deemed exempt by institutional review boards at Washington State University and the Portland Area IHS.
Study Population
This study included patients diagnosed with non–insulin-dependent T2DM, had used a CGM for ≥ 1 year, and had hemoglobin A1c (HbA1c) measurements within 4 months prior to CGM initiation (baseline) and within ± 4 months after 1 year of CGM use. For other health metrics, including blood pressure (BP), weight, low-density lipoprotein cholesterol (LDL-C), and estimated glomerular filtration rate (eGFR), this study required measurements within 6 months before CGM initiation and within 6 months after 1 year of CGM use. The baseline HbA1c in the dataset ranged from 5.3% to > 14%.
Patients were excluded if they used insulin during the study period, had incomplete laboratory or clinical data for the required time frame, or had < 1 year of CGM use. The dataset did not include detailed information on oral DM medications; thus, we could not report or account for the type or number of oral hypoglycemic agents used by the patients. The IHS clinical applications coordinator compiled the dataset from the EHR, identifying patients who were prescribed and received a CGM at the clinic. All patients used the Abbott Freestyle Libre CGM, the only formulary CGM available at the clinic during the study period.
A 1-year follow-up endpoint was selected for several reasons: (1) to capture potential seasonal variations in diet and activity; (2) to align with the clinic’s standard practice of annual comprehensive diabetes evaluations; and (3) to allow sufficient time for patients to adapt to CGM use and reflect any meaningful changes in glycemic control.
All patients received standard DM care according to clinic protocols, which included DM self-management education and training. Patients met with the diabetes educator at least once, during which the educator emphasized making informed decisions using CGM data, such as adjusting dietary choices and physical activity levels to manage blood glucose concentrations effectively.
A total of 302 patients were initially identified. After applying exclusion criteria, 132 were excluded due to insulin use, and 77 were excluded due to incomplete HbA1c data within the specified time frames (Figure 1). The final sample included 93 patients.
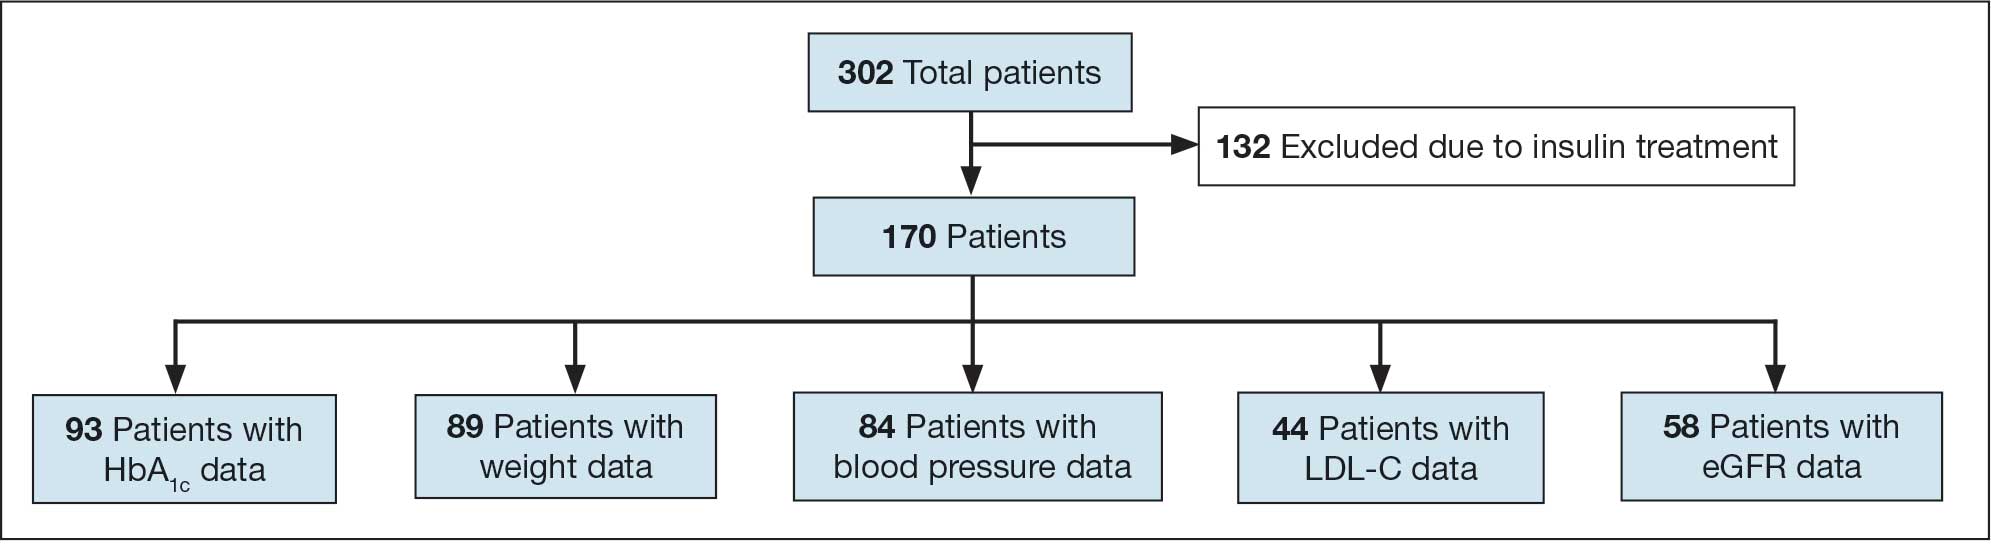
Abbreviations: eGFR, estimated glomerular filtration rate; HbA1c, hemoglobin A1c; LDL-C, low-density lipoprotein cholesterol.
Measures
The primary outcome was the change in HbA1c levels from baseline to 1 year after CGM initiation. Secondary outcomes included changes in weight, systolic and diastolic BP, LDL-C concentrations, and eGFR. For the primary outcome, HbA1c values were collected within a grace period of ± 4 months from the baseline and 1-year time points. The laboratory’s upper reporting limit for HbA1c was 14%; values reported as “> 14%” were recorded as 14.1% for data analysis, although the actual values could have been higher.
For secondary outcomes, data were included if measurements were obtained within ± 6 months of the baseline and 1-year time points. Patients who did not have measurements within these time frames for specific metrics were excluded from secondary outcome analysis but remained in the overall study if they met the criteria for HbA1c and CGM use.
Statistical Analysis
Statistical analysis was performed using R statistical software version 4.4.2. Paired t tests were conducted to compare baseline and 1-year follow- up measurements for variables with parametric distributions. Wilcoxon signed-rank test was used for nonparametric data. A linear regression analysis was conducted to examine the relationship between baseline HbA1c levels and the change in HbA1c after 1 year of CGM use. Differences were considered significant at P < .05 set a priori. To guide future research, a posthoc power analysis was performed using Cohen’s d to estimate the required sample sizes for detecting significant effects, assuming a similar population.
Results
The study included 93 patients, with a mean (SD) age of 55 (13) years (range, 29-83 years). Of the participants, 56 were female (60%) and 37 were male (40%). All participants were identified as AI/AN and had non–insulin-dependent T2DM.
Primary Outcomes
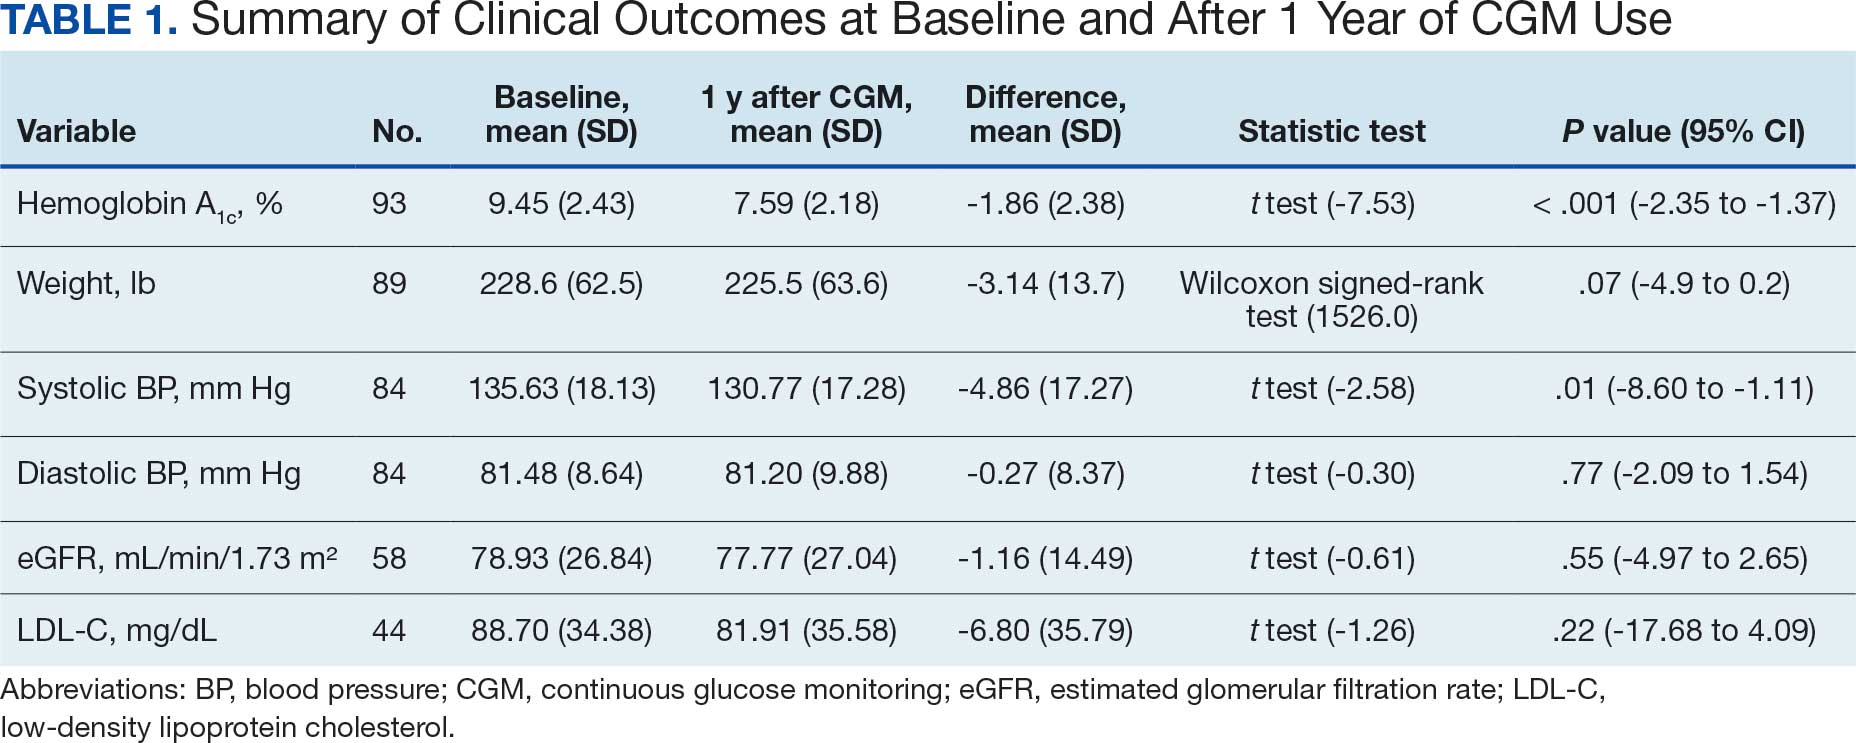
A significant reduction in HbA1c levels was observed after 1 year of CGM use. The mean (SD) baseline HbA1c was 9.5% (2.4%), which decreased to 7.6% (2.2%) at 1-year follow-up (Table 1). This difference represents a mean change of -1.86% (2.4%) (95% CI, -2.35 to -1.37; P < .001 [paired t test, -7.53]).
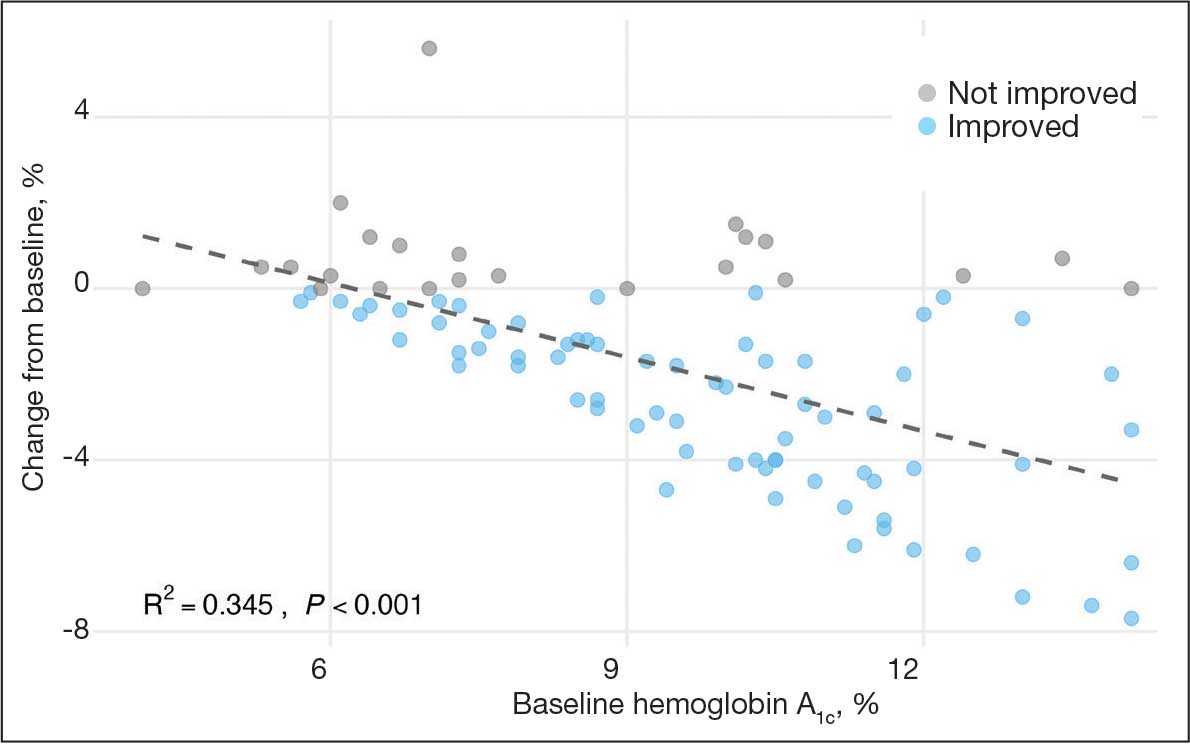
A linear regression model evaluated the relationship between baseline HbA1c (predictor) and the change in HbA1c after 1 year (outcome). The change in HbA1c was calculated as the difference between 1-year follow-up and baseline values. The regression model revealed a significant negative association between baseline HbA1c and the change in HbA1c (Β = -0.576; P < .001), indicating that higher baseline HbA1c values were associated with greater reductions in HbA1c over the year. The regression equation was: Change in HbA1c = 3.587 – 0.576 × Baseline HbA1c
The regression coefficient for baseline HbA1c was -0.576 (standard error, 0.083; t = -6.931; P < .001), indicating that for each 1% increase in baseline HbA1c, the reduction of HbA1c after 1 year increased by approximately 0.576% (Figure 2). The model explained 34.6% of the variance in HbA1c change (R2 = .345; adjusted R2 = .338).
Secondary Outcomes
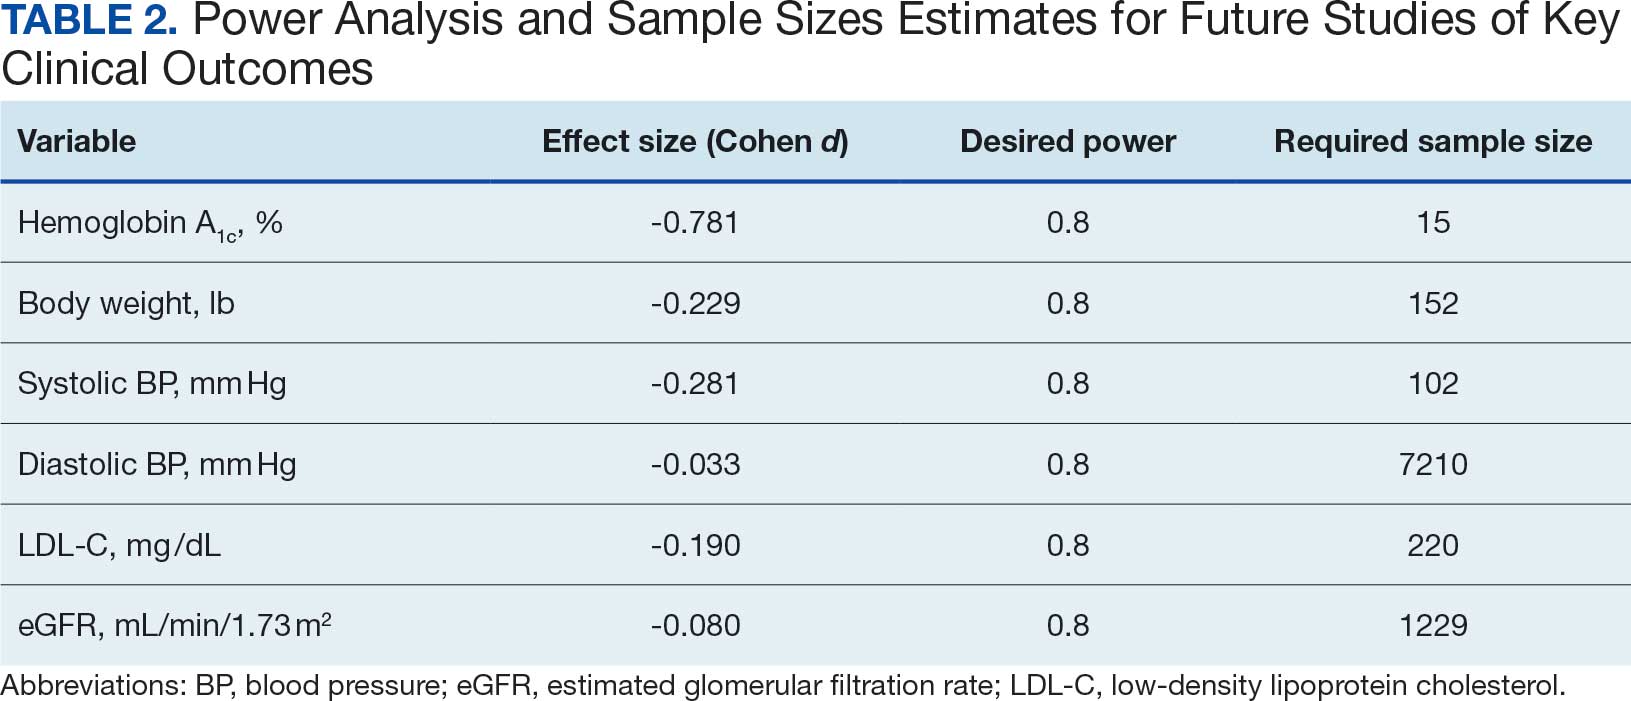
Systolic BP decreased by a mean (SD) -4.9 (17) mm Hg; 95% CI, -8.6 to -1.11; P = .01, paired t test). However, no significant change was observed for diastolic BP (P = .77, paired t test). Similarly, no significant changes were observed in weight, LDL-C concentrations, or eGFR after 1 year of CGM use. A posthoc power analysis indicated that the study was underpowered to detect smaller effect sizes in secondary outcomes. For example, sample size estimates indicated that detecting significant changes in weight and LDL-C concentrations would require sample sizes of 152 and 220 patients, respectively (Table 2).
Discussion
This study found a clinically significant reduction in HbA1c levels after 1 year among AI/AN patients with non–insulin-dependent T2DM who used CGMs. The mean HbA1c decreased 1.9%, from 9.5% at baseline to 7.6% after 1 year. This reduction is not only statistically significant (P < .001), it is clinically meaningful—even a 1% decrease in HbA1c is associated with substantial reductions in the risk of microvascular complications.3 The magnitude of the HbA1c reduction observed suggests CGM use may be associated with improved glycemic control in this high-risk population. By achieving lower HbA1c levels, patients may experience improved long-term health outcomes and a reduced burden of DM-related complications.
Changes in oral DM medications during the study period may have contributed to the observed improvements in HbA1c levels. While the dataset lacked detailed information on types or dosages of oral hypoglycemic agents used, adjustments in medication regimens are common in DM management and could significantly affect glycemic control. The inability to account for these changes results in an inability to attribute the improvements in HbA1c solely to CGM use. Future studies should collect comprehensive medication data to better isolate the effects of CGM use from other treatment modifications.
Another factor that may have contributed to the improved glycemic control is the DM self-management education and training patients received as part of standard care. Patients met with diabetes educators at least once and learned how to use the CGM device and interpret the data for self-management decisions. This education may have enhanced patient engagement and empowerment, enabling them to make informed choices about diet, physical activity, and medication adherence. Studies have shown that DM self-management education can significantly improve glycemic control and patient outcomes.13 By combining the CGM technology with targeted education, patients may have been better equipped to manage their condition, contributing to the observed reduction in HbA1c levels. Future studies should consider synergistic effects of CGM use and DM education when evaluating interventions for glycemic control.
The significant reduction in HbA1c indicates CGM use is associated with improved glycemic control in non–insulin-dependent T2DM. The linear regression analysis suggests patients with poorer glycemic control at baseline experienced greater reductions in HbA1c over the course of 1 year. This finding aligns with previous studies that have shown greater HbA1c reductions in patients with higher initial levels when using CGMs. Yaron et al reported similar findings: higher baseline HbA1c levels predicted more substantial improvements with CGM use in patients with T2DM on insulin therapy.14
This study contributes to existing research by examining the association between CGM use and glycemic control in patients with non– insulin-dependent T2DM within an AI/AN population, a group that has been underreported in previous studies. Most prior research has focused on insulin-dependent patients or populations with different ethnic backgrounds.12 By focusing on patients with non–insulin-dependent T2DM, this study highlights the broader applicability of CGMs beyond traditional use, showcasing their potential association with benefits in earlier stages of DM management. Targeting the AI/AN population addresses a critical knowledge gap, given the disproportionately high prevalence of T2DM and associated complications in this group. The findings of this study suggest integrating CGM technology into the standard care of AI/AN patients with non–insulin-dependent T2DM may be associated with improved glycemic control and may help reduce health disparities.
The modest decrease in systolic BP observed in this study may indicate potential cardiovascular benefits associated with CGM use, possibly due to improved glycemic control and increased patient engagement in self-management. However, given the limited sample size and exclusion criteria, the study lacked sufficient power to detect significant associations between CGM use and other secondary outcomes such as BP, weight, LDL-C, and eGFR. Therefore, the significant finding with systolic BP should be interpreted with caution.
The lack of significant changes in secondary outcomes may be attributed to the study’s limited sample size and the relatively short duration for observing changes in these parameters. Larger studies are needed to assess the full impact of CGM on these variables. The required sample sizes for achieving adequate power in future studies were calculated, highlighting the utility of our study as a pilot, providing critical data for the design of larger, adequately powered studies.
Limitations
The retrospective design of this study limits causal inferences. Moreover, potential confounding variables were not controlled, such as changes in medication regimens (other than insulin use), dietary counseling, or physical activity. Additionally, we could not account for the type or number of oral DM medications prescribed to patients. The dataset included only information on insulin use, without detailed records of other antidiabetic medications. This limitation may have influenced the observed change in glycemic control, as variations in medication regimens could affect HbA1c levels.
Because this study lacked a comparator group, the effect of CGM use cannot be definitively isolated from other factors (eg, medication changes, dietary modifications, or physical activity). Moreover, CGM devices can be costly and are not universally covered by all insurance or IHS programs, potentially limiting widespread implementation. Policy-level restrictions and patient-specific barriers may also hinder feasibility in other settings.
The small sample size may limit the generalizability of the findings. Of the initial 302 patients, about 69% were excluded due to insulin use or incomplete laboratory data. A ± 4-month window was selected to balance data quality with real-world practices. Extending this window further (eg, ± 6 months) might have included more participants but risked diluting the 1-year endpoint consistency. The lack of statistical significance in secondary metrics may be due to insufficient power rather than the absence of an effect.
Exclusion of patients due to incomplete data may have introduced selection bias. However, patients were included in the overall analysis if they met the criteria for HbA1c and CGM use, even if they lacked data for secondary outcomes. Additionally, the laboratory’s upper reporting limit for HbA1c was 14%, with values above this reported as “> 14%.” For analysis, these were recorded as 14.1%, which may underestimate the true baseline HbA1c levels and impact of the assessment of change. This occurred for 4 of the 93 patients included.
All patients used the Freestyle Libre CGM, which may limit the generalizability of the findings to other CGM brands or models. Differences in device features, accuracy, scanning frequency, and user experience may influence outcomes, and results might differ with other CGM technologies. The dataset did not include patients’ scanning frequency because this metric was not consistently included in the EHRs.
Conclusions
This study found that CGM use was significantly associated with improved glycemic control in patients with non–insulin-dependent T2DM within an AI/AN population, particularly among patients with higher baseline HbA1c levels. The findings suggest that CGMs may be a valuable tool for managing T2DM beyond insulin-dependent populations.
Additional research with larger sample sizes, control groups, and extended follow-up periods is recommended to explore long-term benefits and impacts on other health metrics. The sample size estimates derived from this study serve as a valuable resource for researchers designing future studies aimed at addressing these gaps. Future research that expands on our findings by including larger, more diverse cohorts, accounting for medication use, and exploring different CGM technologies will enhance understanding and contribute to more effective diabetes management strategies for varied populations.
- National diabetes statistics report. Centers for Disease Control and Prevention. May 15, 2024. Accessed October 7, 2025. https://www.cdc.gov/diabetes/php/data-research/index.html
- Elsayed NA, Aleppo G, Aroda VR, et al. 2. Classification and diagnosis of diabetes: standards of care in diabetes—2023. Diabetes Care. 2023;46:S19-S40. doi:10.2337/dc23-S002
- Fowler MJ. Microvascular and macrovascular complications of diabetes. Clin Diabetes. 2011;29:116-122. doi:10.2337/diaclin.29.3.116
- Pleus S, Freckmann G, Schauer S, et al. Self-monitoring of blood glucose as an integral part in the management of people with type 2 diabetes mellitus. Diabetes Ther. 2022;13:829-846. doi:10.1007/s13300-022-01254-8
- Polonsky WH, Fisher L, Schikman CH, et al. Structured self-monitoring of blood glucose significantly reduces A1C levels in poorly controlled, noninsulin-treated type 2 diabetes: results from the Structured Testing Program study. Diabetes Care. 2011;34:262-267. doi:10.2337/dc10-1732
- Tanaka N, Yabe D, Murotani K, et al. Mental distress and health-related quality of life among type 1 and type 2 diabetes patients using self-monitoring of blood glucose: a cross-sectional questionnaire study in Japan. J Diabetes Investig. 2018;9:1203-1211. doi:10.1111/jdi.12827
- Hortensius J, Kars MC, Wierenga WS, et al. Perspectives of patients with type 1 or insulin-treated type 2 diabetes on self-monitoring of blood glucose: a qualitative study. BMC Public Health. 2012;12:167. doi:10.1186/1471-2458-12-167
- Didyuk O, Econom N, Guardia A, Livingston K, Klueh U. Continuous glucose monitoring devices: past, present, and future focus on the history and evolution of technological innovation. J Diabetes Sci Technol. 2021;15:676-683. doi:10.1177/1932296819899394
- Beck RW, Riddlesworth TD, Ruedy K, et al. Effect of continuous glucose monitoring on glycemic control in adults with type 1 diabetes using insulin injections: the DIAMOND randomized clinical trial. JAMA. 2017;317:371-378. doi:10.1001/jama.2016.19975
- Lind M, Polonsky W, Hirsch IB, et al. Continuous glucose monitoring vs conventional therapy for glycemic control in adults with type 1 diabetes treated with multiple daily insulin injections: the GOLD randomized clinical trial. JAMA. 2017;317:379-387. doi:10.1001/jama.2016.19976
- Bolinder J, Antuna R, Geelhoed-Duijvestijn P, et al. Novel glucose-sensing technology and hypoglycemia in type 1 diabetes: a multicenter, non-masked, randomized controlled trial. Lancet. 2016;388:2254-2263. doi:10.1016/S0140-6736(16)31535-5
- Seidu S, Kunutsor SK, Ajjan RA, et al. Efficacy and safety of continuous glucose monitoring and intermittently scanned continuous glucose monitoring in patients with type 2 diabetes: a systematic review and meta-analysis of interventional evidence. Diabetes Care. 2024;47:169-179. doi:10.2337/dc23-1520
- ElSayed NA, Aleppo G, Aroda VR, et al. 5. Facilitating positive health behaviors and well-being to improve health outcomes: standards of care in diabetes-2023. Diabetes Care. 2023;46:S68-S96. doi:10.2337/dc23-S005
- Yaron M, Roitman E, Aharon-Hananel G, et al. Effect of flash glucose monitoring technology on glycemic control and treatment satisfaction in patients with type 2 diabetes. Diabetes Care. 2019;42:1178-1184. doi:10.2337/dc18-0166
Diabetes mellitus (DM) is a national health crisis affecting > 38 million people (11.6%) in the United States.1 American Indian and Alaska Native (AI/AN) adults are disproportionately affected, with a prevalence of 14.5%—the highest among all racial and ethnic groups.1 Type 2 DM (T2DM) accounts for 90% to 95% of all DM cases and is a leading cause of morbidity and mortality due to its association with cardiovascular disease, kidney failure, and other complications.2
Maintaining glycemic control is important for managing T2DM and preventing microvascular and macrovascular complications.3 The cornerstone of diabetes self-management has been patient self-monitored blood glucose (SMBG) using finger-stick glucometers.4 However, SMBG provides measurements from a single point in time and requires frequent, painful, and inconvenient finger pricks, leading to decreased adherence.5,6 These limitations negatively affect patient engagement and overall glycemic control.7
Continuous glucose monitors (CGMs) offer real-time, continuous glucose readings and trends.8 CGMs improve glycemic control and reduce hypoglycemic episodes in patients who are insulin-dependent.9,10 Flash glucose monitors, a type of CGM that requires scanning to obtain glucose readings, provide similar benefits.11 Despite these demonstrated advantages, research has primarily focused on insulin-dependent populations, leaving a significant gap in understanding the effect of CGMs on patients with T2DM who are not insulin-dependent.12
Given the high prevalence of T2DM among AI/AN populations and the potential benefits of CGMs, this study sought to evaluate the effect of CGM use on glycemic control and other health metrics in patients with non–insulin-dependent T2DM in an AI/AN population. This focus addresses a critical knowledge gap and may inform clinical practices and policies to improve diabetes management in this high-risk group.
Methods
A retrospective observational study was conducted using deidentified electronic health records (EHRs) from 2019 to 2024 at a federally operated outpatient Indian Health Service (IHS) clinic serving an AI/AN population in the IHS Portland Area (Oregon, Washington, Idaho). The study protocol was reviewed and deemed exempt by institutional review boards at Washington State University and the Portland Area IHS.
Study Population
This study included patients diagnosed with non–insulin-dependent T2DM, had used a CGM for ≥ 1 year, and had hemoglobin A1c (HbA1c) measurements within 4 months prior to CGM initiation (baseline) and within ± 4 months after 1 year of CGM use. For other health metrics, including blood pressure (BP), weight, low-density lipoprotein cholesterol (LDL-C), and estimated glomerular filtration rate (eGFR), this study required measurements within 6 months before CGM initiation and within 6 months after 1 year of CGM use. The baseline HbA1c in the dataset ranged from 5.3% to > 14%.
Patients were excluded if they used insulin during the study period, had incomplete laboratory or clinical data for the required time frame, or had < 1 year of CGM use. The dataset did not include detailed information on oral DM medications; thus, we could not report or account for the type or number of oral hypoglycemic agents used by the patients. The IHS clinical applications coordinator compiled the dataset from the EHR, identifying patients who were prescribed and received a CGM at the clinic. All patients used the Abbott Freestyle Libre CGM, the only formulary CGM available at the clinic during the study period.
A 1-year follow-up endpoint was selected for several reasons: (1) to capture potential seasonal variations in diet and activity; (2) to align with the clinic’s standard practice of annual comprehensive diabetes evaluations; and (3) to allow sufficient time for patients to adapt to CGM use and reflect any meaningful changes in glycemic control.
All patients received standard DM care according to clinic protocols, which included DM self-management education and training. Patients met with the diabetes educator at least once, during which the educator emphasized making informed decisions using CGM data, such as adjusting dietary choices and physical activity levels to manage blood glucose concentrations effectively.
A total of 302 patients were initially identified. After applying exclusion criteria, 132 were excluded due to insulin use, and 77 were excluded due to incomplete HbA1c data within the specified time frames (Figure 1). The final sample included 93 patients.
Abbreviations: eGFR, estimated glomerular filtration rate; HbA1c, hemoglobin A1c; LDL-C, low-density lipoprotein cholesterol.
Measures
The primary outcome was the change in HbA1c levels from baseline to 1 year after CGM initiation. Secondary outcomes included changes in weight, systolic and diastolic BP, LDL-C concentrations, and eGFR. For the primary outcome, HbA1c values were collected within a grace period of ± 4 months from the baseline and 1-year time points. The laboratory’s upper reporting limit for HbA1c was 14%; values reported as “> 14%” were recorded as 14.1% for data analysis, although the actual values could have been higher.
For secondary outcomes, data were included if measurements were obtained within ± 6 months of the baseline and 1-year time points. Patients who did not have measurements within these time frames for specific metrics were excluded from secondary outcome analysis but remained in the overall study if they met the criteria for HbA1c and CGM use.
Statistical Analysis
Statistical analysis was performed using R statistical software version 4.4.2. Paired t tests were conducted to compare baseline and 1-year follow- up measurements for variables with parametric distributions. Wilcoxon signed-rank test was used for nonparametric data. A linear regression analysis was conducted to examine the relationship between baseline HbA1c levels and the change in HbA1c after 1 year of CGM use. Differences were considered significant at P < .05 set a priori. To guide future research, a posthoc power analysis was performed using Cohen’s d to estimate the required sample sizes for detecting significant effects, assuming a similar population.
Results
The study included 93 patients, with a mean (SD) age of 55 (13) years (range, 29-83 years). Of the participants, 56 were female (60%) and 37 were male (40%). All participants were identified as AI/AN and had non–insulin-dependent T2DM.
Primary Outcomes
A significant reduction in HbA1c levels was observed after 1 year of CGM use. The mean (SD) baseline HbA1c was 9.5% (2.4%), which decreased to 7.6% (2.2%) at 1-year follow-up (Table 1). This difference represents a mean change of -1.86% (2.4%) (95% CI, -2.35 to -1.37; P < .001 [paired t test, -7.53]).
A linear regression model evaluated the relationship between baseline HbA1c (predictor) and the change in HbA1c after 1 year (outcome). The change in HbA1c was calculated as the difference between 1-year follow-up and baseline values. The regression model revealed a significant negative association between baseline HbA1c and the change in HbA1c (Β = -0.576; P < .001), indicating that higher baseline HbA1c values were associated with greater reductions in HbA1c over the year. The regression equation was: Change in HbA1c = 3.587 – 0.576 × Baseline HbA1c
The regression coefficient for baseline HbA1c was -0.576 (standard error, 0.083; t = -6.931; P < .001), indicating that for each 1% increase in baseline HbA1c, the reduction of HbA1c after 1 year increased by approximately 0.576% (Figure 2). The model explained 34.6% of the variance in HbA1c change (R2 = .345; adjusted R2 = .338).
Secondary Outcomes
Systolic BP decreased by a mean (SD) -4.9 (17) mm Hg; 95% CI, -8.6 to -1.11; P = .01, paired t test). However, no significant change was observed for diastolic BP (P = .77, paired t test). Similarly, no significant changes were observed in weight, LDL-C concentrations, or eGFR after 1 year of CGM use. A posthoc power analysis indicated that the study was underpowered to detect smaller effect sizes in secondary outcomes. For example, sample size estimates indicated that detecting significant changes in weight and LDL-C concentrations would require sample sizes of 152 and 220 patients, respectively (Table 2).
Discussion
This study found a clinically significant reduction in HbA1c levels after 1 year among AI/AN patients with non–insulin-dependent T2DM who used CGMs. The mean HbA1c decreased 1.9%, from 9.5% at baseline to 7.6% after 1 year. This reduction is not only statistically significant (P < .001), it is clinically meaningful—even a 1% decrease in HbA1c is associated with substantial reductions in the risk of microvascular complications.3 The magnitude of the HbA1c reduction observed suggests CGM use may be associated with improved glycemic control in this high-risk population. By achieving lower HbA1c levels, patients may experience improved long-term health outcomes and a reduced burden of DM-related complications.
Changes in oral DM medications during the study period may have contributed to the observed improvements in HbA1c levels. While the dataset lacked detailed information on types or dosages of oral hypoglycemic agents used, adjustments in medication regimens are common in DM management and could significantly affect glycemic control. The inability to account for these changes results in an inability to attribute the improvements in HbA1c solely to CGM use. Future studies should collect comprehensive medication data to better isolate the effects of CGM use from other treatment modifications.
Another factor that may have contributed to the improved glycemic control is the DM self-management education and training patients received as part of standard care. Patients met with diabetes educators at least once and learned how to use the CGM device and interpret the data for self-management decisions. This education may have enhanced patient engagement and empowerment, enabling them to make informed choices about diet, physical activity, and medication adherence. Studies have shown that DM self-management education can significantly improve glycemic control and patient outcomes.13 By combining the CGM technology with targeted education, patients may have been better equipped to manage their condition, contributing to the observed reduction in HbA1c levels. Future studies should consider synergistic effects of CGM use and DM education when evaluating interventions for glycemic control.
The significant reduction in HbA1c indicates CGM use is associated with improved glycemic control in non–insulin-dependent T2DM. The linear regression analysis suggests patients with poorer glycemic control at baseline experienced greater reductions in HbA1c over the course of 1 year. This finding aligns with previous studies that have shown greater HbA1c reductions in patients with higher initial levels when using CGMs. Yaron et al reported similar findings: higher baseline HbA1c levels predicted more substantial improvements with CGM use in patients with T2DM on insulin therapy.14
This study contributes to existing research by examining the association between CGM use and glycemic control in patients with non– insulin-dependent T2DM within an AI/AN population, a group that has been underreported in previous studies. Most prior research has focused on insulin-dependent patients or populations with different ethnic backgrounds.12 By focusing on patients with non–insulin-dependent T2DM, this study highlights the broader applicability of CGMs beyond traditional use, showcasing their potential association with benefits in earlier stages of DM management. Targeting the AI/AN population addresses a critical knowledge gap, given the disproportionately high prevalence of T2DM and associated complications in this group. The findings of this study suggest integrating CGM technology into the standard care of AI/AN patients with non–insulin-dependent T2DM may be associated with improved glycemic control and may help reduce health disparities.
The modest decrease in systolic BP observed in this study may indicate potential cardiovascular benefits associated with CGM use, possibly due to improved glycemic control and increased patient engagement in self-management. However, given the limited sample size and exclusion criteria, the study lacked sufficient power to detect significant associations between CGM use and other secondary outcomes such as BP, weight, LDL-C, and eGFR. Therefore, the significant finding with systolic BP should be interpreted with caution.
The lack of significant changes in secondary outcomes may be attributed to the study’s limited sample size and the relatively short duration for observing changes in these parameters. Larger studies are needed to assess the full impact of CGM on these variables. The required sample sizes for achieving adequate power in future studies were calculated, highlighting the utility of our study as a pilot, providing critical data for the design of larger, adequately powered studies.
Limitations
The retrospective design of this study limits causal inferences. Moreover, potential confounding variables were not controlled, such as changes in medication regimens (other than insulin use), dietary counseling, or physical activity. Additionally, we could not account for the type or number of oral DM medications prescribed to patients. The dataset included only information on insulin use, without detailed records of other antidiabetic medications. This limitation may have influenced the observed change in glycemic control, as variations in medication regimens could affect HbA1c levels.
Because this study lacked a comparator group, the effect of CGM use cannot be definitively isolated from other factors (eg, medication changes, dietary modifications, or physical activity). Moreover, CGM devices can be costly and are not universally covered by all insurance or IHS programs, potentially limiting widespread implementation. Policy-level restrictions and patient-specific barriers may also hinder feasibility in other settings.
The small sample size may limit the generalizability of the findings. Of the initial 302 patients, about 69% were excluded due to insulin use or incomplete laboratory data. A ± 4-month window was selected to balance data quality with real-world practices. Extending this window further (eg, ± 6 months) might have included more participants but risked diluting the 1-year endpoint consistency. The lack of statistical significance in secondary metrics may be due to insufficient power rather than the absence of an effect.
Exclusion of patients due to incomplete data may have introduced selection bias. However, patients were included in the overall analysis if they met the criteria for HbA1c and CGM use, even if they lacked data for secondary outcomes. Additionally, the laboratory’s upper reporting limit for HbA1c was 14%, with values above this reported as “> 14%.” For analysis, these were recorded as 14.1%, which may underestimate the true baseline HbA1c levels and impact of the assessment of change. This occurred for 4 of the 93 patients included.
All patients used the Freestyle Libre CGM, which may limit the generalizability of the findings to other CGM brands or models. Differences in device features, accuracy, scanning frequency, and user experience may influence outcomes, and results might differ with other CGM technologies. The dataset did not include patients’ scanning frequency because this metric was not consistently included in the EHRs.
Conclusions
This study found that CGM use was significantly associated with improved glycemic control in patients with non–insulin-dependent T2DM within an AI/AN population, particularly among patients with higher baseline HbA1c levels. The findings suggest that CGMs may be a valuable tool for managing T2DM beyond insulin-dependent populations.
Additional research with larger sample sizes, control groups, and extended follow-up periods is recommended to explore long-term benefits and impacts on other health metrics. The sample size estimates derived from this study serve as a valuable resource for researchers designing future studies aimed at addressing these gaps. Future research that expands on our findings by including larger, more diverse cohorts, accounting for medication use, and exploring different CGM technologies will enhance understanding and contribute to more effective diabetes management strategies for varied populations.
- National diabetes statistics report. Centers for Disease Control and Prevention. May 15, 2024. Accessed October 7, 2025. https://www.cdc.gov/diabetes/php/data-research/index.html
- Elsayed NA, Aleppo G, Aroda VR, et al. 2. Classification and diagnosis of diabetes: standards of care in diabetes—2023. Diabetes Care. 2023;46:S19-S40. doi:10.2337/dc23-S002
- Fowler MJ. Microvascular and macrovascular complications of diabetes. Clin Diabetes. 2011;29:116-122. doi:10.2337/diaclin.29.3.116
- Pleus S, Freckmann G, Schauer S, et al. Self-monitoring of blood glucose as an integral part in the management of people with type 2 diabetes mellitus. Diabetes Ther. 2022;13:829-846. doi:10.1007/s13300-022-01254-8
- Polonsky WH, Fisher L, Schikman CH, et al. Structured self-monitoring of blood glucose significantly reduces A1C levels in poorly controlled, noninsulin-treated type 2 diabetes: results from the Structured Testing Program study. Diabetes Care. 2011;34:262-267. doi:10.2337/dc10-1732
- Tanaka N, Yabe D, Murotani K, et al. Mental distress and health-related quality of life among type 1 and type 2 diabetes patients using self-monitoring of blood glucose: a cross-sectional questionnaire study in Japan. J Diabetes Investig. 2018;9:1203-1211. doi:10.1111/jdi.12827
- Hortensius J, Kars MC, Wierenga WS, et al. Perspectives of patients with type 1 or insulin-treated type 2 diabetes on self-monitoring of blood glucose: a qualitative study. BMC Public Health. 2012;12:167. doi:10.1186/1471-2458-12-167
- Didyuk O, Econom N, Guardia A, Livingston K, Klueh U. Continuous glucose monitoring devices: past, present, and future focus on the history and evolution of technological innovation. J Diabetes Sci Technol. 2021;15:676-683. doi:10.1177/1932296819899394
- Beck RW, Riddlesworth TD, Ruedy K, et al. Effect of continuous glucose monitoring on glycemic control in adults with type 1 diabetes using insulin injections: the DIAMOND randomized clinical trial. JAMA. 2017;317:371-378. doi:10.1001/jama.2016.19975
- Lind M, Polonsky W, Hirsch IB, et al. Continuous glucose monitoring vs conventional therapy for glycemic control in adults with type 1 diabetes treated with multiple daily insulin injections: the GOLD randomized clinical trial. JAMA. 2017;317:379-387. doi:10.1001/jama.2016.19976
- Bolinder J, Antuna R, Geelhoed-Duijvestijn P, et al. Novel glucose-sensing technology and hypoglycemia in type 1 diabetes: a multicenter, non-masked, randomized controlled trial. Lancet. 2016;388:2254-2263. doi:10.1016/S0140-6736(16)31535-5
- Seidu S, Kunutsor SK, Ajjan RA, et al. Efficacy and safety of continuous glucose monitoring and intermittently scanned continuous glucose monitoring in patients with type 2 diabetes: a systematic review and meta-analysis of interventional evidence. Diabetes Care. 2024;47:169-179. doi:10.2337/dc23-1520
- ElSayed NA, Aleppo G, Aroda VR, et al. 5. Facilitating positive health behaviors and well-being to improve health outcomes: standards of care in diabetes-2023. Diabetes Care. 2023;46:S68-S96. doi:10.2337/dc23-S005
- Yaron M, Roitman E, Aharon-Hananel G, et al. Effect of flash glucose monitoring technology on glycemic control and treatment satisfaction in patients with type 2 diabetes. Diabetes Care. 2019;42:1178-1184. doi:10.2337/dc18-0166
Impact of Continuous Glucose Monitoring for American Indian/Alaska Native Adults With Type 2 Diabetes Mellitus Not Using Insulin
Impact of Continuous Glucose Monitoring for American Indian/Alaska Native Adults With Type 2 Diabetes Mellitus Not Using Insulin
Reducing Sex Disparities in Statin Therapy Among Female Veterans With Type 2 Diabetes and/or Cardiovascular Disease
Reducing Sex Disparities in Statin Therapy Among Female Veterans With Type 2 Diabetes and/or Cardiovascular Disease
Cardiovascular disease (CVD) is the leading cause of death among women in the United States.1 Most CVD is due to the buildup of plaque (ie, cholesterol, proteins, calcium, and inflammatory cells) in artery walls.2 The plaque may lead to atherosclerotic cardiovascular disease (ASCVD), which includes coronary heart disease, cerebrovascular disease, peripheral artery disease, and aortic atherosclerotic disease.2,3 Control and reduction of ASCVD risk factors, including high cholesterol levels, elevated blood pressure, insulin resistance, smoking, and a sedentary lifestyle, can contribute to a reduction in ASCVD morbidity and mortality.2 People with type 2 diabetes mellitus (T2DM) have an increased prevalence of lipid abnormalities, contributing to their high risk of ASCVD.4,5
The prescribing of statins (3-hydroxy-3-methyl-glutaryl-coenzmye A reductase inhibitors) is the cornerstone of lipid-lowering therapy and cardiovascular risk reduction for primary and secondary prevention of ASCVD.6 The American Diabetes Association (ADA) and American College of Cardiology/American Heart Association (ACC/AHA) recommend moderate- to high-intensity statins for primary prevention in patients with T2DM and high-intensity statins for secondary prevention in those with or without diabetes when not contraindicated.4,5,7 Despite eligibility according to guideline recommendations, research predominantly shows that women are less likely to receive statin therapy; however, this trend is improving. [6,8-11] To explain the sex differences in statin use, Nanna et al found that there is a combination of women being offered statin therapy less frequently, declining therapy more frequently, and discontinuing treatment more frequently.11 One possibility for discontinuing treatment could be statin-associated muscle symptoms (SAMS), which occur in about 10% of patients.12 The incidence of adverse effects (AEs) may be related to the way statins are metabolized.
Pharmacogenomic testing is free for veterans through the US Department of Veterans Affairs (VA) PHASER program, which offers information and recommendations for a panel of 11 gene variants. The panel includes genes related to common medication classes such as anticoagulants, antiplatelets, proton pump inhibitors, nonsteroidal anti-inflammatory drugs, opioids, antidepressants, and statins. The VA PHASER panel includes the solute carrier organic anion transporter family member 1B1 (SLCO1B1) gene, which is predominantly expressed in the liver and facilitates the hepatic uptake of most statins.13,14 A reduced function of SLCO1B1 can lead to higher statin levels, resulting in increased concentrations that may potentially cause SAMS.13,14 Some alleles associated with reduced function include SLCO1B1*5, *15, *23, *31, and *46 to *49, whereas others are associated with increased function, such as SLCO1B1 *14 and *20 (Appendix).15 Supporting evidence shows the SLCO1B1*5 nucleotide polymorphism increases plasma levels of simvastatin and atorvastatin, affecting effectiveness or toxicity. 13 Females tend to have a lower body weight and higher percentage of body fat compared with males, which might lead to higher concentrations of lipophilic drugs, including atorvastatin and simvastatin, which may be exacerbated by decreased function of SLCO1B1*5.15 With pharmacogenomic testing, therapeutic recommendations can be made to improve the overall safety and efficacy of statins, thus improving adherence using a patient-specific approach.14,15
Methods
Carl Vinson VA Medical Center (CVVAMC) serves about 42,000 veterans in Central and South Georgia, of which about 15% are female. Of the female veterans enrolled in care, 63% identify as Black, 27% White, and 1.5% as Asian, American Indian/Alaska Native, or Native Hawaiian/Other Pacific Islander. The 2020 Veterans Chartbook report showed that female veterans and minority racial and ethnic groups had worse access to health care and higher mortality rates than their male and non-Hispanic White counterparts.16
The Primary Care Equity Dashboard (PCED) was developed to engage the VA health care workforce in the process of identifying and addressing inequities in local patient populations.17 Using electronic quality measure data, the PCED provides Veterans Integrated Service Network-level and facility-level performance on several metrics.18 The PCED had not been previously used at the CVVAMC, and few publications or quality improvement projects regarding its use have been reported by the VA Office of Health Equity. PCED helped identify disparities when comparing female to male patients in the prescribing of statin therapy for patients with CVD and statin therapy for patients with T2DM.
VA PHASER pharmacogenomic analyses provided an opportunity to expand this quality improvement project. Sanford Health and the VA collaborated on the PHASER program to offer free genetic testing for veterans. The program launched in 2019 and expanded to various VA sites, including CVVAMC in March 2023. This program has been extended to December 31, 2025.
The primary objective of this quality improvement project was to increase statin prescribing among female veterans with T2DM and/or CVD to reduce cardiovascular risk. Secondary outcomes included increased pharmacogenomic testing and the assessment of pharmacogenomic results related to statin therapy. This project was approved by the CVVAMC Pharmacy and Therapeutics Committee. The PCED was used to identify female veterans with T2DM and/or CVD without an active prescription for a statin between July and October 2023. A review of Computerized Patient Record System patient charts was completed to screen for prespecified inclusion and exclusion criteria. Veterans were included if they were assigned female at birth, were enrolled in care at CVVAMC, and had a diagnosis of T2DM or CVD (history of myocardial infarction, coronary bypass graft, percutaneous coronary intervention, or other revascularization in any setting).
Veterans were excluded if they were currently pregnant, trying to conceive, breastfeeding, had a T1DM diagnosis, had previously documented hypersensitivity to a statin, active liver failure or decompensated cirrhosis, previously documented statin-associated rhabdomyolysis or autoimmune myopathy, an active prescription for a proprotein convertase subtilisin/kexin type 9 inhibitor, or previously documented statin intolerance (defined as the inability to tolerate ≥ 3 statins, with ≥ 1 prescribed at low intensity or alternate-day dosing). The female veterans were compared to 2 comparators: the facility's male veterans and the VA national average, identified via the PCED.
Once a veteran was screened, they were telephoned between October 2023 and February 2024 and provided education on statin use and pharmacogenomic testing using a standardized note template. An order was placed for participants who provided verbal consent for pharmacogenomic testing. Those who agreed to statin initiation were referred to a clinical pharmacist practitioner (CPP) who contacted them at a later date to prescribe a statin following the recommendations of the 2019 ACC/AHA and 2023 ADA guidelines and pharmacogenomic testing, if applicable.4,5,7 Appropriate monitoring and follow-up occurred at the discretion of each CPP. Data collection included: age, race, diagnoses (T2DM, CVD, or both), baseline lipid panel (total cholesterol, triglycerides, high-density lipoprotein, low-density lipoprotein), hepatic function, name and dose of statin, reasons for declining statin therapy, and pharmacogenomic testing results related to SLCO1B1.
Results
At baseline in July 2023, 77.8% of female veterans with T2DM were prescribed a statin, which exceeded the national VA average (77.0%), but was below the rate for male veterans (78.7%) in the facility comparator group.17 Additionally, 82.2% of females with CVD were prescribed a statin, which was below the national VA average of 86.0% and the 84.9% of male veterans in the facility comparator group.17 The PCED identified 189 female veterans from July 2023 to October 2023 who may benefit from statin therapy. Thirty-three females met the exclusion criteria. Of the 156 included veterans, 129 (82.7%) were successfully contacted and 27 (17.3%) could not be reached by telephone after 3 attempts (Figure 1). The 129 female veterans contacted had a mean age of 59 years and the majority were Black (82.9%) (Table 1).
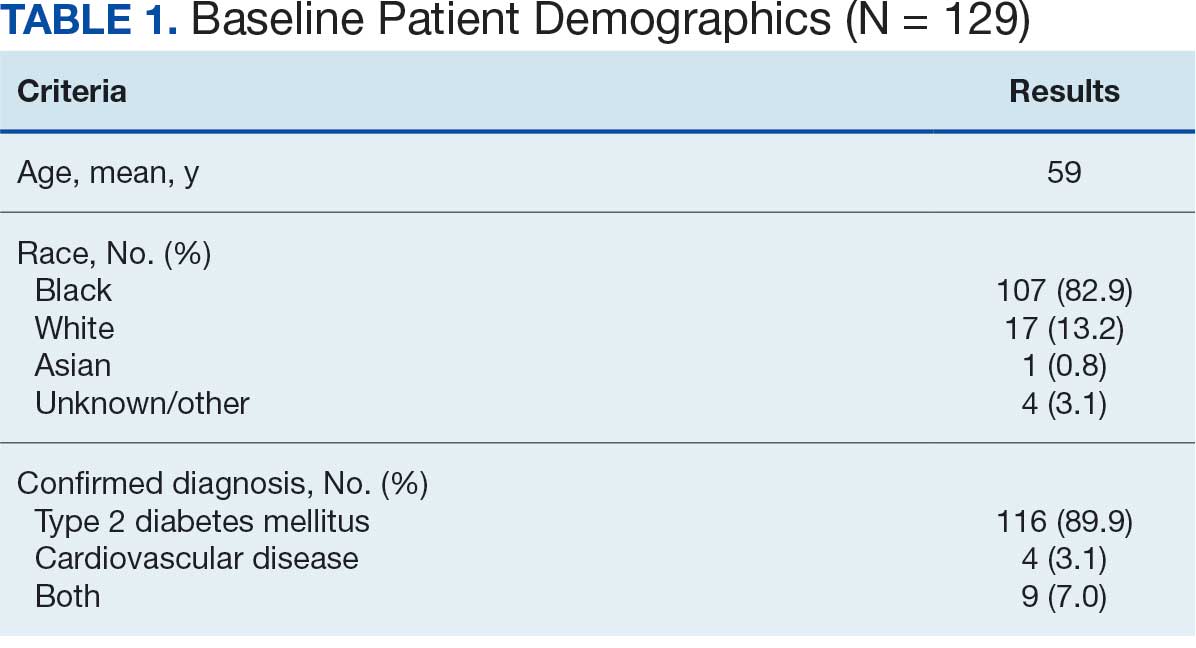
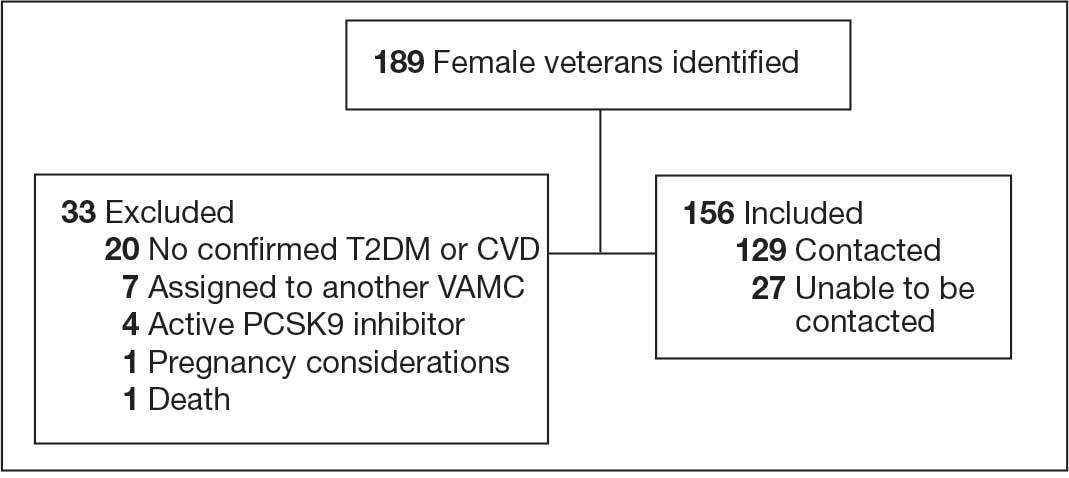
Abbreviations: CVD, cardiovascular disease; PCSK9, proprotein convertase subtilisin/
kexin type 9; T2DM, type 2 diabetes mellitus; VAMC, Veterans Affairs medical center.
Primary Outcomes
Of the 129 contacted veterans, 31 (24.0%) had a non-VA statin prescription, 13 (10.1%) had an active VA statin prescription, and 85 (65.9%) did not have a statin prescription, despite being eligible. Statin adherence was confirmed with participants, and the medication list was updated accordingly.
Of the 85 veterans with no active statin therapy, 37 (43.5%) accepted a new statin prescription and 48 (56.5%) declined. There were various reasons provided for declining statin therapy: 17 participants (35.4%) declined due to concern for AEs (Table 2).
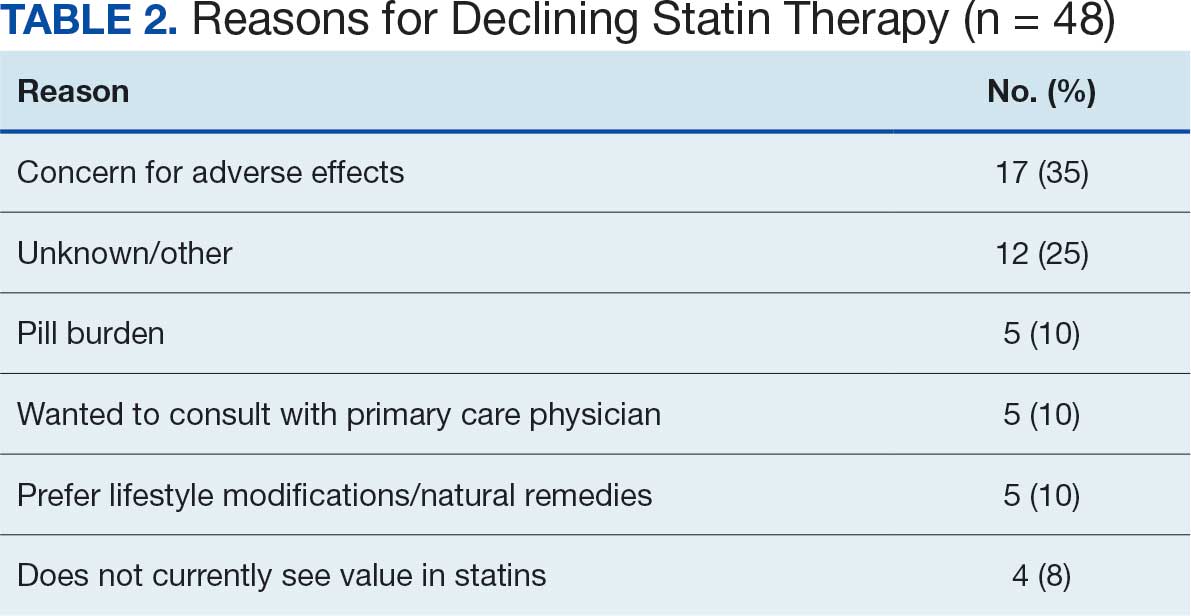
From July 2023 to March 2024, the percentage of female veterans with active statin therapy with T2DM increased from 77.8% to 79.0%. For those with active statin therapy with CVD, usage increased from 82.2% to 90.2%, which exceeded the national VA average and facility male comparator group (Figures 2 and 3).17
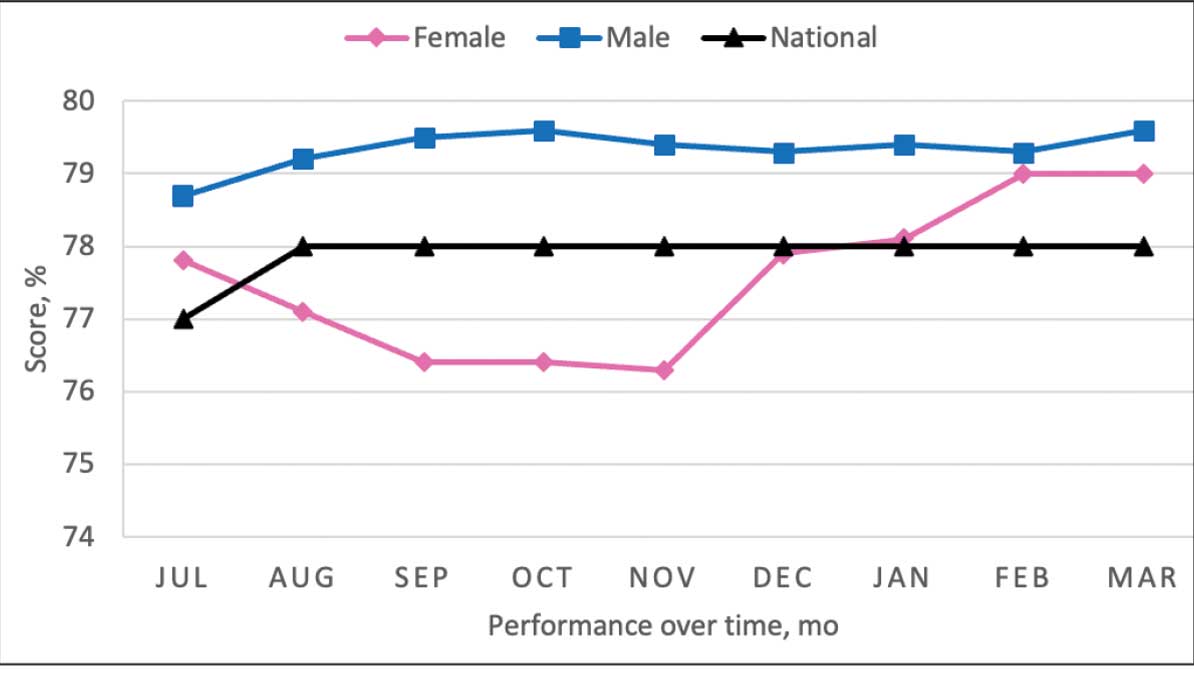
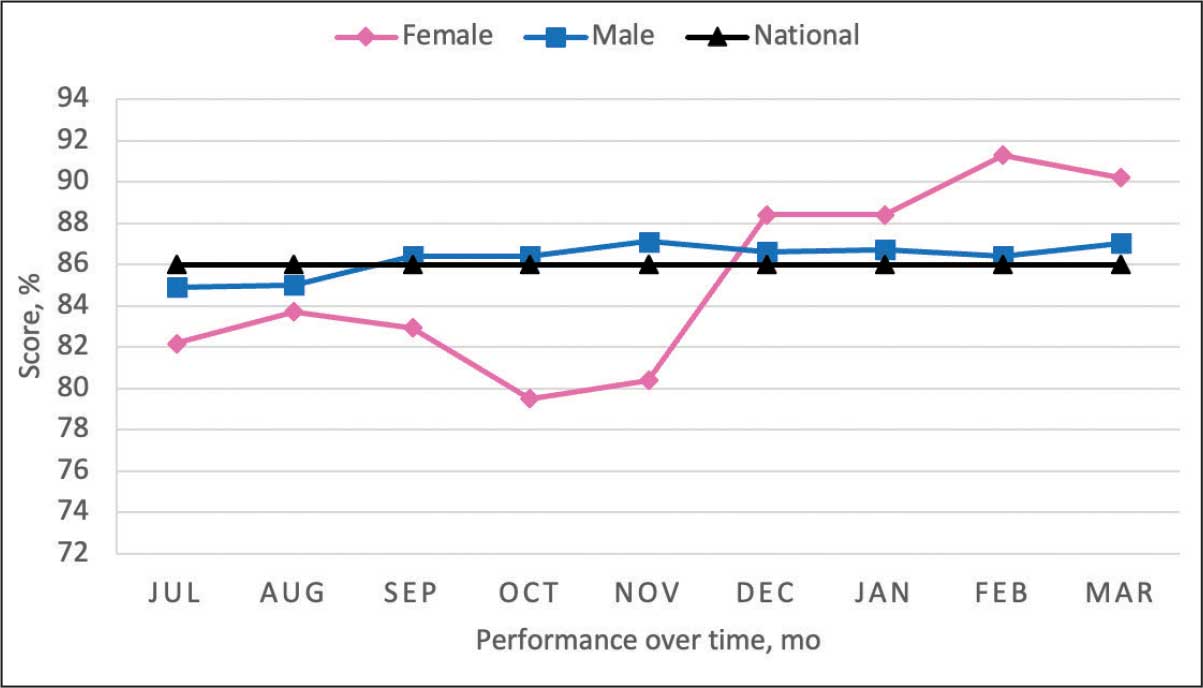
Secondary Outcomes
Seventy-one of 129 veterans (55.0%) gave verbal consent, and 47 (66.2%) completed the pharmacogenomic testing; 58 (45.0%) declined. Five veterans (10.6%) had a known SLCO1B1 allele variant present. One veteran required a change in statin therapy based on the results (eAppendix).
Discussion
This project aimed to increase statin prescribing among female veterans with T2DM and/or CVD to reduce cardiovascular risk and increase pharmacogenomic testing using the PCED and care managed by CPPs. The results of this quality improvement project illustrated that both metrics have improved at CVVAMC as a result of the intervention. The results in both metrics now exceed the PCED national VA average, and the CVD metric also exceeds that of the facility male comparator group. While there was only a 1.2% increase from July 2023 to March 2024 for patients with T2DM, there was an 8.0% increase for patients with CVD. Despite standardized education on statin use, more veterans declined therapy than accepted it, mostly due to concern for AEs. Recording the reasons for declining statin therapy offered valuable insight that can be used in additional discussions with veterans and clinicians.
Pharmacogenomics gives clinicians the unique opportunity to take a proactive approach to better predict drug responses, potentially allowing for less trial and error with medications, fewer AEs, greater trust in the clinician, and improved medication adherence. The CPPs incorporated pharmacogenomic testing into their practice, which led to identifying 5 SLCO1B1 gene abnormalities. The PCED served as a powerful tool for advancing equity-focused quality improvement initiatives on a local level and was crucial in prioritizing the detection of veterans potentially receiving suboptimal care.
Limitations
The nature of “cold calls” made it challenging to establish contact for inclusion in this study. An alternative to increase engagement could have been scheduled phone or face-to-face visits. While the use of the PCED was crucial, data did not account for statins listed in the non-VA medication list. All 31 patients with statins prescribed outside the VA had a start date added to provide the most accurate representation of the data moving forward.
Another limitation in this project was its small sample size and population. CVVAMC serves about 6200 female veterans, with roughly 63% identifying as Black. The preponderance of Black individuals (83%) in this project is typical for the female patient population at CVVAMC but may not reflect the demographics of other populations. Other limitations to this project consisted of scheduling conflicts. Appointments for laboratory draws at community-based outpatient clinics were subject to availability, which resulted in some delay in completion of pharmacogenomic testing.
Conclusions
CPPs can help reduce inequity in health care delivery. Increased incorporation of the PCED into regular practice within the VA is recommended to continue addressing sex disparities in statin use, diabetes control, blood pressure management, cancer screenings, and vaccination needs. CVVAMC plans to expand its use through another quality improvement project focused on reducing sex disparities in blood pressure management. Improving educational resources made available to veterans on the importance of statin therapy and potential to mitigate AEs through use of the VA PHASER program also would be helpful. This project successfully improved CVVAMC metrics for female veterans appropriately prescribed statin therapy and increased access to pharmacogenomic testing. Most importantly, it helped close the sex-based gap in CVD risk reduction care.
- Heron M. Deaths: leading causes for 2018. Nat Vital Stat Rep. 2021;70:1-114.
- US Department of Veterans Affairs, US Department of Defense. VA/DoD Clinical practice guideline for the management of dyslipidemia for cardiovascular risk reduction. Published June 2020. Accessed August 25, 2025. https://www.healthquality.va.gov/guidelines/CD/lipids/VADODDyslipidemiaCPG5087212020.pdf
- Atherosclerotic Cardiovascular Disease (ASCVD). American Heart Association. Accessed August 26, 2025. https:// www.heart.org/en/professional/quality-improvement/ascvd
- American Diabetes Association Professional Practice Committee. 10. Cardiovascular disease and risk management: standards of medical care in diabetes-2022. Diabetes Care. 2022;45(Suppl 1):S144-S174. doi:10.2337/dc22-S010
- American Diabetes Association. Standards of Care in Diabetes— 2023 abridged for primary care providers. Clinical Diabetes. 2022;41(1):4-31. doi:10.2337/cd23-as01
- Virani SS, Woodard LD, Ramsey DJ, et al. Gender disparities in evidence-based statin therapy in patients with cardiovascular disease. Am J Cardiol. 2015;115:21-26. doi:10.1016/j.amjcard.2014.09.041
- Arnett DK, Blumenthal RS, Albert MA, et al. 2019 ACC/ AHA Guideline on the primary prevention of cardiovascular disease: a report of the American College of Cardiology/ American Heart Association Task Force on Clinical Practice Guidelines. Circulation. 2019;140(11):e596-e646. doi:10.1161/CIR.0000000000000678
- Buchanan CH, Brown EA, Bishu KG, et al. The magnitude and potential causes of gender disparities in statin therapy in veterans with type 2 diabetes: a 10-year nationwide longitudinal cohort study. Womens Health Issues. 2022;32:274-283. doi:10.1016/j.whi.2021.10.003
- Ahmed F, Lin J, Ahmed T, et al. Health disparities: statin prescribing patterns among patients with diabetes in a family medicine clinic. Health Equity. 2022;6:291-297. doi:10.1089/heq.2021.0144
- Metser G, Bradley C, Moise N, Liyanage-Don N, Kronish I, Ye S. Gaps and disparities in primary prevention statin prescription during outpatient care. Am J Cardiol. 2021;161:36-41. doi:10.1016/j.amjcard.2021.08.070
- Nanna MG, Wang TY, Xiang Q, et al. Sex differences in the use of statins in community practice. Circ Cardiovasc Qual Outcomes. 2019;12(8):e005562. doi:10.1161/CIRCOUTCOMES.118.005562
- Kitzmiller JP, Mikulik EB, Dauki AM, Murkherjee C, Luzum JA. Pharmacogenomics of statins: understanding susceptibility to adverse effects. Pharmgenomics Pers Med. 2016;9:97-106. doi:10.2147/PGPM.S86013
- Türkmen D, Masoli JAH, Kuo CL, Bowden J, Melzer D, Pilling LC. Statin treatment effectiveness and the SLCO1B1*5 reduced function genotype: long-term outcomes in women and men. Br J Clin Pharmacol. 2022;88:3230-3240. doi:10.1111/bcp.15245
- Cooper-DeHoff RM, Niemi M, Ramsey LB, et al. The Clinical Pharmacogenetics Implementation Consortium guideline for SLCO1B1, ABCG2, and CYP2C9 genotypes and statin-associated musculoskeletal symptoms. Clin Pharmacol Ther. 2022;111:1007-1021. doi:10.1002/cpt.2557
- Ramsey LB, Gong L, Lee SB, et al. PharmVar GeneFocus: SLCO1B1. Clin Pharmacol Ther. 2023;113:782-793. doi:10.1002/cpt.2705
- National Healthcare Quality and Disparities Report: Chartbook on Healthcare for Veterans. Rockville (MD): Agency for Healthcare Research and Quality (US); November 2020.
- Procario G. Primary Care Equity Dashboard [database online]. Power Bi. 2023. Accessed August 26, 2025. https://app.powerbigov.us
- Hausmann LRM, Lamorte C, Estock JL. Understanding the context for incorporating equity into quality improvement throughout a national health care system. Health Equity. 2023;7(1):312-320. doi:10.1089/heq.2023.0009
Cardiovascular disease (CVD) is the leading cause of death among women in the United States.1 Most CVD is due to the buildup of plaque (ie, cholesterol, proteins, calcium, and inflammatory cells) in artery walls.2 The plaque may lead to atherosclerotic cardiovascular disease (ASCVD), which includes coronary heart disease, cerebrovascular disease, peripheral artery disease, and aortic atherosclerotic disease.2,3 Control and reduction of ASCVD risk factors, including high cholesterol levels, elevated blood pressure, insulin resistance, smoking, and a sedentary lifestyle, can contribute to a reduction in ASCVD morbidity and mortality.2 People with type 2 diabetes mellitus (T2DM) have an increased prevalence of lipid abnormalities, contributing to their high risk of ASCVD.4,5
The prescribing of statins (3-hydroxy-3-methyl-glutaryl-coenzmye A reductase inhibitors) is the cornerstone of lipid-lowering therapy and cardiovascular risk reduction for primary and secondary prevention of ASCVD.6 The American Diabetes Association (ADA) and American College of Cardiology/American Heart Association (ACC/AHA) recommend moderate- to high-intensity statins for primary prevention in patients with T2DM and high-intensity statins for secondary prevention in those with or without diabetes when not contraindicated.4,5,7 Despite eligibility according to guideline recommendations, research predominantly shows that women are less likely to receive statin therapy; however, this trend is improving. [6,8-11] To explain the sex differences in statin use, Nanna et al found that there is a combination of women being offered statin therapy less frequently, declining therapy more frequently, and discontinuing treatment more frequently.11 One possibility for discontinuing treatment could be statin-associated muscle symptoms (SAMS), which occur in about 10% of patients.12 The incidence of adverse effects (AEs) may be related to the way statins are metabolized.
Pharmacogenomic testing is free for veterans through the US Department of Veterans Affairs (VA) PHASER program, which offers information and recommendations for a panel of 11 gene variants. The panel includes genes related to common medication classes such as anticoagulants, antiplatelets, proton pump inhibitors, nonsteroidal anti-inflammatory drugs, opioids, antidepressants, and statins. The VA PHASER panel includes the solute carrier organic anion transporter family member 1B1 (SLCO1B1) gene, which is predominantly expressed in the liver and facilitates the hepatic uptake of most statins.13,14 A reduced function of SLCO1B1 can lead to higher statin levels, resulting in increased concentrations that may potentially cause SAMS.13,14 Some alleles associated with reduced function include SLCO1B1*5, *15, *23, *31, and *46 to *49, whereas others are associated with increased function, such as SLCO1B1 *14 and *20 (Appendix).15 Supporting evidence shows the SLCO1B1*5 nucleotide polymorphism increases plasma levels of simvastatin and atorvastatin, affecting effectiveness or toxicity. 13 Females tend to have a lower body weight and higher percentage of body fat compared with males, which might lead to higher concentrations of lipophilic drugs, including atorvastatin and simvastatin, which may be exacerbated by decreased function of SLCO1B1*5.15 With pharmacogenomic testing, therapeutic recommendations can be made to improve the overall safety and efficacy of statins, thus improving adherence using a patient-specific approach.14,15
Methods
Carl Vinson VA Medical Center (CVVAMC) serves about 42,000 veterans in Central and South Georgia, of which about 15% are female. Of the female veterans enrolled in care, 63% identify as Black, 27% White, and 1.5% as Asian, American Indian/Alaska Native, or Native Hawaiian/Other Pacific Islander. The 2020 Veterans Chartbook report showed that female veterans and minority racial and ethnic groups had worse access to health care and higher mortality rates than their male and non-Hispanic White counterparts.16
The Primary Care Equity Dashboard (PCED) was developed to engage the VA health care workforce in the process of identifying and addressing inequities in local patient populations.17 Using electronic quality measure data, the PCED provides Veterans Integrated Service Network-level and facility-level performance on several metrics.18 The PCED had not been previously used at the CVVAMC, and few publications or quality improvement projects regarding its use have been reported by the VA Office of Health Equity. PCED helped identify disparities when comparing female to male patients in the prescribing of statin therapy for patients with CVD and statin therapy for patients with T2DM.
VA PHASER pharmacogenomic analyses provided an opportunity to expand this quality improvement project. Sanford Health and the VA collaborated on the PHASER program to offer free genetic testing for veterans. The program launched in 2019 and expanded to various VA sites, including CVVAMC in March 2023. This program has been extended to December 31, 2025.
The primary objective of this quality improvement project was to increase statin prescribing among female veterans with T2DM and/or CVD to reduce cardiovascular risk. Secondary outcomes included increased pharmacogenomic testing and the assessment of pharmacogenomic results related to statin therapy. This project was approved by the CVVAMC Pharmacy and Therapeutics Committee. The PCED was used to identify female veterans with T2DM and/or CVD without an active prescription for a statin between July and October 2023. A review of Computerized Patient Record System patient charts was completed to screen for prespecified inclusion and exclusion criteria. Veterans were included if they were assigned female at birth, were enrolled in care at CVVAMC, and had a diagnosis of T2DM or CVD (history of myocardial infarction, coronary bypass graft, percutaneous coronary intervention, or other revascularization in any setting).
Veterans were excluded if they were currently pregnant, trying to conceive, breastfeeding, had a T1DM diagnosis, had previously documented hypersensitivity to a statin, active liver failure or decompensated cirrhosis, previously documented statin-associated rhabdomyolysis or autoimmune myopathy, an active prescription for a proprotein convertase subtilisin/kexin type 9 inhibitor, or previously documented statin intolerance (defined as the inability to tolerate ≥ 3 statins, with ≥ 1 prescribed at low intensity or alternate-day dosing). The female veterans were compared to 2 comparators: the facility's male veterans and the VA national average, identified via the PCED.
Once a veteran was screened, they were telephoned between October 2023 and February 2024 and provided education on statin use and pharmacogenomic testing using a standardized note template. An order was placed for participants who provided verbal consent for pharmacogenomic testing. Those who agreed to statin initiation were referred to a clinical pharmacist practitioner (CPP) who contacted them at a later date to prescribe a statin following the recommendations of the 2019 ACC/AHA and 2023 ADA guidelines and pharmacogenomic testing, if applicable.4,5,7 Appropriate monitoring and follow-up occurred at the discretion of each CPP. Data collection included: age, race, diagnoses (T2DM, CVD, or both), baseline lipid panel (total cholesterol, triglycerides, high-density lipoprotein, low-density lipoprotein), hepatic function, name and dose of statin, reasons for declining statin therapy, and pharmacogenomic testing results related to SLCO1B1.
Results
At baseline in July 2023, 77.8% of female veterans with T2DM were prescribed a statin, which exceeded the national VA average (77.0%), but was below the rate for male veterans (78.7%) in the facility comparator group.17 Additionally, 82.2% of females with CVD were prescribed a statin, which was below the national VA average of 86.0% and the 84.9% of male veterans in the facility comparator group.17 The PCED identified 189 female veterans from July 2023 to October 2023 who may benefit from statin therapy. Thirty-three females met the exclusion criteria. Of the 156 included veterans, 129 (82.7%) were successfully contacted and 27 (17.3%) could not be reached by telephone after 3 attempts (Figure 1). The 129 female veterans contacted had a mean age of 59 years and the majority were Black (82.9%) (Table 1).
Abbreviations: CVD, cardiovascular disease; PCSK9, proprotein convertase subtilisin/
kexin type 9; T2DM, type 2 diabetes mellitus; VAMC, Veterans Affairs medical center.
Primary Outcomes
Of the 129 contacted veterans, 31 (24.0%) had a non-VA statin prescription, 13 (10.1%) had an active VA statin prescription, and 85 (65.9%) did not have a statin prescription, despite being eligible. Statin adherence was confirmed with participants, and the medication list was updated accordingly.
Of the 85 veterans with no active statin therapy, 37 (43.5%) accepted a new statin prescription and 48 (56.5%) declined. There were various reasons provided for declining statin therapy: 17 participants (35.4%) declined due to concern for AEs (Table 2).
From July 2023 to March 2024, the percentage of female veterans with active statin therapy with T2DM increased from 77.8% to 79.0%. For those with active statin therapy with CVD, usage increased from 82.2% to 90.2%, which exceeded the national VA average and facility male comparator group (Figures 2 and 3).17
Secondary Outcomes
Seventy-one of 129 veterans (55.0%) gave verbal consent, and 47 (66.2%) completed the pharmacogenomic testing; 58 (45.0%) declined. Five veterans (10.6%) had a known SLCO1B1 allele variant present. One veteran required a change in statin therapy based on the results (eAppendix).
Discussion
This project aimed to increase statin prescribing among female veterans with T2DM and/or CVD to reduce cardiovascular risk and increase pharmacogenomic testing using the PCED and care managed by CPPs. The results of this quality improvement project illustrated that both metrics have improved at CVVAMC as a result of the intervention. The results in both metrics now exceed the PCED national VA average, and the CVD metric also exceeds that of the facility male comparator group. While there was only a 1.2% increase from July 2023 to March 2024 for patients with T2DM, there was an 8.0% increase for patients with CVD. Despite standardized education on statin use, more veterans declined therapy than accepted it, mostly due to concern for AEs. Recording the reasons for declining statin therapy offered valuable insight that can be used in additional discussions with veterans and clinicians.
Pharmacogenomics gives clinicians the unique opportunity to take a proactive approach to better predict drug responses, potentially allowing for less trial and error with medications, fewer AEs, greater trust in the clinician, and improved medication adherence. The CPPs incorporated pharmacogenomic testing into their practice, which led to identifying 5 SLCO1B1 gene abnormalities. The PCED served as a powerful tool for advancing equity-focused quality improvement initiatives on a local level and was crucial in prioritizing the detection of veterans potentially receiving suboptimal care.
Limitations
The nature of “cold calls” made it challenging to establish contact for inclusion in this study. An alternative to increase engagement could have been scheduled phone or face-to-face visits. While the use of the PCED was crucial, data did not account for statins listed in the non-VA medication list. All 31 patients with statins prescribed outside the VA had a start date added to provide the most accurate representation of the data moving forward.
Another limitation in this project was its small sample size and population. CVVAMC serves about 6200 female veterans, with roughly 63% identifying as Black. The preponderance of Black individuals (83%) in this project is typical for the female patient population at CVVAMC but may not reflect the demographics of other populations. Other limitations to this project consisted of scheduling conflicts. Appointments for laboratory draws at community-based outpatient clinics were subject to availability, which resulted in some delay in completion of pharmacogenomic testing.
Conclusions
CPPs can help reduce inequity in health care delivery. Increased incorporation of the PCED into regular practice within the VA is recommended to continue addressing sex disparities in statin use, diabetes control, blood pressure management, cancer screenings, and vaccination needs. CVVAMC plans to expand its use through another quality improvement project focused on reducing sex disparities in blood pressure management. Improving educational resources made available to veterans on the importance of statin therapy and potential to mitigate AEs through use of the VA PHASER program also would be helpful. This project successfully improved CVVAMC metrics for female veterans appropriately prescribed statin therapy and increased access to pharmacogenomic testing. Most importantly, it helped close the sex-based gap in CVD risk reduction care.
- Heron M. Deaths: leading causes for 2018. Nat Vital Stat Rep. 2021;70:1-114.
- US Department of Veterans Affairs, US Department of Defense. VA/DoD Clinical practice guideline for the management of dyslipidemia for cardiovascular risk reduction. Published June 2020. Accessed August 25, 2025. https://www.healthquality.va.gov/guidelines/CD/lipids/VADODDyslipidemiaCPG5087212020.pdf
- Atherosclerotic Cardiovascular Disease (ASCVD). American Heart Association. Accessed August 26, 2025. https:// www.heart.org/en/professional/quality-improvement/ascvd
- American Diabetes Association Professional Practice Committee. 10. Cardiovascular disease and risk management: standards of medical care in diabetes-2022. Diabetes Care. 2022;45(Suppl 1):S144-S174. doi:10.2337/dc22-S010
- American Diabetes Association. Standards of Care in Diabetes— 2023 abridged for primary care providers. Clinical Diabetes. 2022;41(1):4-31. doi:10.2337/cd23-as01
- Virani SS, Woodard LD, Ramsey DJ, et al. Gender disparities in evidence-based statin therapy in patients with cardiovascular disease. Am J Cardiol. 2015;115:21-26. doi:10.1016/j.amjcard.2014.09.041
- Arnett DK, Blumenthal RS, Albert MA, et al. 2019 ACC/ AHA Guideline on the primary prevention of cardiovascular disease: a report of the American College of Cardiology/ American Heart Association Task Force on Clinical Practice Guidelines. Circulation. 2019;140(11):e596-e646. doi:10.1161/CIR.0000000000000678
- Buchanan CH, Brown EA, Bishu KG, et al. The magnitude and potential causes of gender disparities in statin therapy in veterans with type 2 diabetes: a 10-year nationwide longitudinal cohort study. Womens Health Issues. 2022;32:274-283. doi:10.1016/j.whi.2021.10.003
- Ahmed F, Lin J, Ahmed T, et al. Health disparities: statin prescribing patterns among patients with diabetes in a family medicine clinic. Health Equity. 2022;6:291-297. doi:10.1089/heq.2021.0144
- Metser G, Bradley C, Moise N, Liyanage-Don N, Kronish I, Ye S. Gaps and disparities in primary prevention statin prescription during outpatient care. Am J Cardiol. 2021;161:36-41. doi:10.1016/j.amjcard.2021.08.070
- Nanna MG, Wang TY, Xiang Q, et al. Sex differences in the use of statins in community practice. Circ Cardiovasc Qual Outcomes. 2019;12(8):e005562. doi:10.1161/CIRCOUTCOMES.118.005562
- Kitzmiller JP, Mikulik EB, Dauki AM, Murkherjee C, Luzum JA. Pharmacogenomics of statins: understanding susceptibility to adverse effects. Pharmgenomics Pers Med. 2016;9:97-106. doi:10.2147/PGPM.S86013
- Türkmen D, Masoli JAH, Kuo CL, Bowden J, Melzer D, Pilling LC. Statin treatment effectiveness and the SLCO1B1*5 reduced function genotype: long-term outcomes in women and men. Br J Clin Pharmacol. 2022;88:3230-3240. doi:10.1111/bcp.15245
- Cooper-DeHoff RM, Niemi M, Ramsey LB, et al. The Clinical Pharmacogenetics Implementation Consortium guideline for SLCO1B1, ABCG2, and CYP2C9 genotypes and statin-associated musculoskeletal symptoms. Clin Pharmacol Ther. 2022;111:1007-1021. doi:10.1002/cpt.2557
- Ramsey LB, Gong L, Lee SB, et al. PharmVar GeneFocus: SLCO1B1. Clin Pharmacol Ther. 2023;113:782-793. doi:10.1002/cpt.2705
- National Healthcare Quality and Disparities Report: Chartbook on Healthcare for Veterans. Rockville (MD): Agency for Healthcare Research and Quality (US); November 2020.
- Procario G. Primary Care Equity Dashboard [database online]. Power Bi. 2023. Accessed August 26, 2025. https://app.powerbigov.us
- Hausmann LRM, Lamorte C, Estock JL. Understanding the context for incorporating equity into quality improvement throughout a national health care system. Health Equity. 2023;7(1):312-320. doi:10.1089/heq.2023.0009
Reducing Sex Disparities in Statin Therapy Among Female Veterans With Type 2 Diabetes and/or Cardiovascular Disease
Reducing Sex Disparities in Statin Therapy Among Female Veterans With Type 2 Diabetes and/or Cardiovascular Disease
Pruritus and swelling
The history and findings in this case are suggestive of chronic kidney disease (CKD).
CKD affects between 8% and 16% of the population worldwide. Risk factors for CKD are numerous and include T2D, hypertension, and prediabetes. Diabetes is the leading cause of CKD. Up to 40% of patients with diabetes develop diabetic kidney disease, which can progress to end-stage renal disease (ESRD) requiring dialysis or kidney transplantation. In fact, diabetic kidney disease is the top cause of ESRD in the United States.
Diagnostic criteria for CKD include elevated urinary albumin excretion (albuminuria) and/or eGFR < 60 mL/1.73 m2 that persists for more than 3 months. The normal presentation of diabetic kidney disease includes long-standing diabetes, retinopathy, albuminuria without gross hematuria, and gradually progressive decline of eGFR. However, signs of diabetic kidney disease may be present in patients at diagnosis or without retinopathy in T2D. Reduced eGFR without albuminuria has been frequently reported in both type 1 diabetes (T1D) and T2D and is becoming increasingly common as the prevalence of diabetes rises in the United States.
Chronic kidney disease is usually identified through routine screening with serum chemistry profile and urine studies or as an incidental finding. Less often, patients may present with symptoms, such as gross hematuria, "foamy urine" (a sign of albuminuria), nocturia, flank pain, or decreased urine output. In advanced cases, patients may report fatigue, poor appetite, nausea, vomiting, a metallic taste, unintentional weight loss, pruritus, changes in mental status, dyspnea, and/or peripheral edema.
The American Diabetes Association (ADA) 2023 Standards of Care in Diabetes describes five stages of CKD. Stages 1-2 are defined by evidence of high albuminuria with eGFR ≥ 60 mL/min/1.73 m2, while stages 3-5 are defined by progressively lower ranges of eGFR. Of note, at any eGFR, the degree of albuminuria is associated with risk for cardiovascular disease, CKD progression, and mortality. Thus, as noted by the ADA Standards, both eGFR and albuminuria should be used to guide treatment decisions; additionally, eGFR levels are essential for modifying drug dosages or restrictions of use, and the degree of albuminuria should influence selection of antihypertensive agents and glucose-lowering medications.
According to the ADA 2023 Standards of Care in Diabetes, for people with non–dialysis-dependent CKD, dietary protein intake should be ∼0.8 g/kg body weight per day (the recommended daily allowance), as this level has been shown to slow GFR decline compared with higher levels of dietary protein intake, with evidence of a greater effect over time. Conversely, higher levels of dietary protein intake (> 20% of daily calories from protein or > 1.3 g/kg/d) have been associated with increased albuminuria, more rapid kidney function loss, and cardiovascular disease mortality. For patients on dialysis, higher levels of dietary protein intake should be considered, because malnutrition is a significant problem in some of these patients.
Urinary excretion of sodium and potassium may be impaired in patients with reduced eGFR. Thus, restriction of dietary sodium to < 2300 mg/d may help to control blood pressure and reduce cardiovascular risk, and restriction of dietary potassium may be necessary to control serum potassium concentration.
Intensive glycemic control with the goal of achieving near-normoglycemia has been shown to delay the onset and progression of albuminuria and reduced eGFR in patients with diabetes. Insulin alone was used to lower blood glucose in the Diabetes Control and Complications Trial (DCCT)/Epidemiology of Diabetes Interventions and Complications (EDIC) study of T1D while a variety of agents were used in clinical trials of T2D, supporting the conclusion that glycemic control itself helps prevent CKD and its progression. However, the presence of CKD affects the risks and benefits of intensive glycemic control and several glucose-lowering medications. In the Action to Control Cardiovascular Risk in Diabetes (ACCORD) trial of T2D, increased adverse effects of intensive glycemic control (hypoglycemia and mortality) were seen among patients with kidney disease at baseline. Moreover, it may take at least 2 years to see improved eGFR outcomes as an effect of intensive glycemic control. Therefore, in some patients with prevalent CKD and substantial comorbidity, target A1c levels may be less intensive.
According to guidance from the US Food and Drug Administration, eGFR should be monitored while taking metformin and metformin is contraindicated in patients with an eGFR < 30 mL/min/1.73 m2. Clinicians should assess the benefits and risks of continuing treatment when eGFR falls to < 45 mL/min/1.73 m2.
The ADA recommends that sodium–glucose cotransporter 2 inhibitors be given to all patients with stage 3 CKD or higher and T2D, regardless of glycemic control, as they have been shown to delay CKD progression and reduce heart failure risk independent of glycemic control. Glucagon-like peptide 1 receptor agonists (GLP-1 RAs) also have direct effects on the kidney and have been reported to improve renal outcomes compared with placebo. In patients for whom cardiovascular risk is a predominant problem, the ADA suggests using GLP-1 RAs for cardiovascular risk reduction.
Comprehensive guidance on the management of CKD in patients with T2D is available in the ADA 2023 Standards of Care in Diabetes.
Romesh K. Khardori, MD, PhD, Professor, Department of Internal Medicine, Division of Diabetes, Endocrine, and Metabolic Disorders, Eastern Virginia Medical School; EVMS Medical Group, Norfolk, Virginia
Romesh K. Khardori, MD, PhD, has disclosed no relevant financial relationships.
Image Quizzes are fictional or fictionalized clinical scenarios intended to provide evidence-based educational takeaways.

A 56-year-old Hispanic man presents and reports a 2-month history of fatigue, loss of appetite, pruritus, and swelling of the legs, ankles, and feet. The patient was diagnosed with type 2 diabetes (T2D), hypertension, and hyperlipidemia 7 years ago after an ophthalmologist diagnosed him with diabetic retinopathy and referred him for medical care. Since then, he has been inconsistent with attending regular follow-up visits. He is a current smoker (40-pack/year history).
At today's visit, the patient's blood pressure is 150/95 mm Hg, heart rate is 97 beats/min, and respiration rate is 29 breaths/min. He is 5 ft 9 in and weighs 210 lb (BMI 31). Current medications include metformin ER 1000 mg/d, atorvastatin 40 mg/d, amlodipine 10 mg/d, and hydrochlorothiazide 25 mg/d. At a routine visit 4 months ago, the patient's estimated glomerular filtration rate (eGFR) was 59 mL/min/1.73 m2; at a subsequent follow-up visit, his eGFR was 57 mL/min/1.73 m2.
Pertinent laboratory findings today include eGFR 56 mL/min/1.73 m2, serum creatinine 2.7 g/dL, serum albumin 3.3 g/dL, A1c 8.8%, glucose 189 mg/dL, and an albumin-creatinine ratio of 225 mg/g. All other findings are within normal ranges.

T2D Medications II
Complaints of foot pain
This patient's physical findings are consistent with a diagnosis of claw toe, which can be caused by diabetes-related peripheral neuropathy.
According to the International Diabetes Federation, diabetes currently affects approximately 537 million adults worldwide. The number of individuals living with diabetes is expected to exceed 640 million by 2030 and 780 million by 2045. In the United States, more than 37 million people are living with diabetes.
Foot complications related to diabetes represent a significant economic and social burden and can profoundly affect a patient's quality of life and medical outcomes. Common diabetes-related foot complications include foot deformity and peripheral neuropathy, both of which increase the risk for ulceration and amputation. The most common deformity is at the metatarsophalangeal joint (MTPJ). As many as 85% of patients with a history of ulcers and amputation have an MTPJ deformity such as claw toe or hammertoe.
Although they are often grouped together, claw toe and hammertoe have distinct features. Extended MTPJ, flexed proximal interphalangeal joint (PIPJ), and flexed distal interphalangeal joint (DIPJ) are characteristic of claw toe. While hammertoe also has extended MTPJ and flexed PIPJ, the DIPJ is extended rather than flexed. In both cases, the area of high pressure at risk for skin breakdown and ulceration is at the metatarsal head as a result of MTPJ hyperextension deformity.
Prompt detection and care of diabetes-related foot complications can minimize progression and negative consequences on patients' health and quality of life. According to the American Diabetes Association, all patients with diabetes should undergo a comprehensive foot evaluation at least annually to identify risk factors for ulceration and amputation, which include foot deformities, poor glycemic control, peripheral neuropathy, cigarette smoking, preulcerative callus or corn, peripheral artery disease, chronic kidney disease, visual impairment, and a history of ulceration or amputation. When patients present with a history of ulceration or amputation, a foot inspection should be conducted at each visit.
A comprehensive foot evaluation should include inspection of the skin, evaluation of any foot deformities, a neurologic assessment (10-g monofilament testing with at least one other assessment: pinprick, temperature, vibration), and a vascular assessment, including pulses in the legs and feet.
Patients should be educated on risk factors and appropriate management of foot-related complications, including the importance of effective glycemic control and daily monitoring of feet. Treatment may be medical, surgical, or both, as indicated by the individual patient's presentation. Conservative treatment approaches include footwear that is extra wide or deep, avoiding high-heeled and narrow-toed shoes, use of a metatarsal bar or pad, cushioning sleeves or stocking caps with silicon linings, and a longitudinal pad beneath the toes.
Complete recommendations on achieving glycemic control in T2D can be found in the 2022 American Diabetes Association Standards of Medical Care. Guidelines on foot care are also available.
Romesh K. Khardori, MD, PhD, Professor, Department of Internal Medicine, Division of Diabetes, Endocrine, and Metabolic Disorders, Eastern Virginia Medical School; EVMS Medical Group, Norfolk, Virginia
Romesh K. Khardori, MD, PhD, has disclosed no relevant financial relationships.
Image Quizzes are fictional or fictionalized clinical scenarios intended to provide evidence-based educational takeaways.

A 59-year-old woman newly diagnosed with type 2 diabetes (T2D) and hypercholesterolemia presents with complaints of foot pain, particularly while wearing shoes. Physical examination reveals an extended metatarsophalangeal joint, a flexed proximal interphalangeal joint, and flexed distal interphalangeal joint. Her toenails are discolored with a yellowish hue, and callus formation is noted over the metatarsal area. The patient reports pain at the tip of the toe from pressure against the point of the distal phalanx. She states that she has not experienced any numbness, tingling, or muscle weakness. Before her recent diabetes diagnosis, the patient had not been receiving regular medical care. The patient's current medications include metformin 500 mg/d, empagliflozin 10 mg/d, and rosuvastatin 10 mg/d.

Flickering sensation in eyes
The American Diabetes Association (ADA) position statement on diabetic retinopathy states that hyperglycemia has been the most consistently associated risk factor for retinopathy. A large and consistent set of observational studies and clinical trials confirms the association of poor glucose control and retinopathy.
The Diabetes Control and Complications Trial (DCCT), a randomized controlled clinical trial of intensive glycemic control vs conventional glycemic control in people with type 1 diabetes (T1D), demonstrated that intensive therapy reduced the development or progression of diabetic retinopathy by 34%-76%. The DCCT also demonstrated a definitive relationship between hyperglycemia and diabetic microvascular complications, including retinopathy. Early treatment with intensive therapy was effective.
The UK Prospective Diabetes Study (UKPDS) of patients with newly diagnosed T2D conclusively demonstrated that improved blood glucose control reduced the risk for retinopathy and nephropathy and, possibly, neuropathy. The overall microvascular complication rate was decreased by 25% in patients receiving intensive therapy vs conventional therapy. Epidemiologic analysis of the UKPDS data showed a continuous relationship between the risk for microvascular complications and glycemia, such that every percentage-point decrease in A1c (eg, 9% to 8%) was associated with a 35% reduction in the risk for microvascular complications.
More recently, the ACCORD trial of medical therapies demonstrated that intensive glycemic control reduced the risk for progression of diabetic retinopathy in people with T2D of 10 years' duration. This study included 2856 ACCORD participants enrolled in the ACCORD Eye Study and followed for 4 years.
The ADA recommends screening by an ophthalmologist for diabetic retinopathy within 5 years of the diagnosis of T1D and at the time of diagnosis of T2D. Women with preexisting diabetes who are planning pregnancy or who have become pregnant should be screened before pregnancy or in the first trimester.
While optimization of blood glucose, blood pressure, and serum lipid levels in conjunction with appropriately scheduled dilated eye examinations can substantially decrease the risk for vision loss from diabetic retinopathy, a significant proportion of those affected with diabetes develop diabetic macular edema or proliferative changes that require intervention. ADA treatment recommendations are:
• Refer patients with any level of macular edema, severe nonproliferative diabetic retinopathy (a precursor of proliferative diabetic retinopathy), or proliferative diabetic retinopathy to an ophthalmologist knowledgeable and experienced in the management and treatment of diabetic retinopathy.
• Laser photocoagulation therapy reduces the risk for vision loss in patients with high-risk proliferative diabetic retinopathy and, in some cases, severe nonproliferative diabetic retinopathy.
• Intravitreous injections of anti–vascular endothelial growth factor are indicated for central-involved diabetic macular edema, which occurs beneath the foveal center and may threaten reading vision.
Romesh K. Khardori, MD, PhD, Professor, Department of Internal Medicine, Division of Diabetes, Endocrine, and Metabolic Disorders, Eastern Virginia Medical School; EVMS Medical Group, Norfolk, Virginia
Romesh K. Khardori, MD, PhD, has disclosed no relevant financial relationships.
Image Quizzes are fictional or fictionalized clinical scenarios intended to provide evidence-based educational takeaways.

A 48-year-old Black man with type 2 diabetes (T2D) presented with complaints of a "flickering" sensation and a decrease in brightness of colors in both eyes as well as floaters in his left eye for several weeks. He reported that his symptoms fluctuate with changes in his blood glucose levels. His last eye examination was 2 years ago and his ocular history was unremarkable. His medical history was significant with a history of hypertension and T2D requiring insulin. His most recent glycated hemoglobin (A1c), 2 months ago, was 8.4%. His BMI was 31.2. The patient's medications were dulaglutide 0.75 mg injection pen, glargine insulin 42 units, losartan 100 mg, and amlodipine 10 mg.
On examination, his best-corrected visual acuity was 20/20 in the right eye and 20/30 in the left eye. Confrontation fields were intact, extraocular movements were full and extensive, and both pupils were equal, round, and reactive to light without afferent pupillary defects. Anterior segment examination was unremarkable in both eyes, without iris neovascularization. Intraocular pressures were 17 mm Hg in the right eye and 16 mm Hg in the left eye. On dilated fundus examination, the cup-to-disc ratio was 0.45 horizontally and vertically, with the presence of 1/4 disc diameters of neovascularization of the disc in the right eye and 2/3 disc diameters of neovascularization of the disc in the left eye.
Posterior segment findings were significant for scattered microaneurysms and dot/blot hemorrhages in the maculae. In the periphery of both eyes, there were tortuous vessels, scatter microaneurysms with dot/blot hemorrhages, and multiple areas of neovascularization elsewhere, with several foci of vitreous traction. There was no vitreous hemorrhage or tractional retinal detachment of either eye.
Spectral domain optical coherence tomography revealed an epiretinal membrane in the right eye and a blunted foveal contour with parafoveal cystic spaces, probably secondary to vitreomacular contraction. The left eye also had an epiretinal membrane and blunted foveal contour secondary to vitreomacular adhesion. The patient was diagnosed with bilateral high-risk proliferative diabetic retinopathy.
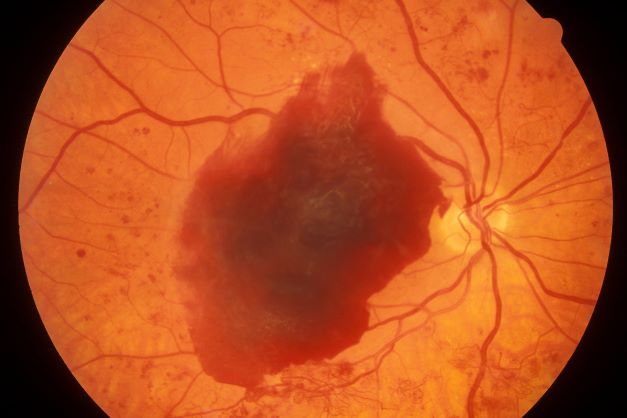
Type 2 Diabetes Treatment
Pruritus and pitting edema
The 2020 Kidney Disease Improving Global Outcomes (KDIGO) diabetes management in CKD guideline states that most patients with diabetic nephropathy and an eGFR ≥ 30 mL/min/1.73 m2 benefit from treatment with both metformin and a sodium-glucose cotransporter 2 (SGLT2) inhibitor, which have been demonstrated to offer substantial benefits in reducing the risks for diabetic nephropathy and cardiovascular disease.
In patients who do not reach individualized targets with metformin and an SGLT2 inhibitor, or who are unable to use these medications, a long-acting glucagon-like peptide 1 (GLP-1) receptor antagonist may be used.
Metformin should be administered with caution to patients with CKD because it may increase the risk for lactic acidosis. It is contraindicated in patients with an eGFR < 30, but this patient's eGFR is adequate. Many clinicians might use a lower metformin dosage (1500 mg) as a precaution. Given how high his A1c is, adding a GLP-1 receptor antagonist is probably going to be needed because an SGLT2 inhibitor is only intermediate in terms of glucose reduction.
For control of his hypertension, the American Diabetes Association recommends either an angiotensin-converting enzyme (ACE) inhibitor or an angiotensin receptor blocker (ARB) as first-line treatment. However, one agent alone is unlikely to control this patient's hypertension. At his level of eGFR, a thiazide diuretic is unlikely to be very effective. Therefore, a loop diuretic should be initiated with the ACE inhibitor or ARB, especially because he has edema.
Romesh K. Khardori, MD, PhD, Professor, Department of Internal Medicine, Division of Diabetes, Endocrine, and Metabolic Disorders, Eastern Virginia Medical School; EVMS Medical Group, Norfolk, Virginia
Romesh K. Khardori, MD, PhD, has disclosed no relevant financial relationships.
Image Quizzes are fictional or fictionalized clinical scenarios intended to provide evidence-based educational takeaways.
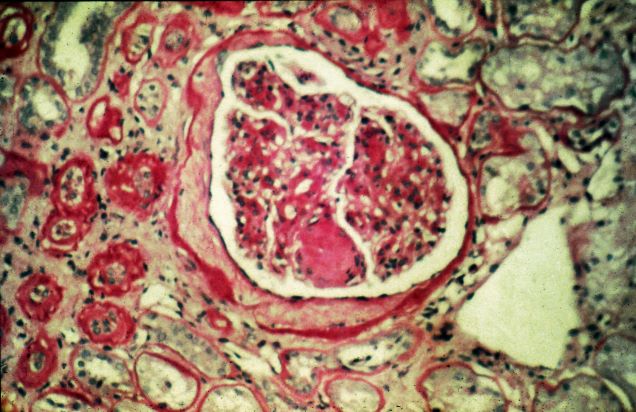
A 47-year-old Black man presents with shortness of breath, pruritus, and pitting edema of the bilateral extremities, which have been present for 6 weeks. He has a 7-year history of type 2 diabetes, hypertension, and hyperlipidemia, as well as a 30–pack-year history of smoking. His blood pressure is 160/95 mm Hg, heart rate is 97 beats/min (regular rate and rhythm), and respiration is 26 breaths/min. He also has proliferative retinopathy. He is 5 ft 10 in and weighs 220 lb (BMI 31.6). He is taking metformin 2550 mg/d. Other medications include simvastatin 20 mg, amlodipine 10 mg, and hydrochlorothiazide 25 mg. He admits to being nonadherent to his medication regimen. A year ago, his estimated glomerular filtration rate (eGFR) was 66 mL/min/1.73 m2 and he had 1+ proteinuria.
Laboratory tests reveal hemoglobin of 8.7 g/dL, creatinine of 3.4 g/dL, eGFR of 32 mL/min/1.73 m2, serum albumin of 3.3 g/dL, A1c of 8.8%, low-density lipoprotein of 143 mg/dL, high-density lipoprotein of 43 mg/dL, random glucose of 186 mg/dL, albumin-creatinine ratio of 3250 mg/g, calcium of 8.7 mg/dL, phosphorus of 4.2 mg/dL, plasma parathyroid hormone of 77 pg/mL, and C-reactive protein of 12.
In summary, this patient has normal albumin levels and increased proteinuria with decreased eGFR. His glucose level and A1c are not controlled. In addition, he has anemia, a low serum albumin level, and edema.
This patient has diabetic nephropathy and is at risk for a cardiovascular event because of his eGFR and long history of diabetes, hypertension, tobacco use, and hyperlipidemia. Intervention to control these risk factors should start immediately to prevent progression to chronic kidney disease (CKD).
