User login
Diabetic foot ulcer: Early closure post debridement best
SAN DIEGO – Early wound closure prior to hospital discharge after surgical debridement of infected diabetic foot ulcers yields higher ulcer healing rates and a shorter time to healing, compared with various nonclosure wound management methods, according to a propensity-matched study.
How best to manage the open wound following nonamputative surgery of infected diabetic foot ulcers has been controversial. But early wound closure during the index hospitalization was the clear winner in this comparative study, Dr. Shey-Ying Chen reported at the annual Interscience Conference on Antimicrobial Agents and Chemotherapy.
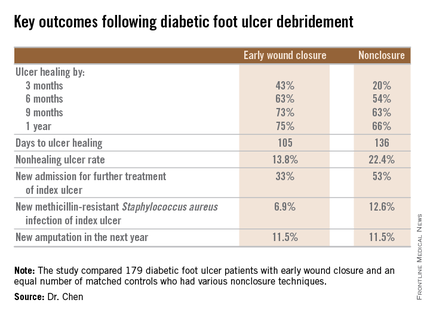
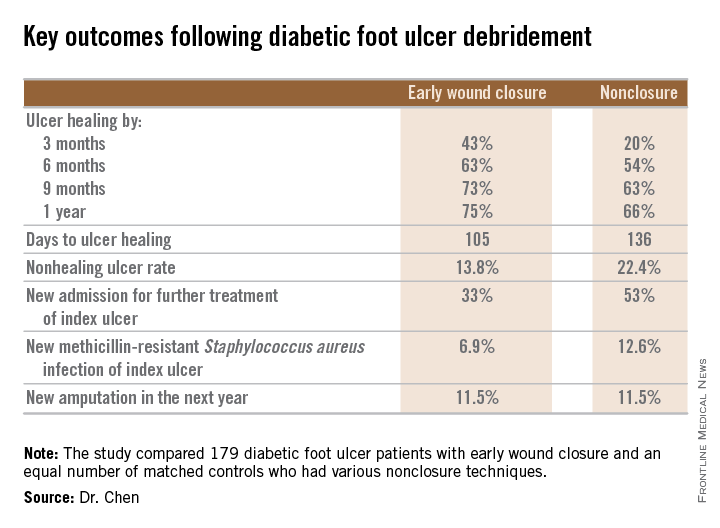
He presented a retrospective comparison between 179 diabetic foot ulcer (DFU) patients with early wound closure after surgical debridement and an equal number of matched controls treated with various nonclosure techniques, including negative pressure wound therapy and the repeated application of moist dressings. The two study groups were matched first on the basis of DFU location – toe, forefoot, midfoot, or rear foot – and then further propensity matched based on demographics, comorbid conditions, the presence of neuropathy, ulcer status by Wagner classification, infection severity, revascularization procedures, and other variables.
During 1 year of follow-up post discharge, ulcer healing occurred in 75% of the early wound closure group, compared with 66% of the nonclosure patients. Readmission for further treatment of the index ulcer occurred in 33% of the early closure group and 52% of the nonclosure group. Other outcomes were also superior in the early wound closure group, noted Dr. Chen of Beth Israel Deaconess Medical Center, Boston.
Two independent predictors of DFU healing during the follow-up period emerged from a Cox regression analysis: early wound closure, with an adjusted odds ratio of 1.63, and acute as opposed to chronic DFU, with an OR of 1.35.
Ulcer healing was significantly less likely in patients with peripheral vascular disease, with an OR of 0.62; neuropathy, with an OR of 0.53; and methicillin-resistant Staphylococcus aureus wound infection, with an OR of 0.59, he continued.
Underscoring the longer-term difficulties faced by patients with DFUs, it’s noteworthy that 11.5% of patients in both study arms underwent new amputations during the year of follow-up. Moreover, a new diagnosis of osteomyelitis was made in 20% of the early wound closure group and 26% of the nonclosure group, a nonsignificant difference.
Dr. Adolf W. Karchmer, Dr. Chen’s senior coinvestigator, said the outcome data are too new to be able to gauge how vascular, orthopedic, and podiatric surgeons will react.
The investigators reported having no financial conflicts with regard to this study, conducted without commercial sponsorship.
SAN DIEGO – Early wound closure prior to hospital discharge after surgical debridement of infected diabetic foot ulcers yields higher ulcer healing rates and a shorter time to healing, compared with various nonclosure wound management methods, according to a propensity-matched study.
How best to manage the open wound following nonamputative surgery of infected diabetic foot ulcers has been controversial. But early wound closure during the index hospitalization was the clear winner in this comparative study, Dr. Shey-Ying Chen reported at the annual Interscience Conference on Antimicrobial Agents and Chemotherapy.
He presented a retrospective comparison between 179 diabetic foot ulcer (DFU) patients with early wound closure after surgical debridement and an equal number of matched controls treated with various nonclosure techniques, including negative pressure wound therapy and the repeated application of moist dressings. The two study groups were matched first on the basis of DFU location – toe, forefoot, midfoot, or rear foot – and then further propensity matched based on demographics, comorbid conditions, the presence of neuropathy, ulcer status by Wagner classification, infection severity, revascularization procedures, and other variables.
During 1 year of follow-up post discharge, ulcer healing occurred in 75% of the early wound closure group, compared with 66% of the nonclosure patients. Readmission for further treatment of the index ulcer occurred in 33% of the early closure group and 52% of the nonclosure group. Other outcomes were also superior in the early wound closure group, noted Dr. Chen of Beth Israel Deaconess Medical Center, Boston.
Two independent predictors of DFU healing during the follow-up period emerged from a Cox regression analysis: early wound closure, with an adjusted odds ratio of 1.63, and acute as opposed to chronic DFU, with an OR of 1.35.
Ulcer healing was significantly less likely in patients with peripheral vascular disease, with an OR of 0.62; neuropathy, with an OR of 0.53; and methicillin-resistant Staphylococcus aureus wound infection, with an OR of 0.59, he continued.
Underscoring the longer-term difficulties faced by patients with DFUs, it’s noteworthy that 11.5% of patients in both study arms underwent new amputations during the year of follow-up. Moreover, a new diagnosis of osteomyelitis was made in 20% of the early wound closure group and 26% of the nonclosure group, a nonsignificant difference.
Dr. Adolf W. Karchmer, Dr. Chen’s senior coinvestigator, said the outcome data are too new to be able to gauge how vascular, orthopedic, and podiatric surgeons will react.
The investigators reported having no financial conflicts with regard to this study, conducted without commercial sponsorship.
SAN DIEGO – Early wound closure prior to hospital discharge after surgical debridement of infected diabetic foot ulcers yields higher ulcer healing rates and a shorter time to healing, compared with various nonclosure wound management methods, according to a propensity-matched study.
How best to manage the open wound following nonamputative surgery of infected diabetic foot ulcers has been controversial. But early wound closure during the index hospitalization was the clear winner in this comparative study, Dr. Shey-Ying Chen reported at the annual Interscience Conference on Antimicrobial Agents and Chemotherapy.
He presented a retrospective comparison between 179 diabetic foot ulcer (DFU) patients with early wound closure after surgical debridement and an equal number of matched controls treated with various nonclosure techniques, including negative pressure wound therapy and the repeated application of moist dressings. The two study groups were matched first on the basis of DFU location – toe, forefoot, midfoot, or rear foot – and then further propensity matched based on demographics, comorbid conditions, the presence of neuropathy, ulcer status by Wagner classification, infection severity, revascularization procedures, and other variables.
During 1 year of follow-up post discharge, ulcer healing occurred in 75% of the early wound closure group, compared with 66% of the nonclosure patients. Readmission for further treatment of the index ulcer occurred in 33% of the early closure group and 52% of the nonclosure group. Other outcomes were also superior in the early wound closure group, noted Dr. Chen of Beth Israel Deaconess Medical Center, Boston.
Two independent predictors of DFU healing during the follow-up period emerged from a Cox regression analysis: early wound closure, with an adjusted odds ratio of 1.63, and acute as opposed to chronic DFU, with an OR of 1.35.
Ulcer healing was significantly less likely in patients with peripheral vascular disease, with an OR of 0.62; neuropathy, with an OR of 0.53; and methicillin-resistant Staphylococcus aureus wound infection, with an OR of 0.59, he continued.
Underscoring the longer-term difficulties faced by patients with DFUs, it’s noteworthy that 11.5% of patients in both study arms underwent new amputations during the year of follow-up. Moreover, a new diagnosis of osteomyelitis was made in 20% of the early wound closure group and 26% of the nonclosure group, a nonsignificant difference.
Dr. Adolf W. Karchmer, Dr. Chen’s senior coinvestigator, said the outcome data are too new to be able to gauge how vascular, orthopedic, and podiatric surgeons will react.
The investigators reported having no financial conflicts with regard to this study, conducted without commercial sponsorship.
AT ICAAC 2015
Key clinical point: Diabetic foot ulcers are more likely to heal with early wound closure following surgical debridement than with nonclosure techniques.
Major finding: Healing of diabetic foot ulcers after surgical debridement took an average of 105 days in patients who underwent early wound closure prior to hospital discharge, compared with 136 days in those whose wounds were managed with nonclosure techniques.
Data source: A retrospective, nonrandomized study featuring two propensity score–matched groups, with 179 patients in each, who were followed for 1 year post discharge for surgical debridement of a diabetic foot ulcer.
Disclosures: The presenter reported having no financial conflicts regarding this study, conducted free of commercial support.
Travel Burden and Distress in Veterans With Head and Neck Cancer
Purpose: To investigate whether traveling long distances to a cancer treatment facility increases self-reported distress among veterans with head and neck cancer.
Background: Veterans within VISN 20 receive radiation therapy for head and neck cancer in Portland, Oregon, or Seattle, Washington. Given the geography, many travel and stay in lodging for the duration of treatment. As they cannot access usual sources of support within their communities, these veterans may be at risk for greater distress while undergoing cancer treatment.
Methods: The National Comprehensive Cancer Network Distress Thermometer (DT) is a validated tool for self-reported distress by cancer patients. Respondents report distress on a 0 to 10 scale and answer 28 questions regarding physical, emotional, and practical problems. In Seattle, the DT is completed shortly before starting treatment. Patient demographics, treatment plan (chemoradiation vs radiation alone), and DT data for veterans with head and neck cancer were abstracted from the Computerized Patient Record System. A DT score of 7 or higher was considered significant distress. Distance to the VA was calculated by zip code from the veteran’s address. Data were analyzed with logistic regression to control for possible effects of cancer stage, age category, or treatment plan.
Results: Sixty veterans with head and neck cancer completed the DT between April 2014 and April 2015. The average age was 65.4 years (range 39-91), all were male, 77% were white, 77% had stage III or IV cancer at diagnosis, and 47% traveled > 50 miles. The average DT score was 5.4. Veterans traveling > 50 miles were more likely to report significant distress compared with those who traveled < 50 miles (odds ratio (OR) = 1.6, P = .02). Sleep was the only problem significantly more likely for veterans traveling > 50 miles (OR = 1.71, P = .01).
Implications: Veterans with head and neck cancer traveling > 50 miles for cancer care are more likely to report significant distress or distress related to sleep. This small study suggests travel burden may be an underappreciated source of distress for veterans with cancer. Further research is warranted to better understand how travel burden affects distress and identify opportunities for intervention
Purpose: To investigate whether traveling long distances to a cancer treatment facility increases self-reported distress among veterans with head and neck cancer.
Background: Veterans within VISN 20 receive radiation therapy for head and neck cancer in Portland, Oregon, or Seattle, Washington. Given the geography, many travel and stay in lodging for the duration of treatment. As they cannot access usual sources of support within their communities, these veterans may be at risk for greater distress while undergoing cancer treatment.
Methods: The National Comprehensive Cancer Network Distress Thermometer (DT) is a validated tool for self-reported distress by cancer patients. Respondents report distress on a 0 to 10 scale and answer 28 questions regarding physical, emotional, and practical problems. In Seattle, the DT is completed shortly before starting treatment. Patient demographics, treatment plan (chemoradiation vs radiation alone), and DT data for veterans with head and neck cancer were abstracted from the Computerized Patient Record System. A DT score of 7 or higher was considered significant distress. Distance to the VA was calculated by zip code from the veteran’s address. Data were analyzed with logistic regression to control for possible effects of cancer stage, age category, or treatment plan.
Results: Sixty veterans with head and neck cancer completed the DT between April 2014 and April 2015. The average age was 65.4 years (range 39-91), all were male, 77% were white, 77% had stage III or IV cancer at diagnosis, and 47% traveled > 50 miles. The average DT score was 5.4. Veterans traveling > 50 miles were more likely to report significant distress compared with those who traveled < 50 miles (odds ratio (OR) = 1.6, P = .02). Sleep was the only problem significantly more likely for veterans traveling > 50 miles (OR = 1.71, P = .01).
Implications: Veterans with head and neck cancer traveling > 50 miles for cancer care are more likely to report significant distress or distress related to sleep. This small study suggests travel burden may be an underappreciated source of distress for veterans with cancer. Further research is warranted to better understand how travel burden affects distress and identify opportunities for intervention
Purpose: To investigate whether traveling long distances to a cancer treatment facility increases self-reported distress among veterans with head and neck cancer.
Background: Veterans within VISN 20 receive radiation therapy for head and neck cancer in Portland, Oregon, or Seattle, Washington. Given the geography, many travel and stay in lodging for the duration of treatment. As they cannot access usual sources of support within their communities, these veterans may be at risk for greater distress while undergoing cancer treatment.
Methods: The National Comprehensive Cancer Network Distress Thermometer (DT) is a validated tool for self-reported distress by cancer patients. Respondents report distress on a 0 to 10 scale and answer 28 questions regarding physical, emotional, and practical problems. In Seattle, the DT is completed shortly before starting treatment. Patient demographics, treatment plan (chemoradiation vs radiation alone), and DT data for veterans with head and neck cancer were abstracted from the Computerized Patient Record System. A DT score of 7 or higher was considered significant distress. Distance to the VA was calculated by zip code from the veteran’s address. Data were analyzed with logistic regression to control for possible effects of cancer stage, age category, or treatment plan.
Results: Sixty veterans with head and neck cancer completed the DT between April 2014 and April 2015. The average age was 65.4 years (range 39-91), all were male, 77% were white, 77% had stage III or IV cancer at diagnosis, and 47% traveled > 50 miles. The average DT score was 5.4. Veterans traveling > 50 miles were more likely to report significant distress compared with those who traveled < 50 miles (odds ratio (OR) = 1.6, P = .02). Sleep was the only problem significantly more likely for veterans traveling > 50 miles (OR = 1.71, P = .01).
Implications: Veterans with head and neck cancer traveling > 50 miles for cancer care are more likely to report significant distress or distress related to sleep. This small study suggests travel burden may be an underappreciated source of distress for veterans with cancer. Further research is warranted to better understand how travel burden affects distress and identify opportunities for intervention
Patterns of Initial Treatment in Veteran Patients With Chronic Lymphocytic Leukemia: A National VA Tumor Registry Study
Background: Chronic lymphocytic leukemia (CLL) is the most common leukemia in adults, including elderly veterans, with many new treatment options now available. Data on patterns of treatment in elderly veteran patients with CLL is limited. We sought to assess initial treatment patterns over a 13-year period among veteran patients in the Minneapolis VA Health Care System.
Methods: We identified 6,756 CLL cases diagnosed from 2000 to 2013 and are presenting interim data on 2015. We reviewed clinical data from 2,015 patients with CLL diagnosed from 2000 to 2013 and identified through the National VA Tumor Registry. Baseline demographics and treatment information were collected. The objective of this study was to assess initial treatment patterns, time to initial treatment, and variation of these parameters by age.
Results: At diagnosis, median age was 69 years (range, 37-96 years); 98% were male (1,979); Rai stage was 0 (n = 1,331, 66%), 1 (n = 317, 16%), 2 (n = 156, 8%), 3 (n = 91, 5%), 4 (n = 113, 6%). The majority of patients were white (n = 1,752, 87%); followed by African American (n = 203, 10%); and Hispanic (n = 33, 2%). Of the 2,015 patients, 751 (37%) received therapy over this period of follow-up. Median time from diagnosis to initial treatment was 1.3 years (range, 0-13 years). The most common initial therapies utilized were chlorambucil (39.4%); fludarabine/cyclophosphamide/ritux-imab (FCR) (12.4%); and single-agent fludarabine (10.5%). When examining these parameters by age in decades, we found that there were no differences in Rai stage at diagnosis by age-decade. There was a progressive increase in initial chlorambucil usage by advancing age. Likewise, the majority of FCR usage was in patients aged < 70 years.
Conclusions: In this veteran population, including many elderly patients, the majority of patients requiring therapy initiated it within 2 years of diagnosis. These patients were most commonly treated with chlorambucil. These patterns of care will be changing with the introduction of newer oral agents, such as ibrutinib and idelalisib, but at a significantly higher cost. The National VA Tumor Registry data will allow future opportunity to examine evolving treatment patterns in both an elderly as well as a veteran population. Updated data will be presented at the AVAHO annual meeting.
Background: Chronic lymphocytic leukemia (CLL) is the most common leukemia in adults, including elderly veterans, with many new treatment options now available. Data on patterns of treatment in elderly veteran patients with CLL is limited. We sought to assess initial treatment patterns over a 13-year period among veteran patients in the Minneapolis VA Health Care System.
Methods: We identified 6,756 CLL cases diagnosed from 2000 to 2013 and are presenting interim data on 2015. We reviewed clinical data from 2,015 patients with CLL diagnosed from 2000 to 2013 and identified through the National VA Tumor Registry. Baseline demographics and treatment information were collected. The objective of this study was to assess initial treatment patterns, time to initial treatment, and variation of these parameters by age.
Results: At diagnosis, median age was 69 years (range, 37-96 years); 98% were male (1,979); Rai stage was 0 (n = 1,331, 66%), 1 (n = 317, 16%), 2 (n = 156, 8%), 3 (n = 91, 5%), 4 (n = 113, 6%). The majority of patients were white (n = 1,752, 87%); followed by African American (n = 203, 10%); and Hispanic (n = 33, 2%). Of the 2,015 patients, 751 (37%) received therapy over this period of follow-up. Median time from diagnosis to initial treatment was 1.3 years (range, 0-13 years). The most common initial therapies utilized were chlorambucil (39.4%); fludarabine/cyclophosphamide/ritux-imab (FCR) (12.4%); and single-agent fludarabine (10.5%). When examining these parameters by age in decades, we found that there were no differences in Rai stage at diagnosis by age-decade. There was a progressive increase in initial chlorambucil usage by advancing age. Likewise, the majority of FCR usage was in patients aged < 70 years.
Conclusions: In this veteran population, including many elderly patients, the majority of patients requiring therapy initiated it within 2 years of diagnosis. These patients were most commonly treated with chlorambucil. These patterns of care will be changing with the introduction of newer oral agents, such as ibrutinib and idelalisib, but at a significantly higher cost. The National VA Tumor Registry data will allow future opportunity to examine evolving treatment patterns in both an elderly as well as a veteran population. Updated data will be presented at the AVAHO annual meeting.
Background: Chronic lymphocytic leukemia (CLL) is the most common leukemia in adults, including elderly veterans, with many new treatment options now available. Data on patterns of treatment in elderly veteran patients with CLL is limited. We sought to assess initial treatment patterns over a 13-year period among veteran patients in the Minneapolis VA Health Care System.
Methods: We identified 6,756 CLL cases diagnosed from 2000 to 2013 and are presenting interim data on 2015. We reviewed clinical data from 2,015 patients with CLL diagnosed from 2000 to 2013 and identified through the National VA Tumor Registry. Baseline demographics and treatment information were collected. The objective of this study was to assess initial treatment patterns, time to initial treatment, and variation of these parameters by age.
Results: At diagnosis, median age was 69 years (range, 37-96 years); 98% were male (1,979); Rai stage was 0 (n = 1,331, 66%), 1 (n = 317, 16%), 2 (n = 156, 8%), 3 (n = 91, 5%), 4 (n = 113, 6%). The majority of patients were white (n = 1,752, 87%); followed by African American (n = 203, 10%); and Hispanic (n = 33, 2%). Of the 2,015 patients, 751 (37%) received therapy over this period of follow-up. Median time from diagnosis to initial treatment was 1.3 years (range, 0-13 years). The most common initial therapies utilized were chlorambucil (39.4%); fludarabine/cyclophosphamide/ritux-imab (FCR) (12.4%); and single-agent fludarabine (10.5%). When examining these parameters by age in decades, we found that there were no differences in Rai stage at diagnosis by age-decade. There was a progressive increase in initial chlorambucil usage by advancing age. Likewise, the majority of FCR usage was in patients aged < 70 years.
Conclusions: In this veteran population, including many elderly patients, the majority of patients requiring therapy initiated it within 2 years of diagnosis. These patients were most commonly treated with chlorambucil. These patterns of care will be changing with the introduction of newer oral agents, such as ibrutinib and idelalisib, but at a significantly higher cost. The National VA Tumor Registry data will allow future opportunity to examine evolving treatment patterns in both an elderly as well as a veteran population. Updated data will be presented at the AVAHO annual meeting.
Initial Cytogenetic Features of Veteran Patients With Chronic Lymphocytic Leukemia: A National VA Tumor Registry Study
Background: Chronic lymphocytic leukemia (CLL) is the most common leukemia in adults, including elderly veterans. Some veterans have a history of Agent Orange exposure, which may potentially impact their presentation and disease course. We sought to assess initial patterns of cytogenetic aberrations among patients with CLL within the Minneapolis VA Health Care System (MVAHCS).
Methods: For this interim analysis, we evaluated a subset (30%) of a larger sample (6,756). We reviewed clinical data from 2,015 patients with CLL diagnosed from 2000 to 2013 and identified through the National VA Tumor Registry. Baseline demographics, including bone marrow/cytogenetic findings and treatment information were collected. The objective of this study was to assess initial cytogenetic patterns and variation of these parameters by age and Agent Orange exposure.
Results: Median age at diagnosis was 69 years (range, 37-96 years); 98% were male (1,979); Rai stage was 0 (n = 1,331, 66%), 1 (n = 317, 16%), 2 (n = 156, 8%), 3 (n = 91, 5%), 4 (n = 113, 6%). Cytogenetic data were available on 590 of 2,015 (29%) patients. Cytogenetic findings were normal in 258 (44%) patients. Abnormal cytogenetic findings in the remaining 330 cases included del 13q (28%); trisomy 12 (15%); del 11q (11%); del 17p (6%); and other abnor-malities (13%). Of 330 patients with noted abnormalities, 191 (58%) had 1 abnormality; 60 (18%) had 2; and 79 (24%) had > 2 abnormalities. Out of 2,015 patients, 283 (14%) had a reported exposure to Agent Orange; cytogenetic information was available in 130 (46%). Chromosomal abnormalities were detected in 80 of 130 cases (62%). The most frequent abnormality was del 13q (40%); trisomy 12 (19%); other abnormalities (18%); and del 11q (17%). Of the 80 pa-tients with noted abnormalities, 44 (55%) had 1 abnormality;14 (18%) had 2; and 22 (28%) had > 2 abnormalities.
Conclusions: Cytogenetic abnormalities in CLL play an important role in predicting disease progression and survival. These abnormalities paired with Agent Orange exposure have yet to be explored. Utilization of the National VA Tumor Registry data will allow the opportunity to examine the impact, if any, of Agent Orange exposure on the presentation and disease course of veterans with CLL. Updated cytogenetic findings will be presented at the AVAHO annual meeting.
Background: Chronic lymphocytic leukemia (CLL) is the most common leukemia in adults, including elderly veterans. Some veterans have a history of Agent Orange exposure, which may potentially impact their presentation and disease course. We sought to assess initial patterns of cytogenetic aberrations among patients with CLL within the Minneapolis VA Health Care System (MVAHCS).
Methods: For this interim analysis, we evaluated a subset (30%) of a larger sample (6,756). We reviewed clinical data from 2,015 patients with CLL diagnosed from 2000 to 2013 and identified through the National VA Tumor Registry. Baseline demographics, including bone marrow/cytogenetic findings and treatment information were collected. The objective of this study was to assess initial cytogenetic patterns and variation of these parameters by age and Agent Orange exposure.
Results: Median age at diagnosis was 69 years (range, 37-96 years); 98% were male (1,979); Rai stage was 0 (n = 1,331, 66%), 1 (n = 317, 16%), 2 (n = 156, 8%), 3 (n = 91, 5%), 4 (n = 113, 6%). Cytogenetic data were available on 590 of 2,015 (29%) patients. Cytogenetic findings were normal in 258 (44%) patients. Abnormal cytogenetic findings in the remaining 330 cases included del 13q (28%); trisomy 12 (15%); del 11q (11%); del 17p (6%); and other abnor-malities (13%). Of 330 patients with noted abnormalities, 191 (58%) had 1 abnormality; 60 (18%) had 2; and 79 (24%) had > 2 abnormalities. Out of 2,015 patients, 283 (14%) had a reported exposure to Agent Orange; cytogenetic information was available in 130 (46%). Chromosomal abnormalities were detected in 80 of 130 cases (62%). The most frequent abnormality was del 13q (40%); trisomy 12 (19%); other abnormalities (18%); and del 11q (17%). Of the 80 pa-tients with noted abnormalities, 44 (55%) had 1 abnormality;14 (18%) had 2; and 22 (28%) had > 2 abnormalities.
Conclusions: Cytogenetic abnormalities in CLL play an important role in predicting disease progression and survival. These abnormalities paired with Agent Orange exposure have yet to be explored. Utilization of the National VA Tumor Registry data will allow the opportunity to examine the impact, if any, of Agent Orange exposure on the presentation and disease course of veterans with CLL. Updated cytogenetic findings will be presented at the AVAHO annual meeting.
Background: Chronic lymphocytic leukemia (CLL) is the most common leukemia in adults, including elderly veterans. Some veterans have a history of Agent Orange exposure, which may potentially impact their presentation and disease course. We sought to assess initial patterns of cytogenetic aberrations among patients with CLL within the Minneapolis VA Health Care System (MVAHCS).
Methods: For this interim analysis, we evaluated a subset (30%) of a larger sample (6,756). We reviewed clinical data from 2,015 patients with CLL diagnosed from 2000 to 2013 and identified through the National VA Tumor Registry. Baseline demographics, including bone marrow/cytogenetic findings and treatment information were collected. The objective of this study was to assess initial cytogenetic patterns and variation of these parameters by age and Agent Orange exposure.
Results: Median age at diagnosis was 69 years (range, 37-96 years); 98% were male (1,979); Rai stage was 0 (n = 1,331, 66%), 1 (n = 317, 16%), 2 (n = 156, 8%), 3 (n = 91, 5%), 4 (n = 113, 6%). Cytogenetic data were available on 590 of 2,015 (29%) patients. Cytogenetic findings were normal in 258 (44%) patients. Abnormal cytogenetic findings in the remaining 330 cases included del 13q (28%); trisomy 12 (15%); del 11q (11%); del 17p (6%); and other abnor-malities (13%). Of 330 patients with noted abnormalities, 191 (58%) had 1 abnormality; 60 (18%) had 2; and 79 (24%) had > 2 abnormalities. Out of 2,015 patients, 283 (14%) had a reported exposure to Agent Orange; cytogenetic information was available in 130 (46%). Chromosomal abnormalities were detected in 80 of 130 cases (62%). The most frequent abnormality was del 13q (40%); trisomy 12 (19%); other abnormalities (18%); and del 11q (17%). Of the 80 pa-tients with noted abnormalities, 44 (55%) had 1 abnormality;14 (18%) had 2; and 22 (28%) had > 2 abnormalities.
Conclusions: Cytogenetic abnormalities in CLL play an important role in predicting disease progression and survival. These abnormalities paired with Agent Orange exposure have yet to be explored. Utilization of the National VA Tumor Registry data will allow the opportunity to examine the impact, if any, of Agent Orange exposure on the presentation and disease course of veterans with CLL. Updated cytogenetic findings will be presented at the AVAHO annual meeting.
Prevalence of Undiagnosed Diabetes in US
Diabetes affects up to 14 percent of the U.S. population - an increase from nearly 10 percent in the early 1990s - yet over a third of cases still go undiagnosed, according to a new analysis.
Screening seems to be catching more cases, accounting for the general rise over two decades, the study authors say, but mainly whites have benefited; for Hispanic and Asian people in particular, more than half of cases go undetected.
"We need to better educate people on the risk factors for diabetes - including older age, family history and obesity - and improve screening for those at high risk," lead study author Andy Menke, an epidemiologist at Social and Scientific Systems in Silver Spring, Maryland, said by email.
Globally, about one in nine adults has diagnosed diabetes, and the disease will be the seventh leading cause of death by 2030, according to the World Health Organization.
Most of these people have Type 2, or adult-onset, diabetes, which happens when the body can't properly use or make enough of the hormone insulin to convert blood sugar into energy. Left untreated, diabetes can lead to nerve damage, amputations, blindness, heart disease and strokes.
Average blood sugar levels over the course of several months can be estimated by measuring changes to the hemoglobin molecule in red blood cells. The hemoglobin A1c test measures the percentage of hemoglobin - the protein in red blood cells that
carries oxygen - that is coated with sugar, with readings of 6.5 percent or above signaling diabetes.
People with A1c levels between 5.7 percent and 6.4 percent aren't diabetic, but because this is considered elevated it is sometimes called "pre-diabetes" and considered a risk factor for going on to develop full-blown diabetes.
Menke and colleagues estimated the prevalence of diabetes and pre-diabetes using data from the National Health and Nutrition Examination Survey (NHANES) collected on 2,781 adults in 2011 to 2012 and an additional 23,634 adults from 1988 to 2010.
While the prevalence of diabetes increased over time in the overall population, gains were more pronounced among racial and ethnic minorities, the study found.
About 11 percent of white people have diabetes, the researchers calculated, compared with 22 percent of non-Hispanic black participants, 21 percent of Asians and 23 percent of Hispanics.
Among Asians, 51 percent of those with diabetes were unaware of it, and the same was true for 49 percent of Hispanic people with the condition.
An additional 38 percent of adults fell into the pre-diabetes category. Added to the prevalence of diabetes, that means more than half of the U.S. population has diabetes or is at increased risk for it, the authors point out.
The good news, however, is fewer people are undiagnosed than in the past, Dr. William Herman and Dr. Amy Rothberg of the University of Michigan in Ann Arbor note in commentary accompanying the study in JAMA.
In it, they note that the increase in diabetes prevalence between 1988 and 2012 seen in the study was due to an increase in diagnosed cases, and that overall undiagnosed cases fell from 40 percent in 1988-1994 to 31 percent in 2008-2012.
This "likely reflects increased awareness of the problem of undiagnosed diabetes and increased testing," they said by email.
The drop in undiagnosed cases, they added, may be due in part to the newer, simpler A1c test, which doesn't require fasting or any advance preparation.
It's also possible that new cases of diabetes are starting to fall for the first time in decades because more people are getting the message about lifestyle choices that can contribute to diabetes, noted Dr. David Nathan, director of the diabetes center at Massachusetts General Hospital in Boston and a professor at Harvard Medical School.
In particular, more patients now understand that being overweight or obese increases the risk for diabetes, Nathan, author of a separate report in JAMA on advances in diagnosis and treatment, said by email.
"Behavioral changes, including healthy eating and more activity can prevent, or at least ameliorate, the diabetes epidemic," Nathan said.
Diabetes affects up to 14 percent of the U.S. population - an increase from nearly 10 percent in the early 1990s - yet over a third of cases still go undiagnosed, according to a new analysis.
Screening seems to be catching more cases, accounting for the general rise over two decades, the study authors say, but mainly whites have benefited; for Hispanic and Asian people in particular, more than half of cases go undetected.
"We need to better educate people on the risk factors for diabetes - including older age, family history and obesity - and improve screening for those at high risk," lead study author Andy Menke, an epidemiologist at Social and Scientific Systems in Silver Spring, Maryland, said by email.
Globally, about one in nine adults has diagnosed diabetes, and the disease will be the seventh leading cause of death by 2030, according to the World Health Organization.
Most of these people have Type 2, or adult-onset, diabetes, which happens when the body can't properly use or make enough of the hormone insulin to convert blood sugar into energy. Left untreated, diabetes can lead to nerve damage, amputations, blindness, heart disease and strokes.
Average blood sugar levels over the course of several months can be estimated by measuring changes to the hemoglobin molecule in red blood cells. The hemoglobin A1c test measures the percentage of hemoglobin - the protein in red blood cells that
carries oxygen - that is coated with sugar, with readings of 6.5 percent or above signaling diabetes.
People with A1c levels between 5.7 percent and 6.4 percent aren't diabetic, but because this is considered elevated it is sometimes called "pre-diabetes" and considered a risk factor for going on to develop full-blown diabetes.
Menke and colleagues estimated the prevalence of diabetes and pre-diabetes using data from the National Health and Nutrition Examination Survey (NHANES) collected on 2,781 adults in 2011 to 2012 and an additional 23,634 adults from 1988 to 2010.
While the prevalence of diabetes increased over time in the overall population, gains were more pronounced among racial and ethnic minorities, the study found.
About 11 percent of white people have diabetes, the researchers calculated, compared with 22 percent of non-Hispanic black participants, 21 percent of Asians and 23 percent of Hispanics.
Among Asians, 51 percent of those with diabetes were unaware of it, and the same was true for 49 percent of Hispanic people with the condition.
An additional 38 percent of adults fell into the pre-diabetes category. Added to the prevalence of diabetes, that means more than half of the U.S. population has diabetes or is at increased risk for it, the authors point out.
The good news, however, is fewer people are undiagnosed than in the past, Dr. William Herman and Dr. Amy Rothberg of the University of Michigan in Ann Arbor note in commentary accompanying the study in JAMA.
In it, they note that the increase in diabetes prevalence between 1988 and 2012 seen in the study was due to an increase in diagnosed cases, and that overall undiagnosed cases fell from 40 percent in 1988-1994 to 31 percent in 2008-2012.
This "likely reflects increased awareness of the problem of undiagnosed diabetes and increased testing," they said by email.
The drop in undiagnosed cases, they added, may be due in part to the newer, simpler A1c test, which doesn't require fasting or any advance preparation.
It's also possible that new cases of diabetes are starting to fall for the first time in decades because more people are getting the message about lifestyle choices that can contribute to diabetes, noted Dr. David Nathan, director of the diabetes center at Massachusetts General Hospital in Boston and a professor at Harvard Medical School.
In particular, more patients now understand that being overweight or obese increases the risk for diabetes, Nathan, author of a separate report in JAMA on advances in diagnosis and treatment, said by email.
"Behavioral changes, including healthy eating and more activity can prevent, or at least ameliorate, the diabetes epidemic," Nathan said.
Diabetes affects up to 14 percent of the U.S. population - an increase from nearly 10 percent in the early 1990s - yet over a third of cases still go undiagnosed, according to a new analysis.
Screening seems to be catching more cases, accounting for the general rise over two decades, the study authors say, but mainly whites have benefited; for Hispanic and Asian people in particular, more than half of cases go undetected.
"We need to better educate people on the risk factors for diabetes - including older age, family history and obesity - and improve screening for those at high risk," lead study author Andy Menke, an epidemiologist at Social and Scientific Systems in Silver Spring, Maryland, said by email.
Globally, about one in nine adults has diagnosed diabetes, and the disease will be the seventh leading cause of death by 2030, according to the World Health Organization.
Most of these people have Type 2, or adult-onset, diabetes, which happens when the body can't properly use or make enough of the hormone insulin to convert blood sugar into energy. Left untreated, diabetes can lead to nerve damage, amputations, blindness, heart disease and strokes.
Average blood sugar levels over the course of several months can be estimated by measuring changes to the hemoglobin molecule in red blood cells. The hemoglobin A1c test measures the percentage of hemoglobin - the protein in red blood cells that
carries oxygen - that is coated with sugar, with readings of 6.5 percent or above signaling diabetes.
People with A1c levels between 5.7 percent and 6.4 percent aren't diabetic, but because this is considered elevated it is sometimes called "pre-diabetes" and considered a risk factor for going on to develop full-blown diabetes.
Menke and colleagues estimated the prevalence of diabetes and pre-diabetes using data from the National Health and Nutrition Examination Survey (NHANES) collected on 2,781 adults in 2011 to 2012 and an additional 23,634 adults from 1988 to 2010.
While the prevalence of diabetes increased over time in the overall population, gains were more pronounced among racial and ethnic minorities, the study found.
About 11 percent of white people have diabetes, the researchers calculated, compared with 22 percent of non-Hispanic black participants, 21 percent of Asians and 23 percent of Hispanics.
Among Asians, 51 percent of those with diabetes were unaware of it, and the same was true for 49 percent of Hispanic people with the condition.
An additional 38 percent of adults fell into the pre-diabetes category. Added to the prevalence of diabetes, that means more than half of the U.S. population has diabetes or is at increased risk for it, the authors point out.
The good news, however, is fewer people are undiagnosed than in the past, Dr. William Herman and Dr. Amy Rothberg of the University of Michigan in Ann Arbor note in commentary accompanying the study in JAMA.
In it, they note that the increase in diabetes prevalence between 1988 and 2012 seen in the study was due to an increase in diagnosed cases, and that overall undiagnosed cases fell from 40 percent in 1988-1994 to 31 percent in 2008-2012.
This "likely reflects increased awareness of the problem of undiagnosed diabetes and increased testing," they said by email.
The drop in undiagnosed cases, they added, may be due in part to the newer, simpler A1c test, which doesn't require fasting or any advance preparation.
It's also possible that new cases of diabetes are starting to fall for the first time in decades because more people are getting the message about lifestyle choices that can contribute to diabetes, noted Dr. David Nathan, director of the diabetes center at Massachusetts General Hospital in Boston and a professor at Harvard Medical School.
In particular, more patients now understand that being overweight or obese increases the risk for diabetes, Nathan, author of a separate report in JAMA on advances in diagnosis and treatment, said by email.
"Behavioral changes, including healthy eating and more activity can prevent, or at least ameliorate, the diabetes epidemic," Nathan said.
Respiratory problems make adenotonsillectomy recovery worse for kids
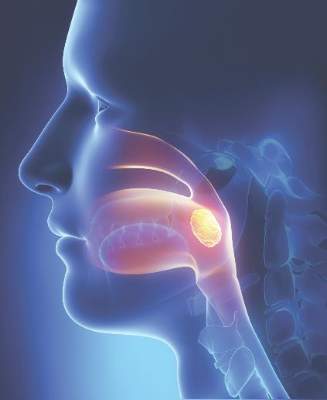
Respiratory compromise and secondary hemorrhage were the most common early side effects in children who had adenotonsillectomies; children with obstructive sleep apnea (OSA) have nearly five times more respiratory complications after surgery than children without OSA, a multistudy review concluded.
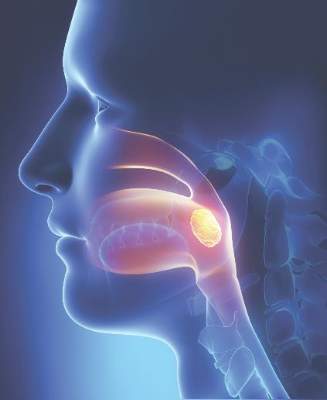
Graziela De Luca Canto, Ph.D., of the Federal University of Santa Catarina, Brazil, and her associates performed a data review by identifying 1,254 different citations found via electronic database searches; after eliminations, only 23 studies were included in the final analysis. Although children with OSA have nearly five times more respiratory complications after adenotonsillectomy than their peers, (odds ratio, 4.90), they are less likely to have postoperative bleeding, compared with children without OSA (OR, 0.41). Among both groups, the most frequent complication was respiratory compromise (9.4%), followed by secondary hemorrhage (2.6%).
Because children with OSA are more likely to require supplemental oxygen, oral or nasal airway insertion, or assisted ventilation in the immediate postoperative period than their peers, the authors suggested that anesthesiologists would be wise to screen patients for snoring, airway dysfunction, and other airway anatomic disorders before performing surgery.
“Children with OSA are clearly at higher anesthetic risk than are patients with normal upper airway function. … Despite the pressure to reduce costs, both surgeons and anesthesiologists should improve screening procedures, perhaps develop alternate surgical approaches, to decrease the risks,” the investigators wrote.
Read the full article in Pediatrics 2015 (doi: 10.1542/peds.2015-1283).
Respiratory compromise and secondary hemorrhage were the most common early side effects in children who had adenotonsillectomies; children with obstructive sleep apnea (OSA) have nearly five times more respiratory complications after surgery than children without OSA, a multistudy review concluded.
Graziela De Luca Canto, Ph.D., of the Federal University of Santa Catarina, Brazil, and her associates performed a data review by identifying 1,254 different citations found via electronic database searches; after eliminations, only 23 studies were included in the final analysis. Although children with OSA have nearly five times more respiratory complications after adenotonsillectomy than their peers, (odds ratio, 4.90), they are less likely to have postoperative bleeding, compared with children without OSA (OR, 0.41). Among both groups, the most frequent complication was respiratory compromise (9.4%), followed by secondary hemorrhage (2.6%).
Because children with OSA are more likely to require supplemental oxygen, oral or nasal airway insertion, or assisted ventilation in the immediate postoperative period than their peers, the authors suggested that anesthesiologists would be wise to screen patients for snoring, airway dysfunction, and other airway anatomic disorders before performing surgery.
“Children with OSA are clearly at higher anesthetic risk than are patients with normal upper airway function. … Despite the pressure to reduce costs, both surgeons and anesthesiologists should improve screening procedures, perhaps develop alternate surgical approaches, to decrease the risks,” the investigators wrote.
Read the full article in Pediatrics 2015 (doi: 10.1542/peds.2015-1283).
Respiratory compromise and secondary hemorrhage were the most common early side effects in children who had adenotonsillectomies; children with obstructive sleep apnea (OSA) have nearly five times more respiratory complications after surgery than children without OSA, a multistudy review concluded.
Graziela De Luca Canto, Ph.D., of the Federal University of Santa Catarina, Brazil, and her associates performed a data review by identifying 1,254 different citations found via electronic database searches; after eliminations, only 23 studies were included in the final analysis. Although children with OSA have nearly five times more respiratory complications after adenotonsillectomy than their peers, (odds ratio, 4.90), they are less likely to have postoperative bleeding, compared with children without OSA (OR, 0.41). Among both groups, the most frequent complication was respiratory compromise (9.4%), followed by secondary hemorrhage (2.6%).
Because children with OSA are more likely to require supplemental oxygen, oral or nasal airway insertion, or assisted ventilation in the immediate postoperative period than their peers, the authors suggested that anesthesiologists would be wise to screen patients for snoring, airway dysfunction, and other airway anatomic disorders before performing surgery.
“Children with OSA are clearly at higher anesthetic risk than are patients with normal upper airway function. … Despite the pressure to reduce costs, both surgeons and anesthesiologists should improve screening procedures, perhaps develop alternate surgical approaches, to decrease the risks,” the investigators wrote.
Read the full article in Pediatrics 2015 (doi: 10.1542/peds.2015-1283).
FROM PEDIATRICS
Reducing SCD patients’ wait time for pain meds

Photo courtesy of St. Jude
Children’s Research Hospital
A quality improvement initiative may help reduce the amount of time pediatric patients with sickle cell disease (SCD) wait for pain medication when visiting the emergency department (ED) for a vaso-occlusive episode (VOE).
In a single-center study, the initiative cut patients’ average wait time from triage to the first dose of pain medication by more than 50%—from 56 minutes to 23 minutes.
The researchers described this study in Pediatrics.
The National Heart, Lung, and Blood Institute recommends that a pediatric SCD patient experiencing a VOE be triaged and treated as quickly as possible in the ED. However, previous US studies have indicated that patients often wait, on average, between 65 and 90 minutes for their first dose of pain medication.
“When a child with sickle cell disease comes to the emergency room with pain from a VOE, they likely have been in tremendous pain for hours,” said study author Patricia Kavanagh, MD, of Boston Medical Center (BMC) in Massachusetts.
“The goal of this initiative was to treat the pain episode as quickly and aggressively as possible so that these children could return to their usual activities, including school and time with family and friends.”
Implementing the initiative
From September 2010 to April 2014, a team at BMC implemented the following interventions in the pediatric ED:
- Using a standardized, time-specific protocol that guides care when the patient is in the ED
- Using intranasal fentanyl as a first-line pain medication, as placing intravenous lines (IVs) can be difficult in children with SCD
- Using an online calculator to determine appropriate pain medication doses in line with what is used nationally for children in the ED
- Providing education on this work to emergency providers and families.
The team implemented these interventions in phases. From September 2010 to May 2011 (baseline), they collected data on the timing of first and subsequent pain medications for children with SCD who presented to the ED with VOEs.
From May to November 2011 (phase 1), the team introduced intranasal fentanyl as the first-line parenteral opioid.
From December 2011 to November 2012 (phase 2), the goal was to streamline VOE care from triage to disposition decision. The team revised the VOE algorithm to recommend 2 doses of intranasal fentanyl, 2 doses of IV opioids, and then a disposition decision. Then, they introduced the pain medication calculator.
From December 2012 to April 2014 (phase 3), the team assessed the sustainability of the interventions from phase 2. The team also revised the VOE algorithm in May 2013 to initiate patient-controlled analgesics after the first dose of IV opioid for patients with severe pain.
Results
The team observed a reduction in the average time from triage to the first dose of a pain medication—either through the nose or IV—from 56 minutes at baseline to 23 minutes in phase 3. The time to the second IV pain medication dose decreased as well—from 106 minutes to 83 minutes.
There was also a reduction in the time it took for the physician to determine whether the patient would be admitted—from 163 minutes to 109 minutes—or discharged—from 271 minutes to 178 minutes.
In addition, patients who were admitted were given patient-controlled analgesics to control their pain, and the time to its initiation decreased from 216 minutes to 141 minutes.
“While future studies are necessary to determine if these results can be replicated at other hospitals, our data indicates that these initiatives could have a tremendous impact on care for kids with SCD across the country,” said James Moses, MD, of BMC. 
Photo courtesy of St. Jude
Children’s Research Hospital
A quality improvement initiative may help reduce the amount of time pediatric patients with sickle cell disease (SCD) wait for pain medication when visiting the emergency department (ED) for a vaso-occlusive episode (VOE).
In a single-center study, the initiative cut patients’ average wait time from triage to the first dose of pain medication by more than 50%—from 56 minutes to 23 minutes.
The researchers described this study in Pediatrics.
The National Heart, Lung, and Blood Institute recommends that a pediatric SCD patient experiencing a VOE be triaged and treated as quickly as possible in the ED. However, previous US studies have indicated that patients often wait, on average, between 65 and 90 minutes for their first dose of pain medication.
“When a child with sickle cell disease comes to the emergency room with pain from a VOE, they likely have been in tremendous pain for hours,” said study author Patricia Kavanagh, MD, of Boston Medical Center (BMC) in Massachusetts.
“The goal of this initiative was to treat the pain episode as quickly and aggressively as possible so that these children could return to their usual activities, including school and time with family and friends.”
Implementing the initiative
From September 2010 to April 2014, a team at BMC implemented the following interventions in the pediatric ED:
- Using a standardized, time-specific protocol that guides care when the patient is in the ED
- Using intranasal fentanyl as a first-line pain medication, as placing intravenous lines (IVs) can be difficult in children with SCD
- Using an online calculator to determine appropriate pain medication doses in line with what is used nationally for children in the ED
- Providing education on this work to emergency providers and families.
The team implemented these interventions in phases. From September 2010 to May 2011 (baseline), they collected data on the timing of first and subsequent pain medications for children with SCD who presented to the ED with VOEs.
From May to November 2011 (phase 1), the team introduced intranasal fentanyl as the first-line parenteral opioid.
From December 2011 to November 2012 (phase 2), the goal was to streamline VOE care from triage to disposition decision. The team revised the VOE algorithm to recommend 2 doses of intranasal fentanyl, 2 doses of IV opioids, and then a disposition decision. Then, they introduced the pain medication calculator.
From December 2012 to April 2014 (phase 3), the team assessed the sustainability of the interventions from phase 2. The team also revised the VOE algorithm in May 2013 to initiate patient-controlled analgesics after the first dose of IV opioid for patients with severe pain.
Results
The team observed a reduction in the average time from triage to the first dose of a pain medication—either through the nose or IV—from 56 minutes at baseline to 23 minutes in phase 3. The time to the second IV pain medication dose decreased as well—from 106 minutes to 83 minutes.
There was also a reduction in the time it took for the physician to determine whether the patient would be admitted—from 163 minutes to 109 minutes—or discharged—from 271 minutes to 178 minutes.
In addition, patients who were admitted were given patient-controlled analgesics to control their pain, and the time to its initiation decreased from 216 minutes to 141 minutes.
“While future studies are necessary to determine if these results can be replicated at other hospitals, our data indicates that these initiatives could have a tremendous impact on care for kids with SCD across the country,” said James Moses, MD, of BMC.
Photo courtesy of St. Jude
Children’s Research Hospital
A quality improvement initiative may help reduce the amount of time pediatric patients with sickle cell disease (SCD) wait for pain medication when visiting the emergency department (ED) for a vaso-occlusive episode (VOE).
In a single-center study, the initiative cut patients’ average wait time from triage to the first dose of pain medication by more than 50%—from 56 minutes to 23 minutes.
The researchers described this study in Pediatrics.
The National Heart, Lung, and Blood Institute recommends that a pediatric SCD patient experiencing a VOE be triaged and treated as quickly as possible in the ED. However, previous US studies have indicated that patients often wait, on average, between 65 and 90 minutes for their first dose of pain medication.
“When a child with sickle cell disease comes to the emergency room with pain from a VOE, they likely have been in tremendous pain for hours,” said study author Patricia Kavanagh, MD, of Boston Medical Center (BMC) in Massachusetts.
“The goal of this initiative was to treat the pain episode as quickly and aggressively as possible so that these children could return to their usual activities, including school and time with family and friends.”
Implementing the initiative
From September 2010 to April 2014, a team at BMC implemented the following interventions in the pediatric ED:
- Using a standardized, time-specific protocol that guides care when the patient is in the ED
- Using intranasal fentanyl as a first-line pain medication, as placing intravenous lines (IVs) can be difficult in children with SCD
- Using an online calculator to determine appropriate pain medication doses in line with what is used nationally for children in the ED
- Providing education on this work to emergency providers and families.
The team implemented these interventions in phases. From September 2010 to May 2011 (baseline), they collected data on the timing of first and subsequent pain medications for children with SCD who presented to the ED with VOEs.
From May to November 2011 (phase 1), the team introduced intranasal fentanyl as the first-line parenteral opioid.
From December 2011 to November 2012 (phase 2), the goal was to streamline VOE care from triage to disposition decision. The team revised the VOE algorithm to recommend 2 doses of intranasal fentanyl, 2 doses of IV opioids, and then a disposition decision. Then, they introduced the pain medication calculator.
From December 2012 to April 2014 (phase 3), the team assessed the sustainability of the interventions from phase 2. The team also revised the VOE algorithm in May 2013 to initiate patient-controlled analgesics after the first dose of IV opioid for patients with severe pain.
Results
The team observed a reduction in the average time from triage to the first dose of a pain medication—either through the nose or IV—from 56 minutes at baseline to 23 minutes in phase 3. The time to the second IV pain medication dose decreased as well—from 106 minutes to 83 minutes.
There was also a reduction in the time it took for the physician to determine whether the patient would be admitted—from 163 minutes to 109 minutes—or discharged—from 271 minutes to 178 minutes.
In addition, patients who were admitted were given patient-controlled analgesics to control their pain, and the time to its initiation decreased from 216 minutes to 141 minutes.
“While future studies are necessary to determine if these results can be replicated at other hospitals, our data indicates that these initiatives could have a tremendous impact on care for kids with SCD across the country,” said James Moses, MD, of BMC.
Gene therapy granted fast track designation for hemophilia B
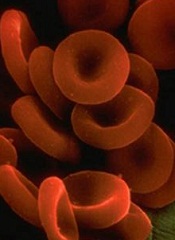
The US Food and Drug Administration (FDA) has granted fast track designation to a gene therapy product being developed to treat hemophilia B.
The product, DTX101, is designed to deliver factor IX gene expression in a durable fashion to prevent the long-term complications of hemophilia B.
Preclinical studies have indicated that DTX101 has the potential to be a well-tolerated, effective therapy for hemophilia B, according to Dimension Therapeutics, Inc., the company developing DTX101.
The company said it expects to initiate a multicenter, phase 1/2 study to evaluate DTX101 in adults with moderate/severe to severe hemophilia B by the end of this year.
DTX101 also has orphan designation from the FDA.
About fast track designation
The FDA’s fast track program is designed to facilitate and expedite the development and review of new drugs intended to treat serious or life-threatening conditions and address unmet medical need.
Through the fast track program, a product may be eligible for priority review. In addition, the company developing the drug may be allowed to submit sections of the biologic license application or new drug application on a rolling basis as data become available.
Fast track designation also provides the company with opportunities for more frequent meetings with the FDA to discuss the drug’s development plan and ensure collection of the appropriate data needed to support drug approval. And the designation allows for more frequent written communication from the FDA about things such as the design of proposed clinical trials and the use of biomarkers.
The US Food and Drug Administration (FDA) has granted fast track designation to a gene therapy product being developed to treat hemophilia B.
The product, DTX101, is designed to deliver factor IX gene expression in a durable fashion to prevent the long-term complications of hemophilia B.
Preclinical studies have indicated that DTX101 has the potential to be a well-tolerated, effective therapy for hemophilia B, according to Dimension Therapeutics, Inc., the company developing DTX101.
The company said it expects to initiate a multicenter, phase 1/2 study to evaluate DTX101 in adults with moderate/severe to severe hemophilia B by the end of this year.
DTX101 also has orphan designation from the FDA.
About fast track designation
The FDA’s fast track program is designed to facilitate and expedite the development and review of new drugs intended to treat serious or life-threatening conditions and address unmet medical need.
Through the fast track program, a product may be eligible for priority review. In addition, the company developing the drug may be allowed to submit sections of the biologic license application or new drug application on a rolling basis as data become available.
Fast track designation also provides the company with opportunities for more frequent meetings with the FDA to discuss the drug’s development plan and ensure collection of the appropriate data needed to support drug approval. And the designation allows for more frequent written communication from the FDA about things such as the design of proposed clinical trials and the use of biomarkers.
The US Food and Drug Administration (FDA) has granted fast track designation to a gene therapy product being developed to treat hemophilia B.
The product, DTX101, is designed to deliver factor IX gene expression in a durable fashion to prevent the long-term complications of hemophilia B.
Preclinical studies have indicated that DTX101 has the potential to be a well-tolerated, effective therapy for hemophilia B, according to Dimension Therapeutics, Inc., the company developing DTX101.
The company said it expects to initiate a multicenter, phase 1/2 study to evaluate DTX101 in adults with moderate/severe to severe hemophilia B by the end of this year.
DTX101 also has orphan designation from the FDA.
About fast track designation
The FDA’s fast track program is designed to facilitate and expedite the development and review of new drugs intended to treat serious or life-threatening conditions and address unmet medical need.
Through the fast track program, a product may be eligible for priority review. In addition, the company developing the drug may be allowed to submit sections of the biologic license application or new drug application on a rolling basis as data become available.
Fast track designation also provides the company with opportunities for more frequent meetings with the FDA to discuss the drug’s development plan and ensure collection of the appropriate data needed to support drug approval. And the designation allows for more frequent written communication from the FDA about things such as the design of proposed clinical trials and the use of biomarkers.
Using Social Media as a Hospital QI Tool
Patient experience has become a major component of the Center for Medicare and Medicaid Services Value‐Based Purchasing initiative.[1] Hospitals have therefore focused quality improvement (QI) efforts on this area.[2] Hospital performance in the realm of patient experience is generally determined using systematic surveys with closed‐ended questions, but patient‐generated narrative feedback can help hospitals identify the components of care that contribute to patient satisfaction and or are in need of improvement.[3] Online narrative responses posted by patients on rating websites or social media have been criticized because they may not be representative of the population,[4] but they also have some advantages.[5] Any patient may leave a comment, not just those who are selected for a survey. Patients may also experience benefits through the act of sharing their story with others. Moreover, most US hospitals use some form of social media,[6] which they can theoretically use to self‐collect narrative data online. To realize the full potential of patient‐generated online narratives, we need a clearer understanding of the best practices for collecting and using these narratives. We therefore solicited patient feedback on the Facebook page of a large tertiary academic medical center to determine whether it is feasible to use social media platforms for learning about and improving hospital quality.
METHODS
Baystate Medical Center (BMC) is a tertiary care medical center in western Massachusetts. We identified key BMC stakeholders in the areas of QI and public affairs. Noting that patients have expressed interest in leaving comments via social media,[7] the group opted to perform a pilot study to obtain patient narratives via a Facebook prompt (Facebook is a social media site used by an estimated 58% of US adults[8]). The BMC public affairs department delivered a press release to the local media describing a 3‐week period during which patients were invited to leave narrative feedback on the BMC Facebook wall. The BMC Institutional Review Board deemed that this study did not constitute human subjects research.
During March 2014 (March 10, 2014March 24, 2014), we posted (once a week) an open‐ended prompt on BMC's Facebook wall. The prompt was designed to elicit novel descriptions of patient experience that could help to drive QI. It read: We want to hear about your experiences. In the comment section below, please tell us what we do well and how we can improve your care. Because of concerns about the potential reputational risks of allowing open feedback on a public social media page, the prompt also reminded patients of the social media ground rules: there should be no mention of specific physicians, nurses, or other caregivers by name (for liability reasons); and patients should not include details about their medical history (for privacy reasons).
We collected all posts to preserve comments and used directed qualitative content analysis to examine them.[9] Two research team members[3, 10, 11] independently coded the responses. Starting with an a priori codebook that was developed during a previous study,[3] they amended the codebook through an iterative process to incorporate new concepts. After independently coding all blocks of text, the coders reviewed their coding selections and resolved discrepancies through discussion. We then performed second‐level coding, in which codes were organized into major pertinent themes. We reviewed the coded text after applying secondary codes in order to check for accuracy of coding and theme assignment as well as completeness of second‐level coding. We calculated percent agreement, defined as both raters scoring a block of text with the same code divided by total number of codes. We also calculated the Spearman correlation between the 2 reviewers. We used descriptive statistics to assess the frequency of select codes and themes (see Supporting Information, Appendix 1 and Appendix 2, in the online version of this article).[9, 12, 13]
RESULTS
Over a 3‐week study period, 47 comments were submitted by 37 respondents. This yielded 148 codable statements (Table 1). Despite limited information on respondents, we ascertained from Facebook that 32 (86%) were women and 5 (14%) were men.
| Theme | Total Respondents, N (%) | % Positive | Positive Quotation | % Negative | Negative Quotation |
|---|---|---|---|---|---|
| |||||
| Staff | 17 (46) | 45% | The nurses in the pediatric unit, as well as the doctors in radiology and x‐ray department were AMAZING! | 55% | My 24‐year‐old daughter had to go for 5 days of IV treatmentwhile getting her infusion there was a fire alarm. She has a video showing the flashing of the light and the sound of the alarm and the closing of doors and NOT A SINGLE staff member to be found. Her infusions take about 2 hours. They set it and forget it. Luckily there wasn't a fire and someone did finally come to disconnect her. |
| Had a fabulous experience with Wesson women's this week! Had a C section and 3‐day admission. All staff from preoperative to inpatient were so helpful and really anticipated my needs before I could even ask for things. | My mother was hospitalized for at least 3 weeks right after the cardiovascular center openedwhen she went into cardiac arrest and in acute care and the step unit the care was great, very attentive nurses and doctors. When she was starting to recover and moved upstairs, downhill it went. She'd ring for assistance because she wanted to walk to the bathrooms and more times she was left to her own devices because no one would respond. | ||||
| Facility | 9 (24) | 25% | New buildings are beautiful and the new signs are way better. | 75% | The parking situation was disappointing and the waiting room was also very dirty. |
| I really like the individual pods in the ER. | I could have used a single room as my roommate was very annoying and demanding. | ||||
| Departments | 22 (60) | 44% | The NICU was great when my son was in there. The children's unit was great with my daughter and respected my needs. | 56% | Revamp maternity; it needs it desperately. |
| Labor and delivery was a great place. | Love Baystate but hate the ER. | ||||
| Technical aspects of care (eg, errors) | 9 (24) | 0 | 100% | Day 2 of my 24 year old getting her 2‐hour IV infusion....she was set up with her IV. When checked 2 hours later, the staff member was very upset to find that only the saline had run. She never opened the medication clamp. So now they gave her the medication in 1 hour instead of 2. | |
| If I had 1 suggestion it would be to re‐evaluate patient comfort when patients are waiting to be admitted. | |||||
From coded text, several broad themes were identified (see Table 1 for representative quotes): (1) comments about staff (17/37 respondents, 45.9%). These included positive descriptions of efficiency, caring behavior, good training, and good communication, whereas negative comments included descriptions of unfriendliness, apparent lack of caring, inattentiveness, poor training, unprofessional behavior, and poor communication; (2) comments about specific departments (22/37, 59.5%); (3) comments on technical aspects of care, including perceived errors, incorrect diagnoses, and inattention to pain control (9/37, 24.3%); and (4) comments describing the hospital physical plant, parking, and amenities (9/37, 24.3%). There were a few miscellaneous comments that did not fit into these broad themes, such as expressions of gratitude for our solicitation of narratives. Percent agreement between coders was 80% and Spearman's Rho was 0.82 (p0.001).
A small number (n=3) of respondents repeatedly made comments over the 3‐week period, accounting for 30% (45/148) of codes. These repetitive commenters tended to dominate the Facebook conversation, at times describing the same experience more than once.
DISCUSSION
In this study evaluating the potential utility of social media as a hospital QI tool, several broad themes emerged. From these themes, we identified several areas that could be deemed as QI targets, including: training staff to be more responsive and sensitive to patients needs and concerns, improving patient and visitor parking, and reducing emergency department waiting times. However, the insight gained from solicited Facebook comments was similar to feedback gained from more traditional approaches of soliciting patient perspectives on care, such as patient experience surveys.[14]
Our findings should be viewed in the context of prior work focused on patient narratives in healthcare. Greaves et al. used sentiment analysis to describe the content of nearly 200,000 tweets (comments posted on the social networking website Twitter) sent to National Health Service (NHS) hospitals.[15] Themes were similar to those found in our study: (1) interaction with staff, (2) environment and facilities, and (3) issues of access and timeliness of service. Notably, these themes mirrored prior work examining narratives at NHS hospitals[3] and were similar to domains of commonly used surveys of patient experience.[14] The authors noted that there were issues with the signal to noise ratio (only about 10% of tweets were about quality) and the enforced brevity of Twitter (tweets must be 140 characters or less). These limitations suggest that using Twitter to identify QI targets would be difficult.
In contrast to Greaves et al., we chose to solicit feedback on our hospital's Facebook page. Facebook does not have Twitter's enforced brevity, allowing for more detailed narratives. In addition, we did not encounter the signal‐to‐noise problem, because our prompt was designed to request feedback that was relevant to recent experiences of care. However, a few respondents dominated the conversation, supporting the hypothesis that those most likely to comment may be the patients or families who have had the best or worst experiences. In the future, we will attempt to address this limitation and reduce the influence of repeat commenters by changing our prompt (eg, Please tell us about your experience, but please do not post descriptions of the same experience more than once.).
This pilot demonstrated some of the previously described benefits of online narratives.[5] First, there appears to be value in allowing patients to share their experiences and to read the experiences of others (as indicated in a few grateful patients comments). Second, soliciting online narratives offers a way for hospitals to demonstrate a commitment to transparency. Third, in contrast to closed‐ended survey questions, narrative comments help to identify why patients were satisfied or unsatisfied with their care. Although some surveys with closed‐ended questions also allow for narratives, these comments may or may not be carefully reviewed by the hospital. Using social media to solicit and respond to comments enhances existing methods for evaluating patient experience by engaging patients in a public space, which increases the likelihood that hospitals will attempt to improve care in response.
Notably, none of the identified areas for improvement could be considered novel QI targets for BMC. For example, our hospital has been very focused on training staff around patient experience, and emergency department wait times are the focus of a system‐wide improvement effort called Patient Progress.
This study has other limitations. We conducted this study over a 3‐week time period in a single center and on a single social media site whose members may not be representative of the overall patient population at BMC. Although we do not know how generalizable our findings are (in terms of identifying QI targets), we feel that we have demonstrated how using social media to collect data on patient experience is feasible and could be informative for other hospitals in other locations. It is possible that we did not allow the experiment to run long enough; a longer time or broader outreach (eg, a handout given to every discharged patient over a longer period) may be needed to allow patients adequate opportunity to comment. Of note, we did not specifically examine responses by time period, but it does seem, in post hoc analysis, that after 2 weeks of data collection we reached theoretical saturation with no new themes emerging in the third week (eg, third‐week comments included I heart your nurses. and Love Baystate but hate the ER.). More work is also needed that includes a broader range of social media platforms and more participating hospitals.
In conclusion, the opportunity to provide feedback on Facebook has the potential to engage and empower patients, and hospitals can use these online narratives to help to drive improvement efforts. Yet potential benefits must be weighed against reputational risks, a lack of representative respondents, and the paucity of novel QI targets obtained in this study.
Disclosures: Dr. Lagu is supported by the National Heart, Lung, and Blood Institute of the National Institutes of Health under award number K01HL114745. The authors report no conflicts of interest.
- Centers for Medicare 47(2):193–219.
- , , , , . A mixed‐methods analysis of patient reviews of hospital care in England: implications for public reporting of health care quality data in the United States. Jt Comm J Qual Patient Saf. 2013;39(1):7–15.
- , , , , , , , . Taking Patients' Narratives about Clinicians from Anecdote to Science. NEJM. 2015;373(7):675–679.
- , . Putting the public back in public reporting of health care quality. JAMA. 2010;304(15):1711–1712.
- , , , et al. Use of social media across US hospitals: descriptive analysis of adoption and utilization. J Med Internet Res. 2014;16(11):e264.
- , , , , , . Patient use of email, Facebook, and physician websites to communicate with physicians: a national online survey of retail pharmacy users [published online June 24, 2015]. J Gen Intern Med. doi:10.1007/s11606-015-3374-7.
- Pew Research Center. Social networking fact sheet. Available at: http://www.pewinternet.org/fact‐sheets/social‐networking‐fact‐sheet. Accessed March 4, 2015.
- , . Three approaches to qualitative content analysis. Qual Health Res. 2005;15(9):1277–1288.
- , , , . Patients’ evaluations of health care providers in the era of social networking: an analysis of physician‐rating websites. J Gen Intern Med. 2010;25(9):942–946.
- , , , , . Vaccine counseling: a content analysis of patient‐physician discussions regarding human papilloma virus vaccine. Vaccine. 2011;29(43):7343–7349.
- . Qualitative research methods. Int J Qual Health Care. 2002;14(4):329–336.
- , . Doing Qualitative Research. Vol 2. Thousand Oaks, CA: Sage Publications; 1999.
- , , , . Patients’ perception of hospital care in the United States. N Engl J Med. 2008;359(18):1921–1931.
- , , , et al. Tweets about hospital quality: a mixed methods study. BMJ Qual Saf. 2014;23(10):838–846.
Patient experience has become a major component of the Center for Medicare and Medicaid Services Value‐Based Purchasing initiative.[1] Hospitals have therefore focused quality improvement (QI) efforts on this area.[2] Hospital performance in the realm of patient experience is generally determined using systematic surveys with closed‐ended questions, but patient‐generated narrative feedback can help hospitals identify the components of care that contribute to patient satisfaction and or are in need of improvement.[3] Online narrative responses posted by patients on rating websites or social media have been criticized because they may not be representative of the population,[4] but they also have some advantages.[5] Any patient may leave a comment, not just those who are selected for a survey. Patients may also experience benefits through the act of sharing their story with others. Moreover, most US hospitals use some form of social media,[6] which they can theoretically use to self‐collect narrative data online. To realize the full potential of patient‐generated online narratives, we need a clearer understanding of the best practices for collecting and using these narratives. We therefore solicited patient feedback on the Facebook page of a large tertiary academic medical center to determine whether it is feasible to use social media platforms for learning about and improving hospital quality.
METHODS
Baystate Medical Center (BMC) is a tertiary care medical center in western Massachusetts. We identified key BMC stakeholders in the areas of QI and public affairs. Noting that patients have expressed interest in leaving comments via social media,[7] the group opted to perform a pilot study to obtain patient narratives via a Facebook prompt (Facebook is a social media site used by an estimated 58% of US adults[8]). The BMC public affairs department delivered a press release to the local media describing a 3‐week period during which patients were invited to leave narrative feedback on the BMC Facebook wall. The BMC Institutional Review Board deemed that this study did not constitute human subjects research.
During March 2014 (March 10, 2014March 24, 2014), we posted (once a week) an open‐ended prompt on BMC's Facebook wall. The prompt was designed to elicit novel descriptions of patient experience that could help to drive QI. It read: We want to hear about your experiences. In the comment section below, please tell us what we do well and how we can improve your care. Because of concerns about the potential reputational risks of allowing open feedback on a public social media page, the prompt also reminded patients of the social media ground rules: there should be no mention of specific physicians, nurses, or other caregivers by name (for liability reasons); and patients should not include details about their medical history (for privacy reasons).
We collected all posts to preserve comments and used directed qualitative content analysis to examine them.[9] Two research team members[3, 10, 11] independently coded the responses. Starting with an a priori codebook that was developed during a previous study,[3] they amended the codebook through an iterative process to incorporate new concepts. After independently coding all blocks of text, the coders reviewed their coding selections and resolved discrepancies through discussion. We then performed second‐level coding, in which codes were organized into major pertinent themes. We reviewed the coded text after applying secondary codes in order to check for accuracy of coding and theme assignment as well as completeness of second‐level coding. We calculated percent agreement, defined as both raters scoring a block of text with the same code divided by total number of codes. We also calculated the Spearman correlation between the 2 reviewers. We used descriptive statistics to assess the frequency of select codes and themes (see Supporting Information, Appendix 1 and Appendix 2, in the online version of this article).[9, 12, 13]
RESULTS
Over a 3‐week study period, 47 comments were submitted by 37 respondents. This yielded 148 codable statements (Table 1). Despite limited information on respondents, we ascertained from Facebook that 32 (86%) were women and 5 (14%) were men.
| Theme | Total Respondents, N (%) | % Positive | Positive Quotation | % Negative | Negative Quotation |
|---|---|---|---|---|---|
| |||||
| Staff | 17 (46) | 45% | The nurses in the pediatric unit, as well as the doctors in radiology and x‐ray department were AMAZING! | 55% | My 24‐year‐old daughter had to go for 5 days of IV treatmentwhile getting her infusion there was a fire alarm. She has a video showing the flashing of the light and the sound of the alarm and the closing of doors and NOT A SINGLE staff member to be found. Her infusions take about 2 hours. They set it and forget it. Luckily there wasn't a fire and someone did finally come to disconnect her. |
| Had a fabulous experience with Wesson women's this week! Had a C section and 3‐day admission. All staff from preoperative to inpatient were so helpful and really anticipated my needs before I could even ask for things. | My mother was hospitalized for at least 3 weeks right after the cardiovascular center openedwhen she went into cardiac arrest and in acute care and the step unit the care was great, very attentive nurses and doctors. When she was starting to recover and moved upstairs, downhill it went. She'd ring for assistance because she wanted to walk to the bathrooms and more times she was left to her own devices because no one would respond. | ||||
| Facility | 9 (24) | 25% | New buildings are beautiful and the new signs are way better. | 75% | The parking situation was disappointing and the waiting room was also very dirty. |
| I really like the individual pods in the ER. | I could have used a single room as my roommate was very annoying and demanding. | ||||
| Departments | 22 (60) | 44% | The NICU was great when my son was in there. The children's unit was great with my daughter and respected my needs. | 56% | Revamp maternity; it needs it desperately. |
| Labor and delivery was a great place. | Love Baystate but hate the ER. | ||||
| Technical aspects of care (eg, errors) | 9 (24) | 0 | 100% | Day 2 of my 24 year old getting her 2‐hour IV infusion....she was set up with her IV. When checked 2 hours later, the staff member was very upset to find that only the saline had run. She never opened the medication clamp. So now they gave her the medication in 1 hour instead of 2. | |
| If I had 1 suggestion it would be to re‐evaluate patient comfort when patients are waiting to be admitted. | |||||
From coded text, several broad themes were identified (see Table 1 for representative quotes): (1) comments about staff (17/37 respondents, 45.9%). These included positive descriptions of efficiency, caring behavior, good training, and good communication, whereas negative comments included descriptions of unfriendliness, apparent lack of caring, inattentiveness, poor training, unprofessional behavior, and poor communication; (2) comments about specific departments (22/37, 59.5%); (3) comments on technical aspects of care, including perceived errors, incorrect diagnoses, and inattention to pain control (9/37, 24.3%); and (4) comments describing the hospital physical plant, parking, and amenities (9/37, 24.3%). There were a few miscellaneous comments that did not fit into these broad themes, such as expressions of gratitude for our solicitation of narratives. Percent agreement between coders was 80% and Spearman's Rho was 0.82 (p0.001).
A small number (n=3) of respondents repeatedly made comments over the 3‐week period, accounting for 30% (45/148) of codes. These repetitive commenters tended to dominate the Facebook conversation, at times describing the same experience more than once.
DISCUSSION
In this study evaluating the potential utility of social media as a hospital QI tool, several broad themes emerged. From these themes, we identified several areas that could be deemed as QI targets, including: training staff to be more responsive and sensitive to patients needs and concerns, improving patient and visitor parking, and reducing emergency department waiting times. However, the insight gained from solicited Facebook comments was similar to feedback gained from more traditional approaches of soliciting patient perspectives on care, such as patient experience surveys.[14]
Our findings should be viewed in the context of prior work focused on patient narratives in healthcare. Greaves et al. used sentiment analysis to describe the content of nearly 200,000 tweets (comments posted on the social networking website Twitter) sent to National Health Service (NHS) hospitals.[15] Themes were similar to those found in our study: (1) interaction with staff, (2) environment and facilities, and (3) issues of access and timeliness of service. Notably, these themes mirrored prior work examining narratives at NHS hospitals[3] and were similar to domains of commonly used surveys of patient experience.[14] The authors noted that there were issues with the signal to noise ratio (only about 10% of tweets were about quality) and the enforced brevity of Twitter (tweets must be 140 characters or less). These limitations suggest that using Twitter to identify QI targets would be difficult.
In contrast to Greaves et al., we chose to solicit feedback on our hospital's Facebook page. Facebook does not have Twitter's enforced brevity, allowing for more detailed narratives. In addition, we did not encounter the signal‐to‐noise problem, because our prompt was designed to request feedback that was relevant to recent experiences of care. However, a few respondents dominated the conversation, supporting the hypothesis that those most likely to comment may be the patients or families who have had the best or worst experiences. In the future, we will attempt to address this limitation and reduce the influence of repeat commenters by changing our prompt (eg, Please tell us about your experience, but please do not post descriptions of the same experience more than once.).
This pilot demonstrated some of the previously described benefits of online narratives.[5] First, there appears to be value in allowing patients to share their experiences and to read the experiences of others (as indicated in a few grateful patients comments). Second, soliciting online narratives offers a way for hospitals to demonstrate a commitment to transparency. Third, in contrast to closed‐ended survey questions, narrative comments help to identify why patients were satisfied or unsatisfied with their care. Although some surveys with closed‐ended questions also allow for narratives, these comments may or may not be carefully reviewed by the hospital. Using social media to solicit and respond to comments enhances existing methods for evaluating patient experience by engaging patients in a public space, which increases the likelihood that hospitals will attempt to improve care in response.
Notably, none of the identified areas for improvement could be considered novel QI targets for BMC. For example, our hospital has been very focused on training staff around patient experience, and emergency department wait times are the focus of a system‐wide improvement effort called Patient Progress.
This study has other limitations. We conducted this study over a 3‐week time period in a single center and on a single social media site whose members may not be representative of the overall patient population at BMC. Although we do not know how generalizable our findings are (in terms of identifying QI targets), we feel that we have demonstrated how using social media to collect data on patient experience is feasible and could be informative for other hospitals in other locations. It is possible that we did not allow the experiment to run long enough; a longer time or broader outreach (eg, a handout given to every discharged patient over a longer period) may be needed to allow patients adequate opportunity to comment. Of note, we did not specifically examine responses by time period, but it does seem, in post hoc analysis, that after 2 weeks of data collection we reached theoretical saturation with no new themes emerging in the third week (eg, third‐week comments included I heart your nurses. and Love Baystate but hate the ER.). More work is also needed that includes a broader range of social media platforms and more participating hospitals.
In conclusion, the opportunity to provide feedback on Facebook has the potential to engage and empower patients, and hospitals can use these online narratives to help to drive improvement efforts. Yet potential benefits must be weighed against reputational risks, a lack of representative respondents, and the paucity of novel QI targets obtained in this study.
Disclosures: Dr. Lagu is supported by the National Heart, Lung, and Blood Institute of the National Institutes of Health under award number K01HL114745. The authors report no conflicts of interest.
Patient experience has become a major component of the Center for Medicare and Medicaid Services Value‐Based Purchasing initiative.[1] Hospitals have therefore focused quality improvement (QI) efforts on this area.[2] Hospital performance in the realm of patient experience is generally determined using systematic surveys with closed‐ended questions, but patient‐generated narrative feedback can help hospitals identify the components of care that contribute to patient satisfaction and or are in need of improvement.[3] Online narrative responses posted by patients on rating websites or social media have been criticized because they may not be representative of the population,[4] but they also have some advantages.[5] Any patient may leave a comment, not just those who are selected for a survey. Patients may also experience benefits through the act of sharing their story with others. Moreover, most US hospitals use some form of social media,[6] which they can theoretically use to self‐collect narrative data online. To realize the full potential of patient‐generated online narratives, we need a clearer understanding of the best practices for collecting and using these narratives. We therefore solicited patient feedback on the Facebook page of a large tertiary academic medical center to determine whether it is feasible to use social media platforms for learning about and improving hospital quality.
METHODS
Baystate Medical Center (BMC) is a tertiary care medical center in western Massachusetts. We identified key BMC stakeholders in the areas of QI and public affairs. Noting that patients have expressed interest in leaving comments via social media,[7] the group opted to perform a pilot study to obtain patient narratives via a Facebook prompt (Facebook is a social media site used by an estimated 58% of US adults[8]). The BMC public affairs department delivered a press release to the local media describing a 3‐week period during which patients were invited to leave narrative feedback on the BMC Facebook wall. The BMC Institutional Review Board deemed that this study did not constitute human subjects research.
During March 2014 (March 10, 2014March 24, 2014), we posted (once a week) an open‐ended prompt on BMC's Facebook wall. The prompt was designed to elicit novel descriptions of patient experience that could help to drive QI. It read: We want to hear about your experiences. In the comment section below, please tell us what we do well and how we can improve your care. Because of concerns about the potential reputational risks of allowing open feedback on a public social media page, the prompt also reminded patients of the social media ground rules: there should be no mention of specific physicians, nurses, or other caregivers by name (for liability reasons); and patients should not include details about their medical history (for privacy reasons).
We collected all posts to preserve comments and used directed qualitative content analysis to examine them.[9] Two research team members[3, 10, 11] independently coded the responses. Starting with an a priori codebook that was developed during a previous study,[3] they amended the codebook through an iterative process to incorporate new concepts. After independently coding all blocks of text, the coders reviewed their coding selections and resolved discrepancies through discussion. We then performed second‐level coding, in which codes were organized into major pertinent themes. We reviewed the coded text after applying secondary codes in order to check for accuracy of coding and theme assignment as well as completeness of second‐level coding. We calculated percent agreement, defined as both raters scoring a block of text with the same code divided by total number of codes. We also calculated the Spearman correlation between the 2 reviewers. We used descriptive statistics to assess the frequency of select codes and themes (see Supporting Information, Appendix 1 and Appendix 2, in the online version of this article).[9, 12, 13]
RESULTS
Over a 3‐week study period, 47 comments were submitted by 37 respondents. This yielded 148 codable statements (Table 1). Despite limited information on respondents, we ascertained from Facebook that 32 (86%) were women and 5 (14%) were men.
| Theme | Total Respondents, N (%) | % Positive | Positive Quotation | % Negative | Negative Quotation |
|---|---|---|---|---|---|
| |||||
| Staff | 17 (46) | 45% | The nurses in the pediatric unit, as well as the doctors in radiology and x‐ray department were AMAZING! | 55% | My 24‐year‐old daughter had to go for 5 days of IV treatmentwhile getting her infusion there was a fire alarm. She has a video showing the flashing of the light and the sound of the alarm and the closing of doors and NOT A SINGLE staff member to be found. Her infusions take about 2 hours. They set it and forget it. Luckily there wasn't a fire and someone did finally come to disconnect her. |
| Had a fabulous experience with Wesson women's this week! Had a C section and 3‐day admission. All staff from preoperative to inpatient were so helpful and really anticipated my needs before I could even ask for things. | My mother was hospitalized for at least 3 weeks right after the cardiovascular center openedwhen she went into cardiac arrest and in acute care and the step unit the care was great, very attentive nurses and doctors. When she was starting to recover and moved upstairs, downhill it went. She'd ring for assistance because she wanted to walk to the bathrooms and more times she was left to her own devices because no one would respond. | ||||
| Facility | 9 (24) | 25% | New buildings are beautiful and the new signs are way better. | 75% | The parking situation was disappointing and the waiting room was also very dirty. |
| I really like the individual pods in the ER. | I could have used a single room as my roommate was very annoying and demanding. | ||||
| Departments | 22 (60) | 44% | The NICU was great when my son was in there. The children's unit was great with my daughter and respected my needs. | 56% | Revamp maternity; it needs it desperately. |
| Labor and delivery was a great place. | Love Baystate but hate the ER. | ||||
| Technical aspects of care (eg, errors) | 9 (24) | 0 | 100% | Day 2 of my 24 year old getting her 2‐hour IV infusion....she was set up with her IV. When checked 2 hours later, the staff member was very upset to find that only the saline had run. She never opened the medication clamp. So now they gave her the medication in 1 hour instead of 2. | |
| If I had 1 suggestion it would be to re‐evaluate patient comfort when patients are waiting to be admitted. | |||||
From coded text, several broad themes were identified (see Table 1 for representative quotes): (1) comments about staff (17/37 respondents, 45.9%). These included positive descriptions of efficiency, caring behavior, good training, and good communication, whereas negative comments included descriptions of unfriendliness, apparent lack of caring, inattentiveness, poor training, unprofessional behavior, and poor communication; (2) comments about specific departments (22/37, 59.5%); (3) comments on technical aspects of care, including perceived errors, incorrect diagnoses, and inattention to pain control (9/37, 24.3%); and (4) comments describing the hospital physical plant, parking, and amenities (9/37, 24.3%). There were a few miscellaneous comments that did not fit into these broad themes, such as expressions of gratitude for our solicitation of narratives. Percent agreement between coders was 80% and Spearman's Rho was 0.82 (p0.001).
A small number (n=3) of respondents repeatedly made comments over the 3‐week period, accounting for 30% (45/148) of codes. These repetitive commenters tended to dominate the Facebook conversation, at times describing the same experience more than once.
DISCUSSION
In this study evaluating the potential utility of social media as a hospital QI tool, several broad themes emerged. From these themes, we identified several areas that could be deemed as QI targets, including: training staff to be more responsive and sensitive to patients needs and concerns, improving patient and visitor parking, and reducing emergency department waiting times. However, the insight gained from solicited Facebook comments was similar to feedback gained from more traditional approaches of soliciting patient perspectives on care, such as patient experience surveys.[14]
Our findings should be viewed in the context of prior work focused on patient narratives in healthcare. Greaves et al. used sentiment analysis to describe the content of nearly 200,000 tweets (comments posted on the social networking website Twitter) sent to National Health Service (NHS) hospitals.[15] Themes were similar to those found in our study: (1) interaction with staff, (2) environment and facilities, and (3) issues of access and timeliness of service. Notably, these themes mirrored prior work examining narratives at NHS hospitals[3] and were similar to domains of commonly used surveys of patient experience.[14] The authors noted that there were issues with the signal to noise ratio (only about 10% of tweets were about quality) and the enforced brevity of Twitter (tweets must be 140 characters or less). These limitations suggest that using Twitter to identify QI targets would be difficult.
In contrast to Greaves et al., we chose to solicit feedback on our hospital's Facebook page. Facebook does not have Twitter's enforced brevity, allowing for more detailed narratives. In addition, we did not encounter the signal‐to‐noise problem, because our prompt was designed to request feedback that was relevant to recent experiences of care. However, a few respondents dominated the conversation, supporting the hypothesis that those most likely to comment may be the patients or families who have had the best or worst experiences. In the future, we will attempt to address this limitation and reduce the influence of repeat commenters by changing our prompt (eg, Please tell us about your experience, but please do not post descriptions of the same experience more than once.).
This pilot demonstrated some of the previously described benefits of online narratives.[5] First, there appears to be value in allowing patients to share their experiences and to read the experiences of others (as indicated in a few grateful patients comments). Second, soliciting online narratives offers a way for hospitals to demonstrate a commitment to transparency. Third, in contrast to closed‐ended survey questions, narrative comments help to identify why patients were satisfied or unsatisfied with their care. Although some surveys with closed‐ended questions also allow for narratives, these comments may or may not be carefully reviewed by the hospital. Using social media to solicit and respond to comments enhances existing methods for evaluating patient experience by engaging patients in a public space, which increases the likelihood that hospitals will attempt to improve care in response.
Notably, none of the identified areas for improvement could be considered novel QI targets for BMC. For example, our hospital has been very focused on training staff around patient experience, and emergency department wait times are the focus of a system‐wide improvement effort called Patient Progress.
This study has other limitations. We conducted this study over a 3‐week time period in a single center and on a single social media site whose members may not be representative of the overall patient population at BMC. Although we do not know how generalizable our findings are (in terms of identifying QI targets), we feel that we have demonstrated how using social media to collect data on patient experience is feasible and could be informative for other hospitals in other locations. It is possible that we did not allow the experiment to run long enough; a longer time or broader outreach (eg, a handout given to every discharged patient over a longer period) may be needed to allow patients adequate opportunity to comment. Of note, we did not specifically examine responses by time period, but it does seem, in post hoc analysis, that after 2 weeks of data collection we reached theoretical saturation with no new themes emerging in the third week (eg, third‐week comments included I heart your nurses. and Love Baystate but hate the ER.). More work is also needed that includes a broader range of social media platforms and more participating hospitals.
In conclusion, the opportunity to provide feedback on Facebook has the potential to engage and empower patients, and hospitals can use these online narratives to help to drive improvement efforts. Yet potential benefits must be weighed against reputational risks, a lack of representative respondents, and the paucity of novel QI targets obtained in this study.
Disclosures: Dr. Lagu is supported by the National Heart, Lung, and Blood Institute of the National Institutes of Health under award number K01HL114745. The authors report no conflicts of interest.
- Centers for Medicare 47(2):193–219.
- , , , , . A mixed‐methods analysis of patient reviews of hospital care in England: implications for public reporting of health care quality data in the United States. Jt Comm J Qual Patient Saf. 2013;39(1):7–15.
- , , , , , , , . Taking Patients' Narratives about Clinicians from Anecdote to Science. NEJM. 2015;373(7):675–679.
- , . Putting the public back in public reporting of health care quality. JAMA. 2010;304(15):1711–1712.
- , , , et al. Use of social media across US hospitals: descriptive analysis of adoption and utilization. J Med Internet Res. 2014;16(11):e264.
- , , , , , . Patient use of email, Facebook, and physician websites to communicate with physicians: a national online survey of retail pharmacy users [published online June 24, 2015]. J Gen Intern Med. doi:10.1007/s11606-015-3374-7.
- Pew Research Center. Social networking fact sheet. Available at: http://www.pewinternet.org/fact‐sheets/social‐networking‐fact‐sheet. Accessed March 4, 2015.
- , . Three approaches to qualitative content analysis. Qual Health Res. 2005;15(9):1277–1288.
- , , , . Patients’ evaluations of health care providers in the era of social networking: an analysis of physician‐rating websites. J Gen Intern Med. 2010;25(9):942–946.
- , , , , . Vaccine counseling: a content analysis of patient‐physician discussions regarding human papilloma virus vaccine. Vaccine. 2011;29(43):7343–7349.
- . Qualitative research methods. Int J Qual Health Care. 2002;14(4):329–336.
- , . Doing Qualitative Research. Vol 2. Thousand Oaks, CA: Sage Publications; 1999.
- , , , . Patients’ perception of hospital care in the United States. N Engl J Med. 2008;359(18):1921–1931.
- , , , et al. Tweets about hospital quality: a mixed methods study. BMJ Qual Saf. 2014;23(10):838–846.
- Centers for Medicare 47(2):193–219.
- , , , , . A mixed‐methods analysis of patient reviews of hospital care in England: implications for public reporting of health care quality data in the United States. Jt Comm J Qual Patient Saf. 2013;39(1):7–15.
- , , , , , , , . Taking Patients' Narratives about Clinicians from Anecdote to Science. NEJM. 2015;373(7):675–679.
- , . Putting the public back in public reporting of health care quality. JAMA. 2010;304(15):1711–1712.
- , , , et al. Use of social media across US hospitals: descriptive analysis of adoption and utilization. J Med Internet Res. 2014;16(11):e264.
- , , , , , . Patient use of email, Facebook, and physician websites to communicate with physicians: a national online survey of retail pharmacy users [published online June 24, 2015]. J Gen Intern Med. doi:10.1007/s11606-015-3374-7.
- Pew Research Center. Social networking fact sheet. Available at: http://www.pewinternet.org/fact‐sheets/social‐networking‐fact‐sheet. Accessed March 4, 2015.
- , . Three approaches to qualitative content analysis. Qual Health Res. 2005;15(9):1277–1288.
- , , , . Patients’ evaluations of health care providers in the era of social networking: an analysis of physician‐rating websites. J Gen Intern Med. 2010;25(9):942–946.
- , , , , . Vaccine counseling: a content analysis of patient‐physician discussions regarding human papilloma virus vaccine. Vaccine. 2011;29(43):7343–7349.
- . Qualitative research methods. Int J Qual Health Care. 2002;14(4):329–336.
- , . Doing Qualitative Research. Vol 2. Thousand Oaks, CA: Sage Publications; 1999.
- , , , . Patients’ perception of hospital care in the United States. N Engl J Med. 2008;359(18):1921–1931.
- , , , et al. Tweets about hospital quality: a mixed methods study. BMJ Qual Saf. 2014;23(10):838–846.
Ischemic Stroke Workup
After entertaining the possibility of acute intervention, the majority of hospitalists efforts in the management of patients with ischemic stroke involve identifying an etiology and initiating secondary prevention strategies. Other than evaluating stroke risk factors, workup has traditionally involved extracranial and intracranial vessel imaging, cardiac telemetry, and echocardiography. Even after exhaustive searches, no cause for stroke is found in nearly 25% of cases, leading to a recent focus on determining why these so‐called cryptogenic strokes happen and how to prevent their recurrence.[1, 2]
Echocardiography is commonly obtained in most patients with ischemic stroke, but its yield is probably modest at best. Although transesophageal echocardiography (TEE) may be superior to transthoracic echocardiography (TTE) for determining an etiology of stroke, whether these findings substantially change management remains debatable.[3, 4] In this issue of the Journal of Hospital Medicine, Marino and colleagues examined the yield of TEE in patients without a known cause of ischemic stroke following a normal TTE.[5] A possible cause of stroke was identified in 42%, including aortic plaques and patent foramen ovale (PFO), but in only 1 patient did this discovery change management.
Secondary prevention strategies in ischemic stroke outside of atrial fibrillation now almost exclusively involve antiplatelet medications.[6] Studies of secondary prevention in aortic arch atheromas, patients with depressed systolic function, and those with PFO have failed to demonstrate any strategy that is superior to antiplatelets, and therefore the bar is high to show that any TEE findings impact treatment other than obvious and rare smoking guns such as a rare valvular lesion, cardiac tumor, or atrial thrombus.[7, 8, 9]
What is more of a recent headline in stroke workup is the increasing emphasis on long‐term cardiac monitoring following discharge to detect those with atrial fibrillation, which likely comprise between 15% and 20% of cryptogenic stroke patients.[10] Finding atrial fibrillation clearly changes management and therefore has a higher yield than the vast majority of possible findings on echocardiography. Perhaps in patients in whom a TEE is being considered, extended monitoring should happen first as an outpatient, followed by TEE if the stroke etiology remains obscure. On the other hand, severe left atrial enlargement, thrombus in the atrium, or atrial spontaneous echo contrast (smoke) are features on echocardiography that might raise the suspicion of atrial fibrillation so high that anticoagulation could be considered while long‐term monitoring is being used to definitively prove an atrial arrhythmia.
The current study does have some limitations other than those inherent to its retrospective design. Patients were only included if they were older than 50 years. Some have advocated using TEE as the echocardiogram of choice in young stroke patients due to its perhaps higher yield in these individuals; this study does not address this strategy. At institutions such as ours, an abnormal TTE in a cryptogenic stroke patient is followed by a TEE, and this study again does not alter this approach, because only those with a normal TTE were included. The definition of a normal TTE used in the study was so narrow, including normal left ventricular systolic function, that a majority of stroke patients with vascular risk factors such as hypertension would have likely been excluded. Determining what features and quality of a TTE are so definitive that a TEE is not necessary will be an important thrust of additional research. However, because TEE shows a better view of the left atrial appendage, the aortic arch, and is probably a better shunt study compared with TTE, it is not clear if a normal TTE will ever be adequate to prevent this second more invasive study in selected patients.
At the heart of the matter for health systems is the cost‐effectiveness of any screening approach used to determine the etiology of acute ischemic stroke. Studies are underway that will likely demonstrate that long‐term monitoring for atrial fibrillation will be worth it. Although it is dubious that TEE would ever fall into the same category due to its low yield, one might imagine a scenario, as our workup for cryptogenic stroke becomes more and more complicated, where obtaining a TEE is cost‐effective simply because it gives an answer and therefore can halt further testing. Perhaps at the end of the day, a TEE will just allow us to say to our stroke patients that enough is enough.
Disclosures: Dr. Josephson receives personal compensation as Editor‐in‐Chief of the New England Journal of Medicine Journal Watch Neurology and in an editorial capacity for Continuum Audio.
- , , , et al. Embolic strokes of undetermined source: the case for a new clinical construct. Lancet Neurol. 2014;13:429–438.
- , , , et al. Incidence, outcome, risk factors, and long‐term prognosis of cryptogenic transient ischaemic attack and ischaemic stroke: a population‐based study. Lancet Neurol. 2015;14:903–913.
- , , , et al. Transesophageal echocardiography is superior to transthoracic echocardiography in management of patients of any age with transient ischemic attack or stroke. Stroke. 2006;37:2531–2534.
- , , , , , . Transesophageal echocardiography in patients with cryptogenic ischemic stroke: a systematic review. Am Heart J. 2014;168:706–712.
- , , , , . Impact of transesophageal echocardiography on clinical management of patients over age 50 with cryptogenic stroke and normal transthoracic echocardiogram. J Hosp Med. 2016;11(2):95–98.
- , , , et al. Guidelines for the prevention of stroke in patients with stroke and transient ischemic attack: a guideline for healthcare professionals from the American Heart Association/American Stroke Association. Stroke. 2014;45:2160–2236.
- , , , et al. Clopidogrel plus aspirin versus warfarin in patients with stroke and aortic arch plaques. Stroke. 2014;45:1248–1257.
- , , , et al. Warfarin and aspirin in patients with heart failure and sinus rhythm. N Engl J Med. 2012;366:1859–1869.
- , , , et al. Closure or medical therapy for cryptogenic stroke with patent foramen ovale. N Engl J Med. 2012;366:991–999.
- , , , et al. Atrial fibrillation in patients with cryptogenic stroke. N Engl J Med. 2014;370:2467–2477.
After entertaining the possibility of acute intervention, the majority of hospitalists efforts in the management of patients with ischemic stroke involve identifying an etiology and initiating secondary prevention strategies. Other than evaluating stroke risk factors, workup has traditionally involved extracranial and intracranial vessel imaging, cardiac telemetry, and echocardiography. Even after exhaustive searches, no cause for stroke is found in nearly 25% of cases, leading to a recent focus on determining why these so‐called cryptogenic strokes happen and how to prevent their recurrence.[1, 2]
Echocardiography is commonly obtained in most patients with ischemic stroke, but its yield is probably modest at best. Although transesophageal echocardiography (TEE) may be superior to transthoracic echocardiography (TTE) for determining an etiology of stroke, whether these findings substantially change management remains debatable.[3, 4] In this issue of the Journal of Hospital Medicine, Marino and colleagues examined the yield of TEE in patients without a known cause of ischemic stroke following a normal TTE.[5] A possible cause of stroke was identified in 42%, including aortic plaques and patent foramen ovale (PFO), but in only 1 patient did this discovery change management.
Secondary prevention strategies in ischemic stroke outside of atrial fibrillation now almost exclusively involve antiplatelet medications.[6] Studies of secondary prevention in aortic arch atheromas, patients with depressed systolic function, and those with PFO have failed to demonstrate any strategy that is superior to antiplatelets, and therefore the bar is high to show that any TEE findings impact treatment other than obvious and rare smoking guns such as a rare valvular lesion, cardiac tumor, or atrial thrombus.[7, 8, 9]
What is more of a recent headline in stroke workup is the increasing emphasis on long‐term cardiac monitoring following discharge to detect those with atrial fibrillation, which likely comprise between 15% and 20% of cryptogenic stroke patients.[10] Finding atrial fibrillation clearly changes management and therefore has a higher yield than the vast majority of possible findings on echocardiography. Perhaps in patients in whom a TEE is being considered, extended monitoring should happen first as an outpatient, followed by TEE if the stroke etiology remains obscure. On the other hand, severe left atrial enlargement, thrombus in the atrium, or atrial spontaneous echo contrast (smoke) are features on echocardiography that might raise the suspicion of atrial fibrillation so high that anticoagulation could be considered while long‐term monitoring is being used to definitively prove an atrial arrhythmia.
The current study does have some limitations other than those inherent to its retrospective design. Patients were only included if they were older than 50 years. Some have advocated using TEE as the echocardiogram of choice in young stroke patients due to its perhaps higher yield in these individuals; this study does not address this strategy. At institutions such as ours, an abnormal TTE in a cryptogenic stroke patient is followed by a TEE, and this study again does not alter this approach, because only those with a normal TTE were included. The definition of a normal TTE used in the study was so narrow, including normal left ventricular systolic function, that a majority of stroke patients with vascular risk factors such as hypertension would have likely been excluded. Determining what features and quality of a TTE are so definitive that a TEE is not necessary will be an important thrust of additional research. However, because TEE shows a better view of the left atrial appendage, the aortic arch, and is probably a better shunt study compared with TTE, it is not clear if a normal TTE will ever be adequate to prevent this second more invasive study in selected patients.
At the heart of the matter for health systems is the cost‐effectiveness of any screening approach used to determine the etiology of acute ischemic stroke. Studies are underway that will likely demonstrate that long‐term monitoring for atrial fibrillation will be worth it. Although it is dubious that TEE would ever fall into the same category due to its low yield, one might imagine a scenario, as our workup for cryptogenic stroke becomes more and more complicated, where obtaining a TEE is cost‐effective simply because it gives an answer and therefore can halt further testing. Perhaps at the end of the day, a TEE will just allow us to say to our stroke patients that enough is enough.
Disclosures: Dr. Josephson receives personal compensation as Editor‐in‐Chief of the New England Journal of Medicine Journal Watch Neurology and in an editorial capacity for Continuum Audio.
After entertaining the possibility of acute intervention, the majority of hospitalists efforts in the management of patients with ischemic stroke involve identifying an etiology and initiating secondary prevention strategies. Other than evaluating stroke risk factors, workup has traditionally involved extracranial and intracranial vessel imaging, cardiac telemetry, and echocardiography. Even after exhaustive searches, no cause for stroke is found in nearly 25% of cases, leading to a recent focus on determining why these so‐called cryptogenic strokes happen and how to prevent their recurrence.[1, 2]
Echocardiography is commonly obtained in most patients with ischemic stroke, but its yield is probably modest at best. Although transesophageal echocardiography (TEE) may be superior to transthoracic echocardiography (TTE) for determining an etiology of stroke, whether these findings substantially change management remains debatable.[3, 4] In this issue of the Journal of Hospital Medicine, Marino and colleagues examined the yield of TEE in patients without a known cause of ischemic stroke following a normal TTE.[5] A possible cause of stroke was identified in 42%, including aortic plaques and patent foramen ovale (PFO), but in only 1 patient did this discovery change management.
Secondary prevention strategies in ischemic stroke outside of atrial fibrillation now almost exclusively involve antiplatelet medications.[6] Studies of secondary prevention in aortic arch atheromas, patients with depressed systolic function, and those with PFO have failed to demonstrate any strategy that is superior to antiplatelets, and therefore the bar is high to show that any TEE findings impact treatment other than obvious and rare smoking guns such as a rare valvular lesion, cardiac tumor, or atrial thrombus.[7, 8, 9]
What is more of a recent headline in stroke workup is the increasing emphasis on long‐term cardiac monitoring following discharge to detect those with atrial fibrillation, which likely comprise between 15% and 20% of cryptogenic stroke patients.[10] Finding atrial fibrillation clearly changes management and therefore has a higher yield than the vast majority of possible findings on echocardiography. Perhaps in patients in whom a TEE is being considered, extended monitoring should happen first as an outpatient, followed by TEE if the stroke etiology remains obscure. On the other hand, severe left atrial enlargement, thrombus in the atrium, or atrial spontaneous echo contrast (smoke) are features on echocardiography that might raise the suspicion of atrial fibrillation so high that anticoagulation could be considered while long‐term monitoring is being used to definitively prove an atrial arrhythmia.
The current study does have some limitations other than those inherent to its retrospective design. Patients were only included if they were older than 50 years. Some have advocated using TEE as the echocardiogram of choice in young stroke patients due to its perhaps higher yield in these individuals; this study does not address this strategy. At institutions such as ours, an abnormal TTE in a cryptogenic stroke patient is followed by a TEE, and this study again does not alter this approach, because only those with a normal TTE were included. The definition of a normal TTE used in the study was so narrow, including normal left ventricular systolic function, that a majority of stroke patients with vascular risk factors such as hypertension would have likely been excluded. Determining what features and quality of a TTE are so definitive that a TEE is not necessary will be an important thrust of additional research. However, because TEE shows a better view of the left atrial appendage, the aortic arch, and is probably a better shunt study compared with TTE, it is not clear if a normal TTE will ever be adequate to prevent this second more invasive study in selected patients.
At the heart of the matter for health systems is the cost‐effectiveness of any screening approach used to determine the etiology of acute ischemic stroke. Studies are underway that will likely demonstrate that long‐term monitoring for atrial fibrillation will be worth it. Although it is dubious that TEE would ever fall into the same category due to its low yield, one might imagine a scenario, as our workup for cryptogenic stroke becomes more and more complicated, where obtaining a TEE is cost‐effective simply because it gives an answer and therefore can halt further testing. Perhaps at the end of the day, a TEE will just allow us to say to our stroke patients that enough is enough.
Disclosures: Dr. Josephson receives personal compensation as Editor‐in‐Chief of the New England Journal of Medicine Journal Watch Neurology and in an editorial capacity for Continuum Audio.
- , , , et al. Embolic strokes of undetermined source: the case for a new clinical construct. Lancet Neurol. 2014;13:429–438.
- , , , et al. Incidence, outcome, risk factors, and long‐term prognosis of cryptogenic transient ischaemic attack and ischaemic stroke: a population‐based study. Lancet Neurol. 2015;14:903–913.
- , , , et al. Transesophageal echocardiography is superior to transthoracic echocardiography in management of patients of any age with transient ischemic attack or stroke. Stroke. 2006;37:2531–2534.
- , , , , , . Transesophageal echocardiography in patients with cryptogenic ischemic stroke: a systematic review. Am Heart J. 2014;168:706–712.
- , , , , . Impact of transesophageal echocardiography on clinical management of patients over age 50 with cryptogenic stroke and normal transthoracic echocardiogram. J Hosp Med. 2016;11(2):95–98.
- , , , et al. Guidelines for the prevention of stroke in patients with stroke and transient ischemic attack: a guideline for healthcare professionals from the American Heart Association/American Stroke Association. Stroke. 2014;45:2160–2236.
- , , , et al. Clopidogrel plus aspirin versus warfarin in patients with stroke and aortic arch plaques. Stroke. 2014;45:1248–1257.
- , , , et al. Warfarin and aspirin in patients with heart failure and sinus rhythm. N Engl J Med. 2012;366:1859–1869.
- , , , et al. Closure or medical therapy for cryptogenic stroke with patent foramen ovale. N Engl J Med. 2012;366:991–999.
- , , , et al. Atrial fibrillation in patients with cryptogenic stroke. N Engl J Med. 2014;370:2467–2477.
- , , , et al. Embolic strokes of undetermined source: the case for a new clinical construct. Lancet Neurol. 2014;13:429–438.
- , , , et al. Incidence, outcome, risk factors, and long‐term prognosis of cryptogenic transient ischaemic attack and ischaemic stroke: a population‐based study. Lancet Neurol. 2015;14:903–913.
- , , , et al. Transesophageal echocardiography is superior to transthoracic echocardiography in management of patients of any age with transient ischemic attack or stroke. Stroke. 2006;37:2531–2534.
- , , , , , . Transesophageal echocardiography in patients with cryptogenic ischemic stroke: a systematic review. Am Heart J. 2014;168:706–712.
- , , , , . Impact of transesophageal echocardiography on clinical management of patients over age 50 with cryptogenic stroke and normal transthoracic echocardiogram. J Hosp Med. 2016;11(2):95–98.
- , , , et al. Guidelines for the prevention of stroke in patients with stroke and transient ischemic attack: a guideline for healthcare professionals from the American Heart Association/American Stroke Association. Stroke. 2014;45:2160–2236.
- , , , et al. Clopidogrel plus aspirin versus warfarin in patients with stroke and aortic arch plaques. Stroke. 2014;45:1248–1257.
- , , , et al. Warfarin and aspirin in patients with heart failure and sinus rhythm. N Engl J Med. 2012;366:1859–1869.
- , , , et al. Closure or medical therapy for cryptogenic stroke with patent foramen ovale. N Engl J Med. 2012;366:991–999.
- , , , et al. Atrial fibrillation in patients with cryptogenic stroke. N Engl J Med. 2014;370:2467–2477.