User login
Patients at Risk for Readmission
Unplanned hospital readmissions are common, costly, and potentially avoidable. Approximately 20% of Medicare patients are readmitted within 30 days of discharge.[1] Readmission rates are estimated to be similarly high in other population subgroups,[2, 3, 4] with approximately 80% of patients[1, 5, 6] readmitted to the original discharging hospital. A recent systematic review suggested that 27% of readmissions may be preventable.[7]
Hospital readmissions have increasingly been viewed as a correctable marker of poor quality care and have been adopted by a number of organizations as quality indicators.[8, 9, 10] As a result, hospitals have important internal and external motivations to address readmissions. Identification of patients at high risk for readmissions may be an important first step toward preventing them. In particular, readmission risk assessment could be used to help providers target the delivery of resource‐intensive transitional care interventions[11, 12, 13, 14] to patients with the greatest needs. Such an approach is appealing because it allows hospitals to focus scarce resources where the impact may be greatest and provides a starting point for organizations struggling to develop robust models of transitional care delivery.
Electronic health records (EHRs) may prove to be an important component of strategies designed to risk stratify patients at the point of care. Algorithms integrated into the EHR that automatically generate risk predictions have the potential to (1) improve provider time efficiency by automating the prediction process, (2) improve consistency of data collection and risk score calculation, (3) increase adoption through improved usability, and (4) provide clinically important information in real‐time to all healthcare team members caring for a hospitalized patient.
We thus sought to derive a predictive model for 30‐day readmissions using data reliably present in our EHR at the time of admission, and integrate this predictive model into our hospital's EHR to create an automated prediction tool that identifies on admission patients at high risk for readmission within 30 days of discharge. In addition, we prospectively validated this model using the 12‐month period after implementation and examined the impact on readmissions.
METHODS
Setting
The University of Pennsylvania Health System (UPHS) includes 3 hospitals, with a combined capacity of over 1500 beds and 70,000 annual admissions. All hospitals currently utilize Sunrise Clinical Manager version 5.5 (Allscripts, Chicago, IL) as their EHR. The study sample included all adult admissions to any of the 3 UPHS hospitals during the study period. Admissions to short procedure, rehabilitation, and hospice units were excluded. The study received expedited approval and a HIPAA waiver from the University of Pennsylvania institutional review board.
Development of Predictive Model
The UPHS Center for Evidence‐based Practice[15, 16] performed a systematic review to identify factors associated with hospital readmission within 30 days of discharge. We then examined the data available from our hospital EHR at the time of admission for those factors identified in the review. Using different threshold values and look‐back periods, we developed and tested 30 candidate prediction models using these variables alone and in combination (Table 1). Prediction models were evaluated using 24 months of historical data between August 1, 2009 and August 1, 2011.
Implementation
An automated readmission risk flag was then integrated into the EHR. Patients classified as being at high risk for readmission with the automated prediction model were flagged in the EHR on admission (Figure 1A). The flag can be double‐clicked to display a separate screen with information relevant to discharge planning including inpatient and emergency department (ED) visits in the prior 12 months, as well as information about the primary team, length of stay, and admitting problem associated with those admissions (Figure 1B). The prediction model was integrated into our EHR using Arden Syntax for Medical Logic Modules.[17] The readmission risk screen involved presenting the provider with a new screen and was thus developed in Microsoft .NET using C# and Windows Forms (Microsoft Corp., Redmond, WA).
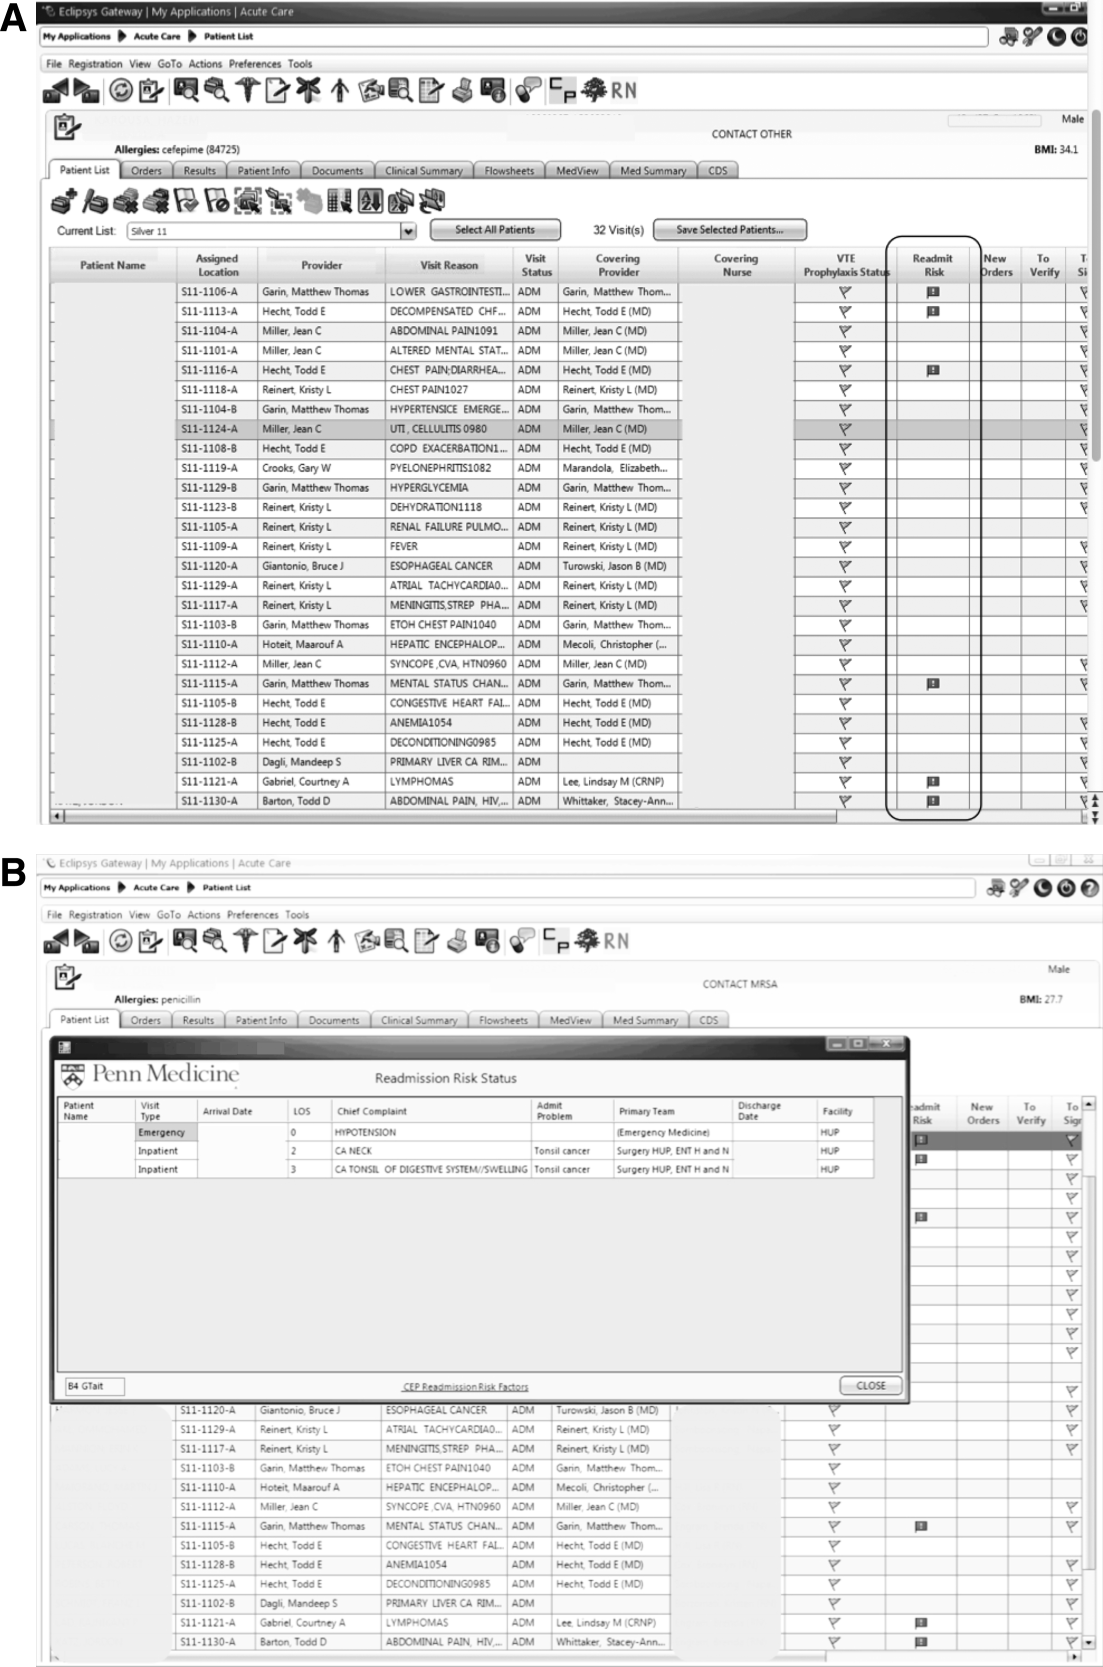
The flag was visible on the patient lists of all providers who utilized the EHR. This included but was not limited to nurses, social workers, unit pharmacists, and physicians. At the time of implementation, educational events regarding the readmission risk flag were provided in forums targeting administrators, pharmacists, social workers, and housestaff. Information about the flag and recommendations for use were distributed through emails and broadcast screensaver messages disseminated throughout the inpatient units of the health system. Providers were asked to pay special attention to discharge planning for patients triggering the readmission risk flag, including medication reconciliation by pharmacists for these patients prior to discharge, and arrangement of available home services by social workers.
The risk flag was 1 of 4 classes of interventions developed and endorsed by the health system in its efforts to reduce readmissions. Besides risk stratification, the other classes were: interdisciplinary rounding, patient education, and discharge communication. None of the interventions alone were expected to decrease readmissions, but as all 4 classes of interventions were implemented and performed routinely, the expectation was that they would work in concert to reduce readmissions.
Analysis
The primary outcome was all‐cause hospital readmissions in the healthcare system within 30 days of discharge. Although this outcome is commonly used both in the literature and as a quality metric, significant debate persists as to the appropriateness of this metric.[18] Many of the factors driving 30‐day readmissions may be dependent on factors outside of the discharging hospital's control and it has been argued that nearer‐term, nonelective readmission rates may provide a more meaningful quality metric.[18] Seven‐day unplanned readmissions were thus used as a secondary outcome measure for this study.
Sensitivity, specificity, predictive value, C statistic, F score (the harmonic mean of positive predictive value and sensitivity),[19] and screen‐positive rate were calculated for each of the 30 prediction models evaluated using the historical data. The prediction model with the best balance of F score and screen‐positive rate was selected as the prediction model to be integrated into the EHR. Prospective validation of the selected prediction model was performed using the 12‐month period following implementation of the risk flag (September 2011September 2012).
To assess the impact of the automated prediction model on monthly readmission rate, we used the 24‐month period immediately before and the 12‐month period immediately after implementation of the readmission risk flag. Segmented regression analysis was performed testing for changes in level and slope of readmission rates between preimplementation and postimplementation time periods. This quasiexperimental interrupted time series methodology[20] allows us to control for secular trends in readmission rates and to assess the preimplementation trend (secular trend), the difference in rates immediately before and after the implementation (immediate effect), and the postimplementation change over time (sustained effect). We used Cochrane‐Orcutt estimation[21] to correct for serial autocorrelation.
All analyses were performed using Stata 12.1 software (Stata Corp, College Station, TX).
RESULTS
Predictors of Readmission
Our systematic review of the literature identified several patient and healthcare utilization patterns predictive of 30‐day readmission risk. Utilization factors included length of stay, number of prior admissions, previous 30‐day readmissions, and previous ED visits. Patient characteristics included number of comorbidities, living alone, and payor. Evidence was inconsistent regarding threshold values for these variables.
Many variables readily available in our EHR were either found by the systematic review not to be reliably predictive of 30‐day readmission (including age and gender) or were not readily or reliably available on admission (including length of stay and payor). At the time of implementation, our EHR did not include vital sign or nursing assessment variables, so these were not considered for inclusion in our model.
Of the available variables, 3 were consistently accurate and available in the EHR at the time of patient admission: prior hospital admission, emergency department visit, and 30‐day readmission within UPHS. We then developed 30 candidate prediction models using a combination of these variables, including 1 and 2 prior admissions, ED visits, and 30‐day readmissions in the 6 and 12 months preceding the index visit (Table 1).
Development and Validation
We used 24 months of retrospective data, which included 120,396 discharges with 17,337 thirty‐day readmissions (14.4% 30‐day all‐cause readmission rate) to test the candidate prediction models. A single risk factor, 2 inpatient admissions in the past 12 months, was found to have the best balance of sensitivity (40%), positive predictive value (31%), and proportion of patients flagged (18%) (Table 1).
| Sensitivity | Specificity | C Statistic | PPV | NPV | Screen Positive | F Score | |
|---|---|---|---|---|---|---|---|
| |||||||
| Retrospective Evaluation of Prediction Rules Lookback period: 6 months | |||||||
| Prior Admissions | |||||||
| 1 | 53% | 74% | 0.640 | 26% | 91% | 30% | 0.350 |
| 2 | 32% | 90% | 0.610 | 35% | 89% | 13% | 0.333 |
| 3 | 20% | 96% | 0.578 | 44% | 88% | 7% | 0.274 |
| Prior ED Visits | |||||||
| 1 | 31% | 81% | 0.558 | 21% | 87% | 21% | 0.252 |
| 2 | 13% | 93% | 0.532 | 25% | 87% | 8% | 0.172 |
| 3 | 7% | 97% | 0.519 | 27% | 86% | 4% | 0.111 |
| Prior 30‐day Readmissions | |||||||
| 1 | 39% | 85% | 0.623 | 31% | 89% | 18% | 0.347 |
| 2 | 21% | 95% | 0.582 | 43% | 88% | 7% | 0.284 |
| 3 | 13% | 98% | 0.555 | 53% | 87% | 4% | 0.208 |
| Combined Rules | |||||||
| Admit1 & ED1 | 22% | 92% | 0.568 | 31% | 88% | 10% | 0.255 |
| Admit2 & ED1 | 15% | 96% | 0.556 | 40% | 87% | 5% | 0.217 |
| Admit1 & 30‐day1 | 39% | 85% | 0.623 | 31% | 89% | 18% | 0.346 |
| Admit2 & 30‐day1 | 29% | 92% | 0.603 | 37% | 89% | 11% | 0.324 |
| 30‐day1 & ED1 | 17% | 95% | 0.559 | 37% | 87% | 6% | 0.229 |
| 30‐day1 & ED2 | 8% | 98% | 0.527 | 40% | 86% | 3% | 0.132 |
| Lookback period: 12 months | |||||||
| Prior Admission | |||||||
| 1 | 60% | 68% | 0.593 | 24% | 91% | 36% | 0.340 |
| 2a | 40% | 85% | 0.624 | 31% | 89% | 18% | 0.354 |
| 3 | 28% | 92% | 0.600 | 37% | 88% | 11% | 0.318 |
| Prior ED Visit | |||||||
| 1 | 38% | 74% | 0.560 | 20% | 88% | 28% | 0.260 |
| 2 | 20% | 88% | 0.544 | 23% | 87% | 13% | 0.215 |
| 3 | 8% | 96% | 0.523 | 27% | 86% | 4% | 0.126 |
| Prior 30‐day Readmission | |||||||
| 1 | 43% | 84% | 0.630 | 30% | 90% | 20% | 0.353 |
| 2 | 24% | 94% | 0.592 | 41% | 88% | 9% | 0.305 |
| 3 | 11% | 98% | 0.548 | 54% | 87% | 3% | 0.186 |
| Combined Rules | |||||||
| Admit1 & ED1 | 29% | 87% | 0.580 | 27% | 88% | 15% | 0.281 |
| Admit2 & ED1 | 22% | 93% | 0.574 | 34% | 88% | 9% | 0.266 |
| Admit1 & 30‐day1 | 42% | 84% | 0.630 | 30% | 90% | 14% | 0.353 |
| Admit2 & 30‐day1 | 34% | 89% | 0.615 | 34% | 89% | 14% | 0.341 |
| 30‐day1 & ED1 | 21% | 93% | 0.569 | 35% | 88% | 9% | 0.261 |
| 30‐day1 & ED2 | 13% | 96% | 0.545 | 37% | 87% | 5% | 0.187 |
| Prospective Evaluation of Prediction Rule | |||||||
| 30‐Day All‐Cause | 39% | 84% | 0.614 | 30% | 89% | 18% | 0.339 |
Prospective validation of the prediction model was performed using the 12‐month period directly following readmission risk flag implementation. During this period, the 30‐day all‐cause readmission rate was 15.1%. Sensitivity (39%), positive predictive value (30%), and proportion of patients flagged (18%) were consistent with the values derived from the retrospective data, supporting the reproducibility and predictive stability of the chosen risk prediction model (Table 1). The C statistic of the model was also consistent between the retrospective and prospective datasets (0.62 and 0.61, respectively).
Readmission Rates
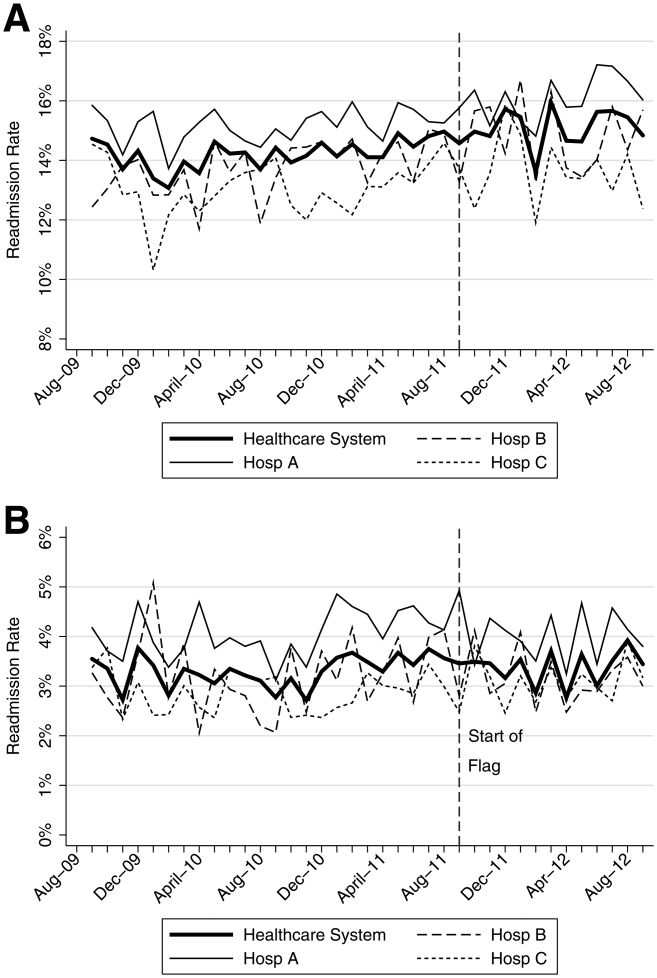
The mean 30‐day all‐cause readmission rate for the 24‐month period prior to the intervention was 14.4%, whereas the mean for the 12‐month period after the implementation was 15.1%. Thirty‐day all‐cause and 7‐day unplanned monthly readmission rates do not appear to have been impacted by the intervention (Figure 2). There was no evidence for either an immediate or sustained effect (Table 2).
| Hospital | Preimplementation Period | Immediate Effect | Postimplementation Period | P Value Change in Trenda | |||||
|---|---|---|---|---|---|---|---|---|---|
| Monthly % Change in Readmission Rates | P Value | Immediate % Change | P Value | Monthly % Change in Readmission Rates | P Value | ||||
| |||||||||
| 30‐Day All‐Cause Readmission Rates | |||||||||
| Hosp A | 0.023 | Stable | 0.153 | 0.480 | 0.991 | 0.100 | Increasing | 0.044 | 0.134 |
| Hosp B | 0.061 | Increasing | 0.002 | 0.492 | 0.125 | 0.060 | Stable | 0.296 | 0.048 |
| Hosp C | 0.026 | Stable | 0.413 | 0.447 | 0.585 | 0.046 | Stable | 0.629 | 0.476 |
| Health System | 0.032 | Increasing | 0.014 | 0.344 | 0.302 | 0.026 | Stable | 0.499 | 0.881 |
| 7‐Day Unplanned Readmission Rates | |||||||||
| Hosp A | 0.004 | Stable | 0.642 | 0.271 | 0.417 | 0.005 | Stable | 0.891 | 0.967 |
| Hosp B | 0.012 | Stable | 0.201 | 0.298 | 0.489 | 0.038 | Stable | 0.429 | 0.602 |
| Hosp C | 0.008 | Stable | 0.213 | 0.353 | 0.204 | 0.004 | Stable | 0.895 | 0.899 |
| Health System | 0.005 | Stable | 0.358 | 0.003 | 0.990 | 0.010 | Stable | 0.712 | 0.583 |
DISCUSSION
In this proof‐of‐concept study, we demonstrated the feasibility of an automated readmission risk prediction model integrated into a health system's EHR for a mixed population of hospitalized medical and surgical patients. To our knowledge, this is the first study in a general population of hospitalized patients to examine the impact of providing readmission risk assessment on readmission rates. We used a simple prediction model potentially generalizable to EHRs and healthcare populations beyond our own.
Existing risk prediction models for hospital readmission have important limitations and are difficult to implement in clinical practice.[22] Prediction models for hospital readmission are often dependent on retrospective claims data, developed for specific patient populations, and not designed for use early in the course of hospitalization when transitional care interventions can be initiated.[22] In addition, the time required to gather the necessary data and calculate the risk score remains a barrier to the adoption of prediction models in practice. By automating the process of readmission risk prediction, we were able to help integrate risk assessment into the healthcare process across many providers in a large multihospital healthcare organization. This has allowed us to consistently share risk assessment in real time with all members of the inpatient team, facilitating a team‐based approach to discharge planning.[23]
Two prior studies have developed readmission risk prediction models designed to be implemented into the EHR. Amarasingham et al.[24] developed and implemented[25] a heart failure‐specific prediction model based on the 18‐item Tabak mortality score.[26] Bradley et al.[27] studied in a broader population of medicine and surgery patients the predictive ability of a 26‐item score that utilized vital sign, cardiac rhythm, and nursing assessment data. Although EHRs are developing rapidly, currently the majority of EHRs do not support the use of many of the variables used in these models. In addition, both models were complex, raising concerns about generalizability to other healthcare settings and populations.
A distinctive characteristic of our model is its simplicity. We were cognizant of the realities of running a prediction model in a high‐volume production environment and the diminishing returns of adding more variables. We thus favored simplicity at all stages of model development, with the associated belief that complexity could be added with future iterations once feasibility had been established. Finally, we were aware that we were constructing a medical decision support tool rather than a simple classifier.[26] As such, the optimal model was not purely driven by discriminative ability, but also by our subjective assessment of the optimal trade‐off between sensitivity and specificity (the test‐treatment threshold) for such a model.[26] To facilitate model assessment, we thus categorized the potential predictor variables and evaluated the test characteristics of each combination of categorized variables. Although the C statistic of a model using continuous variables will be higher than a model using categorical values, model performance at the chosen trade‐off point is unlikely to be different.
Although the overall predictive ability of our model was fair, we found that it was associated with clinically meaningful differences in readmission rates between those triggering and not triggering the flag. The 30‐day all‐cause readmission rate in the 12‐month prospective sample was 15.1%, yet among those flagged as being at high risk for readmission the readmission rate was 30.4%. Given resource constraints and the need to selectively apply potentially costly care transition interventions, this may in practice translate into a meaningful discriminative ability.
Readmission rates did not change significantly during the study period. A number of plausible reasons for this exist, including: (1) the current model may not exhibit sufficient predictive ability to classify those at high risk or impact the behavior of providers appropriately, (2) those patients classified as high risk of readmission may not be at high risk of readmissions that are preventable, (3) information provided by the model may not yet routinely be used such that it can affect care, or (4) providing readmission risk assessment alone is not sufficient to influence readmission rates, and the other interventions or organizational changes necessary to impact care of those defined as high risk have not yet been implemented or are not yet being performed routinely. If the primary reasons for our results are those outlined in numbers 3 or 4, then readmission rates should improve over time as the risk flag becomes more routinely used, and those interventions necessary to impact readmission rates of those defined as high risk are implemented and performed.
Limitations
There are several limitations of this intervention. First, the prediction model was developed using 30‐day all‐cause readmissions, rather than attempting to identify potentially preventable readmissions. Thirty‐day readmission rates may not be a good proxy for preventable readmissions,[18] and as a consequence, the ability to predict 30‐day readmissions may not ensure that a prediction model is able to predict preventable readmissions. Nonetheless, 30‐day readmission rates remain the most commonly used quality metric.
Second, the impact of the risk flag on provider behavior is uncertain. We did not formally assess how the readmission risk flag was used by healthcare team members. Informal assessment has, however, revealed that the readmission risk flag is gradually being adopted by different members of the care team including unit‐based pharmacists who are using the flag to prioritize the delivery of medication education, social workers who are using the flag to prompt providers to consider higher level services for patients at high risk of readmission, and patient navigators who are using the flag to prioritize follow‐up phone calls. As a result, we hope that the flag will ultimately improve the processes of care for high‐risk patients.
Third, we did not capture readmissions to hospitals outside of our healthcare system and have therefore underestimated the readmission rate in our population. However, our assessment of the effect of the risk flag on readmissions focused on relative readmission rates over time, and the use of the interrupted time series methodology should protect against secular changes in outside hospital readmission rates that were not associated with the intervention.
Fourth, it is possible that the prediction model implemented could be significantly improved by including additional variables or data available during the hospital stay. However, simple classification models using a single variable have repeatedly been shown to have the ability to compete favorably with state‐of‐the‐art multivariable classification models.[28]
Fifth, our study was limited to a single academic health system, and our experience may not be generalizable to smaller healthcare systems with limited EHR systems. However, the simplicity of our prediction model and the integration into a commercial EHR may improve the generalizability of our experience to other healthcare settings. Additionally, partly due to recent policy initiatives, the adoption of integrated EHR systems by hospitals is expected to continue at a rapid rate and become the standard of care within the near future.[29]
CONCLUSION
An automated prediction model was effectively integrated into an existing EHR and was able to identify patients on admission who are at risk for readmission within 30 days of discharge. Future work will aim to further examine the impact of the flag on readmission rates, further refine the prediction model, and gather data on how providers and care teams use the information provided by the flag.
Disclosure
Dr. Umscheid‐s contribution to this project was supported in part by the National Center for Research Resources, Grant UL1RR024134, which is now at the National Center for Advancing Translational Sciences, Grant UL1TR000003. The content of this paper is solely the responsibility of the authors and does not necessarily represent the official views of the NIH.
- , , . Rehospitalizations among patients in the Medicare fee‐for‐service program. N Engl J Med. 2009;360(14):1418–1428.
- , . Hospital readmissions as a measure of quality of health care: advantages and limitations. Arch Intern Med. 2000;160(8):1074–1081.
- , , , , . Do older rural and urban veterans experience different rates of unplanned readmission to VA and non‐VA hospitals? J Rural Health. 2009;25(1):62–69.
- , , . Cost, causes and rates of rehospitalization of preterm infants. J Perinatol. 2007;27(10):614–619.
- , , , . Redefining readmission risk factors for general medicine patients. J Hosp Med. 2011;6(2):54–60.
- , , , et al. Incidence and main factors associated with early unplanned hospital readmission among French medical inpatients aged 75 and over admitted through emergency units. Age Ageing. 2008;37(4):416–422.
- , , , , . Proportion of hospital readmissions deemed avoidable: a systematic review. CMAJ. 2011;183(7):E391–E402.
- Hospital Quality Alliance. Available at: http://www.hospitalqualityalliance.org/hospitalqualityalliance/qualitymeasures/qualitymeasures.html. Accessed March 6, 2013.
- Institute for Healthcare Improvement. Available at: http://www.ihi.org/explore/Readmissions/Pages/default.aspx. Accessed March 6, 2013.
- Centers for Medicare and Medicaid Services. Available at: http://www.cms.gov/Medicare/Quality‐Initiatives‐Patient‐Assessment‐Instruments/HospitalQualityInits/OutcomeMeasures.html. Accessed March 6, 2013.
- , , , et al. Comprehensive discharge planning and home follow‐up of hospitalized elders: a randomized clinical trial. JAMA. 1999;281(7):613–620.
- , , , , , . Preparing patients and caregivers to participate in care delivered across settings: the Care Transitions Intervention. J Am Geriatr Soc. 2004;52(11):1817–1825.
- , , , , . The importance of transitional care in achieving health reform. Health Aff (Millwood). 2011;30(4):746–754.
- , , , , . Interventions to reduce 30‐day rehospitalization: a systematic review. Ann Intern Med. 2011;155(8):520–528.
- University of Pennsylvania Health System Center for Evidence‐based Practice. Available at: http://www.uphs.upenn.edu/cep/. Accessed March 6, 2013.
- , , . Hospital‐based comparative effectiveness centers: translating research into practice to improve the quality, safety and value of patient care. J Gen Intern Med. 2010;25(12):1352–1355.
- . Writing Arden Syntax Medical Logic Modules. Comput Biol Med. 1994;24(5):331–363.
- , . Thirty‐day readmissions—truth and consequences. N Engl J Med. 2012;366(15):1366–1369.
- . Information Retrieval. 2nd ed. Oxford, UK: Butterworth‐Heinemann; 1979.
- , , , . Segmented regression analysis of interrupted time series studies in medication use research. J Clin Pharm Ther. 2002;27(4):299–309.
- , . Application of least squares regression to relationships containing auto‐correlated error terms. J Am Stat Assoc. 1949; 44:32–61.
- , , , et al. Risk prediction models for hospital readmission: a systematic review. JAMA. 2011;306(15):1688–1698.
- , , , et al. Core Principles and values of effective team‐based health care. Available at: https://www.nationalahec.org/pdfs/VSRT‐Team‐Based‐Care‐Principles‐Values.pdf. Accessed March 19, 2013.
- , , , et al. An automated model to identify heart failure patients at risk for 30‐day readmission or death using electronic medical record data. Med Care. 2010;48(11):981–988.
- , , , et al. Allocating scarce resources in real‐time to reduce heart failure readmissions: a prospective, controlled study [published online ahead of print July 31, 2013]. BMJ Qual Saf. doi:10.1136/bmjqs‐2013‐001901.
- , . The threshold approach to clinical decision making. N Engl J Med. 1980;302(20):1109–1117.
- , , , , . Identifying patients at increased risk for unplanned readmission. Med Care. 2013;51(9):761–766.
- . Very simple classification rules perform well on most commonly used datasets. Mach Learn. 1993;11(1):63–91.
- . Stimulating the adoption of health information technology. N Engl J Med. 2009;360(15):1477–1479.
Unplanned hospital readmissions are common, costly, and potentially avoidable. Approximately 20% of Medicare patients are readmitted within 30 days of discharge.[1] Readmission rates are estimated to be similarly high in other population subgroups,[2, 3, 4] with approximately 80% of patients[1, 5, 6] readmitted to the original discharging hospital. A recent systematic review suggested that 27% of readmissions may be preventable.[7]
Hospital readmissions have increasingly been viewed as a correctable marker of poor quality care and have been adopted by a number of organizations as quality indicators.[8, 9, 10] As a result, hospitals have important internal and external motivations to address readmissions. Identification of patients at high risk for readmissions may be an important first step toward preventing them. In particular, readmission risk assessment could be used to help providers target the delivery of resource‐intensive transitional care interventions[11, 12, 13, 14] to patients with the greatest needs. Such an approach is appealing because it allows hospitals to focus scarce resources where the impact may be greatest and provides a starting point for organizations struggling to develop robust models of transitional care delivery.
Electronic health records (EHRs) may prove to be an important component of strategies designed to risk stratify patients at the point of care. Algorithms integrated into the EHR that automatically generate risk predictions have the potential to (1) improve provider time efficiency by automating the prediction process, (2) improve consistency of data collection and risk score calculation, (3) increase adoption through improved usability, and (4) provide clinically important information in real‐time to all healthcare team members caring for a hospitalized patient.
We thus sought to derive a predictive model for 30‐day readmissions using data reliably present in our EHR at the time of admission, and integrate this predictive model into our hospital's EHR to create an automated prediction tool that identifies on admission patients at high risk for readmission within 30 days of discharge. In addition, we prospectively validated this model using the 12‐month period after implementation and examined the impact on readmissions.
METHODS
Setting
The University of Pennsylvania Health System (UPHS) includes 3 hospitals, with a combined capacity of over 1500 beds and 70,000 annual admissions. All hospitals currently utilize Sunrise Clinical Manager version 5.5 (Allscripts, Chicago, IL) as their EHR. The study sample included all adult admissions to any of the 3 UPHS hospitals during the study period. Admissions to short procedure, rehabilitation, and hospice units were excluded. The study received expedited approval and a HIPAA waiver from the University of Pennsylvania institutional review board.
Development of Predictive Model
The UPHS Center for Evidence‐based Practice[15, 16] performed a systematic review to identify factors associated with hospital readmission within 30 days of discharge. We then examined the data available from our hospital EHR at the time of admission for those factors identified in the review. Using different threshold values and look‐back periods, we developed and tested 30 candidate prediction models using these variables alone and in combination (Table 1). Prediction models were evaluated using 24 months of historical data between August 1, 2009 and August 1, 2011.
Implementation
An automated readmission risk flag was then integrated into the EHR. Patients classified as being at high risk for readmission with the automated prediction model were flagged in the EHR on admission (Figure 1A). The flag can be double‐clicked to display a separate screen with information relevant to discharge planning including inpatient and emergency department (ED) visits in the prior 12 months, as well as information about the primary team, length of stay, and admitting problem associated with those admissions (Figure 1B). The prediction model was integrated into our EHR using Arden Syntax for Medical Logic Modules.[17] The readmission risk screen involved presenting the provider with a new screen and was thus developed in Microsoft .NET using C# and Windows Forms (Microsoft Corp., Redmond, WA).
The flag was visible on the patient lists of all providers who utilized the EHR. This included but was not limited to nurses, social workers, unit pharmacists, and physicians. At the time of implementation, educational events regarding the readmission risk flag were provided in forums targeting administrators, pharmacists, social workers, and housestaff. Information about the flag and recommendations for use were distributed through emails and broadcast screensaver messages disseminated throughout the inpatient units of the health system. Providers were asked to pay special attention to discharge planning for patients triggering the readmission risk flag, including medication reconciliation by pharmacists for these patients prior to discharge, and arrangement of available home services by social workers.
The risk flag was 1 of 4 classes of interventions developed and endorsed by the health system in its efforts to reduce readmissions. Besides risk stratification, the other classes were: interdisciplinary rounding, patient education, and discharge communication. None of the interventions alone were expected to decrease readmissions, but as all 4 classes of interventions were implemented and performed routinely, the expectation was that they would work in concert to reduce readmissions.
Analysis
The primary outcome was all‐cause hospital readmissions in the healthcare system within 30 days of discharge. Although this outcome is commonly used both in the literature and as a quality metric, significant debate persists as to the appropriateness of this metric.[18] Many of the factors driving 30‐day readmissions may be dependent on factors outside of the discharging hospital's control and it has been argued that nearer‐term, nonelective readmission rates may provide a more meaningful quality metric.[18] Seven‐day unplanned readmissions were thus used as a secondary outcome measure for this study.
Sensitivity, specificity, predictive value, C statistic, F score (the harmonic mean of positive predictive value and sensitivity),[19] and screen‐positive rate were calculated for each of the 30 prediction models evaluated using the historical data. The prediction model with the best balance of F score and screen‐positive rate was selected as the prediction model to be integrated into the EHR. Prospective validation of the selected prediction model was performed using the 12‐month period following implementation of the risk flag (September 2011September 2012).
To assess the impact of the automated prediction model on monthly readmission rate, we used the 24‐month period immediately before and the 12‐month period immediately after implementation of the readmission risk flag. Segmented regression analysis was performed testing for changes in level and slope of readmission rates between preimplementation and postimplementation time periods. This quasiexperimental interrupted time series methodology[20] allows us to control for secular trends in readmission rates and to assess the preimplementation trend (secular trend), the difference in rates immediately before and after the implementation (immediate effect), and the postimplementation change over time (sustained effect). We used Cochrane‐Orcutt estimation[21] to correct for serial autocorrelation.
All analyses were performed using Stata 12.1 software (Stata Corp, College Station, TX).
RESULTS
Predictors of Readmission
Our systematic review of the literature identified several patient and healthcare utilization patterns predictive of 30‐day readmission risk. Utilization factors included length of stay, number of prior admissions, previous 30‐day readmissions, and previous ED visits. Patient characteristics included number of comorbidities, living alone, and payor. Evidence was inconsistent regarding threshold values for these variables.
Many variables readily available in our EHR were either found by the systematic review not to be reliably predictive of 30‐day readmission (including age and gender) or were not readily or reliably available on admission (including length of stay and payor). At the time of implementation, our EHR did not include vital sign or nursing assessment variables, so these were not considered for inclusion in our model.
Of the available variables, 3 were consistently accurate and available in the EHR at the time of patient admission: prior hospital admission, emergency department visit, and 30‐day readmission within UPHS. We then developed 30 candidate prediction models using a combination of these variables, including 1 and 2 prior admissions, ED visits, and 30‐day readmissions in the 6 and 12 months preceding the index visit (Table 1).
Development and Validation
We used 24 months of retrospective data, which included 120,396 discharges with 17,337 thirty‐day readmissions (14.4% 30‐day all‐cause readmission rate) to test the candidate prediction models. A single risk factor, 2 inpatient admissions in the past 12 months, was found to have the best balance of sensitivity (40%), positive predictive value (31%), and proportion of patients flagged (18%) (Table 1).
| Sensitivity | Specificity | C Statistic | PPV | NPV | Screen Positive | F Score | |
|---|---|---|---|---|---|---|---|
| |||||||
| Retrospective Evaluation of Prediction Rules Lookback period: 6 months | |||||||
| Prior Admissions | |||||||
| 1 | 53% | 74% | 0.640 | 26% | 91% | 30% | 0.350 |
| 2 | 32% | 90% | 0.610 | 35% | 89% | 13% | 0.333 |
| 3 | 20% | 96% | 0.578 | 44% | 88% | 7% | 0.274 |
| Prior ED Visits | |||||||
| 1 | 31% | 81% | 0.558 | 21% | 87% | 21% | 0.252 |
| 2 | 13% | 93% | 0.532 | 25% | 87% | 8% | 0.172 |
| 3 | 7% | 97% | 0.519 | 27% | 86% | 4% | 0.111 |
| Prior 30‐day Readmissions | |||||||
| 1 | 39% | 85% | 0.623 | 31% | 89% | 18% | 0.347 |
| 2 | 21% | 95% | 0.582 | 43% | 88% | 7% | 0.284 |
| 3 | 13% | 98% | 0.555 | 53% | 87% | 4% | 0.208 |
| Combined Rules | |||||||
| Admit1 & ED1 | 22% | 92% | 0.568 | 31% | 88% | 10% | 0.255 |
| Admit2 & ED1 | 15% | 96% | 0.556 | 40% | 87% | 5% | 0.217 |
| Admit1 & 30‐day1 | 39% | 85% | 0.623 | 31% | 89% | 18% | 0.346 |
| Admit2 & 30‐day1 | 29% | 92% | 0.603 | 37% | 89% | 11% | 0.324 |
| 30‐day1 & ED1 | 17% | 95% | 0.559 | 37% | 87% | 6% | 0.229 |
| 30‐day1 & ED2 | 8% | 98% | 0.527 | 40% | 86% | 3% | 0.132 |
| Lookback period: 12 months | |||||||
| Prior Admission | |||||||
| 1 | 60% | 68% | 0.593 | 24% | 91% | 36% | 0.340 |
| 2a | 40% | 85% | 0.624 | 31% | 89% | 18% | 0.354 |
| 3 | 28% | 92% | 0.600 | 37% | 88% | 11% | 0.318 |
| Prior ED Visit | |||||||
| 1 | 38% | 74% | 0.560 | 20% | 88% | 28% | 0.260 |
| 2 | 20% | 88% | 0.544 | 23% | 87% | 13% | 0.215 |
| 3 | 8% | 96% | 0.523 | 27% | 86% | 4% | 0.126 |
| Prior 30‐day Readmission | |||||||
| 1 | 43% | 84% | 0.630 | 30% | 90% | 20% | 0.353 |
| 2 | 24% | 94% | 0.592 | 41% | 88% | 9% | 0.305 |
| 3 | 11% | 98% | 0.548 | 54% | 87% | 3% | 0.186 |
| Combined Rules | |||||||
| Admit1 & ED1 | 29% | 87% | 0.580 | 27% | 88% | 15% | 0.281 |
| Admit2 & ED1 | 22% | 93% | 0.574 | 34% | 88% | 9% | 0.266 |
| Admit1 & 30‐day1 | 42% | 84% | 0.630 | 30% | 90% | 14% | 0.353 |
| Admit2 & 30‐day1 | 34% | 89% | 0.615 | 34% | 89% | 14% | 0.341 |
| 30‐day1 & ED1 | 21% | 93% | 0.569 | 35% | 88% | 9% | 0.261 |
| 30‐day1 & ED2 | 13% | 96% | 0.545 | 37% | 87% | 5% | 0.187 |
| Prospective Evaluation of Prediction Rule | |||||||
| 30‐Day All‐Cause | 39% | 84% | 0.614 | 30% | 89% | 18% | 0.339 |
Prospective validation of the prediction model was performed using the 12‐month period directly following readmission risk flag implementation. During this period, the 30‐day all‐cause readmission rate was 15.1%. Sensitivity (39%), positive predictive value (30%), and proportion of patients flagged (18%) were consistent with the values derived from the retrospective data, supporting the reproducibility and predictive stability of the chosen risk prediction model (Table 1). The C statistic of the model was also consistent between the retrospective and prospective datasets (0.62 and 0.61, respectively).
Readmission Rates
The mean 30‐day all‐cause readmission rate for the 24‐month period prior to the intervention was 14.4%, whereas the mean for the 12‐month period after the implementation was 15.1%. Thirty‐day all‐cause and 7‐day unplanned monthly readmission rates do not appear to have been impacted by the intervention (Figure 2). There was no evidence for either an immediate or sustained effect (Table 2).
| Hospital | Preimplementation Period | Immediate Effect | Postimplementation Period | P Value Change in Trenda | |||||
|---|---|---|---|---|---|---|---|---|---|
| Monthly % Change in Readmission Rates | P Value | Immediate % Change | P Value | Monthly % Change in Readmission Rates | P Value | ||||
| |||||||||
| 30‐Day All‐Cause Readmission Rates | |||||||||
| Hosp A | 0.023 | Stable | 0.153 | 0.480 | 0.991 | 0.100 | Increasing | 0.044 | 0.134 |
| Hosp B | 0.061 | Increasing | 0.002 | 0.492 | 0.125 | 0.060 | Stable | 0.296 | 0.048 |
| Hosp C | 0.026 | Stable | 0.413 | 0.447 | 0.585 | 0.046 | Stable | 0.629 | 0.476 |
| Health System | 0.032 | Increasing | 0.014 | 0.344 | 0.302 | 0.026 | Stable | 0.499 | 0.881 |
| 7‐Day Unplanned Readmission Rates | |||||||||
| Hosp A | 0.004 | Stable | 0.642 | 0.271 | 0.417 | 0.005 | Stable | 0.891 | 0.967 |
| Hosp B | 0.012 | Stable | 0.201 | 0.298 | 0.489 | 0.038 | Stable | 0.429 | 0.602 |
| Hosp C | 0.008 | Stable | 0.213 | 0.353 | 0.204 | 0.004 | Stable | 0.895 | 0.899 |
| Health System | 0.005 | Stable | 0.358 | 0.003 | 0.990 | 0.010 | Stable | 0.712 | 0.583 |
DISCUSSION
In this proof‐of‐concept study, we demonstrated the feasibility of an automated readmission risk prediction model integrated into a health system's EHR for a mixed population of hospitalized medical and surgical patients. To our knowledge, this is the first study in a general population of hospitalized patients to examine the impact of providing readmission risk assessment on readmission rates. We used a simple prediction model potentially generalizable to EHRs and healthcare populations beyond our own.
Existing risk prediction models for hospital readmission have important limitations and are difficult to implement in clinical practice.[22] Prediction models for hospital readmission are often dependent on retrospective claims data, developed for specific patient populations, and not designed for use early in the course of hospitalization when transitional care interventions can be initiated.[22] In addition, the time required to gather the necessary data and calculate the risk score remains a barrier to the adoption of prediction models in practice. By automating the process of readmission risk prediction, we were able to help integrate risk assessment into the healthcare process across many providers in a large multihospital healthcare organization. This has allowed us to consistently share risk assessment in real time with all members of the inpatient team, facilitating a team‐based approach to discharge planning.[23]
Two prior studies have developed readmission risk prediction models designed to be implemented into the EHR. Amarasingham et al.[24] developed and implemented[25] a heart failure‐specific prediction model based on the 18‐item Tabak mortality score.[26] Bradley et al.[27] studied in a broader population of medicine and surgery patients the predictive ability of a 26‐item score that utilized vital sign, cardiac rhythm, and nursing assessment data. Although EHRs are developing rapidly, currently the majority of EHRs do not support the use of many of the variables used in these models. In addition, both models were complex, raising concerns about generalizability to other healthcare settings and populations.
A distinctive characteristic of our model is its simplicity. We were cognizant of the realities of running a prediction model in a high‐volume production environment and the diminishing returns of adding more variables. We thus favored simplicity at all stages of model development, with the associated belief that complexity could be added with future iterations once feasibility had been established. Finally, we were aware that we were constructing a medical decision support tool rather than a simple classifier.[26] As such, the optimal model was not purely driven by discriminative ability, but also by our subjective assessment of the optimal trade‐off between sensitivity and specificity (the test‐treatment threshold) for such a model.[26] To facilitate model assessment, we thus categorized the potential predictor variables and evaluated the test characteristics of each combination of categorized variables. Although the C statistic of a model using continuous variables will be higher than a model using categorical values, model performance at the chosen trade‐off point is unlikely to be different.
Although the overall predictive ability of our model was fair, we found that it was associated with clinically meaningful differences in readmission rates between those triggering and not triggering the flag. The 30‐day all‐cause readmission rate in the 12‐month prospective sample was 15.1%, yet among those flagged as being at high risk for readmission the readmission rate was 30.4%. Given resource constraints and the need to selectively apply potentially costly care transition interventions, this may in practice translate into a meaningful discriminative ability.
Readmission rates did not change significantly during the study period. A number of plausible reasons for this exist, including: (1) the current model may not exhibit sufficient predictive ability to classify those at high risk or impact the behavior of providers appropriately, (2) those patients classified as high risk of readmission may not be at high risk of readmissions that are preventable, (3) information provided by the model may not yet routinely be used such that it can affect care, or (4) providing readmission risk assessment alone is not sufficient to influence readmission rates, and the other interventions or organizational changes necessary to impact care of those defined as high risk have not yet been implemented or are not yet being performed routinely. If the primary reasons for our results are those outlined in numbers 3 or 4, then readmission rates should improve over time as the risk flag becomes more routinely used, and those interventions necessary to impact readmission rates of those defined as high risk are implemented and performed.
Limitations
There are several limitations of this intervention. First, the prediction model was developed using 30‐day all‐cause readmissions, rather than attempting to identify potentially preventable readmissions. Thirty‐day readmission rates may not be a good proxy for preventable readmissions,[18] and as a consequence, the ability to predict 30‐day readmissions may not ensure that a prediction model is able to predict preventable readmissions. Nonetheless, 30‐day readmission rates remain the most commonly used quality metric.
Second, the impact of the risk flag on provider behavior is uncertain. We did not formally assess how the readmission risk flag was used by healthcare team members. Informal assessment has, however, revealed that the readmission risk flag is gradually being adopted by different members of the care team including unit‐based pharmacists who are using the flag to prioritize the delivery of medication education, social workers who are using the flag to prompt providers to consider higher level services for patients at high risk of readmission, and patient navigators who are using the flag to prioritize follow‐up phone calls. As a result, we hope that the flag will ultimately improve the processes of care for high‐risk patients.
Third, we did not capture readmissions to hospitals outside of our healthcare system and have therefore underestimated the readmission rate in our population. However, our assessment of the effect of the risk flag on readmissions focused on relative readmission rates over time, and the use of the interrupted time series methodology should protect against secular changes in outside hospital readmission rates that were not associated with the intervention.
Fourth, it is possible that the prediction model implemented could be significantly improved by including additional variables or data available during the hospital stay. However, simple classification models using a single variable have repeatedly been shown to have the ability to compete favorably with state‐of‐the‐art multivariable classification models.[28]
Fifth, our study was limited to a single academic health system, and our experience may not be generalizable to smaller healthcare systems with limited EHR systems. However, the simplicity of our prediction model and the integration into a commercial EHR may improve the generalizability of our experience to other healthcare settings. Additionally, partly due to recent policy initiatives, the adoption of integrated EHR systems by hospitals is expected to continue at a rapid rate and become the standard of care within the near future.[29]
CONCLUSION
An automated prediction model was effectively integrated into an existing EHR and was able to identify patients on admission who are at risk for readmission within 30 days of discharge. Future work will aim to further examine the impact of the flag on readmission rates, further refine the prediction model, and gather data on how providers and care teams use the information provided by the flag.
Disclosure
Dr. Umscheid‐s contribution to this project was supported in part by the National Center for Research Resources, Grant UL1RR024134, which is now at the National Center for Advancing Translational Sciences, Grant UL1TR000003. The content of this paper is solely the responsibility of the authors and does not necessarily represent the official views of the NIH.
Unplanned hospital readmissions are common, costly, and potentially avoidable. Approximately 20% of Medicare patients are readmitted within 30 days of discharge.[1] Readmission rates are estimated to be similarly high in other population subgroups,[2, 3, 4] with approximately 80% of patients[1, 5, 6] readmitted to the original discharging hospital. A recent systematic review suggested that 27% of readmissions may be preventable.[7]
Hospital readmissions have increasingly been viewed as a correctable marker of poor quality care and have been adopted by a number of organizations as quality indicators.[8, 9, 10] As a result, hospitals have important internal and external motivations to address readmissions. Identification of patients at high risk for readmissions may be an important first step toward preventing them. In particular, readmission risk assessment could be used to help providers target the delivery of resource‐intensive transitional care interventions[11, 12, 13, 14] to patients with the greatest needs. Such an approach is appealing because it allows hospitals to focus scarce resources where the impact may be greatest and provides a starting point for organizations struggling to develop robust models of transitional care delivery.
Electronic health records (EHRs) may prove to be an important component of strategies designed to risk stratify patients at the point of care. Algorithms integrated into the EHR that automatically generate risk predictions have the potential to (1) improve provider time efficiency by automating the prediction process, (2) improve consistency of data collection and risk score calculation, (3) increase adoption through improved usability, and (4) provide clinically important information in real‐time to all healthcare team members caring for a hospitalized patient.
We thus sought to derive a predictive model for 30‐day readmissions using data reliably present in our EHR at the time of admission, and integrate this predictive model into our hospital's EHR to create an automated prediction tool that identifies on admission patients at high risk for readmission within 30 days of discharge. In addition, we prospectively validated this model using the 12‐month period after implementation and examined the impact on readmissions.
METHODS
Setting
The University of Pennsylvania Health System (UPHS) includes 3 hospitals, with a combined capacity of over 1500 beds and 70,000 annual admissions. All hospitals currently utilize Sunrise Clinical Manager version 5.5 (Allscripts, Chicago, IL) as their EHR. The study sample included all adult admissions to any of the 3 UPHS hospitals during the study period. Admissions to short procedure, rehabilitation, and hospice units were excluded. The study received expedited approval and a HIPAA waiver from the University of Pennsylvania institutional review board.
Development of Predictive Model
The UPHS Center for Evidence‐based Practice[15, 16] performed a systematic review to identify factors associated with hospital readmission within 30 days of discharge. We then examined the data available from our hospital EHR at the time of admission for those factors identified in the review. Using different threshold values and look‐back periods, we developed and tested 30 candidate prediction models using these variables alone and in combination (Table 1). Prediction models were evaluated using 24 months of historical data between August 1, 2009 and August 1, 2011.
Implementation
An automated readmission risk flag was then integrated into the EHR. Patients classified as being at high risk for readmission with the automated prediction model were flagged in the EHR on admission (Figure 1A). The flag can be double‐clicked to display a separate screen with information relevant to discharge planning including inpatient and emergency department (ED) visits in the prior 12 months, as well as information about the primary team, length of stay, and admitting problem associated with those admissions (Figure 1B). The prediction model was integrated into our EHR using Arden Syntax for Medical Logic Modules.[17] The readmission risk screen involved presenting the provider with a new screen and was thus developed in Microsoft .NET using C# and Windows Forms (Microsoft Corp., Redmond, WA).
The flag was visible on the patient lists of all providers who utilized the EHR. This included but was not limited to nurses, social workers, unit pharmacists, and physicians. At the time of implementation, educational events regarding the readmission risk flag were provided in forums targeting administrators, pharmacists, social workers, and housestaff. Information about the flag and recommendations for use were distributed through emails and broadcast screensaver messages disseminated throughout the inpatient units of the health system. Providers were asked to pay special attention to discharge planning for patients triggering the readmission risk flag, including medication reconciliation by pharmacists for these patients prior to discharge, and arrangement of available home services by social workers.
The risk flag was 1 of 4 classes of interventions developed and endorsed by the health system in its efforts to reduce readmissions. Besides risk stratification, the other classes were: interdisciplinary rounding, patient education, and discharge communication. None of the interventions alone were expected to decrease readmissions, but as all 4 classes of interventions were implemented and performed routinely, the expectation was that they would work in concert to reduce readmissions.
Analysis
The primary outcome was all‐cause hospital readmissions in the healthcare system within 30 days of discharge. Although this outcome is commonly used both in the literature and as a quality metric, significant debate persists as to the appropriateness of this metric.[18] Many of the factors driving 30‐day readmissions may be dependent on factors outside of the discharging hospital's control and it has been argued that nearer‐term, nonelective readmission rates may provide a more meaningful quality metric.[18] Seven‐day unplanned readmissions were thus used as a secondary outcome measure for this study.
Sensitivity, specificity, predictive value, C statistic, F score (the harmonic mean of positive predictive value and sensitivity),[19] and screen‐positive rate were calculated for each of the 30 prediction models evaluated using the historical data. The prediction model with the best balance of F score and screen‐positive rate was selected as the prediction model to be integrated into the EHR. Prospective validation of the selected prediction model was performed using the 12‐month period following implementation of the risk flag (September 2011September 2012).
To assess the impact of the automated prediction model on monthly readmission rate, we used the 24‐month period immediately before and the 12‐month period immediately after implementation of the readmission risk flag. Segmented regression analysis was performed testing for changes in level and slope of readmission rates between preimplementation and postimplementation time periods. This quasiexperimental interrupted time series methodology[20] allows us to control for secular trends in readmission rates and to assess the preimplementation trend (secular trend), the difference in rates immediately before and after the implementation (immediate effect), and the postimplementation change over time (sustained effect). We used Cochrane‐Orcutt estimation[21] to correct for serial autocorrelation.
All analyses were performed using Stata 12.1 software (Stata Corp, College Station, TX).
RESULTS
Predictors of Readmission
Our systematic review of the literature identified several patient and healthcare utilization patterns predictive of 30‐day readmission risk. Utilization factors included length of stay, number of prior admissions, previous 30‐day readmissions, and previous ED visits. Patient characteristics included number of comorbidities, living alone, and payor. Evidence was inconsistent regarding threshold values for these variables.
Many variables readily available in our EHR were either found by the systematic review not to be reliably predictive of 30‐day readmission (including age and gender) or were not readily or reliably available on admission (including length of stay and payor). At the time of implementation, our EHR did not include vital sign or nursing assessment variables, so these were not considered for inclusion in our model.
Of the available variables, 3 were consistently accurate and available in the EHR at the time of patient admission: prior hospital admission, emergency department visit, and 30‐day readmission within UPHS. We then developed 30 candidate prediction models using a combination of these variables, including 1 and 2 prior admissions, ED visits, and 30‐day readmissions in the 6 and 12 months preceding the index visit (Table 1).
Development and Validation
We used 24 months of retrospective data, which included 120,396 discharges with 17,337 thirty‐day readmissions (14.4% 30‐day all‐cause readmission rate) to test the candidate prediction models. A single risk factor, 2 inpatient admissions in the past 12 months, was found to have the best balance of sensitivity (40%), positive predictive value (31%), and proportion of patients flagged (18%) (Table 1).
| Sensitivity | Specificity | C Statistic | PPV | NPV | Screen Positive | F Score | |
|---|---|---|---|---|---|---|---|
| |||||||
| Retrospective Evaluation of Prediction Rules Lookback period: 6 months | |||||||
| Prior Admissions | |||||||
| 1 | 53% | 74% | 0.640 | 26% | 91% | 30% | 0.350 |
| 2 | 32% | 90% | 0.610 | 35% | 89% | 13% | 0.333 |
| 3 | 20% | 96% | 0.578 | 44% | 88% | 7% | 0.274 |
| Prior ED Visits | |||||||
| 1 | 31% | 81% | 0.558 | 21% | 87% | 21% | 0.252 |
| 2 | 13% | 93% | 0.532 | 25% | 87% | 8% | 0.172 |
| 3 | 7% | 97% | 0.519 | 27% | 86% | 4% | 0.111 |
| Prior 30‐day Readmissions | |||||||
| 1 | 39% | 85% | 0.623 | 31% | 89% | 18% | 0.347 |
| 2 | 21% | 95% | 0.582 | 43% | 88% | 7% | 0.284 |
| 3 | 13% | 98% | 0.555 | 53% | 87% | 4% | 0.208 |
| Combined Rules | |||||||
| Admit1 & ED1 | 22% | 92% | 0.568 | 31% | 88% | 10% | 0.255 |
| Admit2 & ED1 | 15% | 96% | 0.556 | 40% | 87% | 5% | 0.217 |
| Admit1 & 30‐day1 | 39% | 85% | 0.623 | 31% | 89% | 18% | 0.346 |
| Admit2 & 30‐day1 | 29% | 92% | 0.603 | 37% | 89% | 11% | 0.324 |
| 30‐day1 & ED1 | 17% | 95% | 0.559 | 37% | 87% | 6% | 0.229 |
| 30‐day1 & ED2 | 8% | 98% | 0.527 | 40% | 86% | 3% | 0.132 |
| Lookback period: 12 months | |||||||
| Prior Admission | |||||||
| 1 | 60% | 68% | 0.593 | 24% | 91% | 36% | 0.340 |
| 2a | 40% | 85% | 0.624 | 31% | 89% | 18% | 0.354 |
| 3 | 28% | 92% | 0.600 | 37% | 88% | 11% | 0.318 |
| Prior ED Visit | |||||||
| 1 | 38% | 74% | 0.560 | 20% | 88% | 28% | 0.260 |
| 2 | 20% | 88% | 0.544 | 23% | 87% | 13% | 0.215 |
| 3 | 8% | 96% | 0.523 | 27% | 86% | 4% | 0.126 |
| Prior 30‐day Readmission | |||||||
| 1 | 43% | 84% | 0.630 | 30% | 90% | 20% | 0.353 |
| 2 | 24% | 94% | 0.592 | 41% | 88% | 9% | 0.305 |
| 3 | 11% | 98% | 0.548 | 54% | 87% | 3% | 0.186 |
| Combined Rules | |||||||
| Admit1 & ED1 | 29% | 87% | 0.580 | 27% | 88% | 15% | 0.281 |
| Admit2 & ED1 | 22% | 93% | 0.574 | 34% | 88% | 9% | 0.266 |
| Admit1 & 30‐day1 | 42% | 84% | 0.630 | 30% | 90% | 14% | 0.353 |
| Admit2 & 30‐day1 | 34% | 89% | 0.615 | 34% | 89% | 14% | 0.341 |
| 30‐day1 & ED1 | 21% | 93% | 0.569 | 35% | 88% | 9% | 0.261 |
| 30‐day1 & ED2 | 13% | 96% | 0.545 | 37% | 87% | 5% | 0.187 |
| Prospective Evaluation of Prediction Rule | |||||||
| 30‐Day All‐Cause | 39% | 84% | 0.614 | 30% | 89% | 18% | 0.339 |
Prospective validation of the prediction model was performed using the 12‐month period directly following readmission risk flag implementation. During this period, the 30‐day all‐cause readmission rate was 15.1%. Sensitivity (39%), positive predictive value (30%), and proportion of patients flagged (18%) were consistent with the values derived from the retrospective data, supporting the reproducibility and predictive stability of the chosen risk prediction model (Table 1). The C statistic of the model was also consistent between the retrospective and prospective datasets (0.62 and 0.61, respectively).
Readmission Rates
The mean 30‐day all‐cause readmission rate for the 24‐month period prior to the intervention was 14.4%, whereas the mean for the 12‐month period after the implementation was 15.1%. Thirty‐day all‐cause and 7‐day unplanned monthly readmission rates do not appear to have been impacted by the intervention (Figure 2). There was no evidence for either an immediate or sustained effect (Table 2).
| Hospital | Preimplementation Period | Immediate Effect | Postimplementation Period | P Value Change in Trenda | |||||
|---|---|---|---|---|---|---|---|---|---|
| Monthly % Change in Readmission Rates | P Value | Immediate % Change | P Value | Monthly % Change in Readmission Rates | P Value | ||||
| |||||||||
| 30‐Day All‐Cause Readmission Rates | |||||||||
| Hosp A | 0.023 | Stable | 0.153 | 0.480 | 0.991 | 0.100 | Increasing | 0.044 | 0.134 |
| Hosp B | 0.061 | Increasing | 0.002 | 0.492 | 0.125 | 0.060 | Stable | 0.296 | 0.048 |
| Hosp C | 0.026 | Stable | 0.413 | 0.447 | 0.585 | 0.046 | Stable | 0.629 | 0.476 |
| Health System | 0.032 | Increasing | 0.014 | 0.344 | 0.302 | 0.026 | Stable | 0.499 | 0.881 |
| 7‐Day Unplanned Readmission Rates | |||||||||
| Hosp A | 0.004 | Stable | 0.642 | 0.271 | 0.417 | 0.005 | Stable | 0.891 | 0.967 |
| Hosp B | 0.012 | Stable | 0.201 | 0.298 | 0.489 | 0.038 | Stable | 0.429 | 0.602 |
| Hosp C | 0.008 | Stable | 0.213 | 0.353 | 0.204 | 0.004 | Stable | 0.895 | 0.899 |
| Health System | 0.005 | Stable | 0.358 | 0.003 | 0.990 | 0.010 | Stable | 0.712 | 0.583 |
DISCUSSION
In this proof‐of‐concept study, we demonstrated the feasibility of an automated readmission risk prediction model integrated into a health system's EHR for a mixed population of hospitalized medical and surgical patients. To our knowledge, this is the first study in a general population of hospitalized patients to examine the impact of providing readmission risk assessment on readmission rates. We used a simple prediction model potentially generalizable to EHRs and healthcare populations beyond our own.
Existing risk prediction models for hospital readmission have important limitations and are difficult to implement in clinical practice.[22] Prediction models for hospital readmission are often dependent on retrospective claims data, developed for specific patient populations, and not designed for use early in the course of hospitalization when transitional care interventions can be initiated.[22] In addition, the time required to gather the necessary data and calculate the risk score remains a barrier to the adoption of prediction models in practice. By automating the process of readmission risk prediction, we were able to help integrate risk assessment into the healthcare process across many providers in a large multihospital healthcare organization. This has allowed us to consistently share risk assessment in real time with all members of the inpatient team, facilitating a team‐based approach to discharge planning.[23]
Two prior studies have developed readmission risk prediction models designed to be implemented into the EHR. Amarasingham et al.[24] developed and implemented[25] a heart failure‐specific prediction model based on the 18‐item Tabak mortality score.[26] Bradley et al.[27] studied in a broader population of medicine and surgery patients the predictive ability of a 26‐item score that utilized vital sign, cardiac rhythm, and nursing assessment data. Although EHRs are developing rapidly, currently the majority of EHRs do not support the use of many of the variables used in these models. In addition, both models were complex, raising concerns about generalizability to other healthcare settings and populations.
A distinctive characteristic of our model is its simplicity. We were cognizant of the realities of running a prediction model in a high‐volume production environment and the diminishing returns of adding more variables. We thus favored simplicity at all stages of model development, with the associated belief that complexity could be added with future iterations once feasibility had been established. Finally, we were aware that we were constructing a medical decision support tool rather than a simple classifier.[26] As such, the optimal model was not purely driven by discriminative ability, but also by our subjective assessment of the optimal trade‐off between sensitivity and specificity (the test‐treatment threshold) for such a model.[26] To facilitate model assessment, we thus categorized the potential predictor variables and evaluated the test characteristics of each combination of categorized variables. Although the C statistic of a model using continuous variables will be higher than a model using categorical values, model performance at the chosen trade‐off point is unlikely to be different.
Although the overall predictive ability of our model was fair, we found that it was associated with clinically meaningful differences in readmission rates between those triggering and not triggering the flag. The 30‐day all‐cause readmission rate in the 12‐month prospective sample was 15.1%, yet among those flagged as being at high risk for readmission the readmission rate was 30.4%. Given resource constraints and the need to selectively apply potentially costly care transition interventions, this may in practice translate into a meaningful discriminative ability.
Readmission rates did not change significantly during the study period. A number of plausible reasons for this exist, including: (1) the current model may not exhibit sufficient predictive ability to classify those at high risk or impact the behavior of providers appropriately, (2) those patients classified as high risk of readmission may not be at high risk of readmissions that are preventable, (3) information provided by the model may not yet routinely be used such that it can affect care, or (4) providing readmission risk assessment alone is not sufficient to influence readmission rates, and the other interventions or organizational changes necessary to impact care of those defined as high risk have not yet been implemented or are not yet being performed routinely. If the primary reasons for our results are those outlined in numbers 3 or 4, then readmission rates should improve over time as the risk flag becomes more routinely used, and those interventions necessary to impact readmission rates of those defined as high risk are implemented and performed.
Limitations
There are several limitations of this intervention. First, the prediction model was developed using 30‐day all‐cause readmissions, rather than attempting to identify potentially preventable readmissions. Thirty‐day readmission rates may not be a good proxy for preventable readmissions,[18] and as a consequence, the ability to predict 30‐day readmissions may not ensure that a prediction model is able to predict preventable readmissions. Nonetheless, 30‐day readmission rates remain the most commonly used quality metric.
Second, the impact of the risk flag on provider behavior is uncertain. We did not formally assess how the readmission risk flag was used by healthcare team members. Informal assessment has, however, revealed that the readmission risk flag is gradually being adopted by different members of the care team including unit‐based pharmacists who are using the flag to prioritize the delivery of medication education, social workers who are using the flag to prompt providers to consider higher level services for patients at high risk of readmission, and patient navigators who are using the flag to prioritize follow‐up phone calls. As a result, we hope that the flag will ultimately improve the processes of care for high‐risk patients.
Third, we did not capture readmissions to hospitals outside of our healthcare system and have therefore underestimated the readmission rate in our population. However, our assessment of the effect of the risk flag on readmissions focused on relative readmission rates over time, and the use of the interrupted time series methodology should protect against secular changes in outside hospital readmission rates that were not associated with the intervention.
Fourth, it is possible that the prediction model implemented could be significantly improved by including additional variables or data available during the hospital stay. However, simple classification models using a single variable have repeatedly been shown to have the ability to compete favorably with state‐of‐the‐art multivariable classification models.[28]
Fifth, our study was limited to a single academic health system, and our experience may not be generalizable to smaller healthcare systems with limited EHR systems. However, the simplicity of our prediction model and the integration into a commercial EHR may improve the generalizability of our experience to other healthcare settings. Additionally, partly due to recent policy initiatives, the adoption of integrated EHR systems by hospitals is expected to continue at a rapid rate and become the standard of care within the near future.[29]
CONCLUSION
An automated prediction model was effectively integrated into an existing EHR and was able to identify patients on admission who are at risk for readmission within 30 days of discharge. Future work will aim to further examine the impact of the flag on readmission rates, further refine the prediction model, and gather data on how providers and care teams use the information provided by the flag.
Disclosure
Dr. Umscheid‐s contribution to this project was supported in part by the National Center for Research Resources, Grant UL1RR024134, which is now at the National Center for Advancing Translational Sciences, Grant UL1TR000003. The content of this paper is solely the responsibility of the authors and does not necessarily represent the official views of the NIH.
- , , . Rehospitalizations among patients in the Medicare fee‐for‐service program. N Engl J Med. 2009;360(14):1418–1428.
- , . Hospital readmissions as a measure of quality of health care: advantages and limitations. Arch Intern Med. 2000;160(8):1074–1081.
- , , , , . Do older rural and urban veterans experience different rates of unplanned readmission to VA and non‐VA hospitals? J Rural Health. 2009;25(1):62–69.
- , , . Cost, causes and rates of rehospitalization of preterm infants. J Perinatol. 2007;27(10):614–619.
- , , , . Redefining readmission risk factors for general medicine patients. J Hosp Med. 2011;6(2):54–60.
- , , , et al. Incidence and main factors associated with early unplanned hospital readmission among French medical inpatients aged 75 and over admitted through emergency units. Age Ageing. 2008;37(4):416–422.
- , , , , . Proportion of hospital readmissions deemed avoidable: a systematic review. CMAJ. 2011;183(7):E391–E402.
- Hospital Quality Alliance. Available at: http://www.hospitalqualityalliance.org/hospitalqualityalliance/qualitymeasures/qualitymeasures.html. Accessed March 6, 2013.
- Institute for Healthcare Improvement. Available at: http://www.ihi.org/explore/Readmissions/Pages/default.aspx. Accessed March 6, 2013.
- Centers for Medicare and Medicaid Services. Available at: http://www.cms.gov/Medicare/Quality‐Initiatives‐Patient‐Assessment‐Instruments/HospitalQualityInits/OutcomeMeasures.html. Accessed March 6, 2013.
- , , , et al. Comprehensive discharge planning and home follow‐up of hospitalized elders: a randomized clinical trial. JAMA. 1999;281(7):613–620.
- , , , , , . Preparing patients and caregivers to participate in care delivered across settings: the Care Transitions Intervention. J Am Geriatr Soc. 2004;52(11):1817–1825.
- , , , , . The importance of transitional care in achieving health reform. Health Aff (Millwood). 2011;30(4):746–754.
- , , , , . Interventions to reduce 30‐day rehospitalization: a systematic review. Ann Intern Med. 2011;155(8):520–528.
- University of Pennsylvania Health System Center for Evidence‐based Practice. Available at: http://www.uphs.upenn.edu/cep/. Accessed March 6, 2013.
- , , . Hospital‐based comparative effectiveness centers: translating research into practice to improve the quality, safety and value of patient care. J Gen Intern Med. 2010;25(12):1352–1355.
- . Writing Arden Syntax Medical Logic Modules. Comput Biol Med. 1994;24(5):331–363.
- , . Thirty‐day readmissions—truth and consequences. N Engl J Med. 2012;366(15):1366–1369.
- . Information Retrieval. 2nd ed. Oxford, UK: Butterworth‐Heinemann; 1979.
- , , , . Segmented regression analysis of interrupted time series studies in medication use research. J Clin Pharm Ther. 2002;27(4):299–309.
- , . Application of least squares regression to relationships containing auto‐correlated error terms. J Am Stat Assoc. 1949; 44:32–61.
- , , , et al. Risk prediction models for hospital readmission: a systematic review. JAMA. 2011;306(15):1688–1698.
- , , , et al. Core Principles and values of effective team‐based health care. Available at: https://www.nationalahec.org/pdfs/VSRT‐Team‐Based‐Care‐Principles‐Values.pdf. Accessed March 19, 2013.
- , , , et al. An automated model to identify heart failure patients at risk for 30‐day readmission or death using electronic medical record data. Med Care. 2010;48(11):981–988.
- , , , et al. Allocating scarce resources in real‐time to reduce heart failure readmissions: a prospective, controlled study [published online ahead of print July 31, 2013]. BMJ Qual Saf. doi:10.1136/bmjqs‐2013‐001901.
- , . The threshold approach to clinical decision making. N Engl J Med. 1980;302(20):1109–1117.
- , , , , . Identifying patients at increased risk for unplanned readmission. Med Care. 2013;51(9):761–766.
- . Very simple classification rules perform well on most commonly used datasets. Mach Learn. 1993;11(1):63–91.
- . Stimulating the adoption of health information technology. N Engl J Med. 2009;360(15):1477–1479.
- , , . Rehospitalizations among patients in the Medicare fee‐for‐service program. N Engl J Med. 2009;360(14):1418–1428.
- , . Hospital readmissions as a measure of quality of health care: advantages and limitations. Arch Intern Med. 2000;160(8):1074–1081.
- , , , , . Do older rural and urban veterans experience different rates of unplanned readmission to VA and non‐VA hospitals? J Rural Health. 2009;25(1):62–69.
- , , . Cost, causes and rates of rehospitalization of preterm infants. J Perinatol. 2007;27(10):614–619.
- , , , . Redefining readmission risk factors for general medicine patients. J Hosp Med. 2011;6(2):54–60.
- , , , et al. Incidence and main factors associated with early unplanned hospital readmission among French medical inpatients aged 75 and over admitted through emergency units. Age Ageing. 2008;37(4):416–422.
- , , , , . Proportion of hospital readmissions deemed avoidable: a systematic review. CMAJ. 2011;183(7):E391–E402.
- Hospital Quality Alliance. Available at: http://www.hospitalqualityalliance.org/hospitalqualityalliance/qualitymeasures/qualitymeasures.html. Accessed March 6, 2013.
- Institute for Healthcare Improvement. Available at: http://www.ihi.org/explore/Readmissions/Pages/default.aspx. Accessed March 6, 2013.
- Centers for Medicare and Medicaid Services. Available at: http://www.cms.gov/Medicare/Quality‐Initiatives‐Patient‐Assessment‐Instruments/HospitalQualityInits/OutcomeMeasures.html. Accessed March 6, 2013.
- , , , et al. Comprehensive discharge planning and home follow‐up of hospitalized elders: a randomized clinical trial. JAMA. 1999;281(7):613–620.
- , , , , , . Preparing patients and caregivers to participate in care delivered across settings: the Care Transitions Intervention. J Am Geriatr Soc. 2004;52(11):1817–1825.
- , , , , . The importance of transitional care in achieving health reform. Health Aff (Millwood). 2011;30(4):746–754.
- , , , , . Interventions to reduce 30‐day rehospitalization: a systematic review. Ann Intern Med. 2011;155(8):520–528.
- University of Pennsylvania Health System Center for Evidence‐based Practice. Available at: http://www.uphs.upenn.edu/cep/. Accessed March 6, 2013.
- , , . Hospital‐based comparative effectiveness centers: translating research into practice to improve the quality, safety and value of patient care. J Gen Intern Med. 2010;25(12):1352–1355.
- . Writing Arden Syntax Medical Logic Modules. Comput Biol Med. 1994;24(5):331–363.
- , . Thirty‐day readmissions—truth and consequences. N Engl J Med. 2012;366(15):1366–1369.
- . Information Retrieval. 2nd ed. Oxford, UK: Butterworth‐Heinemann; 1979.
- , , , . Segmented regression analysis of interrupted time series studies in medication use research. J Clin Pharm Ther. 2002;27(4):299–309.
- , . Application of least squares regression to relationships containing auto‐correlated error terms. J Am Stat Assoc. 1949; 44:32–61.
- , , , et al. Risk prediction models for hospital readmission: a systematic review. JAMA. 2011;306(15):1688–1698.
- , , , et al. Core Principles and values of effective team‐based health care. Available at: https://www.nationalahec.org/pdfs/VSRT‐Team‐Based‐Care‐Principles‐Values.pdf. Accessed March 19, 2013.
- , , , et al. An automated model to identify heart failure patients at risk for 30‐day readmission or death using electronic medical record data. Med Care. 2010;48(11):981–988.
- , , , et al. Allocating scarce resources in real‐time to reduce heart failure readmissions: a prospective, controlled study [published online ahead of print July 31, 2013]. BMJ Qual Saf. doi:10.1136/bmjqs‐2013‐001901.
- , . The threshold approach to clinical decision making. N Engl J Med. 1980;302(20):1109–1117.
- , , , , . Identifying patients at increased risk for unplanned readmission. Med Care. 2013;51(9):761–766.
- . Very simple classification rules perform well on most commonly used datasets. Mach Learn. 1993;11(1):63–91.
- . Stimulating the adoption of health information technology. N Engl J Med. 2009;360(15):1477–1479.
© 2013 Society of Hospital Medicine
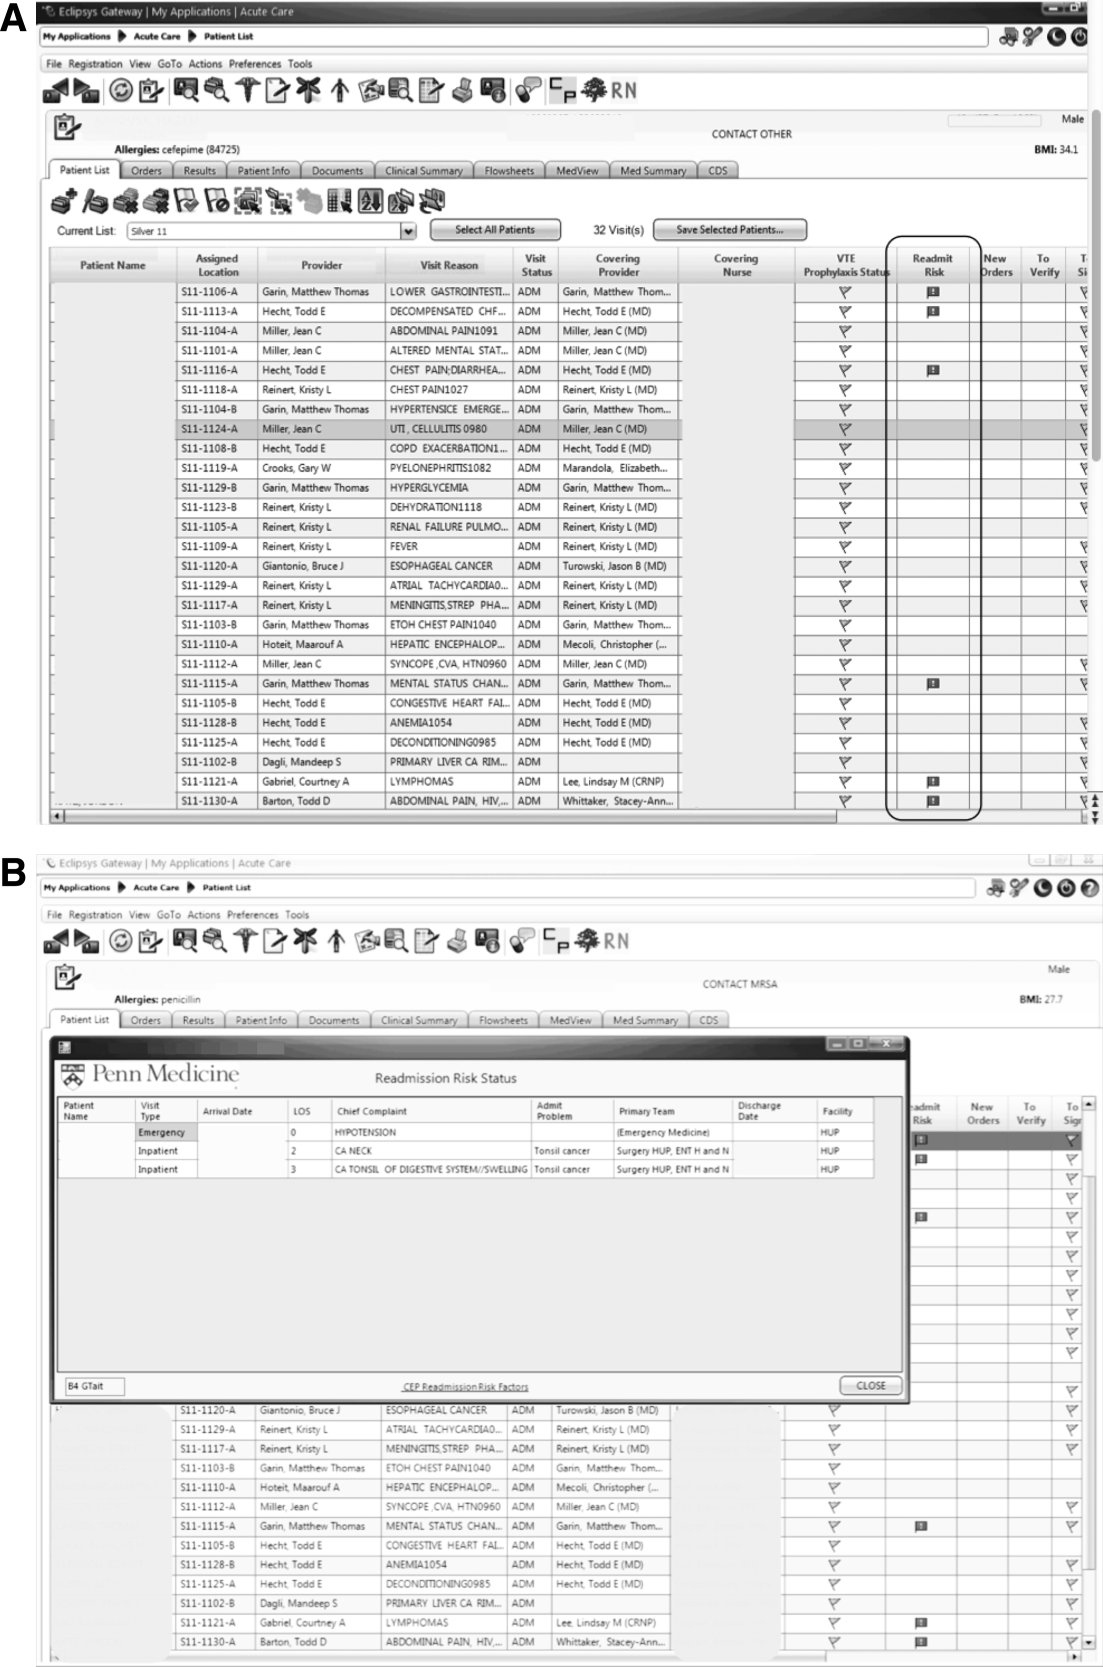
Caring for Patients on Insulin Pumps
Delivery of insulin via continuous subcutaneous insulin infusion (CSII), or insulin pump, has gained wide acceptance. It is estimated that 400,000 patients with type 1 diabetes mellitus (T1DM) are using insulin pumps.[1] A registry for T1DM in the United States indicated that 50% of the 25,833 participants were using an insulin pump.[2] Use of CSII in type 2 DM (T2DM) is also increasing.[3]
Patients with DM are 3 as likely to be hospitalized than patients without DM.[4] Twenty percent to 30% of adult hospitalized patients have a known diagnosis of DM.[5] It is therefore to be expected that patients on CSII will be seen with increased frequency in the hospital setting. This leads to potential difficultiesinpatient healthcare providers may not be familiar with insulin pumps, and patients may not be aware of complexities associated with pump usage in the hospital.
This article will review CSII usage in the hospital, offering strategies for management in partnership with the patient based on our experiences and processes developed in our institution.
SHOULD CONTINUOUS SUBCUTANEOUS INSULIN INFUSION BE CONTINUED IN THE HOSPITAL?
The American Diabetes Association advocates (1) allowing patients who are physically and mentally able to continue CSII when hospitalized, (2) having a hospital policy for CSII use, and (3) having hospital personnel with expertise on pump management.[6] The American Association of Clinical Endocrinologists echoes much of the same and suggests contacting the specialist responsible for the pump in the ambulatory setting for decisions on adjustments in the hospitalized patient,[7] which at times may not be feasible.
The logic and benefits of basal‐bolus insulin dosing (ie, giving basal insulin to account for fasting requirements, plus bolus insulin to cover nutritional and correctional needs) have been well‐described.[8, 9, 10] In randomized clinical trials on patients admitted to general medical and surgical floors, basal‐bolus insulin (long‐acting basal insulin plus mealtime fast‐acting insulin injections) resulted in better glycemic control and reduced infection rates compared with sliding‐scale therapy (waiting for high blood glucoses before giving insulin, instead of giving it proactively to prevent hyperglycemia).[9, 10] At present, insulin delivery via the insulin pump is the best commercially available method to deliver insulin in a basal‐bolus manner in ambulatory patients. It thus makes sense to continue CSII in the hospital if patients are able to manage their pumps, though there are no randomized trials answering this question as of yet.
Studies on insulin pumps in the hospital are sparse. In one group's latest retrospective study of 136 patients over a 6‐year period, CSII was continued during the entire hospital stay in 65% of the hospitalizations, was used intermittently in 20%, and was discontinued with alternative insulin regimens given in 15%.[11] Mean glucose was 178 47 mg/dL (mean standard deviation), with no significant difference between groups. There were fewer episodes of severe hyperglycemia among those who continued on the pump compared with the other groups, and fewer episodes of hypoglycemia in those who continued on vs those taken off the pump. There was 1 episode of an infusion catheter kinking, resulting in nonfatal hyperglycemia, but no reported pump‐site infections, mechanical pump failure, or diabetic ketoacidosis (DKA) among patients remaining on CSII.
CLINICAL VIGNETTES
The following cases illustrate potential challenges with CSII use that we have encountered in the hospital.
The Patient Needing Transition to Multiple Daily Insulin Injections
A 29‐year‐old male with T1DM, on CSII, was admitted for fever and chills. His latest glycated hemoglobin (HbA1c) level was 6.8%. His glucose levels started rising, and he wished to be taken off the insulin pump. He was started by the primary team on multiple daily insulin injections (MDII) with insulin glargine and insulin lispro. His glucose levels continued to rise, so an intravenous (IV) insulin infusion was started. Endocrinology was then consulted. The patient's condition was concerning for the potential development of DKA, so he was kept on IV insulin. When he was ready for transitioning to subcutaneous insulin, the pump had been taken home by a family member, and the patient could not recall his CSII basal rates but knew his total basal insulin dose, carbohydrate ratio, and sensitivity factor. Endocrinology assisted in transitioning him from the insulin infusion to MDII based on these recalled doses. When the insulin pump was available, the pump settings were interrogated, and he was transitioned back to it.
Key points:
- Having key hospital personnel trained on CSII, including interrogating the pump's settings, facilitates the transitioning of these patients from one hospital unit, or level of care, to another.
- Accessing the pump's settings involves pushing several buttons on the insulin pump. Because key hospital personnel will encounter patients on different insulin pumps, it may be helpful to keep menu maps handy as a quick reference. A menu map will show at a glance where certain information can be found, such as the basal insulin rate or the sensitivity factor (see examples in Figures 1 and 2).[12, 13]
- Knowing the HbA1c will help determine if pump use has been effective.

The Patient With Technical Problems
An 84‐year‐old gentleman with T2DM was admitted for heart failure and aortic valve replacement. His HbA1c was 6.2%, and he had had several outpatient hypoglycemic events. While on CSII in the hospital, his point of care testing (POCT) glucose readings ranged from 105 to 260 mg/dL. On the afternoon of the third hospital day, POCT readings stayed above 220 mg/dL and rose to 348 mg/dL on the fourth hospital morning, despite multiple blousing and changing the insulin, insertion site, reservoir cartridge, and pump tubing. There was no evidence of infection and no medication change that would have impacted glucose levels. Review of his procedures revealed that he had undergone computed tomography (CT) on the morning of hospital day 3 and wore his pump while being scanned. The pump company was notified.
Key points:
- Patients, and medical and nursing staff, should be reminded to remove insulin pumps for CT scans, magnetic resonance imaging, x‐rays, or other tests with high electromagnetic fields.
- If there is a suspicion of pump malfunction from such a procedure, notify the pump company.
The Patient Who Can Benefit From Inpatient Education
A 70‐year‐old female with T1DM was admitted for heart failure. The patient had been using CSII for 20 years. Her latest HbA1c was 6.9%. She had 1 hypoglycemic event every 1 to 2 weeks. In the hospital, she experienced 2 hypoglycemic events within 3 days, both around bedtime. It was discovered that the patient was giving a bolus of insulin for elevated glucose levels based on the hospital POCT, and when the meal arrived (3060 minutes later), she again delivered a bolus based on her own glucometer reading plus insulin based on the carbohydrates in her meal. The patient was then instructed to request the POCT when her meal tray arrived, and she was taught how to use the pump's built‐in calculator. Glucose excursions improved.
Key points:
- Patients on CSII, though able to exercise autonomy in managing their insulin doses, may also need assistance in dosing insulin properly.
- Although pump education is ideally done on an outpatient basis, hospital‐based providers may encounter patients who need reinforcement of their training while hospitalized. Hospital personnel trained on insulin pumps (such as physicians, nurse practitioners, physician assistants, and certified diabetes educators) can help augment the patient's knowledge while in the hospital. In the absence of such key personnel, patient safety has to be addressed with re‐evaluation of the need to discontinue the pump and switch to multiple doses of subcutaneous insulin.
STEPS IN TAKING CARE OF PATIENTS ON CONTINUOUS SUBCUTANEOUS INSULIN INFUSION
Initial Patient Assessment
On admission, patients are asked whether they use an insulin pump. This is included in the nursing assessment form. If they do, the physician is notified.
The insulin pump might be missed unless specifically asked for because (1) the insulin pump may be thought of more as a device rather than a medication, and (2) the insulin pump may be worn in less obvious areas, not only on the abdomen where providers are more apt to detect it.
Hospital Policy and Insulin Orders
Written hospital policies on how to safely manage patients presenting with an insulin pump will delineate patients who can safely be allowed to continue on the pump, and the responsibilities that come along with this. Our institution has such a policy. Experts from both the legal and biomedical engineering departments were consulted when the policy was crafted. Patients must be fully alert, able, and willing to self‐manage the pump. General contraindications to pump use in the hospital, such as altered mental status or DKA, are listed in Table 1. In addition, patients in the intensive care units are best managed on an IV insulin infusion during their critical illness, in keeping with several society guidelines.[14] Controlling severe hyperglycemia and DKA with multiple boluses through the insulin pump can potentially lead to stacking of insulin with subsequent hypoglycemia.
| Altered state of consciousness |
| Suicidal ideation |
| Prolonged instability of blood glucose levels |
| Diabetic ketoacidosis |
| Patient/family inability or refusal to participate in own care |
| Insulin‐pump malfunction |
| Lack of appropriate supplies for the insulin pump |
| Other circumstances as identified by the physician, resident, or licensed independent practitioner |
In our institution, a computerized insulin pump order set has to be activated. Apart from insulin, POCT, and hypoglycemia‐management orders, this order set contains documents aimed at balancing patient autonomy with delivery of appropriate and safe medical care that the bedside nurse goes over with the patient (Table 2). By policy at our institution, insulin should be dispensed from the hospital's pharmacy (except for that already in the pump), so the order set is linked to the pharmacy and a 3‐mL insulin vial is delivered to the hospital floor and stored in the patient‐specific medication bin. The order set triggers an Endocrinology consult so that the patient can be assessed by key trained personnel.
|
| CSII pump therapy patient agreement |
| Delineates the conditions for continuing on CSII and those for whom it may be discontinued |
| Terms of use and release of liability for patient‐owned equipment |
| Delineates the patient's responsibility for the pump and supplies |
| Patient‐maintained flow sheet for inpatient CSII |
| Includes blood glucose levels (obtained by nurse or patient‐care assistant with the hospital glucose meter) |
| Includes insulin doses (basal, bolus) |
| Includes carbohydrate intake in grams |
Patient Diagnosis
It is important to try to distinguish T1DM vs T2DM, as patients with T1DM are prone to ketoacidosis when the pump is disconnected.
Patient Assessment by the Endocrinology Consult Service
Hospitalized patients on the pump have varying degrees of pump knowledge and skill sets. We have encountered highly trained patients who meticulously count their carbohydrates and double‐check the insulin doses calculated by the built‐in pump calculator, and those who have knowledge gaps because their physicians, and not they themselves, change pump settings at the clinic visits.
Therefore, the Endocrinology consult team members (comprising physicians, nurse practitioners, and certified diabetes educators) go through the following items to be able to order the insulin correctly, assess whether patients are still able and willing to continue on their pump despite their illness, formulate alternative insulin regimens as needed, or help empower patients who may have forgotten some aspects of pump management:
- Insulin pump manufacturer/model.
- Insulin used in the pump.
- Often fast‐acting insulin (lispro, aspart, or glulisine).
- Some patients use regular insulin.
- A few patients use U500 insulin (5 more potent than other insulins).
- Insulin doses/pump settings.
Patients are assessed for:
- Hypoglycemia awareness.
- Previous glucose control.
- Bolus calculation (either using the built‐in calculator, computing this mentally, or using a different calculator).
- Ability to deliver a bolus (including vision and dexterity challenges).
- Ability to change the basal rate, or set a temporary rate, and suspend insulin delivery.
Discussion on Options for Inpatient Management
After assessment, education is provided as needed. If there are concerns on the part of the patient, the primary team, or the Endocrinology team about safe continuation of CSII during the hospitalization, then alternative insulin regimens are discussed. Patients who cannot access their basal rates and cannot adjust the doses are not able to self‐manage; they should be taken off the pump and treated with multiple subcutaneous insulin doses. Conversion to MDII is discussed under Interruption of Continuous Subcutaneous Insulin Infusion for Short and Prolonged Periods.
Provision of Pump Information for Hospital Healthcare Providers
Users of CSII, even if perfectly competent using their pumps in the ambulatory setting, may need assistance in the hospital for various reasons. They may not know what to do for surgical or radiologic procedures (discussed below) and may not be familiar with hospital policies involving CSII. Hospital providers trained on insulin pumps may need a refresher on locating a particular pump setting.
The provider can call the toll‐free number on the back of the pump for assistance (Table 3). Insulin‐pump companies also have menu maps to aid in finding information on pump settings (samples shown in Figures 1 and 2).[12, 13] Documentation of the patient's pump settings will assist in CSII dose changes during the acute illness or assist in switching to MDII if needed. The following information need to be collected:
| Animas Corporation | 877‐937‐7867 |
| Insulet Corporation | 800‐591‐3455 |
| Medtronic | 800‐826‐2099 |
| Roche Diagnostics | 800‐688‐4578 |
Basal Rate
This is the hourly insulin rate delivered for the patient's insulin needs even when not eating. The patient might have one or multiple basal rates in a day, or a different pattern on some days. Because the patient's activity in the hospital will be different from the usual ambulatory activity, we recommend that patients choose only 1 pattern.
Bolus
This is the insulin to cover meals or to correct for hyperglycemia, or both. The patient has to activate buttons for delivery. The patient may or may not be using the built‐in pump calculator.
Carbohydrate Ratio
This is the amount of insulin per quantity of carbohydrate consumed. When patients are initially placed on the insulin pump, they are given a carbohydrate ratio that is derived from a calculation called the rule of 500. In the rule of 500, the number 500 is divided by the patient's total daily insulin dose while on multiple subcutaneous insulin shots. For example, if the patient was on insulin glargine 13 units daily and insulin lispro 4 units 3 daily with meals, 500 divided by 25 gives us a carbohydrate ratio of 20 grams of carbohydrate for 1 unit of insulin (or conversely called insulin‐to‐carbohydrate ratio of 1 unit of insulin for every 20 grams of carbohydrate).
This often comes out to 1 unit for every 1530 grams of carbohydrates in patients with T1DM, and 1 unit for every 515 grams of carbohydrate in patients with T2DM, reflecting the need for a higher insulin dose in the latter.
It is best to ask the patient how many units he or she usually takes for a meal, or to present the patient with an example of a meal and ask how much he or she would take. We have encountered a patient whose carbohydrate ratio was 1, but upon further inquiry, the patient demonstrated that he actually bolused 1 unit for every 1 serving (or 1 unit for every 15 grams) of carbohydrate.
Sensitivity Factor
This is the amount of insulin that would bring the blood glucose to goal. For example, if the patient requires 1 unit of insulin to bring down the blood glucose from 170 mg/dL to 120 mg/dL, then the sensitivity factor of 50 would be seen on the pump screen. Similar to the carbohydrate ratio, a sensitivity factor is calculated when patients are initially placed on the insulin pump. This time, the rule of 1800 is used, where the number 1800 is divided by the patient's total daily insulin dose. In patients with T1DM, this often comes to 30100 mg/dL per 1 unit of insulin; or, conversely, 1 unit for every 30100 mg/dL glucose. For patients with T2DM, this is often 1 unit for every 1025 mg/dL glucose.
This insulin dose is given in addition to the dose resulting from the carbohydrate ratio, or alone if the patient is not eating.
Target
This is the blood glucose goal for the patient, which might be too tight in the presence of acute illness, and therefore would have to be modified. The American Diabetes Association, Endocrine Society, and American Association of Clinical Endocrinologists recommend premeal glucose targets of 140 mg/dL in hospitalized noncritically ill patients on insulin, with re‐evaluation of the insulin dose when premeal glucose levels fall below 100 mg/dL and dose adjustment if they are 70mg/dLunless there is an obvious explanation, such as a missed meal.[14, 15]
Point‐of‐Care Testing for Glucose Monitoring
Our policy specifies that the hospital glucose meter is the meter of record upon which dose adjustments are based. Point‐of‐care testing is performed by our patient care nursing assistants or bedside nurses. The timing is typically before meals, at bedtime, between 2 and 3 AM, and with allowance for other times that patients are used to checking when they were at home, such as after meals. Frequent POCT has to be especially borne in mind for patients with hypoglycemia unawareness. Some patients are used to checking with their own home glucose meters in between these times, and we do work with them with the understanding that dose‐change decisions are based on the hospital glucose meter readings.
Dose Adjustments
Continuous subcutaneous insulin infusion dose adjustments for hypoglycemia and hyperglycemia are usually done in 10% to 20% decrements/emncrements. Our Endocrinology team discusses these with the patients and ensures that the new settings are entered into the pump and into the order set.
INTERRUPTION OF CONTINUOUS SUBCUTANEOUS INSULIN INFUSION FOR SHORT AND PROLONGED PERIODS
Patients with T1DM should not be left without basal insulin. However, pump interruption for 30 minutes to an hour often does not lead to problems. Beyond an hour and certainly closer to 2 to 3 hours off the pump, the patient should be given a subcutaneous insulin injection if the patient is left without easy access to the insulin pump.
The subcutaneous insulin dose for temporary pump suspension can be roughly calculated as hourly basal rate multiplier, where the multiplier is the number of hours that the patient is expected to be disconnected from the pump (for example, hourly basal rate of 0.85 unit/hour 3 hours = 2.55 units, which can be rounded off to 2 or 3 units depending on the patient's general glucose control).
When it has been determined that the patient should come off the pump for substantial periods of time, then subcutaneous insulin injections should be given. This is imperative for the prevention of DKA in patients with T1DM, and highly recommended for maintenance of good glycemic control for patients with T2DM.
Basal Dose
In most cases, these situations stretch for greater than 24 hours, such as surgery and the anticipated recovery from anesthesia. We favor long‐acting insulin for basal needs, given 2 hours before discontinuing the pump. The total basal insulin dose per day can be given as the starting long‐acting insulin dose and then adjusted as needed. The total daily basal insulin dose can be retrieved from the insulin pump. In one study on T1DM patients using insulin lispro on the pump, total daily basal dose was given as insulin glargine without adverse effects.[16] If there is concern for hypoglycemia, then the dose can be reduced by 10% to 20%. Care should be made to ascertain that the basal insulin delivered via the pump is appropriate.
There are several ways to estimate this:
- If the daily total basal and the total prandial insulin requirements approximate a 50:50 ratio, then the basal rate via the pump is appropriate.
- If the daily total basal rate via the pump is similar to a weight‐based estimate of the basal dose (often 0.150.2 units/kg/day in patients with T1DM, 0.20.3 units/kg/day for T2DM, and higher in both cases with longer duration of DM or greater insulin resistance), then the basal rate via the pump is appropriate.
Bolus Dose
Patients can still continue to calculate their sensitivity factor and carbohydrate ratio and request for the equivalent dose of insulin. In the ideal situation, bedside nurses would be taught how to calculate this ratio and dose rapid‐acting insulin accordingly should the patient need to come off the insulin pump. Because of the logistic difficulties of making this uniform in our institution, we have worked instead on providing patients with information on the carbohydrate content of their meal tray. If the pump is discontinued, the patient would continue to calculate their prandial insulin based on their carbohydrates ratio and indicate to the nurse how much he/she would need. Our subcutaneous insulin orders for MDII allow for us to put a range of insulin doses based on the patient's typical insulin needs for mealtime.
Pump Removal for Certain Hospital Procedures
Patients may not remember that the pump has to be removed before entering high‐radiation areas. The pump owner manuals tell patients not to use the pump when going for magnetic resonance imaging, CT scans, or x‐rays, or near equipment with high electromagnetic fields.
Interrogation of the Pump
If there is concern about pump malfunction, patients should be switched to MDII. The pump company can be contacted for pump interrogation and provision of a temporary pump (Table 3).
Pump Disconnection
In our institution, the Radiology department has signage instructing patients to inform the technician if they are wearing an insulin pump. The pump is handed off to a family member or stored until the procedure is over. Another option is to leave it with the bedside nurse or the floor nurse manager for safekeeping. This is less ideal, because the wait for the radiologic procedure might take longer than expected and the patient is left without any insulin on board.
Interruption of Continuous Subcutaneous Insulin Infusion for Surgical Procedures
In our institution, the anesthesiology department has worked with the Endocrinology, Surgery and Medicine departments regarding patients with insulin pumps. Discontinuation of CSII is recommended for surgical procedures longer than 1 hour; patients are asked to continue on the insulin pump until they are taken to the preoperative suite, at which point they are placed on IV insulin infusion. Ideally, there should be an overlap of 1530 minutes. Providing an alternative continuous source of insulin during pump interruption is important, especially for patients with T1DM.[17]
Pump Resumption
Once the patient is ready to resume the pump, any subcutaneous insulin that was delivered and might still be active has to be accounted for and subtracted from the basal pump dose so that hypoglycemia is avoided. An alternative would be to wait until the last basal subcutaneous insulin dose is expected to be cleared before restarting CSII.
SUMMARY
As patients on an insulin pump are increasingly seen in the hospital, inpatient providers have to be able to adapt to these patients' needs. Inpatient providers need to have a working knowledge of the insulin pump. Alternative methods of insulin delivery will have to be discussed with the patient to assure continued safety in the hospital.
Disclosures
Dr. Lansang has served as a Sanofi Advisory Board member.
- http://www.rncos.com/Press_Releases/US‐to‐Dominate‐the‐Global‐Insulin‐Pump‐Market.htm. Accessed on October 25, 2013.
- , , , , , ;T1D Exchange Clinic Network. The T1D exchange clinic registry. J Clin Endocrinol Metab. 2012;97(12):4383–4389.
- , , , et al. Resource utilization with insulin pump therapy for type 2 diabetes mellitus. Am J Manag Care. 2010;16(12):892–896.
- , , , , . Diabetes‐related hospitalization and hospital‐related utilization. In: Diabetes in America. 2nd ed. Bethesda, MD: National Diabetes Data Group, National Institute of Diabetes and Digestive and Kidney Diseases; 1995:553–569. Available at: http://diabetes.niddk.nih.gov/dm/pubs/america/pdf/chapter27.pdf. Accessed February 21, 2013.
- , , , , , . Hyperglycemia: an independent marker of in‐hospital mortality in patients with undiagnosed diabetes. J Clin Endocrinol Metab. 2002;87(3):978–982.
- American Diabetes Association. Standards of medical care in diabetes—2012. Diabetes Care. 2012;35(suppl 1):S11–S63.
- , , , et al;AACE Insulin Pump Management Task Force. Statement by the American Association of Clinical Endocrinologists Consensus Panel on insulin pump management. Endocr Pract. 2010;16(5):746–762.
- , , , et al;American Diabetes Association Diabetes in Hospitals Writing Committee. Management of diabetes and hyperglycemia in hospitals [published correction appears in Diabetes Care. 2004;27(5):1255]. Diabetes Care. 2004;27(2):553–591.
- , , , et al. Randomized study of basal‐bolus insulin therapy in the inpatient management of patients with type 2 diabetes (RABBIT 2 trial). Diabetes Care. 2007;30(9):2181–2186.
- , , , et al. Randomized study of basal‐bolus insulin therapy in the inpatient management of patients with type 2 diabetes undergoing general surgery (RABBIT 2 surgery). Diabetes Care. 2011;34(2):256–261.
- , , , , , . Transitioning insulin pump therapy from the outpatient to the inpatient setting: a review of 6 years' experience with 253 cases. J Diabetes Sci Technol. 2012;6(5):995–1002.
- Medtronic Paradigm Revel insulin pump [menu map]. Northridge, CA: Medtronic. Available at: http://www.medtronicdiabetes.com/sites/default/files/library/download‐library/workbooks/x23_menu_map.pdf. Updated January 22, 2010. Accessed February 2013.
- OneTouch Ping insulin pump [menu map]. West Chester, PA: Animas Corporation.
- , , , et al. American Association of Clinical Endocrinologists and American Diabetes Association consensus statement on inpatient glycemic control. Endocr Pract. 2009;15(4):353–369.
- , , , et al. Management of hyperglycemia in hospitalized patients in non‐critical care setting: an Endocrine Society clinical practice guideline. J Clin Endocrinol Metab. 2012;97(1):16–38.
- , , , . Switch to multiple daily injections with insulin glargine and insulin lispro from continuous subcutaneous insulin infusion with insulin lispro: a randomized, open‐label study using a continuous glucose monitoring system. Endocr Pract. 2005;11(3):157–164.
- , , , , . Perioperative glycemic management in insulin pump patients undergoing noncardiac surgery. Curr Pharm Des. 2012;18(38):6204–6214.
Delivery of insulin via continuous subcutaneous insulin infusion (CSII), or insulin pump, has gained wide acceptance. It is estimated that 400,000 patients with type 1 diabetes mellitus (T1DM) are using insulin pumps.[1] A registry for T1DM in the United States indicated that 50% of the 25,833 participants were using an insulin pump.[2] Use of CSII in type 2 DM (T2DM) is also increasing.[3]
Patients with DM are 3 as likely to be hospitalized than patients without DM.[4] Twenty percent to 30% of adult hospitalized patients have a known diagnosis of DM.[5] It is therefore to be expected that patients on CSII will be seen with increased frequency in the hospital setting. This leads to potential difficultiesinpatient healthcare providers may not be familiar with insulin pumps, and patients may not be aware of complexities associated with pump usage in the hospital.
This article will review CSII usage in the hospital, offering strategies for management in partnership with the patient based on our experiences and processes developed in our institution.
SHOULD CONTINUOUS SUBCUTANEOUS INSULIN INFUSION BE CONTINUED IN THE HOSPITAL?
The American Diabetes Association advocates (1) allowing patients who are physically and mentally able to continue CSII when hospitalized, (2) having a hospital policy for CSII use, and (3) having hospital personnel with expertise on pump management.[6] The American Association of Clinical Endocrinologists echoes much of the same and suggests contacting the specialist responsible for the pump in the ambulatory setting for decisions on adjustments in the hospitalized patient,[7] which at times may not be feasible.
The logic and benefits of basal‐bolus insulin dosing (ie, giving basal insulin to account for fasting requirements, plus bolus insulin to cover nutritional and correctional needs) have been well‐described.[8, 9, 10] In randomized clinical trials on patients admitted to general medical and surgical floors, basal‐bolus insulin (long‐acting basal insulin plus mealtime fast‐acting insulin injections) resulted in better glycemic control and reduced infection rates compared with sliding‐scale therapy (waiting for high blood glucoses before giving insulin, instead of giving it proactively to prevent hyperglycemia).[9, 10] At present, insulin delivery via the insulin pump is the best commercially available method to deliver insulin in a basal‐bolus manner in ambulatory patients. It thus makes sense to continue CSII in the hospital if patients are able to manage their pumps, though there are no randomized trials answering this question as of yet.
Studies on insulin pumps in the hospital are sparse. In one group's latest retrospective study of 136 patients over a 6‐year period, CSII was continued during the entire hospital stay in 65% of the hospitalizations, was used intermittently in 20%, and was discontinued with alternative insulin regimens given in 15%.[11] Mean glucose was 178 47 mg/dL (mean standard deviation), with no significant difference between groups. There were fewer episodes of severe hyperglycemia among those who continued on the pump compared with the other groups, and fewer episodes of hypoglycemia in those who continued on vs those taken off the pump. There was 1 episode of an infusion catheter kinking, resulting in nonfatal hyperglycemia, but no reported pump‐site infections, mechanical pump failure, or diabetic ketoacidosis (DKA) among patients remaining on CSII.
CLINICAL VIGNETTES
The following cases illustrate potential challenges with CSII use that we have encountered in the hospital.
The Patient Needing Transition to Multiple Daily Insulin Injections
A 29‐year‐old male with T1DM, on CSII, was admitted for fever and chills. His latest glycated hemoglobin (HbA1c) level was 6.8%. His glucose levels started rising, and he wished to be taken off the insulin pump. He was started by the primary team on multiple daily insulin injections (MDII) with insulin glargine and insulin lispro. His glucose levels continued to rise, so an intravenous (IV) insulin infusion was started. Endocrinology was then consulted. The patient's condition was concerning for the potential development of DKA, so he was kept on IV insulin. When he was ready for transitioning to subcutaneous insulin, the pump had been taken home by a family member, and the patient could not recall his CSII basal rates but knew his total basal insulin dose, carbohydrate ratio, and sensitivity factor. Endocrinology assisted in transitioning him from the insulin infusion to MDII based on these recalled doses. When the insulin pump was available, the pump settings were interrogated, and he was transitioned back to it.
Key points:
- Having key hospital personnel trained on CSII, including interrogating the pump's settings, facilitates the transitioning of these patients from one hospital unit, or level of care, to another.
- Accessing the pump's settings involves pushing several buttons on the insulin pump. Because key hospital personnel will encounter patients on different insulin pumps, it may be helpful to keep menu maps handy as a quick reference. A menu map will show at a glance where certain information can be found, such as the basal insulin rate or the sensitivity factor (see examples in Figures 1 and 2).[12, 13]
- Knowing the HbA1c will help determine if pump use has been effective.
The Patient With Technical Problems
An 84‐year‐old gentleman with T2DM was admitted for heart failure and aortic valve replacement. His HbA1c was 6.2%, and he had had several outpatient hypoglycemic events. While on CSII in the hospital, his point of care testing (POCT) glucose readings ranged from 105 to 260 mg/dL. On the afternoon of the third hospital day, POCT readings stayed above 220 mg/dL and rose to 348 mg/dL on the fourth hospital morning, despite multiple blousing and changing the insulin, insertion site, reservoir cartridge, and pump tubing. There was no evidence of infection and no medication change that would have impacted glucose levels. Review of his procedures revealed that he had undergone computed tomography (CT) on the morning of hospital day 3 and wore his pump while being scanned. The pump company was notified.
Key points:
- Patients, and medical and nursing staff, should be reminded to remove insulin pumps for CT scans, magnetic resonance imaging, x‐rays, or other tests with high electromagnetic fields.
- If there is a suspicion of pump malfunction from such a procedure, notify the pump company.
The Patient Who Can Benefit From Inpatient Education
A 70‐year‐old female with T1DM was admitted for heart failure. The patient had been using CSII for 20 years. Her latest HbA1c was 6.9%. She had 1 hypoglycemic event every 1 to 2 weeks. In the hospital, she experienced 2 hypoglycemic events within 3 days, both around bedtime. It was discovered that the patient was giving a bolus of insulin for elevated glucose levels based on the hospital POCT, and when the meal arrived (3060 minutes later), she again delivered a bolus based on her own glucometer reading plus insulin based on the carbohydrates in her meal. The patient was then instructed to request the POCT when her meal tray arrived, and she was taught how to use the pump's built‐in calculator. Glucose excursions improved.
Key points:
- Patients on CSII, though able to exercise autonomy in managing their insulin doses, may also need assistance in dosing insulin properly.
- Although pump education is ideally done on an outpatient basis, hospital‐based providers may encounter patients who need reinforcement of their training while hospitalized. Hospital personnel trained on insulin pumps (such as physicians, nurse practitioners, physician assistants, and certified diabetes educators) can help augment the patient's knowledge while in the hospital. In the absence of such key personnel, patient safety has to be addressed with re‐evaluation of the need to discontinue the pump and switch to multiple doses of subcutaneous insulin.
STEPS IN TAKING CARE OF PATIENTS ON CONTINUOUS SUBCUTANEOUS INSULIN INFUSION
Initial Patient Assessment
On admission, patients are asked whether they use an insulin pump. This is included in the nursing assessment form. If they do, the physician is notified.
The insulin pump might be missed unless specifically asked for because (1) the insulin pump may be thought of more as a device rather than a medication, and (2) the insulin pump may be worn in less obvious areas, not only on the abdomen where providers are more apt to detect it.
Hospital Policy and Insulin Orders
Written hospital policies on how to safely manage patients presenting with an insulin pump will delineate patients who can safely be allowed to continue on the pump, and the responsibilities that come along with this. Our institution has such a policy. Experts from both the legal and biomedical engineering departments were consulted when the policy was crafted. Patients must be fully alert, able, and willing to self‐manage the pump. General contraindications to pump use in the hospital, such as altered mental status or DKA, are listed in Table 1. In addition, patients in the intensive care units are best managed on an IV insulin infusion during their critical illness, in keeping with several society guidelines.[14] Controlling severe hyperglycemia and DKA with multiple boluses through the insulin pump can potentially lead to stacking of insulin with subsequent hypoglycemia.
| Altered state of consciousness |
| Suicidal ideation |
| Prolonged instability of blood glucose levels |
| Diabetic ketoacidosis |
| Patient/family inability or refusal to participate in own care |
| Insulin‐pump malfunction |
| Lack of appropriate supplies for the insulin pump |
| Other circumstances as identified by the physician, resident, or licensed independent practitioner |
In our institution, a computerized insulin pump order set has to be activated. Apart from insulin, POCT, and hypoglycemia‐management orders, this order set contains documents aimed at balancing patient autonomy with delivery of appropriate and safe medical care that the bedside nurse goes over with the patient (Table 2). By policy at our institution, insulin should be dispensed from the hospital's pharmacy (except for that already in the pump), so the order set is linked to the pharmacy and a 3‐mL insulin vial is delivered to the hospital floor and stored in the patient‐specific medication bin. The order set triggers an Endocrinology consult so that the patient can be assessed by key trained personnel.
|
| CSII pump therapy patient agreement |
| Delineates the conditions for continuing on CSII and those for whom it may be discontinued |
| Terms of use and release of liability for patient‐owned equipment |
| Delineates the patient's responsibility for the pump and supplies |
| Patient‐maintained flow sheet for inpatient CSII |
| Includes blood glucose levels (obtained by nurse or patient‐care assistant with the hospital glucose meter) |
| Includes insulin doses (basal, bolus) |
| Includes carbohydrate intake in grams |
Patient Diagnosis
It is important to try to distinguish T1DM vs T2DM, as patients with T1DM are prone to ketoacidosis when the pump is disconnected.
Patient Assessment by the Endocrinology Consult Service
Hospitalized patients on the pump have varying degrees of pump knowledge and skill sets. We have encountered highly trained patients who meticulously count their carbohydrates and double‐check the insulin doses calculated by the built‐in pump calculator, and those who have knowledge gaps because their physicians, and not they themselves, change pump settings at the clinic visits.
Therefore, the Endocrinology consult team members (comprising physicians, nurse practitioners, and certified diabetes educators) go through the following items to be able to order the insulin correctly, assess whether patients are still able and willing to continue on their pump despite their illness, formulate alternative insulin regimens as needed, or help empower patients who may have forgotten some aspects of pump management:
- Insulin pump manufacturer/model.
- Insulin used in the pump.
- Often fast‐acting insulin (lispro, aspart, or glulisine).
- Some patients use regular insulin.
- A few patients use U500 insulin (5 more potent than other insulins).
- Insulin doses/pump settings.
Patients are assessed for:
- Hypoglycemia awareness.
- Previous glucose control.
- Bolus calculation (either using the built‐in calculator, computing this mentally, or using a different calculator).
- Ability to deliver a bolus (including vision and dexterity challenges).
- Ability to change the basal rate, or set a temporary rate, and suspend insulin delivery.
Discussion on Options for Inpatient Management
After assessment, education is provided as needed. If there are concerns on the part of the patient, the primary team, or the Endocrinology team about safe continuation of CSII during the hospitalization, then alternative insulin regimens are discussed. Patients who cannot access their basal rates and cannot adjust the doses are not able to self‐manage; they should be taken off the pump and treated with multiple subcutaneous insulin doses. Conversion to MDII is discussed under Interruption of Continuous Subcutaneous Insulin Infusion for Short and Prolonged Periods.
Provision of Pump Information for Hospital Healthcare Providers
Users of CSII, even if perfectly competent using their pumps in the ambulatory setting, may need assistance in the hospital for various reasons. They may not know what to do for surgical or radiologic procedures (discussed below) and may not be familiar with hospital policies involving CSII. Hospital providers trained on insulin pumps may need a refresher on locating a particular pump setting.
The provider can call the toll‐free number on the back of the pump for assistance (Table 3). Insulin‐pump companies also have menu maps to aid in finding information on pump settings (samples shown in Figures 1 and 2).[12, 13] Documentation of the patient's pump settings will assist in CSII dose changes during the acute illness or assist in switching to MDII if needed. The following information need to be collected:
| Animas Corporation | 877‐937‐7867 |
| Insulet Corporation | 800‐591‐3455 |
| Medtronic | 800‐826‐2099 |
| Roche Diagnostics | 800‐688‐4578 |
Basal Rate
This is the hourly insulin rate delivered for the patient's insulin needs even when not eating. The patient might have one or multiple basal rates in a day, or a different pattern on some days. Because the patient's activity in the hospital will be different from the usual ambulatory activity, we recommend that patients choose only 1 pattern.
Bolus
This is the insulin to cover meals or to correct for hyperglycemia, or both. The patient has to activate buttons for delivery. The patient may or may not be using the built‐in pump calculator.
Carbohydrate Ratio
This is the amount of insulin per quantity of carbohydrate consumed. When patients are initially placed on the insulin pump, they are given a carbohydrate ratio that is derived from a calculation called the rule of 500. In the rule of 500, the number 500 is divided by the patient's total daily insulin dose while on multiple subcutaneous insulin shots. For example, if the patient was on insulin glargine 13 units daily and insulin lispro 4 units 3 daily with meals, 500 divided by 25 gives us a carbohydrate ratio of 20 grams of carbohydrate for 1 unit of insulin (or conversely called insulin‐to‐carbohydrate ratio of 1 unit of insulin for every 20 grams of carbohydrate).
This often comes out to 1 unit for every 1530 grams of carbohydrates in patients with T1DM, and 1 unit for every 515 grams of carbohydrate in patients with T2DM, reflecting the need for a higher insulin dose in the latter.
It is best to ask the patient how many units he or she usually takes for a meal, or to present the patient with an example of a meal and ask how much he or she would take. We have encountered a patient whose carbohydrate ratio was 1, but upon further inquiry, the patient demonstrated that he actually bolused 1 unit for every 1 serving (or 1 unit for every 15 grams) of carbohydrate.
Sensitivity Factor
This is the amount of insulin that would bring the blood glucose to goal. For example, if the patient requires 1 unit of insulin to bring down the blood glucose from 170 mg/dL to 120 mg/dL, then the sensitivity factor of 50 would be seen on the pump screen. Similar to the carbohydrate ratio, a sensitivity factor is calculated when patients are initially placed on the insulin pump. This time, the rule of 1800 is used, where the number 1800 is divided by the patient's total daily insulin dose. In patients with T1DM, this often comes to 30100 mg/dL per 1 unit of insulin; or, conversely, 1 unit for every 30100 mg/dL glucose. For patients with T2DM, this is often 1 unit for every 1025 mg/dL glucose.
This insulin dose is given in addition to the dose resulting from the carbohydrate ratio, or alone if the patient is not eating.
Target
This is the blood glucose goal for the patient, which might be too tight in the presence of acute illness, and therefore would have to be modified. The American Diabetes Association, Endocrine Society, and American Association of Clinical Endocrinologists recommend premeal glucose targets of 140 mg/dL in hospitalized noncritically ill patients on insulin, with re‐evaluation of the insulin dose when premeal glucose levels fall below 100 mg/dL and dose adjustment if they are 70mg/dLunless there is an obvious explanation, such as a missed meal.[14, 15]
Point‐of‐Care Testing for Glucose Monitoring
Our policy specifies that the hospital glucose meter is the meter of record upon which dose adjustments are based. Point‐of‐care testing is performed by our patient care nursing assistants or bedside nurses. The timing is typically before meals, at bedtime, between 2 and 3 AM, and with allowance for other times that patients are used to checking when they were at home, such as after meals. Frequent POCT has to be especially borne in mind for patients with hypoglycemia unawareness. Some patients are used to checking with their own home glucose meters in between these times, and we do work with them with the understanding that dose‐change decisions are based on the hospital glucose meter readings.
Dose Adjustments
Continuous subcutaneous insulin infusion dose adjustments for hypoglycemia and hyperglycemia are usually done in 10% to 20% decrements/emncrements. Our Endocrinology team discusses these with the patients and ensures that the new settings are entered into the pump and into the order set.
INTERRUPTION OF CONTINUOUS SUBCUTANEOUS INSULIN INFUSION FOR SHORT AND PROLONGED PERIODS
Patients with T1DM should not be left without basal insulin. However, pump interruption for 30 minutes to an hour often does not lead to problems. Beyond an hour and certainly closer to 2 to 3 hours off the pump, the patient should be given a subcutaneous insulin injection if the patient is left without easy access to the insulin pump.
The subcutaneous insulin dose for temporary pump suspension can be roughly calculated as hourly basal rate multiplier, where the multiplier is the number of hours that the patient is expected to be disconnected from the pump (for example, hourly basal rate of 0.85 unit/hour 3 hours = 2.55 units, which can be rounded off to 2 or 3 units depending on the patient's general glucose control).
When it has been determined that the patient should come off the pump for substantial periods of time, then subcutaneous insulin injections should be given. This is imperative for the prevention of DKA in patients with T1DM, and highly recommended for maintenance of good glycemic control for patients with T2DM.
Basal Dose
In most cases, these situations stretch for greater than 24 hours, such as surgery and the anticipated recovery from anesthesia. We favor long‐acting insulin for basal needs, given 2 hours before discontinuing the pump. The total basal insulin dose per day can be given as the starting long‐acting insulin dose and then adjusted as needed. The total daily basal insulin dose can be retrieved from the insulin pump. In one study on T1DM patients using insulin lispro on the pump, total daily basal dose was given as insulin glargine without adverse effects.[16] If there is concern for hypoglycemia, then the dose can be reduced by 10% to 20%. Care should be made to ascertain that the basal insulin delivered via the pump is appropriate.
There are several ways to estimate this:
- If the daily total basal and the total prandial insulin requirements approximate a 50:50 ratio, then the basal rate via the pump is appropriate.
- If the daily total basal rate via the pump is similar to a weight‐based estimate of the basal dose (often 0.150.2 units/kg/day in patients with T1DM, 0.20.3 units/kg/day for T2DM, and higher in both cases with longer duration of DM or greater insulin resistance), then the basal rate via the pump is appropriate.
Bolus Dose
Patients can still continue to calculate their sensitivity factor and carbohydrate ratio and request for the equivalent dose of insulin. In the ideal situation, bedside nurses would be taught how to calculate this ratio and dose rapid‐acting insulin accordingly should the patient need to come off the insulin pump. Because of the logistic difficulties of making this uniform in our institution, we have worked instead on providing patients with information on the carbohydrate content of their meal tray. If the pump is discontinued, the patient would continue to calculate their prandial insulin based on their carbohydrates ratio and indicate to the nurse how much he/she would need. Our subcutaneous insulin orders for MDII allow for us to put a range of insulin doses based on the patient's typical insulin needs for mealtime.
Pump Removal for Certain Hospital Procedures
Patients may not remember that the pump has to be removed before entering high‐radiation areas. The pump owner manuals tell patients not to use the pump when going for magnetic resonance imaging, CT scans, or x‐rays, or near equipment with high electromagnetic fields.
Interrogation of the Pump
If there is concern about pump malfunction, patients should be switched to MDII. The pump company can be contacted for pump interrogation and provision of a temporary pump (Table 3).
Pump Disconnection
In our institution, the Radiology department has signage instructing patients to inform the technician if they are wearing an insulin pump. The pump is handed off to a family member or stored until the procedure is over. Another option is to leave it with the bedside nurse or the floor nurse manager for safekeeping. This is less ideal, because the wait for the radiologic procedure might take longer than expected and the patient is left without any insulin on board.
Interruption of Continuous Subcutaneous Insulin Infusion for Surgical Procedures
In our institution, the anesthesiology department has worked with the Endocrinology, Surgery and Medicine departments regarding patients with insulin pumps. Discontinuation of CSII is recommended for surgical procedures longer than 1 hour; patients are asked to continue on the insulin pump until they are taken to the preoperative suite, at which point they are placed on IV insulin infusion. Ideally, there should be an overlap of 1530 minutes. Providing an alternative continuous source of insulin during pump interruption is important, especially for patients with T1DM.[17]
Pump Resumption
Once the patient is ready to resume the pump, any subcutaneous insulin that was delivered and might still be active has to be accounted for and subtracted from the basal pump dose so that hypoglycemia is avoided. An alternative would be to wait until the last basal subcutaneous insulin dose is expected to be cleared before restarting CSII.
SUMMARY
As patients on an insulin pump are increasingly seen in the hospital, inpatient providers have to be able to adapt to these patients' needs. Inpatient providers need to have a working knowledge of the insulin pump. Alternative methods of insulin delivery will have to be discussed with the patient to assure continued safety in the hospital.
Disclosures
Dr. Lansang has served as a Sanofi Advisory Board member.
Delivery of insulin via continuous subcutaneous insulin infusion (CSII), or insulin pump, has gained wide acceptance. It is estimated that 400,000 patients with type 1 diabetes mellitus (T1DM) are using insulin pumps.[1] A registry for T1DM in the United States indicated that 50% of the 25,833 participants were using an insulin pump.[2] Use of CSII in type 2 DM (T2DM) is also increasing.[3]
Patients with DM are 3 as likely to be hospitalized than patients without DM.[4] Twenty percent to 30% of adult hospitalized patients have a known diagnosis of DM.[5] It is therefore to be expected that patients on CSII will be seen with increased frequency in the hospital setting. This leads to potential difficultiesinpatient healthcare providers may not be familiar with insulin pumps, and patients may not be aware of complexities associated with pump usage in the hospital.
This article will review CSII usage in the hospital, offering strategies for management in partnership with the patient based on our experiences and processes developed in our institution.
SHOULD CONTINUOUS SUBCUTANEOUS INSULIN INFUSION BE CONTINUED IN THE HOSPITAL?
The American Diabetes Association advocates (1) allowing patients who are physically and mentally able to continue CSII when hospitalized, (2) having a hospital policy for CSII use, and (3) having hospital personnel with expertise on pump management.[6] The American Association of Clinical Endocrinologists echoes much of the same and suggests contacting the specialist responsible for the pump in the ambulatory setting for decisions on adjustments in the hospitalized patient,[7] which at times may not be feasible.
The logic and benefits of basal‐bolus insulin dosing (ie, giving basal insulin to account for fasting requirements, plus bolus insulin to cover nutritional and correctional needs) have been well‐described.[8, 9, 10] In randomized clinical trials on patients admitted to general medical and surgical floors, basal‐bolus insulin (long‐acting basal insulin plus mealtime fast‐acting insulin injections) resulted in better glycemic control and reduced infection rates compared with sliding‐scale therapy (waiting for high blood glucoses before giving insulin, instead of giving it proactively to prevent hyperglycemia).[9, 10] At present, insulin delivery via the insulin pump is the best commercially available method to deliver insulin in a basal‐bolus manner in ambulatory patients. It thus makes sense to continue CSII in the hospital if patients are able to manage their pumps, though there are no randomized trials answering this question as of yet.
Studies on insulin pumps in the hospital are sparse. In one group's latest retrospective study of 136 patients over a 6‐year period, CSII was continued during the entire hospital stay in 65% of the hospitalizations, was used intermittently in 20%, and was discontinued with alternative insulin regimens given in 15%.[11] Mean glucose was 178 47 mg/dL (mean standard deviation), with no significant difference between groups. There were fewer episodes of severe hyperglycemia among those who continued on the pump compared with the other groups, and fewer episodes of hypoglycemia in those who continued on vs those taken off the pump. There was 1 episode of an infusion catheter kinking, resulting in nonfatal hyperglycemia, but no reported pump‐site infections, mechanical pump failure, or diabetic ketoacidosis (DKA) among patients remaining on CSII.
CLINICAL VIGNETTES
The following cases illustrate potential challenges with CSII use that we have encountered in the hospital.
The Patient Needing Transition to Multiple Daily Insulin Injections
A 29‐year‐old male with T1DM, on CSII, was admitted for fever and chills. His latest glycated hemoglobin (HbA1c) level was 6.8%. His glucose levels started rising, and he wished to be taken off the insulin pump. He was started by the primary team on multiple daily insulin injections (MDII) with insulin glargine and insulin lispro. His glucose levels continued to rise, so an intravenous (IV) insulin infusion was started. Endocrinology was then consulted. The patient's condition was concerning for the potential development of DKA, so he was kept on IV insulin. When he was ready for transitioning to subcutaneous insulin, the pump had been taken home by a family member, and the patient could not recall his CSII basal rates but knew his total basal insulin dose, carbohydrate ratio, and sensitivity factor. Endocrinology assisted in transitioning him from the insulin infusion to MDII based on these recalled doses. When the insulin pump was available, the pump settings were interrogated, and he was transitioned back to it.
Key points:
- Having key hospital personnel trained on CSII, including interrogating the pump's settings, facilitates the transitioning of these patients from one hospital unit, or level of care, to another.
- Accessing the pump's settings involves pushing several buttons on the insulin pump. Because key hospital personnel will encounter patients on different insulin pumps, it may be helpful to keep menu maps handy as a quick reference. A menu map will show at a glance where certain information can be found, such as the basal insulin rate or the sensitivity factor (see examples in Figures 1 and 2).[12, 13]
- Knowing the HbA1c will help determine if pump use has been effective.
The Patient With Technical Problems
An 84‐year‐old gentleman with T2DM was admitted for heart failure and aortic valve replacement. His HbA1c was 6.2%, and he had had several outpatient hypoglycemic events. While on CSII in the hospital, his point of care testing (POCT) glucose readings ranged from 105 to 260 mg/dL. On the afternoon of the third hospital day, POCT readings stayed above 220 mg/dL and rose to 348 mg/dL on the fourth hospital morning, despite multiple blousing and changing the insulin, insertion site, reservoir cartridge, and pump tubing. There was no evidence of infection and no medication change that would have impacted glucose levels. Review of his procedures revealed that he had undergone computed tomography (CT) on the morning of hospital day 3 and wore his pump while being scanned. The pump company was notified.
Key points:
- Patients, and medical and nursing staff, should be reminded to remove insulin pumps for CT scans, magnetic resonance imaging, x‐rays, or other tests with high electromagnetic fields.
- If there is a suspicion of pump malfunction from such a procedure, notify the pump company.
The Patient Who Can Benefit From Inpatient Education
A 70‐year‐old female with T1DM was admitted for heart failure. The patient had been using CSII for 20 years. Her latest HbA1c was 6.9%. She had 1 hypoglycemic event every 1 to 2 weeks. In the hospital, she experienced 2 hypoglycemic events within 3 days, both around bedtime. It was discovered that the patient was giving a bolus of insulin for elevated glucose levels based on the hospital POCT, and when the meal arrived (3060 minutes later), she again delivered a bolus based on her own glucometer reading plus insulin based on the carbohydrates in her meal. The patient was then instructed to request the POCT when her meal tray arrived, and she was taught how to use the pump's built‐in calculator. Glucose excursions improved.
Key points:
- Patients on CSII, though able to exercise autonomy in managing their insulin doses, may also need assistance in dosing insulin properly.
- Although pump education is ideally done on an outpatient basis, hospital‐based providers may encounter patients who need reinforcement of their training while hospitalized. Hospital personnel trained on insulin pumps (such as physicians, nurse practitioners, physician assistants, and certified diabetes educators) can help augment the patient's knowledge while in the hospital. In the absence of such key personnel, patient safety has to be addressed with re‐evaluation of the need to discontinue the pump and switch to multiple doses of subcutaneous insulin.
STEPS IN TAKING CARE OF PATIENTS ON CONTINUOUS SUBCUTANEOUS INSULIN INFUSION
Initial Patient Assessment
On admission, patients are asked whether they use an insulin pump. This is included in the nursing assessment form. If they do, the physician is notified.
The insulin pump might be missed unless specifically asked for because (1) the insulin pump may be thought of more as a device rather than a medication, and (2) the insulin pump may be worn in less obvious areas, not only on the abdomen where providers are more apt to detect it.
Hospital Policy and Insulin Orders
Written hospital policies on how to safely manage patients presenting with an insulin pump will delineate patients who can safely be allowed to continue on the pump, and the responsibilities that come along with this. Our institution has such a policy. Experts from both the legal and biomedical engineering departments were consulted when the policy was crafted. Patients must be fully alert, able, and willing to self‐manage the pump. General contraindications to pump use in the hospital, such as altered mental status or DKA, are listed in Table 1. In addition, patients in the intensive care units are best managed on an IV insulin infusion during their critical illness, in keeping with several society guidelines.[14] Controlling severe hyperglycemia and DKA with multiple boluses through the insulin pump can potentially lead to stacking of insulin with subsequent hypoglycemia.
| Altered state of consciousness |
| Suicidal ideation |
| Prolonged instability of blood glucose levels |
| Diabetic ketoacidosis |
| Patient/family inability or refusal to participate in own care |
| Insulin‐pump malfunction |
| Lack of appropriate supplies for the insulin pump |
| Other circumstances as identified by the physician, resident, or licensed independent practitioner |
In our institution, a computerized insulin pump order set has to be activated. Apart from insulin, POCT, and hypoglycemia‐management orders, this order set contains documents aimed at balancing patient autonomy with delivery of appropriate and safe medical care that the bedside nurse goes over with the patient (Table 2). By policy at our institution, insulin should be dispensed from the hospital's pharmacy (except for that already in the pump), so the order set is linked to the pharmacy and a 3‐mL insulin vial is delivered to the hospital floor and stored in the patient‐specific medication bin. The order set triggers an Endocrinology consult so that the patient can be assessed by key trained personnel.
|
| CSII pump therapy patient agreement |
| Delineates the conditions for continuing on CSII and those for whom it may be discontinued |
| Terms of use and release of liability for patient‐owned equipment |
| Delineates the patient's responsibility for the pump and supplies |
| Patient‐maintained flow sheet for inpatient CSII |
| Includes blood glucose levels (obtained by nurse or patient‐care assistant with the hospital glucose meter) |
| Includes insulin doses (basal, bolus) |
| Includes carbohydrate intake in grams |
Patient Diagnosis
It is important to try to distinguish T1DM vs T2DM, as patients with T1DM are prone to ketoacidosis when the pump is disconnected.
Patient Assessment by the Endocrinology Consult Service
Hospitalized patients on the pump have varying degrees of pump knowledge and skill sets. We have encountered highly trained patients who meticulously count their carbohydrates and double‐check the insulin doses calculated by the built‐in pump calculator, and those who have knowledge gaps because their physicians, and not they themselves, change pump settings at the clinic visits.
Therefore, the Endocrinology consult team members (comprising physicians, nurse practitioners, and certified diabetes educators) go through the following items to be able to order the insulin correctly, assess whether patients are still able and willing to continue on their pump despite their illness, formulate alternative insulin regimens as needed, or help empower patients who may have forgotten some aspects of pump management:
- Insulin pump manufacturer/model.
- Insulin used in the pump.
- Often fast‐acting insulin (lispro, aspart, or glulisine).
- Some patients use regular insulin.
- A few patients use U500 insulin (5 more potent than other insulins).
- Insulin doses/pump settings.
Patients are assessed for:
- Hypoglycemia awareness.
- Previous glucose control.
- Bolus calculation (either using the built‐in calculator, computing this mentally, or using a different calculator).
- Ability to deliver a bolus (including vision and dexterity challenges).
- Ability to change the basal rate, or set a temporary rate, and suspend insulin delivery.
Discussion on Options for Inpatient Management
After assessment, education is provided as needed. If there are concerns on the part of the patient, the primary team, or the Endocrinology team about safe continuation of CSII during the hospitalization, then alternative insulin regimens are discussed. Patients who cannot access their basal rates and cannot adjust the doses are not able to self‐manage; they should be taken off the pump and treated with multiple subcutaneous insulin doses. Conversion to MDII is discussed under Interruption of Continuous Subcutaneous Insulin Infusion for Short and Prolonged Periods.
Provision of Pump Information for Hospital Healthcare Providers
Users of CSII, even if perfectly competent using their pumps in the ambulatory setting, may need assistance in the hospital for various reasons. They may not know what to do for surgical or radiologic procedures (discussed below) and may not be familiar with hospital policies involving CSII. Hospital providers trained on insulin pumps may need a refresher on locating a particular pump setting.
The provider can call the toll‐free number on the back of the pump for assistance (Table 3). Insulin‐pump companies also have menu maps to aid in finding information on pump settings (samples shown in Figures 1 and 2).[12, 13] Documentation of the patient's pump settings will assist in CSII dose changes during the acute illness or assist in switching to MDII if needed. The following information need to be collected:
| Animas Corporation | 877‐937‐7867 |
| Insulet Corporation | 800‐591‐3455 |
| Medtronic | 800‐826‐2099 |
| Roche Diagnostics | 800‐688‐4578 |
Basal Rate
This is the hourly insulin rate delivered for the patient's insulin needs even when not eating. The patient might have one or multiple basal rates in a day, or a different pattern on some days. Because the patient's activity in the hospital will be different from the usual ambulatory activity, we recommend that patients choose only 1 pattern.
Bolus
This is the insulin to cover meals or to correct for hyperglycemia, or both. The patient has to activate buttons for delivery. The patient may or may not be using the built‐in pump calculator.
Carbohydrate Ratio
This is the amount of insulin per quantity of carbohydrate consumed. When patients are initially placed on the insulin pump, they are given a carbohydrate ratio that is derived from a calculation called the rule of 500. In the rule of 500, the number 500 is divided by the patient's total daily insulin dose while on multiple subcutaneous insulin shots. For example, if the patient was on insulin glargine 13 units daily and insulin lispro 4 units 3 daily with meals, 500 divided by 25 gives us a carbohydrate ratio of 20 grams of carbohydrate for 1 unit of insulin (or conversely called insulin‐to‐carbohydrate ratio of 1 unit of insulin for every 20 grams of carbohydrate).
This often comes out to 1 unit for every 1530 grams of carbohydrates in patients with T1DM, and 1 unit for every 515 grams of carbohydrate in patients with T2DM, reflecting the need for a higher insulin dose in the latter.
It is best to ask the patient how many units he or she usually takes for a meal, or to present the patient with an example of a meal and ask how much he or she would take. We have encountered a patient whose carbohydrate ratio was 1, but upon further inquiry, the patient demonstrated that he actually bolused 1 unit for every 1 serving (or 1 unit for every 15 grams) of carbohydrate.
Sensitivity Factor
This is the amount of insulin that would bring the blood glucose to goal. For example, if the patient requires 1 unit of insulin to bring down the blood glucose from 170 mg/dL to 120 mg/dL, then the sensitivity factor of 50 would be seen on the pump screen. Similar to the carbohydrate ratio, a sensitivity factor is calculated when patients are initially placed on the insulin pump. This time, the rule of 1800 is used, where the number 1800 is divided by the patient's total daily insulin dose. In patients with T1DM, this often comes to 30100 mg/dL per 1 unit of insulin; or, conversely, 1 unit for every 30100 mg/dL glucose. For patients with T2DM, this is often 1 unit for every 1025 mg/dL glucose.
This insulin dose is given in addition to the dose resulting from the carbohydrate ratio, or alone if the patient is not eating.
Target
This is the blood glucose goal for the patient, which might be too tight in the presence of acute illness, and therefore would have to be modified. The American Diabetes Association, Endocrine Society, and American Association of Clinical Endocrinologists recommend premeal glucose targets of 140 mg/dL in hospitalized noncritically ill patients on insulin, with re‐evaluation of the insulin dose when premeal glucose levels fall below 100 mg/dL and dose adjustment if they are 70mg/dLunless there is an obvious explanation, such as a missed meal.[14, 15]
Point‐of‐Care Testing for Glucose Monitoring
Our policy specifies that the hospital glucose meter is the meter of record upon which dose adjustments are based. Point‐of‐care testing is performed by our patient care nursing assistants or bedside nurses. The timing is typically before meals, at bedtime, between 2 and 3 AM, and with allowance for other times that patients are used to checking when they were at home, such as after meals. Frequent POCT has to be especially borne in mind for patients with hypoglycemia unawareness. Some patients are used to checking with their own home glucose meters in between these times, and we do work with them with the understanding that dose‐change decisions are based on the hospital glucose meter readings.
Dose Adjustments
Continuous subcutaneous insulin infusion dose adjustments for hypoglycemia and hyperglycemia are usually done in 10% to 20% decrements/emncrements. Our Endocrinology team discusses these with the patients and ensures that the new settings are entered into the pump and into the order set.
INTERRUPTION OF CONTINUOUS SUBCUTANEOUS INSULIN INFUSION FOR SHORT AND PROLONGED PERIODS
Patients with T1DM should not be left without basal insulin. However, pump interruption for 30 minutes to an hour often does not lead to problems. Beyond an hour and certainly closer to 2 to 3 hours off the pump, the patient should be given a subcutaneous insulin injection if the patient is left without easy access to the insulin pump.
The subcutaneous insulin dose for temporary pump suspension can be roughly calculated as hourly basal rate multiplier, where the multiplier is the number of hours that the patient is expected to be disconnected from the pump (for example, hourly basal rate of 0.85 unit/hour 3 hours = 2.55 units, which can be rounded off to 2 or 3 units depending on the patient's general glucose control).
When it has been determined that the patient should come off the pump for substantial periods of time, then subcutaneous insulin injections should be given. This is imperative for the prevention of DKA in patients with T1DM, and highly recommended for maintenance of good glycemic control for patients with T2DM.
Basal Dose
In most cases, these situations stretch for greater than 24 hours, such as surgery and the anticipated recovery from anesthesia. We favor long‐acting insulin for basal needs, given 2 hours before discontinuing the pump. The total basal insulin dose per day can be given as the starting long‐acting insulin dose and then adjusted as needed. The total daily basal insulin dose can be retrieved from the insulin pump. In one study on T1DM patients using insulin lispro on the pump, total daily basal dose was given as insulin glargine without adverse effects.[16] If there is concern for hypoglycemia, then the dose can be reduced by 10% to 20%. Care should be made to ascertain that the basal insulin delivered via the pump is appropriate.
There are several ways to estimate this:
- If the daily total basal and the total prandial insulin requirements approximate a 50:50 ratio, then the basal rate via the pump is appropriate.
- If the daily total basal rate via the pump is similar to a weight‐based estimate of the basal dose (often 0.150.2 units/kg/day in patients with T1DM, 0.20.3 units/kg/day for T2DM, and higher in both cases with longer duration of DM or greater insulin resistance), then the basal rate via the pump is appropriate.
Bolus Dose
Patients can still continue to calculate their sensitivity factor and carbohydrate ratio and request for the equivalent dose of insulin. In the ideal situation, bedside nurses would be taught how to calculate this ratio and dose rapid‐acting insulin accordingly should the patient need to come off the insulin pump. Because of the logistic difficulties of making this uniform in our institution, we have worked instead on providing patients with information on the carbohydrate content of their meal tray. If the pump is discontinued, the patient would continue to calculate their prandial insulin based on their carbohydrates ratio and indicate to the nurse how much he/she would need. Our subcutaneous insulin orders for MDII allow for us to put a range of insulin doses based on the patient's typical insulin needs for mealtime.
Pump Removal for Certain Hospital Procedures
Patients may not remember that the pump has to be removed before entering high‐radiation areas. The pump owner manuals tell patients not to use the pump when going for magnetic resonance imaging, CT scans, or x‐rays, or near equipment with high electromagnetic fields.
Interrogation of the Pump
If there is concern about pump malfunction, patients should be switched to MDII. The pump company can be contacted for pump interrogation and provision of a temporary pump (Table 3).
Pump Disconnection
In our institution, the Radiology department has signage instructing patients to inform the technician if they are wearing an insulin pump. The pump is handed off to a family member or stored until the procedure is over. Another option is to leave it with the bedside nurse or the floor nurse manager for safekeeping. This is less ideal, because the wait for the radiologic procedure might take longer than expected and the patient is left without any insulin on board.
Interruption of Continuous Subcutaneous Insulin Infusion for Surgical Procedures
In our institution, the anesthesiology department has worked with the Endocrinology, Surgery and Medicine departments regarding patients with insulin pumps. Discontinuation of CSII is recommended for surgical procedures longer than 1 hour; patients are asked to continue on the insulin pump until they are taken to the preoperative suite, at which point they are placed on IV insulin infusion. Ideally, there should be an overlap of 1530 minutes. Providing an alternative continuous source of insulin during pump interruption is important, especially for patients with T1DM.[17]
Pump Resumption
Once the patient is ready to resume the pump, any subcutaneous insulin that was delivered and might still be active has to be accounted for and subtracted from the basal pump dose so that hypoglycemia is avoided. An alternative would be to wait until the last basal subcutaneous insulin dose is expected to be cleared before restarting CSII.
SUMMARY
As patients on an insulin pump are increasingly seen in the hospital, inpatient providers have to be able to adapt to these patients' needs. Inpatient providers need to have a working knowledge of the insulin pump. Alternative methods of insulin delivery will have to be discussed with the patient to assure continued safety in the hospital.
Disclosures
Dr. Lansang has served as a Sanofi Advisory Board member.
- http://www.rncos.com/Press_Releases/US‐to‐Dominate‐the‐Global‐Insulin‐Pump‐Market.htm. Accessed on October 25, 2013.
- , , , , , ;T1D Exchange Clinic Network. The T1D exchange clinic registry. J Clin Endocrinol Metab. 2012;97(12):4383–4389.
- , , , et al. Resource utilization with insulin pump therapy for type 2 diabetes mellitus. Am J Manag Care. 2010;16(12):892–896.
- , , , , . Diabetes‐related hospitalization and hospital‐related utilization. In: Diabetes in America. 2nd ed. Bethesda, MD: National Diabetes Data Group, National Institute of Diabetes and Digestive and Kidney Diseases; 1995:553–569. Available at: http://diabetes.niddk.nih.gov/dm/pubs/america/pdf/chapter27.pdf. Accessed February 21, 2013.
- , , , , , . Hyperglycemia: an independent marker of in‐hospital mortality in patients with undiagnosed diabetes. J Clin Endocrinol Metab. 2002;87(3):978–982.
- American Diabetes Association. Standards of medical care in diabetes—2012. Diabetes Care. 2012;35(suppl 1):S11–S63.
- , , , et al;AACE Insulin Pump Management Task Force. Statement by the American Association of Clinical Endocrinologists Consensus Panel on insulin pump management. Endocr Pract. 2010;16(5):746–762.
- , , , et al;American Diabetes Association Diabetes in Hospitals Writing Committee. Management of diabetes and hyperglycemia in hospitals [published correction appears in Diabetes Care. 2004;27(5):1255]. Diabetes Care. 2004;27(2):553–591.
- , , , et al. Randomized study of basal‐bolus insulin therapy in the inpatient management of patients with type 2 diabetes (RABBIT 2 trial). Diabetes Care. 2007;30(9):2181–2186.
- , , , et al. Randomized study of basal‐bolus insulin therapy in the inpatient management of patients with type 2 diabetes undergoing general surgery (RABBIT 2 surgery). Diabetes Care. 2011;34(2):256–261.
- , , , , , . Transitioning insulin pump therapy from the outpatient to the inpatient setting: a review of 6 years' experience with 253 cases. J Diabetes Sci Technol. 2012;6(5):995–1002.
- Medtronic Paradigm Revel insulin pump [menu map]. Northridge, CA: Medtronic. Available at: http://www.medtronicdiabetes.com/sites/default/files/library/download‐library/workbooks/x23_menu_map.pdf. Updated January 22, 2010. Accessed February 2013.
- OneTouch Ping insulin pump [menu map]. West Chester, PA: Animas Corporation.
- , , , et al. American Association of Clinical Endocrinologists and American Diabetes Association consensus statement on inpatient glycemic control. Endocr Pract. 2009;15(4):353–369.
- , , , et al. Management of hyperglycemia in hospitalized patients in non‐critical care setting: an Endocrine Society clinical practice guideline. J Clin Endocrinol Metab. 2012;97(1):16–38.
- , , , . Switch to multiple daily injections with insulin glargine and insulin lispro from continuous subcutaneous insulin infusion with insulin lispro: a randomized, open‐label study using a continuous glucose monitoring system. Endocr Pract. 2005;11(3):157–164.
- , , , , . Perioperative glycemic management in insulin pump patients undergoing noncardiac surgery. Curr Pharm Des. 2012;18(38):6204–6214.
- http://www.rncos.com/Press_Releases/US‐to‐Dominate‐the‐Global‐Insulin‐Pump‐Market.htm. Accessed on October 25, 2013.
- , , , , , ;T1D Exchange Clinic Network. The T1D exchange clinic registry. J Clin Endocrinol Metab. 2012;97(12):4383–4389.
- , , , et al. Resource utilization with insulin pump therapy for type 2 diabetes mellitus. Am J Manag Care. 2010;16(12):892–896.
- , , , , . Diabetes‐related hospitalization and hospital‐related utilization. In: Diabetes in America. 2nd ed. Bethesda, MD: National Diabetes Data Group, National Institute of Diabetes and Digestive and Kidney Diseases; 1995:553–569. Available at: http://diabetes.niddk.nih.gov/dm/pubs/america/pdf/chapter27.pdf. Accessed February 21, 2013.
- , , , , , . Hyperglycemia: an independent marker of in‐hospital mortality in patients with undiagnosed diabetes. J Clin Endocrinol Metab. 2002;87(3):978–982.
- American Diabetes Association. Standards of medical care in diabetes—2012. Diabetes Care. 2012;35(suppl 1):S11–S63.
- , , , et al;AACE Insulin Pump Management Task Force. Statement by the American Association of Clinical Endocrinologists Consensus Panel on insulin pump management. Endocr Pract. 2010;16(5):746–762.
- , , , et al;American Diabetes Association Diabetes in Hospitals Writing Committee. Management of diabetes and hyperglycemia in hospitals [published correction appears in Diabetes Care. 2004;27(5):1255]. Diabetes Care. 2004;27(2):553–591.
- , , , et al. Randomized study of basal‐bolus insulin therapy in the inpatient management of patients with type 2 diabetes (RABBIT 2 trial). Diabetes Care. 2007;30(9):2181–2186.
- , , , et al. Randomized study of basal‐bolus insulin therapy in the inpatient management of patients with type 2 diabetes undergoing general surgery (RABBIT 2 surgery). Diabetes Care. 2011;34(2):256–261.
- , , , , , . Transitioning insulin pump therapy from the outpatient to the inpatient setting: a review of 6 years' experience with 253 cases. J Diabetes Sci Technol. 2012;6(5):995–1002.
- Medtronic Paradigm Revel insulin pump [menu map]. Northridge, CA: Medtronic. Available at: http://www.medtronicdiabetes.com/sites/default/files/library/download‐library/workbooks/x23_menu_map.pdf. Updated January 22, 2010. Accessed February 2013.
- OneTouch Ping insulin pump [menu map]. West Chester, PA: Animas Corporation.
- , , , et al. American Association of Clinical Endocrinologists and American Diabetes Association consensus statement on inpatient glycemic control. Endocr Pract. 2009;15(4):353–369.
- , , , et al. Management of hyperglycemia in hospitalized patients in non‐critical care setting: an Endocrine Society clinical practice guideline. J Clin Endocrinol Metab. 2012;97(1):16–38.
- , , , . Switch to multiple daily injections with insulin glargine and insulin lispro from continuous subcutaneous insulin infusion with insulin lispro: a randomized, open‐label study using a continuous glucose monitoring system. Endocr Pract. 2005;11(3):157–164.
- , , , , . Perioperative glycemic management in insulin pump patients undergoing noncardiac surgery. Curr Pharm Des. 2012;18(38):6204–6214.
Rounding Frequency and Length of Stay
Hospitals are facing growing pressures to operate more efficiently, spurring interest in improving patient flow from the emergency department (ED) to inpatient unit to home. Children's hospitals are often at high occupancy,[1] and EDs are increasingly an entry point for hospital admission.[2, 3]
Among children who require brief episodes of hospital‐based care, hospital processes, especially those associated with discharge, can greatly impact length of stay (LOS). Patients ready for discharge from inpatient units are typically identified through formal physician‐led rounds, in contrast to EDs where discharges occur on a more continual basis. Quantitative descriptions of rounding frequency and LOS are lacking.
The focus of this study was the population of children who had visits for select respiratory illnesses (e.g., asthma, bronchiolitis, pneumonia, and croup) for which there is general consensus regarding treatment, admission, and discharge criteria.[4, 5, 6, 7] The selected illnesses represent common reasons for ED visits[8] and hospitalizations.[9] Hospital stays for these conditions tend to be brief, often 1 to 2 days in duration,[10] and repeated assessments are necessary to determine suitability for discharge.
The primary objectives of this study were to compare discharge patterns in the ED and inpatient settings and to quantify the relationship between discharge timing and LOS in these different clinical settings. A simulation was then used to predict the effect of the timing and frequency of physician‐led rounds on hospital LOS. We hypothesized that increased frequency of simulated physician‐led rounds would lead to meaningful reductions in predicted hospital LOS for children admitted from the ED.
METHODS
Retrospective analyses were conducted using hospital administrative data from pediatric ED visits and resultant inpatient stays. The University of Michigan Institutional Review Board approved the study.
Setting
C. S. Mott Children's Hospital at the University of Michigan is a suburban academic, tertiary care hospital located in Ann Arbor, Michigan. The pediatric emergency department had approximately 20,000 visits per year during the study period, and children were treated in an 11‐bed area. There were 106 pediatric inpatient general care beds during the study years.
Visit Selection
ED visits made by children <18 years old during the 3‐year period between May 1, 2007 and April 30, 2010 were considered eligible for study. Visits were included in the study based on the presence of International Classification of Disease, 9th Revision, Clinical Modification (ICD‐9‐CM) codes for respiratory conditions (asthma [493.xx], pneumonia [480.x‐486.x], croup [464.4], bronchiolitis [466.x], acute bronchospasm [519.11], wheezing [786.07]) in the top 3 ED diagnoses. Visits were excluded if the hospital discharge diagnoses included ICD‐9‐CM codes determined a priori by the study team to represent severe illness (e.g., respiratory failure) or complicated medical conditions (e.g., ventilator dependence) unlikely to respond to short stay care (see Supporting Appendices 1 through 3 in the online version of this article). ED visits that resulted in an admission to the intensive care unit (ICU), a procedure, or telemetry were excluded because these children would be unlikely to respond to short stay care.
Variables
Subject demographic characteristics included age, gender, race, and payer. Visit‐related variables included date and time of ED arrival, date and time of ED disposition (to home or admission), and date and time of hospital discharge if admitted. Arrival date and time were used to determine season (winter: DecemberMarch, spring/summer: AprilAugust, fall: SeptemberNovember) and shift (day: 8 am4 pm, evening: 4 pmmidnight, night: midnight8 am).
Outcome
LOS was the primary outcome. ED LOS was calculated by subtracting the date and time of ED arrival from the date and time of ED disposition. Inpatient LOS was calculated by subtracting the date and time of arrival to the inpatient unit from the date and time of discharge from the hospital admission, discharge, transfer (ADT) system. Total LOS was calculated by subtracting the date and time of ED arrival from the date and time of discharge from either the ED or hospital as appropriate.
Analyses
Descriptive statistics were calculated for patient demographics and actual LOS. To describe discharge timing patterns in the ED and inpatient unit, 24 24, 576‐cell matrices were produced with arrival hour along a horizontal axis and discharge hour along a vertical axis. Visits were grouped by hour of ED or inpatient arrival and the number of these visits that were discharged in each hour was plotted in the appropriate cell in the matrix. Cells were then shaded according to the proportion of discharges that occurred at that hour, for each hour of arrival.
Finally, Monte Carlo simulations were designed to illustrate the impact of the timing and frequency of rounds on inpatient LOS. Historical arrival rates were utilized in the simulations. Because medication administration times were not available in the dataset, active treatment times were fixed at 12 hours and 20 hours. The fixed treatment time of 12 hours was based on research by McConnochie et al.,[11] which found that roughly 65% of children hospitalized for asthma received frequent nebulized treatments for 16 hours (two 8‐hour nursing shifts). Four hours were subtracted from this treatment time because our sample included ED treatment times, and local experience demonstrates that children receive at least 4 hours of ED treatment prior to transfer to an inpatient bed. The 20‐hour fixed treatment time was selected to simulate a sicker population of children.
We assumed that physician‐led rounds were the decision point leading to hospital discharge, and that, at minimum, rounds occurred once each morning. The simulation began with 1 physician‐led rounding session occurring at 9 am. Rounding sessions were then added to the model up to a maximum of 24 hourly rounds. Rounding every hour was considered to be analogous to the 24‐hour operation of an ED, in which patients are discharged at all hours. A 4‐hour lag time between the start of first morning rounds and patient discharge was assumed based on historical discharge times. The lag time for additional rounding times was varied, from a minimum of 2 hours for afternoon rounds to a maximum of 10 hours for evening rounds to allow the patient to sleep. Each simulation completed 10,000 iterations and 95% confidence intervals (CIs) were calculated. All analyses were conducted in Excel 2010 (Microsoft Corp., Redmond, WA).
RESULTS
Study Sample Characteristics
Of the 57,639 pediatric ED visits during the 3‐year study period, 5699 were diagnosed with respiratory conditions considered eligible for this study, and 5503 (96.6%) were included in analyses. Hospitalization was the outcome for 1285 (23.4%) ED visits. Demographic characteristics of the study sample are presented in Table 1. Almost half of the visits were by children <3 years old. Visits for respiratory conditions peaked in the fall and winter months. Daily peaks in ED arrivals occurred in the late afternoon.
| Characteristic | n | % |
|---|---|---|
| ||
| Male | 3291 | 59.8 |
| Age | ||
| 02 years | 2716 | 49.4 |
| 35 years | 1305 | 23.7 |
| 612 years | 1128 | 20.5 |
| >12 years | 354 | 6.4 |
| Season at presentation | ||
| Fall (SeptemberNovember) | 1779 | 32.3 |
| Winter (DecemberMarch) | 2429 | 44.1 |
| Spring/Summer (AprilAugust) | 1295 | 23.5 |
| Shift at time of ED arrival | ||
| Day (8 am4 pm) | 1939 | 35.2 |
| Evening (4 pm12 am) | 2296 | 41.7 |
| Overnight (12 am8 am) | 1268 | 23.0 |
| Payer type | ||
| Public | 1996 | 36.3 |
| Private | 3385 | 61.5 |
| Other | 122 | 2.2 |
| Admitted to general care unit | 1285 | 23.4 |
| ICD‐9 diagnoses | ||
| Asthma (493.xx) | 2229 | 40.5 |
| Pneumonia (480.x‐486.x) | 1006 | 18.3 |
| Croup (464.4) | 1048 | 19.0 |
| Bronchiolitis (466.x) | 605 | 11.0 |
| Other (519.11, 786.07, and multiple diagnoses) | 615 | 11.2 |
Length of Stay
For visits meeting study criteria, median ED LOS was 3.0 hours (interquartile range [IQR] 2.1‐4.1) among ED discharges and 5.1 hours (IQR 4.0‐6.6) among admissions. Of the inpatients, 8.4% were admitted and discharged on the same day, 37.3% were admitted for 1 night, 27.0% were admitted for 2 nights, and 27.3% were admitted for 3 or more nights. Median inpatient LOS was 41.2 hours (IQR 23.4‐66.4), with median total LOS of 46.7 hours (IQR 29.3‐71.5).
Arrival and Discharge Patterns
Figure 1 illustrates the relationship between the ED arrival and disposition times for all included visits. Figure 2 illustrates the relationship between the inpatient arrival and discharge times among the subset of visits that received inpatient care. Children with respiratory illness arrived to the ED at all hours of the day and night and generally were discharged 2 to 5 hours after arrival regardless of the time of day. In contrast, children admitted to the inpatient setting were most commonly discharged between 11 am and 6 pm, regardless of the time of admission.
Simulation
The influence of timing and frequency of rounds on inpatient LOS is shown in Table 2. Once‐daily rounds resulted in a predicted LOS of 27.24 hours (95% CI: 27.0727.41) for the 12‐hour active treatment time simulation and 36.93 hours (95% CI: 36.70‐37.16) for the 20‐hour active treatment time. There were incremental reductions in predicted LOS with each additional rounding session. When the number of rounding sessions reached 24, predicted LOS was 14.5 hours (95% CI: 14.49‐14.51) for the 12‐hour active treatment time simulation and 22.5 hours (95% CI: 22.49‐22.51) for the 20‐hour active treatment time.
| No. of Rounds | Time of Rounds | Rounds to Discharge (Hours) | 12‐Hour Active Treatment Time | 20‐Hour Active Treatment Time | ||
|---|---|---|---|---|---|---|
| Change in Length of Stay (Hours) | % of Reference Length of Stay | Change in Length of Stay (Hours) | % of Reference Length of Stay | |||
| 1 | 0900 | 4 | 27.24 (reference) | 36.93 (reference) | ||
| 2 | 0900 | 4 | 4.84 | 17.8% | 5.34 | 14.4% |
| 1500 | 4 | |||||
| 2 | 0900 | 4 | 5.31 | 19.5% | 5.90 | 16.0% |
| 1500 | 2 | |||||
| 3 | 0900 | 4 | 6.24 | 22.9% | 7.94 | 21.5% |
| 1500 | 2 | |||||
| 2100 | 10 | |||||
| 3 | 0900 | 4 | 7.32 | 26.9% | 10.49 | 28.4% |
| 1500 | 2 | |||||
| 2100 | 2 | |||||
| 24 | Hourly | 2 | 12.74 | 46.8% | 14.2 | 38.7% |
DISCUSSION
Our study illustrates dramatic differences in the discharge patterns from the ED and inpatient settings for children with respiratory illnesses. Although discharges from the ED occur at all hours, inpatient discharges were concentrated during midday. The time of discharge from the ED was highly related to the time of arrival, implying that any lag between discharge decision making and discharge was independent of time of arrival. The absence of a clear relationship between inpatient discharges and arrivals suggests that factors other than the clinical status of patients affect hospital LOS.
Because physician‐led rounds have traditionally been the point of decision‐making regarding inpatient discharge readiness, we hypothesized that increasing the frequency of rounds could reduce LOS. Within the parameters set in our simulation models, our results support this hypothesis. As the number of rounding sessions increased, hospital LOS decreased and the amount of time a child waited to be identified as ready for discharge approached zero. Simulating hourly rounding, analogous to the ED setting, resulted in the greatest reductions in inpatient LOS. Our findings have important implications for hospital operations and discharge policies given that children with respiratory conditions commonly experience short stay hospitalizations,[12, 13] but few children's hospitals have put in place models of care that differentiate the needs of short stay patients from those of inpatients requiring longer LOS.[14] To operationalize inpatient discharges as soon as a child is well enough to go home, parental expectations for discharge timing would need to be set, and discharge planning would need to begin at the start of each hospital stay.
Although there have been numerous studies on ED crowding, its causes, and potential solutions,[15, 16, 17, 18, 19, 20] this study is the first to our knowledge to demonstrate differences in discharge timing between the ED and inpatient general care unit. High levels of hospital occupancy decrease patient flow in both ED and inpatient units.[21, 22, 23, 24, 25] Shifting inpatient discharge for adult patients to earlier in the day can reduce or eliminate inpatient boarding in the ED.[26, 27] Evaluation of these relationships in pediatric populations are needed because of the unique care requirements of acutely ill children who often respond rapidly to hospital‐based treatment. In a recent opinion piece, Iantorno and Fieldston discourage hospitals from setting specified time targets for discharges and propose that high‐quality care includes afternoon and evening discharges.[28] The optimal timing for hospital discharges has not yet been defined, but our results indicate there is potential to reduce excess time spent in hospitals through the addition of rounds that would identify discharges throughout the day.
A simulation study based on hospital administrative data cannot determine a causal relationship between physician‐led rounds and hospital LOS. Still, our findings can generate discussions about hospital discharge policies and patient throughput initiatives. Hospitals can simulate other approaches that may apply to their institutional operations, such as changing rounding processes or adding an observation unit where discharges occur after hours. Hospitals could then pilot approaches locally. With the potential for unintended consequences of patient throughput initiatives that focus only on LOS as an outcome, pilot programs should be designed to track not only ED and inpatient LOS but also family satisfaction, access to follow‐up visits in primary care, need for reassessment in urgent care centers and EDs, and hospital readmissions.
The feasibility and acceptability of afternoon and evening rounds to improve patient throughput must be considered. Clinicians caring for hospitalized patients may have competing demands on their time, such as other clinical obligations, committee work, or academic pursuits that would make more frequent rounding unattractive. Physicians‐in‐training in teaching hospitals have educational requirements and duty‐hour restrictions that may limit their ability to round more frequently.[29, 30] There is also a need to define reasonable minimum standards for discharge processes (e.g., provision of patient education, discharge medications, and paperwork) for short‐stay patients and those requiring prolonged and/or complex hospitalizations. Streamlined discharge processes for short‐stay patients with simple illnesses may result in more efficient discharges. More efficient hospital discharges at flexible hours that are acceptable to families may require a culture shift among hospital staff. Although the palatability of off‐hours inpatient discharges has not been explored with patients and families, some may prefer this approach.
Limitations
There are several limitations to our study. First, the time of discharge is recorded differently for the ED and inpatient settings in our administrative dataset as a function of the electronic medical record systems in these 2 environments. Discharge from the ED reflects that time the patient left the ED but discharge from the inpatient setting reflects the time the patient exits the hospital ADT system. This likely biases our results toward longer LOS in the inpatient setting. We expect this would shift the band of inpatient discharges later in the day but do not expect this to alter the observed difference in discharge patterns between the ED and inpatient settings.
Second, administrative data do not provide information about the physicians making the discharge decisions or valid reasons a child would remain in the hospital after they improved clinically including time for teaching or care coordination. Our results therefore overestimate the amount of excess time associated with inpatient care. Future research is needed to determine the actual duration of time between when a child is clinically well enough for discharge home and when a child is actually discharged. There is also a need to understand discharge decision making and to identify the nonclinical factors that contribute to discharge delays.
Third, our data sample was taken from visits made by children to a pediatric ED nested within a general ED where children are admitted to an adjoining tertiary care academic children's hospital. Our results may not be generalizable to other settings in which children receive hospital‐based care, including freestanding children's hospitals and general hospitals that admit children.
Fourth, we focused our analyses on children with respiratory conditions, excluding visits with diagnoses suggestive of complex comorbid conditions and severe illnesses. Although we anticipate that children with these respiratory conditions treated in other hospitals will be similar to our population, our results may not hold for other conditions or across the full spectrum of severity for acute respiratory illness treated within EDs and inpatient units.
Finally, our simulation model makes assumptions, such as a fixed treatment times and discharge process length, which do not capture the clinical nuances of an individual child's response to hospital‐based treatment. Though much of the clinical complexity of hospital operations is not taken into account in the model, our intended purpose, to explore the influence of different rounding times on LOS, remains valid.
CONCLUSIONS
For children obtaining emergency care for respiratory illnesses, discharges from the ED occur around the clock, whereas discharges from the inpatient general care unit are concentrated during afternoon hours. Simulation models illustrate the potential to reduce hospital LOS by adding rounding sessions. Extending the hours of discharge for hospitalized children with respiratory illnesses may increase efficiency of care but could result in unintended consequences such as fewer opportunities for patient education.
Acknowledgments
The authors acknowledge the Center for Healthcare Engineering and Patient Safety, the Bonder Foundation, the Doctors Company Foundation, the Center for Research on Learning and Teaching, and the University of Michigan Summer Undergraduate Research in Engineering Program for their support of the students who contributed to this project.Disclosures: Funding for data analysis for this project was supported by a grant from the Center for Healthcare Research and Transformation (Dr. Macy). Support for the students working on this project (East, Burns, O'Gara, and Card) was provided through grants from the Center for Research and Teaching at the University of Michigan, the Center for Healthcare Engineering and Patient Safety at the University of Michigan, the Seth Bonder Foundation, and the Doctors Company Foundation. The authors have no financial or other conflicts of interest to disclose.
- , , , et al. Children's hospitals do not acutely respond to high occupancy. Pediatrics. 2010;125(5):974–981.
- , , , et al. Addressing inpatient crowding by smoothing occupancy at children's hospitals. J Hosp Med. 2011;6(8):462–468.
- , . The growing role of emergency departments in hospital admissions. N Engl J Med. 2012;367(5):391–393.
- , , . Managing asthma exacerbations in the emergency department: summary of the National Asthma Education and Prevention Program Expert Panel Report 3 guidelines for the management of asthma exacerbations. J Allergy Clin Immunol. 2009;124(2 suppl):S5–S14.
- American Academy of Pediatrics Subcommittee on Diagnosis and Management of Bronchiolitis. Diagnosis and management of bronchiolitis. Pediatrics. 2006;118(4):1774–1793.
- , , , et al. Executive summary: the management of community‐acquired pneumonia in infants and children older than 3 months of age: clinical practice guidelines by the Pediatric Infectious Diseases Society and the Infectious Diseases Society of America. Clin Infect Dis. 2011;53(7):617–630.
- , , , , . Glucocorticoids for croup. Cochrane Database Syst Rev. 2011(1):CD001955.
- , , , et al. Epidemiology of a pediatric emergency medicine research network: the PECARN Core Data Project. Pediatr Emerg Care. 2006;22(10):689–699.
- , , , et al. Annual report on health care for children and youth in the United States: focus on trends in hospital use and quality. Acad Pediatr. 2011;11(4):263–279.
- , , , , , . Trends in high‐turnover stays among children hospitalized in the United States, 1993–2003. Pediatrics. 2009;123(3):996–1002.
- , , , , , . How commonly are children hospitalized for asthma eligible for care in alternative settings? Arch Pediatr Adolesc Med. 1999;153(1):49–55.
- , , , , . High turnover stays for pediatric asthma in the United States: analysis of the 2006 Kids' Inpatient Database. Med Care. 2010;48(9):827–833.
- , , , et al. Pediatric observation status: are we overlooking a growing population in children's hospitals? J Hosp Med. 2012;7(7):530–536.
- , , , et al. Differences in designations of observation care in US freestanding children's hospitals: are they virtual or real? J Hosp Med. 2012;7(4):287–293.
- , . Overcrowding in the nation's emergency departments: complex causes and disturbing effects. Ann Emerg Med. 2000;35(1):63–68.
- , , . Frequent overcrowding in U.S. emergency departments. Acad Emerg Med. 2001;8(2):151–155.
- , . Emergency department overcrowding in the United States: an emerging threat to patient safety and public health. Emerg Med J. 2003;20(5):402–405.
- , , , et al. Solutions to emergency department 'boarding'[and crowding are underused and may need to be legislated. Health Aff (Millwood). 2012;31(8):1757–1766.
- . Managing emergency department overcrowding. Emerg Med Clin North Am. 2009;27(4):593–603, viii.
- Overcrowding crisis in our nation's emergency departments: is our safety net unraveling? Pediatrics. 2004;114(3):878–888.
- , , , et al. Crowding delays treatment and lengthens emergency department length of stay, even among high‐acuity patients. Ann Emerg Med. 2009;54(4):492–503.e494.
- . Do elective surgical and medical admissions impact emergency department length of stay measurements? Clin Invest Med. 2007;30(5):E177–E182.
- , , , . Unravelling relationships: hospital occupancy levels, discharge timing and emergency department access block. Emerg Med Australas. 2012;24(5):510–517.
- , , , . The effect of hospital bed occupancy on throughput in the pediatric emergency department. Ann Emerg Med. 2009;53(6):767–776.e763.
- , , , , . Impact of admission‐day crowding on the length of stay of pediatric hospitalizations. Pediatrics. 2008;121(4):e718–e730.
- , , , , , . The relationship between inpatient discharge timing and emergency department boarding. J Emerg Med. 2012;42(2):186–196.
- , , . Effect of coupling between emergency department and inpatient unit on the overcrowding in emergency department. Paper presented at: Winter Simulation Conference; 2007; Washington, DC.
- , . Hospitals are not hotels: high‐quality discharges occur around the clock. JAMA Pediatr. 2013;167(7):596–597.
- , , , et al. Duty hour recommendations and implications for meeting the ACGME core competencies: views of residency directors. Mayo Clin Proc. 2011;86(3):185–191.
- , , , . Failure to thrive: pediatric residents weigh in on feasibility trial of the proposed 2008 institute of medicine work hour restrictions. J Grad Med Educ. 2009;1(2):181–184.
Hospitals are facing growing pressures to operate more efficiently, spurring interest in improving patient flow from the emergency department (ED) to inpatient unit to home. Children's hospitals are often at high occupancy,[1] and EDs are increasingly an entry point for hospital admission.[2, 3]
Among children who require brief episodes of hospital‐based care, hospital processes, especially those associated with discharge, can greatly impact length of stay (LOS). Patients ready for discharge from inpatient units are typically identified through formal physician‐led rounds, in contrast to EDs where discharges occur on a more continual basis. Quantitative descriptions of rounding frequency and LOS are lacking.
The focus of this study was the population of children who had visits for select respiratory illnesses (e.g., asthma, bronchiolitis, pneumonia, and croup) for which there is general consensus regarding treatment, admission, and discharge criteria.[4, 5, 6, 7] The selected illnesses represent common reasons for ED visits[8] and hospitalizations.[9] Hospital stays for these conditions tend to be brief, often 1 to 2 days in duration,[10] and repeated assessments are necessary to determine suitability for discharge.
The primary objectives of this study were to compare discharge patterns in the ED and inpatient settings and to quantify the relationship between discharge timing and LOS in these different clinical settings. A simulation was then used to predict the effect of the timing and frequency of physician‐led rounds on hospital LOS. We hypothesized that increased frequency of simulated physician‐led rounds would lead to meaningful reductions in predicted hospital LOS for children admitted from the ED.
METHODS
Retrospective analyses were conducted using hospital administrative data from pediatric ED visits and resultant inpatient stays. The University of Michigan Institutional Review Board approved the study.
Setting
C. S. Mott Children's Hospital at the University of Michigan is a suburban academic, tertiary care hospital located in Ann Arbor, Michigan. The pediatric emergency department had approximately 20,000 visits per year during the study period, and children were treated in an 11‐bed area. There were 106 pediatric inpatient general care beds during the study years.
Visit Selection
ED visits made by children <18 years old during the 3‐year period between May 1, 2007 and April 30, 2010 were considered eligible for study. Visits were included in the study based on the presence of International Classification of Disease, 9th Revision, Clinical Modification (ICD‐9‐CM) codes for respiratory conditions (asthma [493.xx], pneumonia [480.x‐486.x], croup [464.4], bronchiolitis [466.x], acute bronchospasm [519.11], wheezing [786.07]) in the top 3 ED diagnoses. Visits were excluded if the hospital discharge diagnoses included ICD‐9‐CM codes determined a priori by the study team to represent severe illness (e.g., respiratory failure) or complicated medical conditions (e.g., ventilator dependence) unlikely to respond to short stay care (see Supporting Appendices 1 through 3 in the online version of this article). ED visits that resulted in an admission to the intensive care unit (ICU), a procedure, or telemetry were excluded because these children would be unlikely to respond to short stay care.
Variables
Subject demographic characteristics included age, gender, race, and payer. Visit‐related variables included date and time of ED arrival, date and time of ED disposition (to home or admission), and date and time of hospital discharge if admitted. Arrival date and time were used to determine season (winter: DecemberMarch, spring/summer: AprilAugust, fall: SeptemberNovember) and shift (day: 8 am4 pm, evening: 4 pmmidnight, night: midnight8 am).
Outcome
LOS was the primary outcome. ED LOS was calculated by subtracting the date and time of ED arrival from the date and time of ED disposition. Inpatient LOS was calculated by subtracting the date and time of arrival to the inpatient unit from the date and time of discharge from the hospital admission, discharge, transfer (ADT) system. Total LOS was calculated by subtracting the date and time of ED arrival from the date and time of discharge from either the ED or hospital as appropriate.
Analyses
Descriptive statistics were calculated for patient demographics and actual LOS. To describe discharge timing patterns in the ED and inpatient unit, 24 24, 576‐cell matrices were produced with arrival hour along a horizontal axis and discharge hour along a vertical axis. Visits were grouped by hour of ED or inpatient arrival and the number of these visits that were discharged in each hour was plotted in the appropriate cell in the matrix. Cells were then shaded according to the proportion of discharges that occurred at that hour, for each hour of arrival.
Finally, Monte Carlo simulations were designed to illustrate the impact of the timing and frequency of rounds on inpatient LOS. Historical arrival rates were utilized in the simulations. Because medication administration times were not available in the dataset, active treatment times were fixed at 12 hours and 20 hours. The fixed treatment time of 12 hours was based on research by McConnochie et al.,[11] which found that roughly 65% of children hospitalized for asthma received frequent nebulized treatments for 16 hours (two 8‐hour nursing shifts). Four hours were subtracted from this treatment time because our sample included ED treatment times, and local experience demonstrates that children receive at least 4 hours of ED treatment prior to transfer to an inpatient bed. The 20‐hour fixed treatment time was selected to simulate a sicker population of children.
We assumed that physician‐led rounds were the decision point leading to hospital discharge, and that, at minimum, rounds occurred once each morning. The simulation began with 1 physician‐led rounding session occurring at 9 am. Rounding sessions were then added to the model up to a maximum of 24 hourly rounds. Rounding every hour was considered to be analogous to the 24‐hour operation of an ED, in which patients are discharged at all hours. A 4‐hour lag time between the start of first morning rounds and patient discharge was assumed based on historical discharge times. The lag time for additional rounding times was varied, from a minimum of 2 hours for afternoon rounds to a maximum of 10 hours for evening rounds to allow the patient to sleep. Each simulation completed 10,000 iterations and 95% confidence intervals (CIs) were calculated. All analyses were conducted in Excel 2010 (Microsoft Corp., Redmond, WA).
RESULTS
Study Sample Characteristics
Of the 57,639 pediatric ED visits during the 3‐year study period, 5699 were diagnosed with respiratory conditions considered eligible for this study, and 5503 (96.6%) were included in analyses. Hospitalization was the outcome for 1285 (23.4%) ED visits. Demographic characteristics of the study sample are presented in Table 1. Almost half of the visits were by children <3 years old. Visits for respiratory conditions peaked in the fall and winter months. Daily peaks in ED arrivals occurred in the late afternoon.
| Characteristic | n | % |
|---|---|---|
| ||
| Male | 3291 | 59.8 |
| Age | ||
| 02 years | 2716 | 49.4 |
| 35 years | 1305 | 23.7 |
| 612 years | 1128 | 20.5 |
| >12 years | 354 | 6.4 |
| Season at presentation | ||
| Fall (SeptemberNovember) | 1779 | 32.3 |
| Winter (DecemberMarch) | 2429 | 44.1 |
| Spring/Summer (AprilAugust) | 1295 | 23.5 |
| Shift at time of ED arrival | ||
| Day (8 am4 pm) | 1939 | 35.2 |
| Evening (4 pm12 am) | 2296 | 41.7 |
| Overnight (12 am8 am) | 1268 | 23.0 |
| Payer type | ||
| Public | 1996 | 36.3 |
| Private | 3385 | 61.5 |
| Other | 122 | 2.2 |
| Admitted to general care unit | 1285 | 23.4 |
| ICD‐9 diagnoses | ||
| Asthma (493.xx) | 2229 | 40.5 |
| Pneumonia (480.x‐486.x) | 1006 | 18.3 |
| Croup (464.4) | 1048 | 19.0 |
| Bronchiolitis (466.x) | 605 | 11.0 |
| Other (519.11, 786.07, and multiple diagnoses) | 615 | 11.2 |
Length of Stay
For visits meeting study criteria, median ED LOS was 3.0 hours (interquartile range [IQR] 2.1‐4.1) among ED discharges and 5.1 hours (IQR 4.0‐6.6) among admissions. Of the inpatients, 8.4% were admitted and discharged on the same day, 37.3% were admitted for 1 night, 27.0% were admitted for 2 nights, and 27.3% were admitted for 3 or more nights. Median inpatient LOS was 41.2 hours (IQR 23.4‐66.4), with median total LOS of 46.7 hours (IQR 29.3‐71.5).
Arrival and Discharge Patterns
Figure 1 illustrates the relationship between the ED arrival and disposition times for all included visits. Figure 2 illustrates the relationship between the inpatient arrival and discharge times among the subset of visits that received inpatient care. Children with respiratory illness arrived to the ED at all hours of the day and night and generally were discharged 2 to 5 hours after arrival regardless of the time of day. In contrast, children admitted to the inpatient setting were most commonly discharged between 11 am and 6 pm, regardless of the time of admission.
Simulation
The influence of timing and frequency of rounds on inpatient LOS is shown in Table 2. Once‐daily rounds resulted in a predicted LOS of 27.24 hours (95% CI: 27.0727.41) for the 12‐hour active treatment time simulation and 36.93 hours (95% CI: 36.70‐37.16) for the 20‐hour active treatment time. There were incremental reductions in predicted LOS with each additional rounding session. When the number of rounding sessions reached 24, predicted LOS was 14.5 hours (95% CI: 14.49‐14.51) for the 12‐hour active treatment time simulation and 22.5 hours (95% CI: 22.49‐22.51) for the 20‐hour active treatment time.
| No. of Rounds | Time of Rounds | Rounds to Discharge (Hours) | 12‐Hour Active Treatment Time | 20‐Hour Active Treatment Time | ||
|---|---|---|---|---|---|---|
| Change in Length of Stay (Hours) | % of Reference Length of Stay | Change in Length of Stay (Hours) | % of Reference Length of Stay | |||
| 1 | 0900 | 4 | 27.24 (reference) | 36.93 (reference) | ||
| 2 | 0900 | 4 | 4.84 | 17.8% | 5.34 | 14.4% |
| 1500 | 4 | |||||
| 2 | 0900 | 4 | 5.31 | 19.5% | 5.90 | 16.0% |
| 1500 | 2 | |||||
| 3 | 0900 | 4 | 6.24 | 22.9% | 7.94 | 21.5% |
| 1500 | 2 | |||||
| 2100 | 10 | |||||
| 3 | 0900 | 4 | 7.32 | 26.9% | 10.49 | 28.4% |
| 1500 | 2 | |||||
| 2100 | 2 | |||||
| 24 | Hourly | 2 | 12.74 | 46.8% | 14.2 | 38.7% |
DISCUSSION
Our study illustrates dramatic differences in the discharge patterns from the ED and inpatient settings for children with respiratory illnesses. Although discharges from the ED occur at all hours, inpatient discharges were concentrated during midday. The time of discharge from the ED was highly related to the time of arrival, implying that any lag between discharge decision making and discharge was independent of time of arrival. The absence of a clear relationship between inpatient discharges and arrivals suggests that factors other than the clinical status of patients affect hospital LOS.
Because physician‐led rounds have traditionally been the point of decision‐making regarding inpatient discharge readiness, we hypothesized that increasing the frequency of rounds could reduce LOS. Within the parameters set in our simulation models, our results support this hypothesis. As the number of rounding sessions increased, hospital LOS decreased and the amount of time a child waited to be identified as ready for discharge approached zero. Simulating hourly rounding, analogous to the ED setting, resulted in the greatest reductions in inpatient LOS. Our findings have important implications for hospital operations and discharge policies given that children with respiratory conditions commonly experience short stay hospitalizations,[12, 13] but few children's hospitals have put in place models of care that differentiate the needs of short stay patients from those of inpatients requiring longer LOS.[14] To operationalize inpatient discharges as soon as a child is well enough to go home, parental expectations for discharge timing would need to be set, and discharge planning would need to begin at the start of each hospital stay.
Although there have been numerous studies on ED crowding, its causes, and potential solutions,[15, 16, 17, 18, 19, 20] this study is the first to our knowledge to demonstrate differences in discharge timing between the ED and inpatient general care unit. High levels of hospital occupancy decrease patient flow in both ED and inpatient units.[21, 22, 23, 24, 25] Shifting inpatient discharge for adult patients to earlier in the day can reduce or eliminate inpatient boarding in the ED.[26, 27] Evaluation of these relationships in pediatric populations are needed because of the unique care requirements of acutely ill children who often respond rapidly to hospital‐based treatment. In a recent opinion piece, Iantorno and Fieldston discourage hospitals from setting specified time targets for discharges and propose that high‐quality care includes afternoon and evening discharges.[28] The optimal timing for hospital discharges has not yet been defined, but our results indicate there is potential to reduce excess time spent in hospitals through the addition of rounds that would identify discharges throughout the day.
A simulation study based on hospital administrative data cannot determine a causal relationship between physician‐led rounds and hospital LOS. Still, our findings can generate discussions about hospital discharge policies and patient throughput initiatives. Hospitals can simulate other approaches that may apply to their institutional operations, such as changing rounding processes or adding an observation unit where discharges occur after hours. Hospitals could then pilot approaches locally. With the potential for unintended consequences of patient throughput initiatives that focus only on LOS as an outcome, pilot programs should be designed to track not only ED and inpatient LOS but also family satisfaction, access to follow‐up visits in primary care, need for reassessment in urgent care centers and EDs, and hospital readmissions.
The feasibility and acceptability of afternoon and evening rounds to improve patient throughput must be considered. Clinicians caring for hospitalized patients may have competing demands on their time, such as other clinical obligations, committee work, or academic pursuits that would make more frequent rounding unattractive. Physicians‐in‐training in teaching hospitals have educational requirements and duty‐hour restrictions that may limit their ability to round more frequently.[29, 30] There is also a need to define reasonable minimum standards for discharge processes (e.g., provision of patient education, discharge medications, and paperwork) for short‐stay patients and those requiring prolonged and/or complex hospitalizations. Streamlined discharge processes for short‐stay patients with simple illnesses may result in more efficient discharges. More efficient hospital discharges at flexible hours that are acceptable to families may require a culture shift among hospital staff. Although the palatability of off‐hours inpatient discharges has not been explored with patients and families, some may prefer this approach.
Limitations
There are several limitations to our study. First, the time of discharge is recorded differently for the ED and inpatient settings in our administrative dataset as a function of the electronic medical record systems in these 2 environments. Discharge from the ED reflects that time the patient left the ED but discharge from the inpatient setting reflects the time the patient exits the hospital ADT system. This likely biases our results toward longer LOS in the inpatient setting. We expect this would shift the band of inpatient discharges later in the day but do not expect this to alter the observed difference in discharge patterns between the ED and inpatient settings.
Second, administrative data do not provide information about the physicians making the discharge decisions or valid reasons a child would remain in the hospital after they improved clinically including time for teaching or care coordination. Our results therefore overestimate the amount of excess time associated with inpatient care. Future research is needed to determine the actual duration of time between when a child is clinically well enough for discharge home and when a child is actually discharged. There is also a need to understand discharge decision making and to identify the nonclinical factors that contribute to discharge delays.
Third, our data sample was taken from visits made by children to a pediatric ED nested within a general ED where children are admitted to an adjoining tertiary care academic children's hospital. Our results may not be generalizable to other settings in which children receive hospital‐based care, including freestanding children's hospitals and general hospitals that admit children.
Fourth, we focused our analyses on children with respiratory conditions, excluding visits with diagnoses suggestive of complex comorbid conditions and severe illnesses. Although we anticipate that children with these respiratory conditions treated in other hospitals will be similar to our population, our results may not hold for other conditions or across the full spectrum of severity for acute respiratory illness treated within EDs and inpatient units.
Finally, our simulation model makes assumptions, such as a fixed treatment times and discharge process length, which do not capture the clinical nuances of an individual child's response to hospital‐based treatment. Though much of the clinical complexity of hospital operations is not taken into account in the model, our intended purpose, to explore the influence of different rounding times on LOS, remains valid.
CONCLUSIONS
For children obtaining emergency care for respiratory illnesses, discharges from the ED occur around the clock, whereas discharges from the inpatient general care unit are concentrated during afternoon hours. Simulation models illustrate the potential to reduce hospital LOS by adding rounding sessions. Extending the hours of discharge for hospitalized children with respiratory illnesses may increase efficiency of care but could result in unintended consequences such as fewer opportunities for patient education.
Acknowledgments
The authors acknowledge the Center for Healthcare Engineering and Patient Safety, the Bonder Foundation, the Doctors Company Foundation, the Center for Research on Learning and Teaching, and the University of Michigan Summer Undergraduate Research in Engineering Program for their support of the students who contributed to this project.Disclosures: Funding for data analysis for this project was supported by a grant from the Center for Healthcare Research and Transformation (Dr. Macy). Support for the students working on this project (East, Burns, O'Gara, and Card) was provided through grants from the Center for Research and Teaching at the University of Michigan, the Center for Healthcare Engineering and Patient Safety at the University of Michigan, the Seth Bonder Foundation, and the Doctors Company Foundation. The authors have no financial or other conflicts of interest to disclose.
Hospitals are facing growing pressures to operate more efficiently, spurring interest in improving patient flow from the emergency department (ED) to inpatient unit to home. Children's hospitals are often at high occupancy,[1] and EDs are increasingly an entry point for hospital admission.[2, 3]
Among children who require brief episodes of hospital‐based care, hospital processes, especially those associated with discharge, can greatly impact length of stay (LOS). Patients ready for discharge from inpatient units are typically identified through formal physician‐led rounds, in contrast to EDs where discharges occur on a more continual basis. Quantitative descriptions of rounding frequency and LOS are lacking.
The focus of this study was the population of children who had visits for select respiratory illnesses (e.g., asthma, bronchiolitis, pneumonia, and croup) for which there is general consensus regarding treatment, admission, and discharge criteria.[4, 5, 6, 7] The selected illnesses represent common reasons for ED visits[8] and hospitalizations.[9] Hospital stays for these conditions tend to be brief, often 1 to 2 days in duration,[10] and repeated assessments are necessary to determine suitability for discharge.
The primary objectives of this study were to compare discharge patterns in the ED and inpatient settings and to quantify the relationship between discharge timing and LOS in these different clinical settings. A simulation was then used to predict the effect of the timing and frequency of physician‐led rounds on hospital LOS. We hypothesized that increased frequency of simulated physician‐led rounds would lead to meaningful reductions in predicted hospital LOS for children admitted from the ED.
METHODS
Retrospective analyses were conducted using hospital administrative data from pediatric ED visits and resultant inpatient stays. The University of Michigan Institutional Review Board approved the study.
Setting
C. S. Mott Children's Hospital at the University of Michigan is a suburban academic, tertiary care hospital located in Ann Arbor, Michigan. The pediatric emergency department had approximately 20,000 visits per year during the study period, and children were treated in an 11‐bed area. There were 106 pediatric inpatient general care beds during the study years.
Visit Selection
ED visits made by children <18 years old during the 3‐year period between May 1, 2007 and April 30, 2010 were considered eligible for study. Visits were included in the study based on the presence of International Classification of Disease, 9th Revision, Clinical Modification (ICD‐9‐CM) codes for respiratory conditions (asthma [493.xx], pneumonia [480.x‐486.x], croup [464.4], bronchiolitis [466.x], acute bronchospasm [519.11], wheezing [786.07]) in the top 3 ED diagnoses. Visits were excluded if the hospital discharge diagnoses included ICD‐9‐CM codes determined a priori by the study team to represent severe illness (e.g., respiratory failure) or complicated medical conditions (e.g., ventilator dependence) unlikely to respond to short stay care (see Supporting Appendices 1 through 3 in the online version of this article). ED visits that resulted in an admission to the intensive care unit (ICU), a procedure, or telemetry were excluded because these children would be unlikely to respond to short stay care.
Variables
Subject demographic characteristics included age, gender, race, and payer. Visit‐related variables included date and time of ED arrival, date and time of ED disposition (to home or admission), and date and time of hospital discharge if admitted. Arrival date and time were used to determine season (winter: DecemberMarch, spring/summer: AprilAugust, fall: SeptemberNovember) and shift (day: 8 am4 pm, evening: 4 pmmidnight, night: midnight8 am).
Outcome
LOS was the primary outcome. ED LOS was calculated by subtracting the date and time of ED arrival from the date and time of ED disposition. Inpatient LOS was calculated by subtracting the date and time of arrival to the inpatient unit from the date and time of discharge from the hospital admission, discharge, transfer (ADT) system. Total LOS was calculated by subtracting the date and time of ED arrival from the date and time of discharge from either the ED or hospital as appropriate.
Analyses
Descriptive statistics were calculated for patient demographics and actual LOS. To describe discharge timing patterns in the ED and inpatient unit, 24 24, 576‐cell matrices were produced with arrival hour along a horizontal axis and discharge hour along a vertical axis. Visits were grouped by hour of ED or inpatient arrival and the number of these visits that were discharged in each hour was plotted in the appropriate cell in the matrix. Cells were then shaded according to the proportion of discharges that occurred at that hour, for each hour of arrival.
Finally, Monte Carlo simulations were designed to illustrate the impact of the timing and frequency of rounds on inpatient LOS. Historical arrival rates were utilized in the simulations. Because medication administration times were not available in the dataset, active treatment times were fixed at 12 hours and 20 hours. The fixed treatment time of 12 hours was based on research by McConnochie et al.,[11] which found that roughly 65% of children hospitalized for asthma received frequent nebulized treatments for 16 hours (two 8‐hour nursing shifts). Four hours were subtracted from this treatment time because our sample included ED treatment times, and local experience demonstrates that children receive at least 4 hours of ED treatment prior to transfer to an inpatient bed. The 20‐hour fixed treatment time was selected to simulate a sicker population of children.
We assumed that physician‐led rounds were the decision point leading to hospital discharge, and that, at minimum, rounds occurred once each morning. The simulation began with 1 physician‐led rounding session occurring at 9 am. Rounding sessions were then added to the model up to a maximum of 24 hourly rounds. Rounding every hour was considered to be analogous to the 24‐hour operation of an ED, in which patients are discharged at all hours. A 4‐hour lag time between the start of first morning rounds and patient discharge was assumed based on historical discharge times. The lag time for additional rounding times was varied, from a minimum of 2 hours for afternoon rounds to a maximum of 10 hours for evening rounds to allow the patient to sleep. Each simulation completed 10,000 iterations and 95% confidence intervals (CIs) were calculated. All analyses were conducted in Excel 2010 (Microsoft Corp., Redmond, WA).
RESULTS
Study Sample Characteristics
Of the 57,639 pediatric ED visits during the 3‐year study period, 5699 were diagnosed with respiratory conditions considered eligible for this study, and 5503 (96.6%) were included in analyses. Hospitalization was the outcome for 1285 (23.4%) ED visits. Demographic characteristics of the study sample are presented in Table 1. Almost half of the visits were by children <3 years old. Visits for respiratory conditions peaked in the fall and winter months. Daily peaks in ED arrivals occurred in the late afternoon.
| Characteristic | n | % |
|---|---|---|
| ||
| Male | 3291 | 59.8 |
| Age | ||
| 02 years | 2716 | 49.4 |
| 35 years | 1305 | 23.7 |
| 612 years | 1128 | 20.5 |
| >12 years | 354 | 6.4 |
| Season at presentation | ||
| Fall (SeptemberNovember) | 1779 | 32.3 |
| Winter (DecemberMarch) | 2429 | 44.1 |
| Spring/Summer (AprilAugust) | 1295 | 23.5 |
| Shift at time of ED arrival | ||
| Day (8 am4 pm) | 1939 | 35.2 |
| Evening (4 pm12 am) | 2296 | 41.7 |
| Overnight (12 am8 am) | 1268 | 23.0 |
| Payer type | ||
| Public | 1996 | 36.3 |
| Private | 3385 | 61.5 |
| Other | 122 | 2.2 |
| Admitted to general care unit | 1285 | 23.4 |
| ICD‐9 diagnoses | ||
| Asthma (493.xx) | 2229 | 40.5 |
| Pneumonia (480.x‐486.x) | 1006 | 18.3 |
| Croup (464.4) | 1048 | 19.0 |
| Bronchiolitis (466.x) | 605 | 11.0 |
| Other (519.11, 786.07, and multiple diagnoses) | 615 | 11.2 |
Length of Stay
For visits meeting study criteria, median ED LOS was 3.0 hours (interquartile range [IQR] 2.1‐4.1) among ED discharges and 5.1 hours (IQR 4.0‐6.6) among admissions. Of the inpatients, 8.4% were admitted and discharged on the same day, 37.3% were admitted for 1 night, 27.0% were admitted for 2 nights, and 27.3% were admitted for 3 or more nights. Median inpatient LOS was 41.2 hours (IQR 23.4‐66.4), with median total LOS of 46.7 hours (IQR 29.3‐71.5).
Arrival and Discharge Patterns
Figure 1 illustrates the relationship between the ED arrival and disposition times for all included visits. Figure 2 illustrates the relationship between the inpatient arrival and discharge times among the subset of visits that received inpatient care. Children with respiratory illness arrived to the ED at all hours of the day and night and generally were discharged 2 to 5 hours after arrival regardless of the time of day. In contrast, children admitted to the inpatient setting were most commonly discharged between 11 am and 6 pm, regardless of the time of admission.
Simulation
The influence of timing and frequency of rounds on inpatient LOS is shown in Table 2. Once‐daily rounds resulted in a predicted LOS of 27.24 hours (95% CI: 27.0727.41) for the 12‐hour active treatment time simulation and 36.93 hours (95% CI: 36.70‐37.16) for the 20‐hour active treatment time. There were incremental reductions in predicted LOS with each additional rounding session. When the number of rounding sessions reached 24, predicted LOS was 14.5 hours (95% CI: 14.49‐14.51) for the 12‐hour active treatment time simulation and 22.5 hours (95% CI: 22.49‐22.51) for the 20‐hour active treatment time.
| No. of Rounds | Time of Rounds | Rounds to Discharge (Hours) | 12‐Hour Active Treatment Time | 20‐Hour Active Treatment Time | ||
|---|---|---|---|---|---|---|
| Change in Length of Stay (Hours) | % of Reference Length of Stay | Change in Length of Stay (Hours) | % of Reference Length of Stay | |||
| 1 | 0900 | 4 | 27.24 (reference) | 36.93 (reference) | ||
| 2 | 0900 | 4 | 4.84 | 17.8% | 5.34 | 14.4% |
| 1500 | 4 | |||||
| 2 | 0900 | 4 | 5.31 | 19.5% | 5.90 | 16.0% |
| 1500 | 2 | |||||
| 3 | 0900 | 4 | 6.24 | 22.9% | 7.94 | 21.5% |
| 1500 | 2 | |||||
| 2100 | 10 | |||||
| 3 | 0900 | 4 | 7.32 | 26.9% | 10.49 | 28.4% |
| 1500 | 2 | |||||
| 2100 | 2 | |||||
| 24 | Hourly | 2 | 12.74 | 46.8% | 14.2 | 38.7% |
DISCUSSION
Our study illustrates dramatic differences in the discharge patterns from the ED and inpatient settings for children with respiratory illnesses. Although discharges from the ED occur at all hours, inpatient discharges were concentrated during midday. The time of discharge from the ED was highly related to the time of arrival, implying that any lag between discharge decision making and discharge was independent of time of arrival. The absence of a clear relationship between inpatient discharges and arrivals suggests that factors other than the clinical status of patients affect hospital LOS.
Because physician‐led rounds have traditionally been the point of decision‐making regarding inpatient discharge readiness, we hypothesized that increasing the frequency of rounds could reduce LOS. Within the parameters set in our simulation models, our results support this hypothesis. As the number of rounding sessions increased, hospital LOS decreased and the amount of time a child waited to be identified as ready for discharge approached zero. Simulating hourly rounding, analogous to the ED setting, resulted in the greatest reductions in inpatient LOS. Our findings have important implications for hospital operations and discharge policies given that children with respiratory conditions commonly experience short stay hospitalizations,[12, 13] but few children's hospitals have put in place models of care that differentiate the needs of short stay patients from those of inpatients requiring longer LOS.[14] To operationalize inpatient discharges as soon as a child is well enough to go home, parental expectations for discharge timing would need to be set, and discharge planning would need to begin at the start of each hospital stay.
Although there have been numerous studies on ED crowding, its causes, and potential solutions,[15, 16, 17, 18, 19, 20] this study is the first to our knowledge to demonstrate differences in discharge timing between the ED and inpatient general care unit. High levels of hospital occupancy decrease patient flow in both ED and inpatient units.[21, 22, 23, 24, 25] Shifting inpatient discharge for adult patients to earlier in the day can reduce or eliminate inpatient boarding in the ED.[26, 27] Evaluation of these relationships in pediatric populations are needed because of the unique care requirements of acutely ill children who often respond rapidly to hospital‐based treatment. In a recent opinion piece, Iantorno and Fieldston discourage hospitals from setting specified time targets for discharges and propose that high‐quality care includes afternoon and evening discharges.[28] The optimal timing for hospital discharges has not yet been defined, but our results indicate there is potential to reduce excess time spent in hospitals through the addition of rounds that would identify discharges throughout the day.
A simulation study based on hospital administrative data cannot determine a causal relationship between physician‐led rounds and hospital LOS. Still, our findings can generate discussions about hospital discharge policies and patient throughput initiatives. Hospitals can simulate other approaches that may apply to their institutional operations, such as changing rounding processes or adding an observation unit where discharges occur after hours. Hospitals could then pilot approaches locally. With the potential for unintended consequences of patient throughput initiatives that focus only on LOS as an outcome, pilot programs should be designed to track not only ED and inpatient LOS but also family satisfaction, access to follow‐up visits in primary care, need for reassessment in urgent care centers and EDs, and hospital readmissions.
The feasibility and acceptability of afternoon and evening rounds to improve patient throughput must be considered. Clinicians caring for hospitalized patients may have competing demands on their time, such as other clinical obligations, committee work, or academic pursuits that would make more frequent rounding unattractive. Physicians‐in‐training in teaching hospitals have educational requirements and duty‐hour restrictions that may limit their ability to round more frequently.[29, 30] There is also a need to define reasonable minimum standards for discharge processes (e.g., provision of patient education, discharge medications, and paperwork) for short‐stay patients and those requiring prolonged and/or complex hospitalizations. Streamlined discharge processes for short‐stay patients with simple illnesses may result in more efficient discharges. More efficient hospital discharges at flexible hours that are acceptable to families may require a culture shift among hospital staff. Although the palatability of off‐hours inpatient discharges has not been explored with patients and families, some may prefer this approach.
Limitations
There are several limitations to our study. First, the time of discharge is recorded differently for the ED and inpatient settings in our administrative dataset as a function of the electronic medical record systems in these 2 environments. Discharge from the ED reflects that time the patient left the ED but discharge from the inpatient setting reflects the time the patient exits the hospital ADT system. This likely biases our results toward longer LOS in the inpatient setting. We expect this would shift the band of inpatient discharges later in the day but do not expect this to alter the observed difference in discharge patterns between the ED and inpatient settings.
Second, administrative data do not provide information about the physicians making the discharge decisions or valid reasons a child would remain in the hospital after they improved clinically including time for teaching or care coordination. Our results therefore overestimate the amount of excess time associated with inpatient care. Future research is needed to determine the actual duration of time between when a child is clinically well enough for discharge home and when a child is actually discharged. There is also a need to understand discharge decision making and to identify the nonclinical factors that contribute to discharge delays.
Third, our data sample was taken from visits made by children to a pediatric ED nested within a general ED where children are admitted to an adjoining tertiary care academic children's hospital. Our results may not be generalizable to other settings in which children receive hospital‐based care, including freestanding children's hospitals and general hospitals that admit children.
Fourth, we focused our analyses on children with respiratory conditions, excluding visits with diagnoses suggestive of complex comorbid conditions and severe illnesses. Although we anticipate that children with these respiratory conditions treated in other hospitals will be similar to our population, our results may not hold for other conditions or across the full spectrum of severity for acute respiratory illness treated within EDs and inpatient units.
Finally, our simulation model makes assumptions, such as a fixed treatment times and discharge process length, which do not capture the clinical nuances of an individual child's response to hospital‐based treatment. Though much of the clinical complexity of hospital operations is not taken into account in the model, our intended purpose, to explore the influence of different rounding times on LOS, remains valid.
CONCLUSIONS
For children obtaining emergency care for respiratory illnesses, discharges from the ED occur around the clock, whereas discharges from the inpatient general care unit are concentrated during afternoon hours. Simulation models illustrate the potential to reduce hospital LOS by adding rounding sessions. Extending the hours of discharge for hospitalized children with respiratory illnesses may increase efficiency of care but could result in unintended consequences such as fewer opportunities for patient education.
Acknowledgments
The authors acknowledge the Center for Healthcare Engineering and Patient Safety, the Bonder Foundation, the Doctors Company Foundation, the Center for Research on Learning and Teaching, and the University of Michigan Summer Undergraduate Research in Engineering Program for their support of the students who contributed to this project.Disclosures: Funding for data analysis for this project was supported by a grant from the Center for Healthcare Research and Transformation (Dr. Macy). Support for the students working on this project (East, Burns, O'Gara, and Card) was provided through grants from the Center for Research and Teaching at the University of Michigan, the Center for Healthcare Engineering and Patient Safety at the University of Michigan, the Seth Bonder Foundation, and the Doctors Company Foundation. The authors have no financial or other conflicts of interest to disclose.
- , , , et al. Children's hospitals do not acutely respond to high occupancy. Pediatrics. 2010;125(5):974–981.
- , , , et al. Addressing inpatient crowding by smoothing occupancy at children's hospitals. J Hosp Med. 2011;6(8):462–468.
- , . The growing role of emergency departments in hospital admissions. N Engl J Med. 2012;367(5):391–393.
- , , . Managing asthma exacerbations in the emergency department: summary of the National Asthma Education and Prevention Program Expert Panel Report 3 guidelines for the management of asthma exacerbations. J Allergy Clin Immunol. 2009;124(2 suppl):S5–S14.
- American Academy of Pediatrics Subcommittee on Diagnosis and Management of Bronchiolitis. Diagnosis and management of bronchiolitis. Pediatrics. 2006;118(4):1774–1793.
- , , , et al. Executive summary: the management of community‐acquired pneumonia in infants and children older than 3 months of age: clinical practice guidelines by the Pediatric Infectious Diseases Society and the Infectious Diseases Society of America. Clin Infect Dis. 2011;53(7):617–630.
- , , , , . Glucocorticoids for croup. Cochrane Database Syst Rev. 2011(1):CD001955.
- , , , et al. Epidemiology of a pediatric emergency medicine research network: the PECARN Core Data Project. Pediatr Emerg Care. 2006;22(10):689–699.
- , , , et al. Annual report on health care for children and youth in the United States: focus on trends in hospital use and quality. Acad Pediatr. 2011;11(4):263–279.
- , , , , , . Trends in high‐turnover stays among children hospitalized in the United States, 1993–2003. Pediatrics. 2009;123(3):996–1002.
- , , , , , . How commonly are children hospitalized for asthma eligible for care in alternative settings? Arch Pediatr Adolesc Med. 1999;153(1):49–55.
- , , , , . High turnover stays for pediatric asthma in the United States: analysis of the 2006 Kids' Inpatient Database. Med Care. 2010;48(9):827–833.
- , , , et al. Pediatric observation status: are we overlooking a growing population in children's hospitals? J Hosp Med. 2012;7(7):530–536.
- , , , et al. Differences in designations of observation care in US freestanding children's hospitals: are they virtual or real? J Hosp Med. 2012;7(4):287–293.
- , . Overcrowding in the nation's emergency departments: complex causes and disturbing effects. Ann Emerg Med. 2000;35(1):63–68.
- , , . Frequent overcrowding in U.S. emergency departments. Acad Emerg Med. 2001;8(2):151–155.
- , . Emergency department overcrowding in the United States: an emerging threat to patient safety and public health. Emerg Med J. 2003;20(5):402–405.
- , , , et al. Solutions to emergency department 'boarding'[and crowding are underused and may need to be legislated. Health Aff (Millwood). 2012;31(8):1757–1766.
- . Managing emergency department overcrowding. Emerg Med Clin North Am. 2009;27(4):593–603, viii.
- Overcrowding crisis in our nation's emergency departments: is our safety net unraveling? Pediatrics. 2004;114(3):878–888.
- , , , et al. Crowding delays treatment and lengthens emergency department length of stay, even among high‐acuity patients. Ann Emerg Med. 2009;54(4):492–503.e494.
- . Do elective surgical and medical admissions impact emergency department length of stay measurements? Clin Invest Med. 2007;30(5):E177–E182.
- , , , . Unravelling relationships: hospital occupancy levels, discharge timing and emergency department access block. Emerg Med Australas. 2012;24(5):510–517.
- , , , . The effect of hospital bed occupancy on throughput in the pediatric emergency department. Ann Emerg Med. 2009;53(6):767–776.e763.
- , , , , . Impact of admission‐day crowding on the length of stay of pediatric hospitalizations. Pediatrics. 2008;121(4):e718–e730.
- , , , , , . The relationship between inpatient discharge timing and emergency department boarding. J Emerg Med. 2012;42(2):186–196.
- , , . Effect of coupling between emergency department and inpatient unit on the overcrowding in emergency department. Paper presented at: Winter Simulation Conference; 2007; Washington, DC.
- , . Hospitals are not hotels: high‐quality discharges occur around the clock. JAMA Pediatr. 2013;167(7):596–597.
- , , , et al. Duty hour recommendations and implications for meeting the ACGME core competencies: views of residency directors. Mayo Clin Proc. 2011;86(3):185–191.
- , , , . Failure to thrive: pediatric residents weigh in on feasibility trial of the proposed 2008 institute of medicine work hour restrictions. J Grad Med Educ. 2009;1(2):181–184.
- , , , et al. Children's hospitals do not acutely respond to high occupancy. Pediatrics. 2010;125(5):974–981.
- , , , et al. Addressing inpatient crowding by smoothing occupancy at children's hospitals. J Hosp Med. 2011;6(8):462–468.
- , . The growing role of emergency departments in hospital admissions. N Engl J Med. 2012;367(5):391–393.
- , , . Managing asthma exacerbations in the emergency department: summary of the National Asthma Education and Prevention Program Expert Panel Report 3 guidelines for the management of asthma exacerbations. J Allergy Clin Immunol. 2009;124(2 suppl):S5–S14.
- American Academy of Pediatrics Subcommittee on Diagnosis and Management of Bronchiolitis. Diagnosis and management of bronchiolitis. Pediatrics. 2006;118(4):1774–1793.
- , , , et al. Executive summary: the management of community‐acquired pneumonia in infants and children older than 3 months of age: clinical practice guidelines by the Pediatric Infectious Diseases Society and the Infectious Diseases Society of America. Clin Infect Dis. 2011;53(7):617–630.
- , , , , . Glucocorticoids for croup. Cochrane Database Syst Rev. 2011(1):CD001955.
- , , , et al. Epidemiology of a pediatric emergency medicine research network: the PECARN Core Data Project. Pediatr Emerg Care. 2006;22(10):689–699.
- , , , et al. Annual report on health care for children and youth in the United States: focus on trends in hospital use and quality. Acad Pediatr. 2011;11(4):263–279.
- , , , , , . Trends in high‐turnover stays among children hospitalized in the United States, 1993–2003. Pediatrics. 2009;123(3):996–1002.
- , , , , , . How commonly are children hospitalized for asthma eligible for care in alternative settings? Arch Pediatr Adolesc Med. 1999;153(1):49–55.
- , , , , . High turnover stays for pediatric asthma in the United States: analysis of the 2006 Kids' Inpatient Database. Med Care. 2010;48(9):827–833.
- , , , et al. Pediatric observation status: are we overlooking a growing population in children's hospitals? J Hosp Med. 2012;7(7):530–536.
- , , , et al. Differences in designations of observation care in US freestanding children's hospitals: are they virtual or real? J Hosp Med. 2012;7(4):287–293.
- , . Overcrowding in the nation's emergency departments: complex causes and disturbing effects. Ann Emerg Med. 2000;35(1):63–68.
- , , . Frequent overcrowding in U.S. emergency departments. Acad Emerg Med. 2001;8(2):151–155.
- , . Emergency department overcrowding in the United States: an emerging threat to patient safety and public health. Emerg Med J. 2003;20(5):402–405.
- , , , et al. Solutions to emergency department 'boarding'[and crowding are underused and may need to be legislated. Health Aff (Millwood). 2012;31(8):1757–1766.
- . Managing emergency department overcrowding. Emerg Med Clin North Am. 2009;27(4):593–603, viii.
- Overcrowding crisis in our nation's emergency departments: is our safety net unraveling? Pediatrics. 2004;114(3):878–888.
- , , , et al. Crowding delays treatment and lengthens emergency department length of stay, even among high‐acuity patients. Ann Emerg Med. 2009;54(4):492–503.e494.
- . Do elective surgical and medical admissions impact emergency department length of stay measurements? Clin Invest Med. 2007;30(5):E177–E182.
- , , , . Unravelling relationships: hospital occupancy levels, discharge timing and emergency department access block. Emerg Med Australas. 2012;24(5):510–517.
- , , , . The effect of hospital bed occupancy on throughput in the pediatric emergency department. Ann Emerg Med. 2009;53(6):767–776.e763.
- , , , , . Impact of admission‐day crowding on the length of stay of pediatric hospitalizations. Pediatrics. 2008;121(4):e718–e730.
- , , , , , . The relationship between inpatient discharge timing and emergency department boarding. J Emerg Med. 2012;42(2):186–196.
- , , . Effect of coupling between emergency department and inpatient unit on the overcrowding in emergency department. Paper presented at: Winter Simulation Conference; 2007; Washington, DC.
- , . Hospitals are not hotels: high‐quality discharges occur around the clock. JAMA Pediatr. 2013;167(7):596–597.
- , , , et al. Duty hour recommendations and implications for meeting the ACGME core competencies: views of residency directors. Mayo Clin Proc. 2011;86(3):185–191.
- , , , . Failure to thrive: pediatric residents weigh in on feasibility trial of the proposed 2008 institute of medicine work hour restrictions. J Grad Med Educ. 2009;1(2):181–184.
© 2013 Society of Hospital Medicine
Electronic Health Record Solutions May Reduce Hospitalist Malpractice Risk
In another session at the San Francisco conference, David Shapiro, MD, JD, editor of Professional Liability Newsletter, said that EHRs eventually could help hospitalists reduce their medico-legal risk by offering sophisticated alerts and suggestions to help physicians avoid mistakes that might lead to patient harm. “But at the moment, EHR involves more problems than solutions,” Dr. Shapiro said.
He outlined a few of the most common issues:
- Incorrect documentation that can be preserved in perpetuity in the chart;
- Corrections;
- Under-documentation; and
- Over-documentation.

.jpg)
Dr. Shapiro cited an example of the latter, where a physician charted a full-system physical review of a patient in the emergency department, drawing upon pull-down menus on the EHR. But the patient and two companions testified in a malpractice trial that the physician spent less than a minute looking at the patient’s laceration wound—with the documentation discrepancy seriously undercutting the physician’s credibility for the jury. Dr. Shapiro said that the liability risk faced by hospitalists has not been well-described in the medical literature, where hospitalists often are bundled with “non-procedural internists,” although malpractice insurer The Doctors Company of Napa, Calif., reports that the frequency of legal complaints against hospitalists has been rising in recent years. “I have my own list of risk factors for hospitalists, based on what I review for my newsletter,” he said.
The list includes:
- Lack of familiarity between patient and hospitalist;
- Complexity of the hospital landscape;
- Problems at shift handoffs;
- Physician production pressures;
- Test results not ready at time of discharge;
- Informal “curbside” consults; and
- Questions about who is the physician of record in the hospital and when a doctor assumes responsibility for the patient’s care.
Malpractice cases are, of necessity, relatively simple and straightforward, Dr. Shapiro said, because successful negligence claims need to be persuasive to a jury. Hospitalists may assume legal responsibility for a patient’s care just by agreeing over the phone to come and perform a consult.
“If a [hospitalized] patient is getting in trouble, I recommend that you go and see the patient. If you see the patient, then it becomes an issue of your medical judgment.”
And, physicians’ honest mistakes in medical judgment are less likely to become major liability concerns. Regardless of the rising production pressures hospitalists face, he said, “ultimately, you have to figure out how to care for these patients. … Your best defense against malpractice is to practice good medicine.” TH
Larry Beresford is a freelance writer in San Francisco.
In another session at the San Francisco conference, David Shapiro, MD, JD, editor of Professional Liability Newsletter, said that EHRs eventually could help hospitalists reduce their medico-legal risk by offering sophisticated alerts and suggestions to help physicians avoid mistakes that might lead to patient harm. “But at the moment, EHR involves more problems than solutions,” Dr. Shapiro said.
He outlined a few of the most common issues:
- Incorrect documentation that can be preserved in perpetuity in the chart;
- Corrections;
- Under-documentation; and
- Over-documentation.
Dr. Shapiro cited an example of the latter, where a physician charted a full-system physical review of a patient in the emergency department, drawing upon pull-down menus on the EHR. But the patient and two companions testified in a malpractice trial that the physician spent less than a minute looking at the patient’s laceration wound—with the documentation discrepancy seriously undercutting the physician’s credibility for the jury. Dr. Shapiro said that the liability risk faced by hospitalists has not been well-described in the medical literature, where hospitalists often are bundled with “non-procedural internists,” although malpractice insurer The Doctors Company of Napa, Calif., reports that the frequency of legal complaints against hospitalists has been rising in recent years. “I have my own list of risk factors for hospitalists, based on what I review for my newsletter,” he said.
The list includes:
- Lack of familiarity between patient and hospitalist;
- Complexity of the hospital landscape;
- Problems at shift handoffs;
- Physician production pressures;
- Test results not ready at time of discharge;
- Informal “curbside” consults; and
- Questions about who is the physician of record in the hospital and when a doctor assumes responsibility for the patient’s care.
Malpractice cases are, of necessity, relatively simple and straightforward, Dr. Shapiro said, because successful negligence claims need to be persuasive to a jury. Hospitalists may assume legal responsibility for a patient’s care just by agreeing over the phone to come and perform a consult.
“If a [hospitalized] patient is getting in trouble, I recommend that you go and see the patient. If you see the patient, then it becomes an issue of your medical judgment.”
And, physicians’ honest mistakes in medical judgment are less likely to become major liability concerns. Regardless of the rising production pressures hospitalists face, he said, “ultimately, you have to figure out how to care for these patients. … Your best defense against malpractice is to practice good medicine.” TH
Larry Beresford is a freelance writer in San Francisco.
In another session at the San Francisco conference, David Shapiro, MD, JD, editor of Professional Liability Newsletter, said that EHRs eventually could help hospitalists reduce their medico-legal risk by offering sophisticated alerts and suggestions to help physicians avoid mistakes that might lead to patient harm. “But at the moment, EHR involves more problems than solutions,” Dr. Shapiro said.
He outlined a few of the most common issues:
- Incorrect documentation that can be preserved in perpetuity in the chart;
- Corrections;
- Under-documentation; and
- Over-documentation.
Dr. Shapiro cited an example of the latter, where a physician charted a full-system physical review of a patient in the emergency department, drawing upon pull-down menus on the EHR. But the patient and two companions testified in a malpractice trial that the physician spent less than a minute looking at the patient’s laceration wound—with the documentation discrepancy seriously undercutting the physician’s credibility for the jury. Dr. Shapiro said that the liability risk faced by hospitalists has not been well-described in the medical literature, where hospitalists often are bundled with “non-procedural internists,” although malpractice insurer The Doctors Company of Napa, Calif., reports that the frequency of legal complaints against hospitalists has been rising in recent years. “I have my own list of risk factors for hospitalists, based on what I review for my newsletter,” he said.
The list includes:
- Lack of familiarity between patient and hospitalist;
- Complexity of the hospital landscape;
- Problems at shift handoffs;
- Physician production pressures;
- Test results not ready at time of discharge;
- Informal “curbside” consults; and
- Questions about who is the physician of record in the hospital and when a doctor assumes responsibility for the patient’s care.
Malpractice cases are, of necessity, relatively simple and straightforward, Dr. Shapiro said, because successful negligence claims need to be persuasive to a jury. Hospitalists may assume legal responsibility for a patient’s care just by agreeing over the phone to come and perform a consult.
“If a [hospitalized] patient is getting in trouble, I recommend that you go and see the patient. If you see the patient, then it becomes an issue of your medical judgment.”
And, physicians’ honest mistakes in medical judgment are less likely to become major liability concerns. Regardless of the rising production pressures hospitalists face, he said, “ultimately, you have to figure out how to care for these patients. … Your best defense against malpractice is to practice good medicine.” TH
Larry Beresford is a freelance writer in San Francisco.

CENTRIC results signal end of cilenglitide in glioblastoma
AMSTERDAM – The investigational drug cilenglitide failed to improve overall or progression-free survival when added to standard treatment in patients with newly diagnosed glioblastoma.
Overall survival, the primary endpoint of the CENTRIC study, was 26.3 months in both study arms, with more events occurring in the cilenglitide arm than in the control arm (144 vs. 138; hazard ratio, 1.021; P = .86). "We could not identify any subgroup that actually had a benefit from the addition of cilenglitide," said study investigator Dr. Roger Stupp at the multidisciplinary European cancer congresses.

Progression-free survival, according to independent review, was also disappointing, at 10.6 months for the cilenglitide group and 7.9 months for the control group (HR, 0.918; P = .41), reported Dr. Stupp of the Centre Hospitalier Universitaire Vaudois in Lausanne, Switzerland.
These findings signal the end of the line for the drug’s development against this tumor, Dr. Stupp remarked in presenting the results of the large phase III study. "I’m not sure we are at the end of targeting integrins, but we have taken a blow with this strategy," he said.
CENTRIC was performed in 545 patients with newly diagnosed disease and a methylated promoter of the O-6-methylguanine-deoxyribonucleic acid methyltransferase (MGMT) gene.
The median age of enrolled patients was 58 years, with 23% aged 65 years or older. A total of 272 patients were randomized to receive cilenglitide in addition to standard chemoradiotherapy and 272 to chemoradiotherapy alone. Cilenglitide was given at an infused IV dose of 2,000 mg twice weekly. Standard chemoradiotherapy consisted of 75 mg/m2 of temozolomide (TMZ), and radiotherapy consisted of a dose of 30 grays in 2-gray fractions, with maintenance TMZ (150-200 mg/m2 for six cycles).
Another trial whose results were presented was the phase II CORE trial, which enrolled 265 patients with newly diagnosed glioblastoma and unmethylated MGMT. Patients were randomized into three groups: a control arm of standard chemotherapy of TMZ plus radiotherapy, and then maintenance TMZ (n = 89); a standard cilenglitide dosing arm, with patients receiving 2,000 mg twice a week in addition to chemoradiotherapy (n = 88); and an intensive dosing arm, with the dose of cilenglitide upped to 2,000 mg five times a week in addition to chemoradiotherapy (n = 88).
Contrary to the CENTRIC study results, the CORE study findings suggested there was a benefit of adding cilenglitide to standard therapy. Median overall survival was 13.4 months in the control arm, but 16.3 months in the standard cilenglitide dosing arm (hazard ratio, 0.69 vs. control). Median overall survival in the intensive treatment arm was 14.5 months (HR, 0.86 vs. control).

Investigator-assessed progression-free survival also suggested a benefit of adding cilenglitide.
"These findings are inconsistent with the larger, phase III CENTRIC clinical trial," said Dr. L. Burt Nabors of the University of Alabama at Birmingham, who presented the CORE findings. "This is a limited study. It was more exploratory in nature, with a sample size that was obviously smaller." He suggested that further investigations are required to look at possible biomarkers.
Commenting on the CENTRIC study, Dr. Michael Brada of University College Hospital, London, observed: "It’s been a bumpy year for randomized trials." Recent trials in glioblastoma have generally been disappointing, and the CENTRIC study results now add to the negative results.
Additional phase I/II trials are investigating the potential of cilenglitide in combination with radiotherapy and chemotherapy in patients with locally advanced non–small cell lung cancer (NCT01118676), and in combination with chemotherapy in patients with recurrent/metastatic squamous cell carcinoma of the head and neck (NCT00705016).
The CENTRIC and CORE studies were sponsored by Merck. Dr. Stupp has received honoraria for consultancy work from Merck Serono, MSD-Merck, and Roche/Genentech. Dr. Nabors had no conflicts of interest to disclose. Dr. Brada has participated on advisory boards for Roche and Merck.
AMSTERDAM – The investigational drug cilenglitide failed to improve overall or progression-free survival when added to standard treatment in patients with newly diagnosed glioblastoma.
Overall survival, the primary endpoint of the CENTRIC study, was 26.3 months in both study arms, with more events occurring in the cilenglitide arm than in the control arm (144 vs. 138; hazard ratio, 1.021; P = .86). "We could not identify any subgroup that actually had a benefit from the addition of cilenglitide," said study investigator Dr. Roger Stupp at the multidisciplinary European cancer congresses.
Progression-free survival, according to independent review, was also disappointing, at 10.6 months for the cilenglitide group and 7.9 months for the control group (HR, 0.918; P = .41), reported Dr. Stupp of the Centre Hospitalier Universitaire Vaudois in Lausanne, Switzerland.
These findings signal the end of the line for the drug’s development against this tumor, Dr. Stupp remarked in presenting the results of the large phase III study. "I’m not sure we are at the end of targeting integrins, but we have taken a blow with this strategy," he said.
CENTRIC was performed in 545 patients with newly diagnosed disease and a methylated promoter of the O-6-methylguanine-deoxyribonucleic acid methyltransferase (MGMT) gene.
The median age of enrolled patients was 58 years, with 23% aged 65 years or older. A total of 272 patients were randomized to receive cilenglitide in addition to standard chemoradiotherapy and 272 to chemoradiotherapy alone. Cilenglitide was given at an infused IV dose of 2,000 mg twice weekly. Standard chemoradiotherapy consisted of 75 mg/m2 of temozolomide (TMZ), and radiotherapy consisted of a dose of 30 grays in 2-gray fractions, with maintenance TMZ (150-200 mg/m2 for six cycles).
Another trial whose results were presented was the phase II CORE trial, which enrolled 265 patients with newly diagnosed glioblastoma and unmethylated MGMT. Patients were randomized into three groups: a control arm of standard chemotherapy of TMZ plus radiotherapy, and then maintenance TMZ (n = 89); a standard cilenglitide dosing arm, with patients receiving 2,000 mg twice a week in addition to chemoradiotherapy (n = 88); and an intensive dosing arm, with the dose of cilenglitide upped to 2,000 mg five times a week in addition to chemoradiotherapy (n = 88).
Contrary to the CENTRIC study results, the CORE study findings suggested there was a benefit of adding cilenglitide to standard therapy. Median overall survival was 13.4 months in the control arm, but 16.3 months in the standard cilenglitide dosing arm (hazard ratio, 0.69 vs. control). Median overall survival in the intensive treatment arm was 14.5 months (HR, 0.86 vs. control).
Investigator-assessed progression-free survival also suggested a benefit of adding cilenglitide.
"These findings are inconsistent with the larger, phase III CENTRIC clinical trial," said Dr. L. Burt Nabors of the University of Alabama at Birmingham, who presented the CORE findings. "This is a limited study. It was more exploratory in nature, with a sample size that was obviously smaller." He suggested that further investigations are required to look at possible biomarkers.
Commenting on the CENTRIC study, Dr. Michael Brada of University College Hospital, London, observed: "It’s been a bumpy year for randomized trials." Recent trials in glioblastoma have generally been disappointing, and the CENTRIC study results now add to the negative results.
Additional phase I/II trials are investigating the potential of cilenglitide in combination with radiotherapy and chemotherapy in patients with locally advanced non–small cell lung cancer (NCT01118676), and in combination with chemotherapy in patients with recurrent/metastatic squamous cell carcinoma of the head and neck (NCT00705016).
The CENTRIC and CORE studies were sponsored by Merck. Dr. Stupp has received honoraria for consultancy work from Merck Serono, MSD-Merck, and Roche/Genentech. Dr. Nabors had no conflicts of interest to disclose. Dr. Brada has participated on advisory boards for Roche and Merck.
AMSTERDAM – The investigational drug cilenglitide failed to improve overall or progression-free survival when added to standard treatment in patients with newly diagnosed glioblastoma.
Overall survival, the primary endpoint of the CENTRIC study, was 26.3 months in both study arms, with more events occurring in the cilenglitide arm than in the control arm (144 vs. 138; hazard ratio, 1.021; P = .86). "We could not identify any subgroup that actually had a benefit from the addition of cilenglitide," said study investigator Dr. Roger Stupp at the multidisciplinary European cancer congresses.
Progression-free survival, according to independent review, was also disappointing, at 10.6 months for the cilenglitide group and 7.9 months for the control group (HR, 0.918; P = .41), reported Dr. Stupp of the Centre Hospitalier Universitaire Vaudois in Lausanne, Switzerland.
These findings signal the end of the line for the drug’s development against this tumor, Dr. Stupp remarked in presenting the results of the large phase III study. "I’m not sure we are at the end of targeting integrins, but we have taken a blow with this strategy," he said.
CENTRIC was performed in 545 patients with newly diagnosed disease and a methylated promoter of the O-6-methylguanine-deoxyribonucleic acid methyltransferase (MGMT) gene.
The median age of enrolled patients was 58 years, with 23% aged 65 years or older. A total of 272 patients were randomized to receive cilenglitide in addition to standard chemoradiotherapy and 272 to chemoradiotherapy alone. Cilenglitide was given at an infused IV dose of 2,000 mg twice weekly. Standard chemoradiotherapy consisted of 75 mg/m2 of temozolomide (TMZ), and radiotherapy consisted of a dose of 30 grays in 2-gray fractions, with maintenance TMZ (150-200 mg/m2 for six cycles).
Another trial whose results were presented was the phase II CORE trial, which enrolled 265 patients with newly diagnosed glioblastoma and unmethylated MGMT. Patients were randomized into three groups: a control arm of standard chemotherapy of TMZ plus radiotherapy, and then maintenance TMZ (n = 89); a standard cilenglitide dosing arm, with patients receiving 2,000 mg twice a week in addition to chemoradiotherapy (n = 88); and an intensive dosing arm, with the dose of cilenglitide upped to 2,000 mg five times a week in addition to chemoradiotherapy (n = 88).
Contrary to the CENTRIC study results, the CORE study findings suggested there was a benefit of adding cilenglitide to standard therapy. Median overall survival was 13.4 months in the control arm, but 16.3 months in the standard cilenglitide dosing arm (hazard ratio, 0.69 vs. control). Median overall survival in the intensive treatment arm was 14.5 months (HR, 0.86 vs. control).
Investigator-assessed progression-free survival also suggested a benefit of adding cilenglitide.
"These findings are inconsistent with the larger, phase III CENTRIC clinical trial," said Dr. L. Burt Nabors of the University of Alabama at Birmingham, who presented the CORE findings. "This is a limited study. It was more exploratory in nature, with a sample size that was obviously smaller." He suggested that further investigations are required to look at possible biomarkers.
Commenting on the CENTRIC study, Dr. Michael Brada of University College Hospital, London, observed: "It’s been a bumpy year for randomized trials." Recent trials in glioblastoma have generally been disappointing, and the CENTRIC study results now add to the negative results.
Additional phase I/II trials are investigating the potential of cilenglitide in combination with radiotherapy and chemotherapy in patients with locally advanced non–small cell lung cancer (NCT01118676), and in combination with chemotherapy in patients with recurrent/metastatic squamous cell carcinoma of the head and neck (NCT00705016).
The CENTRIC and CORE studies were sponsored by Merck. Dr. Stupp has received honoraria for consultancy work from Merck Serono, MSD-Merck, and Roche/Genentech. Dr. Nabors had no conflicts of interest to disclose. Dr. Brada has participated on advisory boards for Roche and Merck.
AT THE EUROPEAN CANCER CONGRESS 2013
Major finding: Overall survival was 26.3 months in both study arms, and more events occurred in the cilenglitide arm than in the control arm (144 vs. 138; hazard ratio, 1.021; P = .86).
Data source: Two multicenter, randomized trials of newly diagnosed glioblastoma patients: CENTRIC, a double-blind phase III study of 545 glioblastoma patients treated with standard chemoradiotherapy with or without additional cilenglitide; and CORE, an open-label phase II study of standard or intensively dosed cilenglitide added to standard chemoradiotherapy.
Disclosures: The CENTRIC and CORE studies were sponsored by Merck. Dr. Stupp has received honoraria for consultancy work from Merck Serono, MSD-Merck, and Roche/Genentech. Dr. Nabors had no conflicts of interest to disclose. Dr. Brada has participated on advisory boards for Roche and Merck.

Many gout patients not reaching treatment goals
SAN DIEGO – A high percentage of gout patients treated by rheumatologists do not meet the treatment goals established by the American College of Rheumatology, even after 6 months of higher-dose urate-lowering therapy, results from a national survey found.
"These findings suggest that even among rheumatologists, gout management may not be optimal and may be inadequately aggressive in the most severe patients," Dr. Max Hamburger said at the annual meeting of the American College of Rheumatology. "It seems that there is further study needed to determine the long-term impact of the new ACR guidelines."
In 2012 the ACR published updated guidelines for the management of gout and hyperuricemia (Arth. Care and Res. 2012;64:1431-46). The recommendations included a call for treat-to-target serum uric acid (sUA) of below 6 mg/dL at a minimum, and below 5 mg/dL in select patients. "The intent of this treat-to-target was to durably improve signs and symptoms of gout and also to address palpable and visible tophi," said Dr. Hamburger, a rheumatologist who practices in Melville, N.Y. "The extent to which current practice among rheumatologists aligns with the guidelines is unknown. The areas in which the guidelines may help improve gout treatment also remains to be determined."

He and his associates set out to assess symptoms, treatment, and outcomes among gout patients treated by rheumatologists in the United States and to identify gaps that might exist in current practice with the new ACR recommendations. They recruited a national sample of rheumatologists to report gout patient encounters prospectively during Jan. 15 to Feb. 22, 2013. Rheumatologists were eligible for the study if they were board certified or board eligible in rheumatology, if they spent at least 70% of their time on patient care, if they were in practice for at least 2 years, and if they saw at least four gout patients per month.
The researchers collected anonymous patient data, including demographics, history with the rheumatology practice, gout symptoms and severity, rheumatologist assessment of disease control, and gout medications and treatment changes at the time of each visit. They applied the ACR working case scenarios and grouped patients by increasing level of disease severity. Patients in the scenarios 1-3 group had intermittent symptoms and no tophi (mild disease); patients in the scenarios 4-6 group had intermittent symptoms and 1 tophus or more (moderate disease), and patients in the scenarios 7-9 group had chronic tophaceous gouty arthropathy (more severe disease). Higher-dose ULT was defined as greater than 300 mg/day of allopurinol or 80 mg or more per day of febuxostat (Uloric).
Dr. Hamburger reported results from 127 rheumatologists who received 2,380 valid patient encounter forms. Most of the patients (79%) were male, their mean age was 61 years, and 72% were seen by a rheumatologist for 6 months or longer. Based on ACR scenario groupings, 68% were in the scenarios 1-3 group, 4% were in the scenarios 4-6 group, and 28% were in the scenarios 7-9 group.
Most patients in the scenarios 1-3 group were judged by the rheumatologists to have controlled disease, compared with 91% of patients in the scenarios 4-6 group and 81% of patients in the scenarios 7-9 group. In addition, 14% of patients in the scenarios 1-3 group were on higher-dose ULT, compared with 28% in the scenarios 4-6 group and 40% in the scenarios 7-9 group. Nearly one-quarter of all patients (24%) were on higher-dose ULT.
Among patients on higher-dose ULT, 45% of those in the scenarios 1-3 group had an sUA greater than 6 mg/dL, compared with 53% in the scenarios 4-6 group and 61% in the scenarios 7-9 group. "Despite elevated sUA, 45% of encounters did not result in an increased ULT dose or treatment change at this visit," Dr. Hamburger said.
Even with 6 months or more at higher-dose ULT, only 55% of patients overall had an sUA at or below guideline recommendations of 6 mg/dL, including only 40% of patients in the scenarios 7-9 group. In addition, 16% of patients overall had an sUA between 6 and 6.8 mg/dL, despite being on higher-dose ULT for 6 months or longer.
Dr. Hamburger acknowledged certain limitations of the study, including the fact that "rheumatologist participation in this market research may be biased based on willingness to participate in online data collection over the reporting period," he said. In addition, "a varying number of encounter forms were provided by each participant and based on estimated patient volume. Not all participants reported on 100% of their patients during the reporting period."
Dr. Hamburger disclosed that he is a speaker for Savient Pharmaceuticals, which markets the gout drug pegloticase (Krystexxa), and Takeda Pharmaceuticals, which markets febuxostat and colchicine (Colcrys). Funding for the market research used in the study was provided by Savient.
SAN DIEGO – A high percentage of gout patients treated by rheumatologists do not meet the treatment goals established by the American College of Rheumatology, even after 6 months of higher-dose urate-lowering therapy, results from a national survey found.
"These findings suggest that even among rheumatologists, gout management may not be optimal and may be inadequately aggressive in the most severe patients," Dr. Max Hamburger said at the annual meeting of the American College of Rheumatology. "It seems that there is further study needed to determine the long-term impact of the new ACR guidelines."
In 2012 the ACR published updated guidelines for the management of gout and hyperuricemia (Arth. Care and Res. 2012;64:1431-46). The recommendations included a call for treat-to-target serum uric acid (sUA) of below 6 mg/dL at a minimum, and below 5 mg/dL in select patients. "The intent of this treat-to-target was to durably improve signs and symptoms of gout and also to address palpable and visible tophi," said Dr. Hamburger, a rheumatologist who practices in Melville, N.Y. "The extent to which current practice among rheumatologists aligns with the guidelines is unknown. The areas in which the guidelines may help improve gout treatment also remains to be determined."
He and his associates set out to assess symptoms, treatment, and outcomes among gout patients treated by rheumatologists in the United States and to identify gaps that might exist in current practice with the new ACR recommendations. They recruited a national sample of rheumatologists to report gout patient encounters prospectively during Jan. 15 to Feb. 22, 2013. Rheumatologists were eligible for the study if they were board certified or board eligible in rheumatology, if they spent at least 70% of their time on patient care, if they were in practice for at least 2 years, and if they saw at least four gout patients per month.
The researchers collected anonymous patient data, including demographics, history with the rheumatology practice, gout symptoms and severity, rheumatologist assessment of disease control, and gout medications and treatment changes at the time of each visit. They applied the ACR working case scenarios and grouped patients by increasing level of disease severity. Patients in the scenarios 1-3 group had intermittent symptoms and no tophi (mild disease); patients in the scenarios 4-6 group had intermittent symptoms and 1 tophus or more (moderate disease), and patients in the scenarios 7-9 group had chronic tophaceous gouty arthropathy (more severe disease). Higher-dose ULT was defined as greater than 300 mg/day of allopurinol or 80 mg or more per day of febuxostat (Uloric).
Dr. Hamburger reported results from 127 rheumatologists who received 2,380 valid patient encounter forms. Most of the patients (79%) were male, their mean age was 61 years, and 72% were seen by a rheumatologist for 6 months or longer. Based on ACR scenario groupings, 68% were in the scenarios 1-3 group, 4% were in the scenarios 4-6 group, and 28% were in the scenarios 7-9 group.
Most patients in the scenarios 1-3 group were judged by the rheumatologists to have controlled disease, compared with 91% of patients in the scenarios 4-6 group and 81% of patients in the scenarios 7-9 group. In addition, 14% of patients in the scenarios 1-3 group were on higher-dose ULT, compared with 28% in the scenarios 4-6 group and 40% in the scenarios 7-9 group. Nearly one-quarter of all patients (24%) were on higher-dose ULT.
Among patients on higher-dose ULT, 45% of those in the scenarios 1-3 group had an sUA greater than 6 mg/dL, compared with 53% in the scenarios 4-6 group and 61% in the scenarios 7-9 group. "Despite elevated sUA, 45% of encounters did not result in an increased ULT dose or treatment change at this visit," Dr. Hamburger said.
Even with 6 months or more at higher-dose ULT, only 55% of patients overall had an sUA at or below guideline recommendations of 6 mg/dL, including only 40% of patients in the scenarios 7-9 group. In addition, 16% of patients overall had an sUA between 6 and 6.8 mg/dL, despite being on higher-dose ULT for 6 months or longer.
Dr. Hamburger acknowledged certain limitations of the study, including the fact that "rheumatologist participation in this market research may be biased based on willingness to participate in online data collection over the reporting period," he said. In addition, "a varying number of encounter forms were provided by each participant and based on estimated patient volume. Not all participants reported on 100% of their patients during the reporting period."
Dr. Hamburger disclosed that he is a speaker for Savient Pharmaceuticals, which markets the gout drug pegloticase (Krystexxa), and Takeda Pharmaceuticals, which markets febuxostat and colchicine (Colcrys). Funding for the market research used in the study was provided by Savient.
SAN DIEGO – A high percentage of gout patients treated by rheumatologists do not meet the treatment goals established by the American College of Rheumatology, even after 6 months of higher-dose urate-lowering therapy, results from a national survey found.
"These findings suggest that even among rheumatologists, gout management may not be optimal and may be inadequately aggressive in the most severe patients," Dr. Max Hamburger said at the annual meeting of the American College of Rheumatology. "It seems that there is further study needed to determine the long-term impact of the new ACR guidelines."
In 2012 the ACR published updated guidelines for the management of gout and hyperuricemia (Arth. Care and Res. 2012;64:1431-46). The recommendations included a call for treat-to-target serum uric acid (sUA) of below 6 mg/dL at a minimum, and below 5 mg/dL in select patients. "The intent of this treat-to-target was to durably improve signs and symptoms of gout and also to address palpable and visible tophi," said Dr. Hamburger, a rheumatologist who practices in Melville, N.Y. "The extent to which current practice among rheumatologists aligns with the guidelines is unknown. The areas in which the guidelines may help improve gout treatment also remains to be determined."
He and his associates set out to assess symptoms, treatment, and outcomes among gout patients treated by rheumatologists in the United States and to identify gaps that might exist in current practice with the new ACR recommendations. They recruited a national sample of rheumatologists to report gout patient encounters prospectively during Jan. 15 to Feb. 22, 2013. Rheumatologists were eligible for the study if they were board certified or board eligible in rheumatology, if they spent at least 70% of their time on patient care, if they were in practice for at least 2 years, and if they saw at least four gout patients per month.
The researchers collected anonymous patient data, including demographics, history with the rheumatology practice, gout symptoms and severity, rheumatologist assessment of disease control, and gout medications and treatment changes at the time of each visit. They applied the ACR working case scenarios and grouped patients by increasing level of disease severity. Patients in the scenarios 1-3 group had intermittent symptoms and no tophi (mild disease); patients in the scenarios 4-6 group had intermittent symptoms and 1 tophus or more (moderate disease), and patients in the scenarios 7-9 group had chronic tophaceous gouty arthropathy (more severe disease). Higher-dose ULT was defined as greater than 300 mg/day of allopurinol or 80 mg or more per day of febuxostat (Uloric).
Dr. Hamburger reported results from 127 rheumatologists who received 2,380 valid patient encounter forms. Most of the patients (79%) were male, their mean age was 61 years, and 72% were seen by a rheumatologist for 6 months or longer. Based on ACR scenario groupings, 68% were in the scenarios 1-3 group, 4% were in the scenarios 4-6 group, and 28% were in the scenarios 7-9 group.
Most patients in the scenarios 1-3 group were judged by the rheumatologists to have controlled disease, compared with 91% of patients in the scenarios 4-6 group and 81% of patients in the scenarios 7-9 group. In addition, 14% of patients in the scenarios 1-3 group were on higher-dose ULT, compared with 28% in the scenarios 4-6 group and 40% in the scenarios 7-9 group. Nearly one-quarter of all patients (24%) were on higher-dose ULT.
Among patients on higher-dose ULT, 45% of those in the scenarios 1-3 group had an sUA greater than 6 mg/dL, compared with 53% in the scenarios 4-6 group and 61% in the scenarios 7-9 group. "Despite elevated sUA, 45% of encounters did not result in an increased ULT dose or treatment change at this visit," Dr. Hamburger said.
Even with 6 months or more at higher-dose ULT, only 55% of patients overall had an sUA at or below guideline recommendations of 6 mg/dL, including only 40% of patients in the scenarios 7-9 group. In addition, 16% of patients overall had an sUA between 6 and 6.8 mg/dL, despite being on higher-dose ULT for 6 months or longer.
Dr. Hamburger acknowledged certain limitations of the study, including the fact that "rheumatologist participation in this market research may be biased based on willingness to participate in online data collection over the reporting period," he said. In addition, "a varying number of encounter forms were provided by each participant and based on estimated patient volume. Not all participants reported on 100% of their patients during the reporting period."
Dr. Hamburger disclosed that he is a speaker for Savient Pharmaceuticals, which markets the gout drug pegloticase (Krystexxa), and Takeda Pharmaceuticals, which markets febuxostat and colchicine (Colcrys). Funding for the market research used in the study was provided by Savient.
AT THE ACR ANNUAL MEETING
Major finding: Even with 6 months or more at higher-dose urate-lowering therapy, only 55% of gout patients overall had a serum uric acid level at or below ACR guideline recommendations of 6.0 mg/dL, including only 40% of patients with the most severe disease.
Data source: A study of 127 rheumatologists who reported on encounters with 2,380 gout patients during Jan. 15 to Feb. 22, 2013.
Disclosures: Dr. Hamburger disclosed that he is a speaker for Savient Pharmaceuticals and Takeda Pharmaceuticals. Funding for the market research used in the study was provided by Savient.

Navigation in Total Knee Arthroplasty: Truth, Myths, and Controversies
The overall success of total knee arthroplasty (TKA) depends on proper implant choice, meticulous surgical technique, appropriate patient selection, and
effective postoperative rehabilitation. Inappropriate technique leads to suboptimal placement of implants in coronal, sagittal, or axial planes.1-3 This results in eccentric prosthetic loading, which may contribute to accelerated polyethylene wear, early component loosening, higher rates of revision surgery, and unsatisfactory clinical outcomes. The need to optimize component positioning during TKA stimulated the development of computer-assisted navigation in TKA in the late 1990’s. Proponents of this technology believe that it helps to reduce outliers, improves coronal, sagittal, and rotational alignment, and optimizes flexion and extension gap-balancing. This is believed to result in improved implant survival and better functional outcomes. However, despite these postulated advantages, less than 5% of surgeons in the United States currently use navigation during TKA perhaps due to concerns of costs, increased operating time, learn- ing curve issues, and lack of improvement in functional outcomes at mid-term follow-up.
Navigated TKA, due to its accuracy and low margins of error, has the potential to reduce component malalignment to within 1o to 2o of neutral mechanical axis.4 However, others have reported that alignment of the femoral and tibial components achieved with computer navigation is not different than TKA using conventional techniques.5-12 This lack of improvement reported in these studies may be due to a number of potential sources of errors, which can be either surgeon- or device-related. These errors may pre-dispose to discrepancies between alignments calculated by the computer and the actual position of the implants. Apart from software- and hardware-related calibration issues, the majority of inaccuracies, which are often surgeon-related, result from registration of anatomical landmarks, pin array movements after registration, incorrect bone cuts despite accurate jig placement, and incorrect placement of final components during cementation. Of these surgeon-related factors, variability in the identification of the anatomical landmarks appears to be critical and occurs due to anatomical variations or from inaccurate recognition of intraoperative bony landmarks. A recent study found that registration of the distal femoral epicondyles was more likely to be inaccurate than other anatomical landmarks, as it was found that a small change of 2 mm in the sagittal plane can lead to a 1o change in the femoral component rotation.13
Nevertheless, the general consensus from recent high- level evidence (Level I and II) suggests that navigated TKA leads to improved coronal-alignment outcomes and reduced numbers of outliers.14-18 In a recent systematic review of 27 randomized controlled trials of 2541 patients, Hetaimish and colleagues19 compared the alignment outcomes of navigated with conventional TKA. The authors found that the navigated cohort had a significantly lower risk of producing a mechanical axis deviation of greater than 3o, compared with conventional TKA (relative risk [RR] = 0.37; P<.001). The femoral and tibial, coronal and sagittal malalignment (>3o) were also found to be significantly lower with navigated TKA, compared with conventional techniques. However, no substantial differences were found in the rotation alignment of the femoral component between the 2 comparison cohorts (navigated group, 18.8%; conventional group, 14.5%).
Advocates of navigation believe that improved component alignment would lead to better functional outcomes and lower revision rates.20,21 However, at short- to mid-term follow-up, most studies have failed to show any substantial benefits in terms of functional outcomes, revision rates, patient satisfaction, or patient-perceived quality-of-life, when comparing computer-assisted navigation to conventional techniques.11,22-25 Recent systematic reviews by Zamora et al24 and Burnett et al25 found no significant differences in the functional outcomes between navigated and conventional TKA (P>.05). This lack of the expected improvement in functional outcomes reported in various studies with navigation could be due to variability in registration of anatomical landmarks leading to errors in the rotational axis, or a lack of complete understanding of the interplay of alignment, ligament balance, in vivo joint loading and kinematics. In a report from the Mayo Clinic,26 the authors believed that there may be little practical value in relying on a mechanical alignment of ±3o from neutral as an isolated variable in predicting the longevity of modern TKA. In addition, they suggested that factors apart from mechanical alignment may have a more profound impact on implant durability.
Several studies27-31 that compared the joint line changes or ligament balance between navigated and conventional TKA, report no substantial differences in the maintenance of the joint line, quality of life, and functional outcomes. Despite claims of decreased blood loss, length-of stay, cardiac complications, and lower risks of fat embolism with computer-assisted navigation by some authors, other reports have failed to demonstrate any substantial advantages, therefore, it is controversial if any clear benefit exists.6,32-34 It is postulated that the high initial institutional costs of navigation can even out in the long run if the goals of improved survivorship and functional outcomes are achieved.35 However, as mid-term follow-up studies have failed to show a survival or functional benefit, the purported costs savings from computer navigation may not be accurate. Navigated TKA has been reported to increase operative time by about 15 to 20 minutes, compared with conventional TKA. Although, this increases operative time, it has not been reported to increase the risk of deep prosthetic joint infections.
Navigation provides some benefits in terms of radiological alignment. However, the clinical advantages are yet to be defined. Currently, there are many unanswered ques- tions concerning alignment in TKA, such as having a more individual approach based on the patients’ own anatomic variations including considerations about the presence of constitutional varus in patients. Navigation may have a role when TKA is performed for complex deformities, fractures, or in the presence of retained implants that prevent the use of conventional guides. Nevertheless, one should always keep in mind cost considerations. This has been true with any technological advancement we have had in the past and will be of concern in the future as well, especially with rising healthcare costs. When analyzing costs with naviga- tion, one must take in to account not only the overall costs of technology, but also the added costs of training, increased operating room times, and disposables when performing these procedures. Although we are advocates of change and are excited about this technology, the cost-benefit ratio for computer navigated TKA needs to be reconciled.
The overall success of total knee arthroplasty (TKA) depends on proper implant choice, meticulous surgical technique, appropriate patient selection, and
effective postoperative rehabilitation. Inappropriate technique leads to suboptimal placement of implants in coronal, sagittal, or axial planes.1-3 This results in eccentric prosthetic loading, which may contribute to accelerated polyethylene wear, early component loosening, higher rates of revision surgery, and unsatisfactory clinical outcomes. The need to optimize component positioning during TKA stimulated the development of computer-assisted navigation in TKA in the late 1990’s. Proponents of this technology believe that it helps to reduce outliers, improves coronal, sagittal, and rotational alignment, and optimizes flexion and extension gap-balancing. This is believed to result in improved implant survival and better functional outcomes. However, despite these postulated advantages, less than 5% of surgeons in the United States currently use navigation during TKA perhaps due to concerns of costs, increased operating time, learn- ing curve issues, and lack of improvement in functional outcomes at mid-term follow-up.
Navigated TKA, due to its accuracy and low margins of error, has the potential to reduce component malalignment to within 1o to 2o of neutral mechanical axis.4 However, others have reported that alignment of the femoral and tibial components achieved with computer navigation is not different than TKA using conventional techniques.5-12 This lack of improvement reported in these studies may be due to a number of potential sources of errors, which can be either surgeon- or device-related. These errors may pre-dispose to discrepancies between alignments calculated by the computer and the actual position of the implants. Apart from software- and hardware-related calibration issues, the majority of inaccuracies, which are often surgeon-related, result from registration of anatomical landmarks, pin array movements after registration, incorrect bone cuts despite accurate jig placement, and incorrect placement of final components during cementation. Of these surgeon-related factors, variability in the identification of the anatomical landmarks appears to be critical and occurs due to anatomical variations or from inaccurate recognition of intraoperative bony landmarks. A recent study found that registration of the distal femoral epicondyles was more likely to be inaccurate than other anatomical landmarks, as it was found that a small change of 2 mm in the sagittal plane can lead to a 1o change in the femoral component rotation.13
Nevertheless, the general consensus from recent high- level evidence (Level I and II) suggests that navigated TKA leads to improved coronal-alignment outcomes and reduced numbers of outliers.14-18 In a recent systematic review of 27 randomized controlled trials of 2541 patients, Hetaimish and colleagues19 compared the alignment outcomes of navigated with conventional TKA. The authors found that the navigated cohort had a significantly lower risk of producing a mechanical axis deviation of greater than 3o, compared with conventional TKA (relative risk [RR] = 0.37; P<.001). The femoral and tibial, coronal and sagittal malalignment (>3o) were also found to be significantly lower with navigated TKA, compared with conventional techniques. However, no substantial differences were found in the rotation alignment of the femoral component between the 2 comparison cohorts (navigated group, 18.8%; conventional group, 14.5%).
Advocates of navigation believe that improved component alignment would lead to better functional outcomes and lower revision rates.20,21 However, at short- to mid-term follow-up, most studies have failed to show any substantial benefits in terms of functional outcomes, revision rates, patient satisfaction, or patient-perceived quality-of-life, when comparing computer-assisted navigation to conventional techniques.11,22-25 Recent systematic reviews by Zamora et al24 and Burnett et al25 found no significant differences in the functional outcomes between navigated and conventional TKA (P>.05). This lack of the expected improvement in functional outcomes reported in various studies with navigation could be due to variability in registration of anatomical landmarks leading to errors in the rotational axis, or a lack of complete understanding of the interplay of alignment, ligament balance, in vivo joint loading and kinematics. In a report from the Mayo Clinic,26 the authors believed that there may be little practical value in relying on a mechanical alignment of ±3o from neutral as an isolated variable in predicting the longevity of modern TKA. In addition, they suggested that factors apart from mechanical alignment may have a more profound impact on implant durability.
Several studies27-31 that compared the joint line changes or ligament balance between navigated and conventional TKA, report no substantial differences in the maintenance of the joint line, quality of life, and functional outcomes. Despite claims of decreased blood loss, length-of stay, cardiac complications, and lower risks of fat embolism with computer-assisted navigation by some authors, other reports have failed to demonstrate any substantial advantages, therefore, it is controversial if any clear benefit exists.6,32-34 It is postulated that the high initial institutional costs of navigation can even out in the long run if the goals of improved survivorship and functional outcomes are achieved.35 However, as mid-term follow-up studies have failed to show a survival or functional benefit, the purported costs savings from computer navigation may not be accurate. Navigated TKA has been reported to increase operative time by about 15 to 20 minutes, compared with conventional TKA. Although, this increases operative time, it has not been reported to increase the risk of deep prosthetic joint infections.
Navigation provides some benefits in terms of radiological alignment. However, the clinical advantages are yet to be defined. Currently, there are many unanswered ques- tions concerning alignment in TKA, such as having a more individual approach based on the patients’ own anatomic variations including considerations about the presence of constitutional varus in patients. Navigation may have a role when TKA is performed for complex deformities, fractures, or in the presence of retained implants that prevent the use of conventional guides. Nevertheless, one should always keep in mind cost considerations. This has been true with any technological advancement we have had in the past and will be of concern in the future as well, especially with rising healthcare costs. When analyzing costs with naviga- tion, one must take in to account not only the overall costs of technology, but also the added costs of training, increased operating room times, and disposables when performing these procedures. Although we are advocates of change and are excited about this technology, the cost-benefit ratio for computer navigated TKA needs to be reconciled.
The overall success of total knee arthroplasty (TKA) depends on proper implant choice, meticulous surgical technique, appropriate patient selection, and
effective postoperative rehabilitation. Inappropriate technique leads to suboptimal placement of implants in coronal, sagittal, or axial planes.1-3 This results in eccentric prosthetic loading, which may contribute to accelerated polyethylene wear, early component loosening, higher rates of revision surgery, and unsatisfactory clinical outcomes. The need to optimize component positioning during TKA stimulated the development of computer-assisted navigation in TKA in the late 1990’s. Proponents of this technology believe that it helps to reduce outliers, improves coronal, sagittal, and rotational alignment, and optimizes flexion and extension gap-balancing. This is believed to result in improved implant survival and better functional outcomes. However, despite these postulated advantages, less than 5% of surgeons in the United States currently use navigation during TKA perhaps due to concerns of costs, increased operating time, learn- ing curve issues, and lack of improvement in functional outcomes at mid-term follow-up.
Navigated TKA, due to its accuracy and low margins of error, has the potential to reduce component malalignment to within 1o to 2o of neutral mechanical axis.4 However, others have reported that alignment of the femoral and tibial components achieved with computer navigation is not different than TKA using conventional techniques.5-12 This lack of improvement reported in these studies may be due to a number of potential sources of errors, which can be either surgeon- or device-related. These errors may pre-dispose to discrepancies between alignments calculated by the computer and the actual position of the implants. Apart from software- and hardware-related calibration issues, the majority of inaccuracies, which are often surgeon-related, result from registration of anatomical landmarks, pin array movements after registration, incorrect bone cuts despite accurate jig placement, and incorrect placement of final components during cementation. Of these surgeon-related factors, variability in the identification of the anatomical landmarks appears to be critical and occurs due to anatomical variations or from inaccurate recognition of intraoperative bony landmarks. A recent study found that registration of the distal femoral epicondyles was more likely to be inaccurate than other anatomical landmarks, as it was found that a small change of 2 mm in the sagittal plane can lead to a 1o change in the femoral component rotation.13
Nevertheless, the general consensus from recent high- level evidence (Level I and II) suggests that navigated TKA leads to improved coronal-alignment outcomes and reduced numbers of outliers.14-18 In a recent systematic review of 27 randomized controlled trials of 2541 patients, Hetaimish and colleagues19 compared the alignment outcomes of navigated with conventional TKA. The authors found that the navigated cohort had a significantly lower risk of producing a mechanical axis deviation of greater than 3o, compared with conventional TKA (relative risk [RR] = 0.37; P<.001). The femoral and tibial, coronal and sagittal malalignment (>3o) were also found to be significantly lower with navigated TKA, compared with conventional techniques. However, no substantial differences were found in the rotation alignment of the femoral component between the 2 comparison cohorts (navigated group, 18.8%; conventional group, 14.5%).
Advocates of navigation believe that improved component alignment would lead to better functional outcomes and lower revision rates.20,21 However, at short- to mid-term follow-up, most studies have failed to show any substantial benefits in terms of functional outcomes, revision rates, patient satisfaction, or patient-perceived quality-of-life, when comparing computer-assisted navigation to conventional techniques.11,22-25 Recent systematic reviews by Zamora et al24 and Burnett et al25 found no significant differences in the functional outcomes between navigated and conventional TKA (P>.05). This lack of the expected improvement in functional outcomes reported in various studies with navigation could be due to variability in registration of anatomical landmarks leading to errors in the rotational axis, or a lack of complete understanding of the interplay of alignment, ligament balance, in vivo joint loading and kinematics. In a report from the Mayo Clinic,26 the authors believed that there may be little practical value in relying on a mechanical alignment of ±3o from neutral as an isolated variable in predicting the longevity of modern TKA. In addition, they suggested that factors apart from mechanical alignment may have a more profound impact on implant durability.
Several studies27-31 that compared the joint line changes or ligament balance between navigated and conventional TKA, report no substantial differences in the maintenance of the joint line, quality of life, and functional outcomes. Despite claims of decreased blood loss, length-of stay, cardiac complications, and lower risks of fat embolism with computer-assisted navigation by some authors, other reports have failed to demonstrate any substantial advantages, therefore, it is controversial if any clear benefit exists.6,32-34 It is postulated that the high initial institutional costs of navigation can even out in the long run if the goals of improved survivorship and functional outcomes are achieved.35 However, as mid-term follow-up studies have failed to show a survival or functional benefit, the purported costs savings from computer navigation may not be accurate. Navigated TKA has been reported to increase operative time by about 15 to 20 minutes, compared with conventional TKA. Although, this increases operative time, it has not been reported to increase the risk of deep prosthetic joint infections.
Navigation provides some benefits in terms of radiological alignment. However, the clinical advantages are yet to be defined. Currently, there are many unanswered ques- tions concerning alignment in TKA, such as having a more individual approach based on the patients’ own anatomic variations including considerations about the presence of constitutional varus in patients. Navigation may have a role when TKA is performed for complex deformities, fractures, or in the presence of retained implants that prevent the use of conventional guides. Nevertheless, one should always keep in mind cost considerations. This has been true with any technological advancement we have had in the past and will be of concern in the future as well, especially with rising healthcare costs. When analyzing costs with naviga- tion, one must take in to account not only the overall costs of technology, but also the added costs of training, increased operating room times, and disposables when performing these procedures. Although we are advocates of change and are excited about this technology, the cost-benefit ratio for computer navigated TKA needs to be reconciled.

Patient apps
Although many physicians would like to "prescribe" health apps to their patients, it can be a daunting endeavor. The exact number of medical and wellness apps currently available is unknown – I’ve seen numbers range from 40,000 to 97,000. Even the most astute physician will have difficulty navigating this ocean of options.
Fortunately, there are sites that do the legwork for us, including wellocracy.com, imedicalapps.com, medicalappjournal.com, medgadget.com, and mashable.com.
The Food and Drug Administration divides health apps into two categories: medical apps and health and wellness apps. Medical apps are those that turn your mobile device into a medical device; for example, allowing users to take a picture of a mole or to record their blood pressure and send it to their physician. By contrast, health and wellness apps help patients maintain healthy lifestyles and often employ self-tracking, such as tracking activity levels and calories consumed. The most popular of this latter type include weight loss and fitness apps.
As health care providers, we have a responsibility to encourage our patients to be actively engaged in their health. Recommending health and wellness apps that help patients track their activity can be powerful tools for patient engagement since tracking allows users see data that inspire them to set and reach goals.
Below are seven health and wellness apps that earn top scores from users and reviewers alike:
• WebMD: WebMD’s app receives high ratings for its simple, clean interface. Users choose among "lifestyle topics" that interest them, such as "fitness and exercise" or "parenting and family." Other key features include a symptom checker; first-aid tips; a list of local doctors, hospitals, and pharmacies; and a pill ID feature that lets users identify prescription drugs and OTC meds by shape, color, and imprint. Cost: Free.
• MyFitnessPal: This app consistently receives high scores from users striving to lose weight. With scores of cardio and strength training exercises and more than 2 million food entries including restaurant meals and packaged foods in its database, it makes both tracking one’s daily activity and calorie counting simple. Cost: Free.
• Fitocracy: What makes this fitness app so wildly popular among users? Its social gaming component. Not only do users track their activity levels, but they also connect with and compete against others. Similar to a video game, users earn points and badges that help them "level up" and reinforce their adherence to a healthy lifestyle. Cost: Free.
• MyQuit Coach: Consistently ranked one the top quit smoking apps, MyQuitCoach personalizes strategies to help users kick the habit. Users can commit to either quitting immediately or reducing smoking over time. Cost: Free.
• Sleep Cycle: By providing easy-to-read graphs, this app helps analyze the user’s sleep patterns and wakes them up during the lightest sleep phase, the natural way to wake up. Cost: $1.99
• MediSafe:Physicians know firsthand the difficulty of getting patients to adhere to taking their prescription medications. This easy-to-use app helps by providing reminders to patients when they need to take their medication and by sharing information with a "Med-Friend," which can be a family member or caretaker. The app also alerts users when it’s time for a refill. Cost: Free
• iTriage: This app uses location-based technology to help users find the nearest hospital or urgent care center. It is ideal for travelers, as well as people new to a neighborhood. Perhaps its best feature is its ability to provide an estimated wait time. Cost: Free
Wellness apps do not provide cures for illnesses, but they can help patients improve their overall health by encouraging them to make smarter, healthier lifestyle choices. And that’s something any physician can support.
Dr. Jeffrey Benabio is a practicing dermatologist and physician director of healthcare transformation at Kaiser Permanente in San Diego. Connect with him on Twitter @Dermdoc or drop him a line at benabio@gmail.com.
Although many physicians would like to "prescribe" health apps to their patients, it can be a daunting endeavor. The exact number of medical and wellness apps currently available is unknown – I’ve seen numbers range from 40,000 to 97,000. Even the most astute physician will have difficulty navigating this ocean of options.
Fortunately, there are sites that do the legwork for us, including wellocracy.com, imedicalapps.com, medicalappjournal.com, medgadget.com, and mashable.com.
The Food and Drug Administration divides health apps into two categories: medical apps and health and wellness apps. Medical apps are those that turn your mobile device into a medical device; for example, allowing users to take a picture of a mole or to record their blood pressure and send it to their physician. By contrast, health and wellness apps help patients maintain healthy lifestyles and often employ self-tracking, such as tracking activity levels and calories consumed. The most popular of this latter type include weight loss and fitness apps.
As health care providers, we have a responsibility to encourage our patients to be actively engaged in their health. Recommending health and wellness apps that help patients track their activity can be powerful tools for patient engagement since tracking allows users see data that inspire them to set and reach goals.
Below are seven health and wellness apps that earn top scores from users and reviewers alike:
• WebMD: WebMD’s app receives high ratings for its simple, clean interface. Users choose among "lifestyle topics" that interest them, such as "fitness and exercise" or "parenting and family." Other key features include a symptom checker; first-aid tips; a list of local doctors, hospitals, and pharmacies; and a pill ID feature that lets users identify prescription drugs and OTC meds by shape, color, and imprint. Cost: Free.
• MyFitnessPal: This app consistently receives high scores from users striving to lose weight. With scores of cardio and strength training exercises and more than 2 million food entries including restaurant meals and packaged foods in its database, it makes both tracking one’s daily activity and calorie counting simple. Cost: Free.
• Fitocracy: What makes this fitness app so wildly popular among users? Its social gaming component. Not only do users track their activity levels, but they also connect with and compete against others. Similar to a video game, users earn points and badges that help them "level up" and reinforce their adherence to a healthy lifestyle. Cost: Free.
• MyQuit Coach: Consistently ranked one the top quit smoking apps, MyQuitCoach personalizes strategies to help users kick the habit. Users can commit to either quitting immediately or reducing smoking over time. Cost: Free.
• Sleep Cycle: By providing easy-to-read graphs, this app helps analyze the user’s sleep patterns and wakes them up during the lightest sleep phase, the natural way to wake up. Cost: $1.99
• MediSafe:Physicians know firsthand the difficulty of getting patients to adhere to taking their prescription medications. This easy-to-use app helps by providing reminders to patients when they need to take their medication and by sharing information with a "Med-Friend," which can be a family member or caretaker. The app also alerts users when it’s time for a refill. Cost: Free
• iTriage: This app uses location-based technology to help users find the nearest hospital or urgent care center. It is ideal for travelers, as well as people new to a neighborhood. Perhaps its best feature is its ability to provide an estimated wait time. Cost: Free
Wellness apps do not provide cures for illnesses, but they can help patients improve their overall health by encouraging them to make smarter, healthier lifestyle choices. And that’s something any physician can support.
Dr. Jeffrey Benabio is a practicing dermatologist and physician director of healthcare transformation at Kaiser Permanente in San Diego. Connect with him on Twitter @Dermdoc or drop him a line at benabio@gmail.com.
Although many physicians would like to "prescribe" health apps to their patients, it can be a daunting endeavor. The exact number of medical and wellness apps currently available is unknown – I’ve seen numbers range from 40,000 to 97,000. Even the most astute physician will have difficulty navigating this ocean of options.
Fortunately, there are sites that do the legwork for us, including wellocracy.com, imedicalapps.com, medicalappjournal.com, medgadget.com, and mashable.com.
The Food and Drug Administration divides health apps into two categories: medical apps and health and wellness apps. Medical apps are those that turn your mobile device into a medical device; for example, allowing users to take a picture of a mole or to record their blood pressure and send it to their physician. By contrast, health and wellness apps help patients maintain healthy lifestyles and often employ self-tracking, such as tracking activity levels and calories consumed. The most popular of this latter type include weight loss and fitness apps.
As health care providers, we have a responsibility to encourage our patients to be actively engaged in their health. Recommending health and wellness apps that help patients track their activity can be powerful tools for patient engagement since tracking allows users see data that inspire them to set and reach goals.
Below are seven health and wellness apps that earn top scores from users and reviewers alike:
• WebMD: WebMD’s app receives high ratings for its simple, clean interface. Users choose among "lifestyle topics" that interest them, such as "fitness and exercise" or "parenting and family." Other key features include a symptom checker; first-aid tips; a list of local doctors, hospitals, and pharmacies; and a pill ID feature that lets users identify prescription drugs and OTC meds by shape, color, and imprint. Cost: Free.
• MyFitnessPal: This app consistently receives high scores from users striving to lose weight. With scores of cardio and strength training exercises and more than 2 million food entries including restaurant meals and packaged foods in its database, it makes both tracking one’s daily activity and calorie counting simple. Cost: Free.
• Fitocracy: What makes this fitness app so wildly popular among users? Its social gaming component. Not only do users track their activity levels, but they also connect with and compete against others. Similar to a video game, users earn points and badges that help them "level up" and reinforce their adherence to a healthy lifestyle. Cost: Free.
• MyQuit Coach: Consistently ranked one the top quit smoking apps, MyQuitCoach personalizes strategies to help users kick the habit. Users can commit to either quitting immediately or reducing smoking over time. Cost: Free.
• Sleep Cycle: By providing easy-to-read graphs, this app helps analyze the user’s sleep patterns and wakes them up during the lightest sleep phase, the natural way to wake up. Cost: $1.99
• MediSafe:Physicians know firsthand the difficulty of getting patients to adhere to taking their prescription medications. This easy-to-use app helps by providing reminders to patients when they need to take their medication and by sharing information with a "Med-Friend," which can be a family member or caretaker. The app also alerts users when it’s time for a refill. Cost: Free
• iTriage: This app uses location-based technology to help users find the nearest hospital or urgent care center. It is ideal for travelers, as well as people new to a neighborhood. Perhaps its best feature is its ability to provide an estimated wait time. Cost: Free
Wellness apps do not provide cures for illnesses, but they can help patients improve their overall health by encouraging them to make smarter, healthier lifestyle choices. And that’s something any physician can support.
Dr. Jeffrey Benabio is a practicing dermatologist and physician director of healthcare transformation at Kaiser Permanente in San Diego. Connect with him on Twitter @Dermdoc or drop him a line at benabio@gmail.com.

Peppermint and menthol
Mentha piperita, better known as peppermint, is used worldwide in many ways. Its use for culinary and medical purposes dates back to the ancient Greek and Roman civilizations. Peppermint is used in numerous forms (i.e., oil, leaf, leaf extract, and leaf water), with the oil as the most versatile (Dermatitis 2010;21:327-9). Peppermint has long been known for its beneficial gastrointestinal effects, and it has a well-established record of antimicrobial, antifungal, and analgesic activity (Mills S., Bone K. Principles and Practice of Phytotherapy: Modern Herbal Medicine. [London: Churchill Livingstone, 2000, pp 507-13]; J. Environ. Biol. 2011;32:23-9).

Menthol (C10H20O) is a naturally occurring monocyclic terpene alcohol derived from Mentha piperita as well as other mint oils (Skin Therapy Lett. 2010;15:5-9), and has been associated with several health benefits. Recently, anticancer properties have been ascribed to menthol (Biochim. Biophys. Acta 2009;1792:33-8). This column will discuss recent findings regarding the actual or potential cutaneous benefits of peppermint and menthol.
Various Mentha species, including M. piperita, have exhibited significant antioxidant activity (Toxicol. Ind. Health. 2012;28:83-9; Nat. Prod. Commun. 2009;4:1107-12; Nat. Prod. Commun. 2009;4:535-42). In a 2010 study of the antioxidant activity of the essential oils of six popular herbs, including lavender (Lavendular angustifolia), peppermint (M. piperita), rosemary (Rosmarius officinalis), lemon (Citrus limon), grapefruit (C. paradise), and frankincense (Boswellia carteri), investigators found, in testing free radical-scavenging capacity and lipid peroxidation in the linoleic acid system, that peppermint essential oil exhibited the greatest radical-scavenging activity against the 2,2\'-azinobis-(3-ethylbenzothiazoline-6-sulfonic acid) ABTS radical (Nat. Prod. Res. 2010;24:140-51).
In 2010, Baliga and Rao showed that M. piperita and M. arvensis (wild mint) protected mice against gamma-radiation–induced morbidity and mortality. Specifically, M. piperita protected murine testes as well as gastrointestinal and hemopoietic systems (J. Cancer Res. Ther. 2010;6:255-62).
Anticancer activity
Investigations by Jain et al. into the molecular mechanisms supporting the anticarcinogenic potential of M. piperita leaf extracts on six human cancer cell lines (HeLa, MCF-7, Jurkat, T24, HT-29, MIAPaCa-2) in 2011 revealed that chloroform and ethyl acetate extracts dose- and time-dependently displayed anticarcinogenic activity leading to G1 cell cycle arrest and mitochondrial-mediated apoptosis among the cascade of effects. The investigators identified their findings as the first evidence of direct anticarcinogenic activity of Mentha leaf extracts and suggested that future work might focus on isolating active constituents as a foundation for mechanistic and translational studies leading to new anticancer drugs, alone or in combination, to prevent and treat human cancers (Int. J. Toxicol. 2011;30:225-36).
Topical benefits of menthol
In a recent examination of the antibacterial and antifungal properties, as well as speculated anti-inflammatory activity of menthol as a topical treatment for diaper dermatitis, investigators conducted a pilot clinical trial in a hospital setting. The study involved 84 neonates with diagnosed candidal diaper dermatitis who required no critical care or systemic antifungal and anti-inflammatory medications. The menthol group (n = 42) received topical clotrimazole and topically applied menthol drops and the control group (n = 42) received topical clotrimazole and a placebo. Thirty-five infants in each group completed the study. The researchers found that complete healing was shorter in the menthol group, with significant relief of erythema and pustules observed in this group. They concluded that topically-applied menthol may be an effective agent in the treatment of candidal diaper dermatitis (World J. Pediatr. 2011;7:167-70).
In 2011, Qiu et al. showed, through various assays, that menthol, in low concentrations, could significantly suppress the expression of alpha-hemolysin, enterotoxins A and B, and toxic shock syndrome toxin 1 in Staphylococcus aureus. The investigators concluded that menthol may warrant inclusion in the armamentarium against S. aureus when combined with beta-lactam antibiotics, which, at subinhibitory concentrations, can actually augment S. aureus toxin secretion. They added that menthol may also have possible uses in novel anti-virulence drugs (Appl. Microbiol. Biotechnol. 2011;90:705-12). It should be noted that menthol is considered safe and effective, with concentrations up to 16% approved in OTC external products by the Food and Drug Administration (J. Am. Acad. Dermatol. 2007;57:873-8).
Pruritus, TRPM8, and melanoma
Topically applied menthol, in concentrations of 1%-3%, is often used to treat pruritus, particularly in the elderly (Skin Therapy Lett. 2010;15:5-9). In addition, recent evidence suggests that the presence of menthol can facilitate penetration of other agents in topical products (Int. J. Toxicol. 2001;20 Suppl 3:61-73; J. Am. Acad. Dermatol. 2007;57:873-8). Patel and Yosipovitch suggest that elderly patients who report diminished pruritus with cooling may stand to benefit from menthol-containing topical therapies (J. Am. Acad. Dermatol. 2007;57:873-8; Skin Therapy Lett. 2010;15:5-9). Interestingly, menthol, via the transient receptor potential melastatin subfamily 8 (TRPM8) receptor, a member of a family of excitatory ion channels, engenders the same cooling sensation as low temperature, though menthol is not linked to a reduction in skin temperature (J. Am. Acad. Dermatol. 2007;57:873-8; Skin Therapy Lett. 2010;15:5-9).
Although the exact mechanism by which menthol exerts its antipruritic and analgesic effects has yet to be determined, the discovery that the TRPM8 is its underlying receptor is proving to be significant, particularly in understanding the cooling effect of the botanical (J. Am. Acad. Dermatol. 2007;57:873-8). There are also indications that menthol has therapeutic potential for melanoma. Specifically, melanoma expresses TRPM8 receptors, the activation of which inhibits melanoma viability. Menthol appears to mediate this response through an influx of extracellular calcium ions (Am. J. Physiol. Cell Physiol. 2008;295:C296-301; Am. J. Physiol. Cell Physiol. 2008;295:C293-5).
Peppermint oil
In 2003, Schuhmacher et al. investigated the virucidal effect of peppermint oil and found that it had a direct effect against herpes simplex virus type 1 (HSV-1) and herpes simplex virus type 2 (HSV-2) as well as an acyclovir-resistant HSV-1 strain. The investigators concluded, noting the lipophilic nature of peppermint oil, that it might be an appropriate topical treatment for recurrent herpes outbreaks (Phytomedicine 2003;10:504-10).
Because of its flavor, aroma, and cooling qualities, peppermint oil is used in a wide range of products, including cosmeceuticals, personal hygiene products (e.g., bath preparations, mouthwashes, toothpastes, and topical formulations), foods, pharmaceutical products, and aromatherapy. Topical indications include pruritus, irritation, and inflammation. Peppermint oil can act as a skin sensitizer, though, particularly in impaired and sensitive skin (Dermatitis 2010;21:327-9). Although peppermint oil has been reported to be a sensitizer in isolated cases, peppermint oil 8% was not found to be a sensitizer in a recent test using a maximization protocol and the various forms of peppermint (i.e., oil, extract, leaves, and water) are considered to be safe in cosmetic formulations. In rinse-off products, peppermint oil is used in concentrations up to 3% and up to 0.2% in leave-on formulations (Int. J. Toxicol. 2001;20 Suppl 3:61-73).
Conclusion
Peppermint and menthol, its naturally occurring monocyclic terpene alcohol derivative, have long been used for medical purposes. Contemporary practice and continuing research continue to support various uses of M. piperita in the medical armamentarium, with specific and additional uses continually being found in the dermatologic realm.
Dr. Baumann is chief executive officer of the Baumann Cosmetic & Research Institute in Miami Beach. She founded the cosmetic dermatology center at the University of Miami in 1997. Dr. Baumann wrote the textbook "Cosmetic Dermatology: Principles and Practice" (McGraw-Hill, April 2002), and a book for consumers, "The Skin Type Solution" (Bantam, 2006). She has contributed to the Cosmeceutical Critique column in Skin & Allergy News since January 2001 and joined the editorial advisory board in 2004. Dr. Baumann has received funding for clinical grants from Allergan, Aveeno, Avon Products, Galderma, Mary Kay, Medicis Pharmaceuticals, Neutrogena, Philosophy, Stiefel, Topix Pharmaceuticals, and Unilever.
Mentha piperita, better known as peppermint, is used worldwide in many ways. Its use for culinary and medical purposes dates back to the ancient Greek and Roman civilizations. Peppermint is used in numerous forms (i.e., oil, leaf, leaf extract, and leaf water), with the oil as the most versatile (Dermatitis 2010;21:327-9). Peppermint has long been known for its beneficial gastrointestinal effects, and it has a well-established record of antimicrobial, antifungal, and analgesic activity (Mills S., Bone K. Principles and Practice of Phytotherapy: Modern Herbal Medicine. [London: Churchill Livingstone, 2000, pp 507-13]; J. Environ. Biol. 2011;32:23-9).
Menthol (C10H20O) is a naturally occurring monocyclic terpene alcohol derived from Mentha piperita as well as other mint oils (Skin Therapy Lett. 2010;15:5-9), and has been associated with several health benefits. Recently, anticancer properties have been ascribed to menthol (Biochim. Biophys. Acta 2009;1792:33-8). This column will discuss recent findings regarding the actual or potential cutaneous benefits of peppermint and menthol.
Various Mentha species, including M. piperita, have exhibited significant antioxidant activity (Toxicol. Ind. Health. 2012;28:83-9; Nat. Prod. Commun. 2009;4:1107-12; Nat. Prod. Commun. 2009;4:535-42). In a 2010 study of the antioxidant activity of the essential oils of six popular herbs, including lavender (Lavendular angustifolia), peppermint (M. piperita), rosemary (Rosmarius officinalis), lemon (Citrus limon), grapefruit (C. paradise), and frankincense (Boswellia carteri), investigators found, in testing free radical-scavenging capacity and lipid peroxidation in the linoleic acid system, that peppermint essential oil exhibited the greatest radical-scavenging activity against the 2,2\'-azinobis-(3-ethylbenzothiazoline-6-sulfonic acid) ABTS radical (Nat. Prod. Res. 2010;24:140-51).
In 2010, Baliga and Rao showed that M. piperita and M. arvensis (wild mint) protected mice against gamma-radiation–induced morbidity and mortality. Specifically, M. piperita protected murine testes as well as gastrointestinal and hemopoietic systems (J. Cancer Res. Ther. 2010;6:255-62).
Anticancer activity
Investigations by Jain et al. into the molecular mechanisms supporting the anticarcinogenic potential of M. piperita leaf extracts on six human cancer cell lines (HeLa, MCF-7, Jurkat, T24, HT-29, MIAPaCa-2) in 2011 revealed that chloroform and ethyl acetate extracts dose- and time-dependently displayed anticarcinogenic activity leading to G1 cell cycle arrest and mitochondrial-mediated apoptosis among the cascade of effects. The investigators identified their findings as the first evidence of direct anticarcinogenic activity of Mentha leaf extracts and suggested that future work might focus on isolating active constituents as a foundation for mechanistic and translational studies leading to new anticancer drugs, alone or in combination, to prevent and treat human cancers (Int. J. Toxicol. 2011;30:225-36).
Topical benefits of menthol
In a recent examination of the antibacterial and antifungal properties, as well as speculated anti-inflammatory activity of menthol as a topical treatment for diaper dermatitis, investigators conducted a pilot clinical trial in a hospital setting. The study involved 84 neonates with diagnosed candidal diaper dermatitis who required no critical care or systemic antifungal and anti-inflammatory medications. The menthol group (n = 42) received topical clotrimazole and topically applied menthol drops and the control group (n = 42) received topical clotrimazole and a placebo. Thirty-five infants in each group completed the study. The researchers found that complete healing was shorter in the menthol group, with significant relief of erythema and pustules observed in this group. They concluded that topically-applied menthol may be an effective agent in the treatment of candidal diaper dermatitis (World J. Pediatr. 2011;7:167-70).
In 2011, Qiu et al. showed, through various assays, that menthol, in low concentrations, could significantly suppress the expression of alpha-hemolysin, enterotoxins A and B, and toxic shock syndrome toxin 1 in Staphylococcus aureus. The investigators concluded that menthol may warrant inclusion in the armamentarium against S. aureus when combined with beta-lactam antibiotics, which, at subinhibitory concentrations, can actually augment S. aureus toxin secretion. They added that menthol may also have possible uses in novel anti-virulence drugs (Appl. Microbiol. Biotechnol. 2011;90:705-12). It should be noted that menthol is considered safe and effective, with concentrations up to 16% approved in OTC external products by the Food and Drug Administration (J. Am. Acad. Dermatol. 2007;57:873-8).
Pruritus, TRPM8, and melanoma
Topically applied menthol, in concentrations of 1%-3%, is often used to treat pruritus, particularly in the elderly (Skin Therapy Lett. 2010;15:5-9). In addition, recent evidence suggests that the presence of menthol can facilitate penetration of other agents in topical products (Int. J. Toxicol. 2001;20 Suppl 3:61-73; J. Am. Acad. Dermatol. 2007;57:873-8). Patel and Yosipovitch suggest that elderly patients who report diminished pruritus with cooling may stand to benefit from menthol-containing topical therapies (J. Am. Acad. Dermatol. 2007;57:873-8; Skin Therapy Lett. 2010;15:5-9). Interestingly, menthol, via the transient receptor potential melastatin subfamily 8 (TRPM8) receptor, a member of a family of excitatory ion channels, engenders the same cooling sensation as low temperature, though menthol is not linked to a reduction in skin temperature (J. Am. Acad. Dermatol. 2007;57:873-8; Skin Therapy Lett. 2010;15:5-9).
Although the exact mechanism by which menthol exerts its antipruritic and analgesic effects has yet to be determined, the discovery that the TRPM8 is its underlying receptor is proving to be significant, particularly in understanding the cooling effect of the botanical (J. Am. Acad. Dermatol. 2007;57:873-8). There are also indications that menthol has therapeutic potential for melanoma. Specifically, melanoma expresses TRPM8 receptors, the activation of which inhibits melanoma viability. Menthol appears to mediate this response through an influx of extracellular calcium ions (Am. J. Physiol. Cell Physiol. 2008;295:C296-301; Am. J. Physiol. Cell Physiol. 2008;295:C293-5).
Peppermint oil
In 2003, Schuhmacher et al. investigated the virucidal effect of peppermint oil and found that it had a direct effect against herpes simplex virus type 1 (HSV-1) and herpes simplex virus type 2 (HSV-2) as well as an acyclovir-resistant HSV-1 strain. The investigators concluded, noting the lipophilic nature of peppermint oil, that it might be an appropriate topical treatment for recurrent herpes outbreaks (Phytomedicine 2003;10:504-10).
Because of its flavor, aroma, and cooling qualities, peppermint oil is used in a wide range of products, including cosmeceuticals, personal hygiene products (e.g., bath preparations, mouthwashes, toothpastes, and topical formulations), foods, pharmaceutical products, and aromatherapy. Topical indications include pruritus, irritation, and inflammation. Peppermint oil can act as a skin sensitizer, though, particularly in impaired and sensitive skin (Dermatitis 2010;21:327-9). Although peppermint oil has been reported to be a sensitizer in isolated cases, peppermint oil 8% was not found to be a sensitizer in a recent test using a maximization protocol and the various forms of peppermint (i.e., oil, extract, leaves, and water) are considered to be safe in cosmetic formulations. In rinse-off products, peppermint oil is used in concentrations up to 3% and up to 0.2% in leave-on formulations (Int. J. Toxicol. 2001;20 Suppl 3:61-73).
Conclusion
Peppermint and menthol, its naturally occurring monocyclic terpene alcohol derivative, have long been used for medical purposes. Contemporary practice and continuing research continue to support various uses of M. piperita in the medical armamentarium, with specific and additional uses continually being found in the dermatologic realm.
Dr. Baumann is chief executive officer of the Baumann Cosmetic & Research Institute in Miami Beach. She founded the cosmetic dermatology center at the University of Miami in 1997. Dr. Baumann wrote the textbook "Cosmetic Dermatology: Principles and Practice" (McGraw-Hill, April 2002), and a book for consumers, "The Skin Type Solution" (Bantam, 2006). She has contributed to the Cosmeceutical Critique column in Skin & Allergy News since January 2001 and joined the editorial advisory board in 2004. Dr. Baumann has received funding for clinical grants from Allergan, Aveeno, Avon Products, Galderma, Mary Kay, Medicis Pharmaceuticals, Neutrogena, Philosophy, Stiefel, Topix Pharmaceuticals, and Unilever.
Mentha piperita, better known as peppermint, is used worldwide in many ways. Its use for culinary and medical purposes dates back to the ancient Greek and Roman civilizations. Peppermint is used in numerous forms (i.e., oil, leaf, leaf extract, and leaf water), with the oil as the most versatile (Dermatitis 2010;21:327-9). Peppermint has long been known for its beneficial gastrointestinal effects, and it has a well-established record of antimicrobial, antifungal, and analgesic activity (Mills S., Bone K. Principles and Practice of Phytotherapy: Modern Herbal Medicine. [London: Churchill Livingstone, 2000, pp 507-13]; J. Environ. Biol. 2011;32:23-9).
Menthol (C10H20O) is a naturally occurring monocyclic terpene alcohol derived from Mentha piperita as well as other mint oils (Skin Therapy Lett. 2010;15:5-9), and has been associated with several health benefits. Recently, anticancer properties have been ascribed to menthol (Biochim. Biophys. Acta 2009;1792:33-8). This column will discuss recent findings regarding the actual or potential cutaneous benefits of peppermint and menthol.
Various Mentha species, including M. piperita, have exhibited significant antioxidant activity (Toxicol. Ind. Health. 2012;28:83-9; Nat. Prod. Commun. 2009;4:1107-12; Nat. Prod. Commun. 2009;4:535-42). In a 2010 study of the antioxidant activity of the essential oils of six popular herbs, including lavender (Lavendular angustifolia), peppermint (M. piperita), rosemary (Rosmarius officinalis), lemon (Citrus limon), grapefruit (C. paradise), and frankincense (Boswellia carteri), investigators found, in testing free radical-scavenging capacity and lipid peroxidation in the linoleic acid system, that peppermint essential oil exhibited the greatest radical-scavenging activity against the 2,2\'-azinobis-(3-ethylbenzothiazoline-6-sulfonic acid) ABTS radical (Nat. Prod. Res. 2010;24:140-51).
In 2010, Baliga and Rao showed that M. piperita and M. arvensis (wild mint) protected mice against gamma-radiation–induced morbidity and mortality. Specifically, M. piperita protected murine testes as well as gastrointestinal and hemopoietic systems (J. Cancer Res. Ther. 2010;6:255-62).
Anticancer activity
Investigations by Jain et al. into the molecular mechanisms supporting the anticarcinogenic potential of M. piperita leaf extracts on six human cancer cell lines (HeLa, MCF-7, Jurkat, T24, HT-29, MIAPaCa-2) in 2011 revealed that chloroform and ethyl acetate extracts dose- and time-dependently displayed anticarcinogenic activity leading to G1 cell cycle arrest and mitochondrial-mediated apoptosis among the cascade of effects. The investigators identified their findings as the first evidence of direct anticarcinogenic activity of Mentha leaf extracts and suggested that future work might focus on isolating active constituents as a foundation for mechanistic and translational studies leading to new anticancer drugs, alone or in combination, to prevent and treat human cancers (Int. J. Toxicol. 2011;30:225-36).
Topical benefits of menthol
In a recent examination of the antibacterial and antifungal properties, as well as speculated anti-inflammatory activity of menthol as a topical treatment for diaper dermatitis, investigators conducted a pilot clinical trial in a hospital setting. The study involved 84 neonates with diagnosed candidal diaper dermatitis who required no critical care or systemic antifungal and anti-inflammatory medications. The menthol group (n = 42) received topical clotrimazole and topically applied menthol drops and the control group (n = 42) received topical clotrimazole and a placebo. Thirty-five infants in each group completed the study. The researchers found that complete healing was shorter in the menthol group, with significant relief of erythema and pustules observed in this group. They concluded that topically-applied menthol may be an effective agent in the treatment of candidal diaper dermatitis (World J. Pediatr. 2011;7:167-70).
In 2011, Qiu et al. showed, through various assays, that menthol, in low concentrations, could significantly suppress the expression of alpha-hemolysin, enterotoxins A and B, and toxic shock syndrome toxin 1 in Staphylococcus aureus. The investigators concluded that menthol may warrant inclusion in the armamentarium against S. aureus when combined with beta-lactam antibiotics, which, at subinhibitory concentrations, can actually augment S. aureus toxin secretion. They added that menthol may also have possible uses in novel anti-virulence drugs (Appl. Microbiol. Biotechnol. 2011;90:705-12). It should be noted that menthol is considered safe and effective, with concentrations up to 16% approved in OTC external products by the Food and Drug Administration (J. Am. Acad. Dermatol. 2007;57:873-8).
Pruritus, TRPM8, and melanoma
Topically applied menthol, in concentrations of 1%-3%, is often used to treat pruritus, particularly in the elderly (Skin Therapy Lett. 2010;15:5-9). In addition, recent evidence suggests that the presence of menthol can facilitate penetration of other agents in topical products (Int. J. Toxicol. 2001;20 Suppl 3:61-73; J. Am. Acad. Dermatol. 2007;57:873-8). Patel and Yosipovitch suggest that elderly patients who report diminished pruritus with cooling may stand to benefit from menthol-containing topical therapies (J. Am. Acad. Dermatol. 2007;57:873-8; Skin Therapy Lett. 2010;15:5-9). Interestingly, menthol, via the transient receptor potential melastatin subfamily 8 (TRPM8) receptor, a member of a family of excitatory ion channels, engenders the same cooling sensation as low temperature, though menthol is not linked to a reduction in skin temperature (J. Am. Acad. Dermatol. 2007;57:873-8; Skin Therapy Lett. 2010;15:5-9).
Although the exact mechanism by which menthol exerts its antipruritic and analgesic effects has yet to be determined, the discovery that the TRPM8 is its underlying receptor is proving to be significant, particularly in understanding the cooling effect of the botanical (J. Am. Acad. Dermatol. 2007;57:873-8). There are also indications that menthol has therapeutic potential for melanoma. Specifically, melanoma expresses TRPM8 receptors, the activation of which inhibits melanoma viability. Menthol appears to mediate this response through an influx of extracellular calcium ions (Am. J. Physiol. Cell Physiol. 2008;295:C296-301; Am. J. Physiol. Cell Physiol. 2008;295:C293-5).
Peppermint oil
In 2003, Schuhmacher et al. investigated the virucidal effect of peppermint oil and found that it had a direct effect against herpes simplex virus type 1 (HSV-1) and herpes simplex virus type 2 (HSV-2) as well as an acyclovir-resistant HSV-1 strain. The investigators concluded, noting the lipophilic nature of peppermint oil, that it might be an appropriate topical treatment for recurrent herpes outbreaks (Phytomedicine 2003;10:504-10).
Because of its flavor, aroma, and cooling qualities, peppermint oil is used in a wide range of products, including cosmeceuticals, personal hygiene products (e.g., bath preparations, mouthwashes, toothpastes, and topical formulations), foods, pharmaceutical products, and aromatherapy. Topical indications include pruritus, irritation, and inflammation. Peppermint oil can act as a skin sensitizer, though, particularly in impaired and sensitive skin (Dermatitis 2010;21:327-9). Although peppermint oil has been reported to be a sensitizer in isolated cases, peppermint oil 8% was not found to be a sensitizer in a recent test using a maximization protocol and the various forms of peppermint (i.e., oil, extract, leaves, and water) are considered to be safe in cosmetic formulations. In rinse-off products, peppermint oil is used in concentrations up to 3% and up to 0.2% in leave-on formulations (Int. J. Toxicol. 2001;20 Suppl 3:61-73).
Conclusion
Peppermint and menthol, its naturally occurring monocyclic terpene alcohol derivative, have long been used for medical purposes. Contemporary practice and continuing research continue to support various uses of M. piperita in the medical armamentarium, with specific and additional uses continually being found in the dermatologic realm.
Dr. Baumann is chief executive officer of the Baumann Cosmetic & Research Institute in Miami Beach. She founded the cosmetic dermatology center at the University of Miami in 1997. Dr. Baumann wrote the textbook "Cosmetic Dermatology: Principles and Practice" (McGraw-Hill, April 2002), and a book for consumers, "The Skin Type Solution" (Bantam, 2006). She has contributed to the Cosmeceutical Critique column in Skin & Allergy News since January 2001 and joined the editorial advisory board in 2004. Dr. Baumann has received funding for clinical grants from Allergan, Aveeno, Avon Products, Galderma, Mary Kay, Medicis Pharmaceuticals, Neutrogena, Philosophy, Stiefel, Topix Pharmaceuticals, and Unilever.

ATX-101: ‘You’re gonna like your new chin’
ISTANBUL – Both clinicians and patients gave favorable marks to a novel injectable pharmacologic treatment for removal of unwanted submental fat – the unsightly double chin – in two phase III randomized trials presented at the annual congress of the European Academy of Dermatology and Venereology.
The investigational chin-fat buster, known as ATX-101, is a proprietary purified synthetic form of deoxycholic acid. Upon injection directly into the submental fat, ATX-101 lyses adipocytes by disrupting their cell membranes.
There is an unmet need for a rigorously studied prescription product for nonsurgical treatment of excess submental fat. Not everyone with a double chin is interested in or a good candidate for the established surgical procedures, observed Dr. Berthold Rzany, a dermatologist at Charité University Hospital, Berlin, who presented a 363-patient, randomized, placebo-controlled phase III trial at the meeting. Participants had to have a body mass index no higher than 30 kg/m2, dissatisfaction with the appearance of their submental area, and a physician rating of moderate to severe submental fat. Three-quarters of the subjects were women, with a mean age of 46 years and a mean BMI of 25.7 kg/m2.
One of the two primary efficacy endpoints required at least a 1-point improvement on the 0- to 4-point Clinician-Reported Submental Fat Rating Scale as assessed 12 weeks after the final treatment. This was achieved in 59% of patients randomized to ATX-101 at a dose of 1mg/cm2 and 65% at 2 mg/cm2, both significantly higher rates than the 23% in placebo-treated controls.
The other primary endpoint required a high level of patient satisfaction with the appearance of their face and chin after treatment as expressed in a Subject Self-Rating Scale score of 4 or more on the 0-6 scale. This endpoint was achieved in 53% of patients treated with ATX-101 at 1 mg/cm2, 66% who received the agent at 2 mg/cm2, and 29% of the placebo group.
ATX-101-treated patients were also significantly more likely to report perceived improvement in the visual and psychological impact of their submental fat. For example, 74% of patients who received ATX-101 at 1 mg/cm2 and 80% at 2 mg/cm2 reported improved definition between their chin and neck, compared with baseline and compared with 28% of placebo-treated controls. In addition, 32% of patients who received the lower dose of ATX-101 and 39% who got the higher dose characterized their submental fat as "a great deal better," compared with baseline, as did a mere 7% of controls.
Also, patients who received ATX-101 reported 12 weeks post treatment that they looked less overweight and were less bothered by and self-conscious about their submental fat, compared with controls.
Treatment-emergent induration, redness, bruising, numbness, and/or swelling variously occurred in one-third to two-thirds of ATX-101 recipients. All of these adverse events were more common than in placebo-treated controls. However, the events were transient and mostly mild or moderate in intensity. The exception was injection site pain, which occurred in roughly 80% of ATX-101-treated patients and was mostly moderate to severe, although it lasted a median of only 1 day, according to Dr. Rzany.
The ATX-101 treatment regimen entails up to 50 2-mL fixed-dose subcutaneous injections 1 cm apart per treatment session. Up to four treatment sessions were permitted, each separated by a minimum of 4 weeks.
In a separate presentation, Dr. Benjamin Ascher reported on 360 randomized patients who participated in the other phase III clinical trial. The two studies had the same design and endpoints.
An improvement of at least 1 point on the Clinician-Reported Submental Fat Rating Scale occurred in 58% of patients randomized to ATX-101 at the 1 mg/cm2 dose, 62% of those who received the higher dose, and 35% on placebo. Moreover, 68% of patients who got ATX-101 at 1 mg/cm2 were satisfied with their resultant appearance as reflected in a Subject Self-Rating Scale score of at least 4. So were 65% of those who received the higher dose and 29% of placebo-treated controls. As in the previously mentioned study, indices of self-image and psychological well being were also improved following the aesthetic therapy. Treatment-related adverse events were mostly transient and mild to moderate in intensity, according to Dr. Ascher, who is in the private practice of aesthetic surgery in Paris.
Both phase III studies were supported by Bayer HealthCare and KYTHERA Biopharmaceuticals. Dr. Rzany and Dr. Ascher serve as advisers to the companies.
ISTANBUL – Both clinicians and patients gave favorable marks to a novel injectable pharmacologic treatment for removal of unwanted submental fat – the unsightly double chin – in two phase III randomized trials presented at the annual congress of the European Academy of Dermatology and Venereology.
The investigational chin-fat buster, known as ATX-101, is a proprietary purified synthetic form of deoxycholic acid. Upon injection directly into the submental fat, ATX-101 lyses adipocytes by disrupting their cell membranes.
There is an unmet need for a rigorously studied prescription product for nonsurgical treatment of excess submental fat. Not everyone with a double chin is interested in or a good candidate for the established surgical procedures, observed Dr. Berthold Rzany, a dermatologist at Charité University Hospital, Berlin, who presented a 363-patient, randomized, placebo-controlled phase III trial at the meeting. Participants had to have a body mass index no higher than 30 kg/m2, dissatisfaction with the appearance of their submental area, and a physician rating of moderate to severe submental fat. Three-quarters of the subjects were women, with a mean age of 46 years and a mean BMI of 25.7 kg/m2.
One of the two primary efficacy endpoints required at least a 1-point improvement on the 0- to 4-point Clinician-Reported Submental Fat Rating Scale as assessed 12 weeks after the final treatment. This was achieved in 59% of patients randomized to ATX-101 at a dose of 1mg/cm2 and 65% at 2 mg/cm2, both significantly higher rates than the 23% in placebo-treated controls.
The other primary endpoint required a high level of patient satisfaction with the appearance of their face and chin after treatment as expressed in a Subject Self-Rating Scale score of 4 or more on the 0-6 scale. This endpoint was achieved in 53% of patients treated with ATX-101 at 1 mg/cm2, 66% who received the agent at 2 mg/cm2, and 29% of the placebo group.
ATX-101-treated patients were also significantly more likely to report perceived improvement in the visual and psychological impact of their submental fat. For example, 74% of patients who received ATX-101 at 1 mg/cm2 and 80% at 2 mg/cm2 reported improved definition between their chin and neck, compared with baseline and compared with 28% of placebo-treated controls. In addition, 32% of patients who received the lower dose of ATX-101 and 39% who got the higher dose characterized their submental fat as "a great deal better," compared with baseline, as did a mere 7% of controls.
Also, patients who received ATX-101 reported 12 weeks post treatment that they looked less overweight and were less bothered by and self-conscious about their submental fat, compared with controls.
Treatment-emergent induration, redness, bruising, numbness, and/or swelling variously occurred in one-third to two-thirds of ATX-101 recipients. All of these adverse events were more common than in placebo-treated controls. However, the events were transient and mostly mild or moderate in intensity. The exception was injection site pain, which occurred in roughly 80% of ATX-101-treated patients and was mostly moderate to severe, although it lasted a median of only 1 day, according to Dr. Rzany.
The ATX-101 treatment regimen entails up to 50 2-mL fixed-dose subcutaneous injections 1 cm apart per treatment session. Up to four treatment sessions were permitted, each separated by a minimum of 4 weeks.
In a separate presentation, Dr. Benjamin Ascher reported on 360 randomized patients who participated in the other phase III clinical trial. The two studies had the same design and endpoints.
An improvement of at least 1 point on the Clinician-Reported Submental Fat Rating Scale occurred in 58% of patients randomized to ATX-101 at the 1 mg/cm2 dose, 62% of those who received the higher dose, and 35% on placebo. Moreover, 68% of patients who got ATX-101 at 1 mg/cm2 were satisfied with their resultant appearance as reflected in a Subject Self-Rating Scale score of at least 4. So were 65% of those who received the higher dose and 29% of placebo-treated controls. As in the previously mentioned study, indices of self-image and psychological well being were also improved following the aesthetic therapy. Treatment-related adverse events were mostly transient and mild to moderate in intensity, according to Dr. Ascher, who is in the private practice of aesthetic surgery in Paris.
Both phase III studies were supported by Bayer HealthCare and KYTHERA Biopharmaceuticals. Dr. Rzany and Dr. Ascher serve as advisers to the companies.
ISTANBUL – Both clinicians and patients gave favorable marks to a novel injectable pharmacologic treatment for removal of unwanted submental fat – the unsightly double chin – in two phase III randomized trials presented at the annual congress of the European Academy of Dermatology and Venereology.
The investigational chin-fat buster, known as ATX-101, is a proprietary purified synthetic form of deoxycholic acid. Upon injection directly into the submental fat, ATX-101 lyses adipocytes by disrupting their cell membranes.
There is an unmet need for a rigorously studied prescription product for nonsurgical treatment of excess submental fat. Not everyone with a double chin is interested in or a good candidate for the established surgical procedures, observed Dr. Berthold Rzany, a dermatologist at Charité University Hospital, Berlin, who presented a 363-patient, randomized, placebo-controlled phase III trial at the meeting. Participants had to have a body mass index no higher than 30 kg/m2, dissatisfaction with the appearance of their submental area, and a physician rating of moderate to severe submental fat. Three-quarters of the subjects were women, with a mean age of 46 years and a mean BMI of 25.7 kg/m2.
One of the two primary efficacy endpoints required at least a 1-point improvement on the 0- to 4-point Clinician-Reported Submental Fat Rating Scale as assessed 12 weeks after the final treatment. This was achieved in 59% of patients randomized to ATX-101 at a dose of 1mg/cm2 and 65% at 2 mg/cm2, both significantly higher rates than the 23% in placebo-treated controls.
The other primary endpoint required a high level of patient satisfaction with the appearance of their face and chin after treatment as expressed in a Subject Self-Rating Scale score of 4 or more on the 0-6 scale. This endpoint was achieved in 53% of patients treated with ATX-101 at 1 mg/cm2, 66% who received the agent at 2 mg/cm2, and 29% of the placebo group.
ATX-101-treated patients were also significantly more likely to report perceived improvement in the visual and psychological impact of their submental fat. For example, 74% of patients who received ATX-101 at 1 mg/cm2 and 80% at 2 mg/cm2 reported improved definition between their chin and neck, compared with baseline and compared with 28% of placebo-treated controls. In addition, 32% of patients who received the lower dose of ATX-101 and 39% who got the higher dose characterized their submental fat as "a great deal better," compared with baseline, as did a mere 7% of controls.
Also, patients who received ATX-101 reported 12 weeks post treatment that they looked less overweight and were less bothered by and self-conscious about their submental fat, compared with controls.
Treatment-emergent induration, redness, bruising, numbness, and/or swelling variously occurred in one-third to two-thirds of ATX-101 recipients. All of these adverse events were more common than in placebo-treated controls. However, the events were transient and mostly mild or moderate in intensity. The exception was injection site pain, which occurred in roughly 80% of ATX-101-treated patients and was mostly moderate to severe, although it lasted a median of only 1 day, according to Dr. Rzany.
The ATX-101 treatment regimen entails up to 50 2-mL fixed-dose subcutaneous injections 1 cm apart per treatment session. Up to four treatment sessions were permitted, each separated by a minimum of 4 weeks.
In a separate presentation, Dr. Benjamin Ascher reported on 360 randomized patients who participated in the other phase III clinical trial. The two studies had the same design and endpoints.
An improvement of at least 1 point on the Clinician-Reported Submental Fat Rating Scale occurred in 58% of patients randomized to ATX-101 at the 1 mg/cm2 dose, 62% of those who received the higher dose, and 35% on placebo. Moreover, 68% of patients who got ATX-101 at 1 mg/cm2 were satisfied with their resultant appearance as reflected in a Subject Self-Rating Scale score of at least 4. So were 65% of those who received the higher dose and 29% of placebo-treated controls. As in the previously mentioned study, indices of self-image and psychological well being were also improved following the aesthetic therapy. Treatment-related adverse events were mostly transient and mild to moderate in intensity, according to Dr. Ascher, who is in the private practice of aesthetic surgery in Paris.
Both phase III studies were supported by Bayer HealthCare and KYTHERA Biopharmaceuticals. Dr. Rzany and Dr. Ascher serve as advisers to the companies.
AT THE EADV CONGRESS
Major finding: Patients with excess submental fat who received treatment using a novel subcutaneously injectable agent for the nonsurgical reduction of double chins were significantly more likely to be satisfied with their chin’s appearance afterward than were placebo-treated controls.
Data source: The two studies included a total of 723 patients with moderate to severe excess submental fat.
Disclosures: The studies were funded by Bayer HealthCare and KYTHERA Biopharmaceuticals. The presenters have received research grants from and serve as advisers to the companies.