User login
Columbia names interim chair of psychiatry after Twitter controversy
Helen Blair Simpson, MD, PhD, will take over for Jeffrey Lieberman, MD, who was suspended over a tweet he sent that was widely condemned as both racist and sexist.

She will also serve as interim director of the New York State Psychiatric Institute and interim psychiatrist-in-chief at New York–Presbyterian/Columbia University Irving Medical Center, the email stated.
All appointments were effective on Feb. 28.
Latest response
Dr. Simpson, who joined the faculty at Columbia in 1999, previously served as a professor and vice chair of research for the psychiatry department, director of Columbia’s Center for Obsessive-Compulsive and Related Disorders, and director of psychiatry research at the New York State Psychiatric Institute. Dr. Simpson is associate editor of JAMA Psychiatry and is president-elect of the Anxiety and Depression Association of America.
Her research has been continuously funded by the National Institute of Mental Health since 1999, and she has advised both the World Health Organization and the American Psychiatric Association on the diagnosis and treatment of OCD.
Dr. Simpson has a bachelor’s degree in biology from Yale University and completed an MD-PhD program at The Rockefeller University and Weill Cornell Medicine, New York. She did her residency in psychiatry at New York–Presbyterian.
The announcement is Columbia’s latest response to the furor that erupted on social media following Dr. Lieberman’s tweet about Sudanese model Nyakim Gatwech, in which he wrote, “Whether a work of art or a freak of nature she’s a beautiful sight to behold.”
Twitter reacted immediately and negatively to the tweet, which even Dr. Lieberman later acknowledged was “racist and sexist” in an email apology he sent Feb. 22 to faculty and staff in the department of psychiatry.
As reported by this news organization, Columbia suspended Dr. Lieberman from his chair position on Feb. 23 and permanently removed him from the post of psychiatrist-in-chief at New York–Presbyterian Hospital/Columbia University Irving Medical Center. Lieberman also resigned as executive director of the New York State Psychiatric Institute.
The email announcing Simpson’s appointment was signed by Katrina Armstrong, MD, incoming CEO, Columbia University Irving Medical Center and dean of the Faculties of Health Sciences and the Vagelos College of Physicians and Surgeons; Anil K. Rustgi, MD, interim executive vice president and dean of the Faculties of Health Sciences and Medicine; Steven J. Corwin, MD; president and CEO, New York–Presbyterian; and Ann Marie Sullivan, MD, commissioner of the New York State Office of Mental Health.
This is a developing story.
A version of this article first appeared on Medscape.com.
Helen Blair Simpson, MD, PhD, will take over for Jeffrey Lieberman, MD, who was suspended over a tweet he sent that was widely condemned as both racist and sexist.
She will also serve as interim director of the New York State Psychiatric Institute and interim psychiatrist-in-chief at New York–Presbyterian/Columbia University Irving Medical Center, the email stated.
All appointments were effective on Feb. 28.
Latest response
Dr. Simpson, who joined the faculty at Columbia in 1999, previously served as a professor and vice chair of research for the psychiatry department, director of Columbia’s Center for Obsessive-Compulsive and Related Disorders, and director of psychiatry research at the New York State Psychiatric Institute. Dr. Simpson is associate editor of JAMA Psychiatry and is president-elect of the Anxiety and Depression Association of America.
Her research has been continuously funded by the National Institute of Mental Health since 1999, and she has advised both the World Health Organization and the American Psychiatric Association on the diagnosis and treatment of OCD.
Dr. Simpson has a bachelor’s degree in biology from Yale University and completed an MD-PhD program at The Rockefeller University and Weill Cornell Medicine, New York. She did her residency in psychiatry at New York–Presbyterian.
The announcement is Columbia’s latest response to the furor that erupted on social media following Dr. Lieberman’s tweet about Sudanese model Nyakim Gatwech, in which he wrote, “Whether a work of art or a freak of nature she’s a beautiful sight to behold.”
Twitter reacted immediately and negatively to the tweet, which even Dr. Lieberman later acknowledged was “racist and sexist” in an email apology he sent Feb. 22 to faculty and staff in the department of psychiatry.
As reported by this news organization, Columbia suspended Dr. Lieberman from his chair position on Feb. 23 and permanently removed him from the post of psychiatrist-in-chief at New York–Presbyterian Hospital/Columbia University Irving Medical Center. Lieberman also resigned as executive director of the New York State Psychiatric Institute.
The email announcing Simpson’s appointment was signed by Katrina Armstrong, MD, incoming CEO, Columbia University Irving Medical Center and dean of the Faculties of Health Sciences and the Vagelos College of Physicians and Surgeons; Anil K. Rustgi, MD, interim executive vice president and dean of the Faculties of Health Sciences and Medicine; Steven J. Corwin, MD; president and CEO, New York–Presbyterian; and Ann Marie Sullivan, MD, commissioner of the New York State Office of Mental Health.
This is a developing story.
A version of this article first appeared on Medscape.com.
Helen Blair Simpson, MD, PhD, will take over for Jeffrey Lieberman, MD, who was suspended over a tweet he sent that was widely condemned as both racist and sexist.
She will also serve as interim director of the New York State Psychiatric Institute and interim psychiatrist-in-chief at New York–Presbyterian/Columbia University Irving Medical Center, the email stated.
All appointments were effective on Feb. 28.
Latest response
Dr. Simpson, who joined the faculty at Columbia in 1999, previously served as a professor and vice chair of research for the psychiatry department, director of Columbia’s Center for Obsessive-Compulsive and Related Disorders, and director of psychiatry research at the New York State Psychiatric Institute. Dr. Simpson is associate editor of JAMA Psychiatry and is president-elect of the Anxiety and Depression Association of America.
Her research has been continuously funded by the National Institute of Mental Health since 1999, and she has advised both the World Health Organization and the American Psychiatric Association on the diagnosis and treatment of OCD.
Dr. Simpson has a bachelor’s degree in biology from Yale University and completed an MD-PhD program at The Rockefeller University and Weill Cornell Medicine, New York. She did her residency in psychiatry at New York–Presbyterian.
The announcement is Columbia’s latest response to the furor that erupted on social media following Dr. Lieberman’s tweet about Sudanese model Nyakim Gatwech, in which he wrote, “Whether a work of art or a freak of nature she’s a beautiful sight to behold.”
Twitter reacted immediately and negatively to the tweet, which even Dr. Lieberman later acknowledged was “racist and sexist” in an email apology he sent Feb. 22 to faculty and staff in the department of psychiatry.
As reported by this news organization, Columbia suspended Dr. Lieberman from his chair position on Feb. 23 and permanently removed him from the post of psychiatrist-in-chief at New York–Presbyterian Hospital/Columbia University Irving Medical Center. Lieberman also resigned as executive director of the New York State Psychiatric Institute.
The email announcing Simpson’s appointment was signed by Katrina Armstrong, MD, incoming CEO, Columbia University Irving Medical Center and dean of the Faculties of Health Sciences and the Vagelos College of Physicians and Surgeons; Anil K. Rustgi, MD, interim executive vice president and dean of the Faculties of Health Sciences and Medicine; Steven J. Corwin, MD; president and CEO, New York–Presbyterian; and Ann Marie Sullivan, MD, commissioner of the New York State Office of Mental Health.
This is a developing story.
A version of this article first appeared on Medscape.com.

Immediate postpartum IUD insertion increases expulsion risk
Expulsion of intrauterine devices was significantly more likely when the devices were inserted within the first 3 days after delivery compared with later insertions, based on data from more than 300,000 women.
Intrauterine devices are effective contraception, and current guidelines support immediate postpartum IUD insertion as a safe, effective, and convenient option, Mary Anne Armstrong, MA, of Kaiser Permanente Northern California, Oakland, and colleagues wrote. Although IUD expulsion rates are low overall, data from previous studies suggest that timing of insertion may affect expulsion rates, and that breastfeeding may play a role.
In the Association of Perforation and Expulsion of Intrauterine Devices (APEX-IUD) cohort study published in JAMA Network Open, the researchers reviewed data from the electronic health records at four sites; the study population included women aged 50 years and younger who underwent IUD insertion between 2001 and 2018.
The women were grouped by postpartum status and timing of IUD placement: 0-3 days, 4 days to 6 weeks, 6-14 weeks, 14-52 weeks, and nonpostpartum (defined as more than 52 weeks or no evidence of delivery).
The researchers also compared expulsion rates in postpartum women who were and were not breastfeeding at the time of IUD insertion based on clinical records, diagnostic codes, or questionnaires at well-baby visits.
The total study population included 326,658 women with a mean age of 32.0 years; 42% were non-Hispanic White, 17.2% were Hispanic other, 13.0% were Hispanic White, 11.9% were Asian or Pacific Islander, 8.7% were non-Hispanic Black, and 0.2% were Hispanic Black. Approximately 80% of the IUDs were levonorgestrel releasing.
A total of 8,943 expulsions were reported, for an overall expulsion rate of 13.94 per 1,000 person-years.
The adjusted hazard ratios for IUD expulsion were 5.34, 1.22, 1.06, and 1.43 for women with insertion times, respectively, of 0-3 days, 4 days to 6 or fewer weeks, 6-14 weeks, and 14-52 weeks. Women with nonpostpartum IUD insertion served as the referent.
The 5-year cumulative incidence of IUD expulsion was highest with placement between 0 and 3 days post partum and lowest with placement at 6-14 weeks postpartum (10.73% and 3.18%, respectively).
“Within the group with IUD insertions 0-3 days postpartum, the highest expulsion rates were discovered within 12 weeks of insertion, with the highest incidence rate occurring at week 6 (844 per 1,000 person-years), a time women are commonly seen post delivery,” the researchers noted.
In a subcohort of 94,817 women with known breastfeeding status, the 5-year cumulative incidence of expulsion was 3.49% for breastfeeding women and 4.57% for nonbreastfeeding women, with an adjusted HR of 0.71 for breastfeeding versus not breastfeeding.
“While women who accept immediate postpartum IUD placement report high satisfaction rates, information on women’s preferences and satisfaction associated with different timing of postpartum placement would also be helpful to understand the benefit-risk profile,” the researchers wrote in their discussion of the findings. “The fact that most expulsions in the immediate postpartum group occurred early presents an opportunity to mitigate risk of unrecognized expulsion and unintended pregnancy via counseling on signs of expulsion and follow-up examination.”
The study findings were limited by several factors including the potential misclassification of exposures and the primary outcome of expulsion, especially since some postpartum women may be lactating whether or not they are breastfeeding, the researchers noted. Other limitations included the combination of complete and partial expulsions, and the dating of IUD expulsion based on when it came to medical attention, which was not necessarily when it occurred. More data are needed on the potential association between lactational amenorrhea and lower expulsion risk among postpartum women who are breastfeeding.
However, the results were strengthened by the large and diverse study population, the use of linked mother-infant records to identify exposures, and the use electronic health records to identify outcomes, and the data can inform patient counseling for postpartum IUDs, the researchers concluded.
Study reflects findings from Europe
“The FDA mandated this study in response to a European study, EURAS-IUD1, a European prospective observational study that enrolled 61,448 participants between 2006 and 2012,” Ms. Armstrong said in an interview. In the European study “women breastfeeding at the time of device insertion or with the device inserted at 36 weeks’ postpartum or less had higher risk of uterine perforation. The FDA wanted to know if the risks were similar in the United States population”
The APEX-IUD study was designed to reflect current United States clinical practice. “The aims of APEX-IUD are to evaluate risk of IUD-related uterine perforation and device expulsion among women who are breastfeeding or within 12 months postpartum at insertion. The perforation outcome is addressed in a separate paper,” Ms. Armstrong noted.
“We were not surprised by the findings; they aligned with previous findings and confirm the overall safety of intrauterine devices,” said Ms. Armstrong. “Data from this study provides IUD expulsion risk estimates that can be used to inform clinical practice and preinsertion counseling. IUD insertions 0-3 days postpartum might decrease the risk of unintended pregnancy and provide more convenience and efficiency for new mothers. This has proven to be especially important during the pandemic. The higher risk of expulsion at 0-3 days post partum must be balanced with the low IUD-related uterine perforation risk to provide a comprehensive picture that aids in clinical decision-making.
“Potential barriers to postpartum IUD placement include lack of provision of education on the range of contraceptive options available during prenatal care and failure or inability of hospital inpatient units to stock the intrauterine devices for use when needed,” said Ms. Armstrong.
Looking ahead, “future research could evaluate risk factors for partial versus complete expulsions, the association of preinsertion counseling with recognition of potential expulsions and corresponding IUD failure rates, and whether ultrasound verification of IUD position in the uterus after insertion is associated with expulsion risk,” she said.
Identifying risk factors informs patient counseling
“The current study examines breastfeeding at time of IUD insertion as a risk factor for expulsion,” Iris Krishna, MD, of Emory University, Atlanta, said in an interview. “There is biologic plausibility that breastfeeding may be a risk factor of IUD expulsion. Breastfeeding stimulates secretion of oxytocin, a hormone which plays a key role in the contraction of the uterus during labor and uterine involution postpartum. It also plays a key role in the contraction of milk ducts to allow for milk letdown. Because of its dual role some mothers may occasionally report uterine cramping with breastfeeding. Prior studies have suggested that breastfeeding may be associated with an increased risk of uterine perforation with postpartum IUD placement, but how breastfeeding may contribute to risk of IUD expulsion has not been studied extensively.”
The current data are consistent with previous studies suggesting the highest risk of IUD expulsion is with placement in the immediate postpartum period (0-3 days). “In a subcohort analysis by breastfeeding status, the risk of IUD expulsion was lower for women who were breastfeeding versus not breastfeeding;” however, “these findings may be due to amenorrhea that can also be seen with breastfeeding,” Dr. Krishna said. “Menstrual bleeding is an independent risk factor for IUD expulsion and not having menstrual bleeding while breastfeeding may lower risk of expulsion.
“Patients should be counseled on the benefits of immediate postpartum IUD placement, the risk of IUD expulsion, and alternative contraception options to be able to make an informed decision about the right contraception for them,” Dr. Krishna emphasized. “Clinicians can reassure patients that the uterine cramping they may feel while breastfeeding does not appear to increase the risk of IUD expulsion and that the amenorrhea that may result from breastfeeding also may lower the risk of IUD expulsion.”
The study was supported by Bayer through support to RTI Health Solutions, Kaiser Permanente Northern California, Kaiser Permanente Southern California, Kaiser Permanente Washington, and the Regenstrief Institute. Ms. Armstrong and several coauthors disclosed support from Bayer during the study. Dr. Krishna had no relevant disclosures.
Expulsion of intrauterine devices was significantly more likely when the devices were inserted within the first 3 days after delivery compared with later insertions, based on data from more than 300,000 women.
Intrauterine devices are effective contraception, and current guidelines support immediate postpartum IUD insertion as a safe, effective, and convenient option, Mary Anne Armstrong, MA, of Kaiser Permanente Northern California, Oakland, and colleagues wrote. Although IUD expulsion rates are low overall, data from previous studies suggest that timing of insertion may affect expulsion rates, and that breastfeeding may play a role.
In the Association of Perforation and Expulsion of Intrauterine Devices (APEX-IUD) cohort study published in JAMA Network Open, the researchers reviewed data from the electronic health records at four sites; the study population included women aged 50 years and younger who underwent IUD insertion between 2001 and 2018.
The women were grouped by postpartum status and timing of IUD placement: 0-3 days, 4 days to 6 weeks, 6-14 weeks, 14-52 weeks, and nonpostpartum (defined as more than 52 weeks or no evidence of delivery).
The researchers also compared expulsion rates in postpartum women who were and were not breastfeeding at the time of IUD insertion based on clinical records, diagnostic codes, or questionnaires at well-baby visits.
The total study population included 326,658 women with a mean age of 32.0 years; 42% were non-Hispanic White, 17.2% were Hispanic other, 13.0% were Hispanic White, 11.9% were Asian or Pacific Islander, 8.7% were non-Hispanic Black, and 0.2% were Hispanic Black. Approximately 80% of the IUDs were levonorgestrel releasing.
A total of 8,943 expulsions were reported, for an overall expulsion rate of 13.94 per 1,000 person-years.
The adjusted hazard ratios for IUD expulsion were 5.34, 1.22, 1.06, and 1.43 for women with insertion times, respectively, of 0-3 days, 4 days to 6 or fewer weeks, 6-14 weeks, and 14-52 weeks. Women with nonpostpartum IUD insertion served as the referent.
The 5-year cumulative incidence of IUD expulsion was highest with placement between 0 and 3 days post partum and lowest with placement at 6-14 weeks postpartum (10.73% and 3.18%, respectively).
“Within the group with IUD insertions 0-3 days postpartum, the highest expulsion rates were discovered within 12 weeks of insertion, with the highest incidence rate occurring at week 6 (844 per 1,000 person-years), a time women are commonly seen post delivery,” the researchers noted.
In a subcohort of 94,817 women with known breastfeeding status, the 5-year cumulative incidence of expulsion was 3.49% for breastfeeding women and 4.57% for nonbreastfeeding women, with an adjusted HR of 0.71 for breastfeeding versus not breastfeeding.
“While women who accept immediate postpartum IUD placement report high satisfaction rates, information on women’s preferences and satisfaction associated with different timing of postpartum placement would also be helpful to understand the benefit-risk profile,” the researchers wrote in their discussion of the findings. “The fact that most expulsions in the immediate postpartum group occurred early presents an opportunity to mitigate risk of unrecognized expulsion and unintended pregnancy via counseling on signs of expulsion and follow-up examination.”
The study findings were limited by several factors including the potential misclassification of exposures and the primary outcome of expulsion, especially since some postpartum women may be lactating whether or not they are breastfeeding, the researchers noted. Other limitations included the combination of complete and partial expulsions, and the dating of IUD expulsion based on when it came to medical attention, which was not necessarily when it occurred. More data are needed on the potential association between lactational amenorrhea and lower expulsion risk among postpartum women who are breastfeeding.
However, the results were strengthened by the large and diverse study population, the use of linked mother-infant records to identify exposures, and the use electronic health records to identify outcomes, and the data can inform patient counseling for postpartum IUDs, the researchers concluded.
Study reflects findings from Europe
“The FDA mandated this study in response to a European study, EURAS-IUD1, a European prospective observational study that enrolled 61,448 participants between 2006 and 2012,” Ms. Armstrong said in an interview. In the European study “women breastfeeding at the time of device insertion or with the device inserted at 36 weeks’ postpartum or less had higher risk of uterine perforation. The FDA wanted to know if the risks were similar in the United States population”
The APEX-IUD study was designed to reflect current United States clinical practice. “The aims of APEX-IUD are to evaluate risk of IUD-related uterine perforation and device expulsion among women who are breastfeeding or within 12 months postpartum at insertion. The perforation outcome is addressed in a separate paper,” Ms. Armstrong noted.
“We were not surprised by the findings; they aligned with previous findings and confirm the overall safety of intrauterine devices,” said Ms. Armstrong. “Data from this study provides IUD expulsion risk estimates that can be used to inform clinical practice and preinsertion counseling. IUD insertions 0-3 days postpartum might decrease the risk of unintended pregnancy and provide more convenience and efficiency for new mothers. This has proven to be especially important during the pandemic. The higher risk of expulsion at 0-3 days post partum must be balanced with the low IUD-related uterine perforation risk to provide a comprehensive picture that aids in clinical decision-making.
“Potential barriers to postpartum IUD placement include lack of provision of education on the range of contraceptive options available during prenatal care and failure or inability of hospital inpatient units to stock the intrauterine devices for use when needed,” said Ms. Armstrong.
Looking ahead, “future research could evaluate risk factors for partial versus complete expulsions, the association of preinsertion counseling with recognition of potential expulsions and corresponding IUD failure rates, and whether ultrasound verification of IUD position in the uterus after insertion is associated with expulsion risk,” she said.
Identifying risk factors informs patient counseling
“The current study examines breastfeeding at time of IUD insertion as a risk factor for expulsion,” Iris Krishna, MD, of Emory University, Atlanta, said in an interview. “There is biologic plausibility that breastfeeding may be a risk factor of IUD expulsion. Breastfeeding stimulates secretion of oxytocin, a hormone which plays a key role in the contraction of the uterus during labor and uterine involution postpartum. It also plays a key role in the contraction of milk ducts to allow for milk letdown. Because of its dual role some mothers may occasionally report uterine cramping with breastfeeding. Prior studies have suggested that breastfeeding may be associated with an increased risk of uterine perforation with postpartum IUD placement, but how breastfeeding may contribute to risk of IUD expulsion has not been studied extensively.”
The current data are consistent with previous studies suggesting the highest risk of IUD expulsion is with placement in the immediate postpartum period (0-3 days). “In a subcohort analysis by breastfeeding status, the risk of IUD expulsion was lower for women who were breastfeeding versus not breastfeeding;” however, “these findings may be due to amenorrhea that can also be seen with breastfeeding,” Dr. Krishna said. “Menstrual bleeding is an independent risk factor for IUD expulsion and not having menstrual bleeding while breastfeeding may lower risk of expulsion.
“Patients should be counseled on the benefits of immediate postpartum IUD placement, the risk of IUD expulsion, and alternative contraception options to be able to make an informed decision about the right contraception for them,” Dr. Krishna emphasized. “Clinicians can reassure patients that the uterine cramping they may feel while breastfeeding does not appear to increase the risk of IUD expulsion and that the amenorrhea that may result from breastfeeding also may lower the risk of IUD expulsion.”
The study was supported by Bayer through support to RTI Health Solutions, Kaiser Permanente Northern California, Kaiser Permanente Southern California, Kaiser Permanente Washington, and the Regenstrief Institute. Ms. Armstrong and several coauthors disclosed support from Bayer during the study. Dr. Krishna had no relevant disclosures.
Expulsion of intrauterine devices was significantly more likely when the devices were inserted within the first 3 days after delivery compared with later insertions, based on data from more than 300,000 women.
Intrauterine devices are effective contraception, and current guidelines support immediate postpartum IUD insertion as a safe, effective, and convenient option, Mary Anne Armstrong, MA, of Kaiser Permanente Northern California, Oakland, and colleagues wrote. Although IUD expulsion rates are low overall, data from previous studies suggest that timing of insertion may affect expulsion rates, and that breastfeeding may play a role.
In the Association of Perforation and Expulsion of Intrauterine Devices (APEX-IUD) cohort study published in JAMA Network Open, the researchers reviewed data from the electronic health records at four sites; the study population included women aged 50 years and younger who underwent IUD insertion between 2001 and 2018.
The women were grouped by postpartum status and timing of IUD placement: 0-3 days, 4 days to 6 weeks, 6-14 weeks, 14-52 weeks, and nonpostpartum (defined as more than 52 weeks or no evidence of delivery).
The researchers also compared expulsion rates in postpartum women who were and were not breastfeeding at the time of IUD insertion based on clinical records, diagnostic codes, or questionnaires at well-baby visits.
The total study population included 326,658 women with a mean age of 32.0 years; 42% were non-Hispanic White, 17.2% were Hispanic other, 13.0% were Hispanic White, 11.9% were Asian or Pacific Islander, 8.7% were non-Hispanic Black, and 0.2% were Hispanic Black. Approximately 80% of the IUDs were levonorgestrel releasing.
A total of 8,943 expulsions were reported, for an overall expulsion rate of 13.94 per 1,000 person-years.
The adjusted hazard ratios for IUD expulsion were 5.34, 1.22, 1.06, and 1.43 for women with insertion times, respectively, of 0-3 days, 4 days to 6 or fewer weeks, 6-14 weeks, and 14-52 weeks. Women with nonpostpartum IUD insertion served as the referent.
The 5-year cumulative incidence of IUD expulsion was highest with placement between 0 and 3 days post partum and lowest with placement at 6-14 weeks postpartum (10.73% and 3.18%, respectively).
“Within the group with IUD insertions 0-3 days postpartum, the highest expulsion rates were discovered within 12 weeks of insertion, with the highest incidence rate occurring at week 6 (844 per 1,000 person-years), a time women are commonly seen post delivery,” the researchers noted.
In a subcohort of 94,817 women with known breastfeeding status, the 5-year cumulative incidence of expulsion was 3.49% for breastfeeding women and 4.57% for nonbreastfeeding women, with an adjusted HR of 0.71 for breastfeeding versus not breastfeeding.
“While women who accept immediate postpartum IUD placement report high satisfaction rates, information on women’s preferences and satisfaction associated with different timing of postpartum placement would also be helpful to understand the benefit-risk profile,” the researchers wrote in their discussion of the findings. “The fact that most expulsions in the immediate postpartum group occurred early presents an opportunity to mitigate risk of unrecognized expulsion and unintended pregnancy via counseling on signs of expulsion and follow-up examination.”
The study findings were limited by several factors including the potential misclassification of exposures and the primary outcome of expulsion, especially since some postpartum women may be lactating whether or not they are breastfeeding, the researchers noted. Other limitations included the combination of complete and partial expulsions, and the dating of IUD expulsion based on when it came to medical attention, which was not necessarily when it occurred. More data are needed on the potential association between lactational amenorrhea and lower expulsion risk among postpartum women who are breastfeeding.
However, the results were strengthened by the large and diverse study population, the use of linked mother-infant records to identify exposures, and the use electronic health records to identify outcomes, and the data can inform patient counseling for postpartum IUDs, the researchers concluded.
Study reflects findings from Europe
“The FDA mandated this study in response to a European study, EURAS-IUD1, a European prospective observational study that enrolled 61,448 participants between 2006 and 2012,” Ms. Armstrong said in an interview. In the European study “women breastfeeding at the time of device insertion or with the device inserted at 36 weeks’ postpartum or less had higher risk of uterine perforation. The FDA wanted to know if the risks were similar in the United States population”
The APEX-IUD study was designed to reflect current United States clinical practice. “The aims of APEX-IUD are to evaluate risk of IUD-related uterine perforation and device expulsion among women who are breastfeeding or within 12 months postpartum at insertion. The perforation outcome is addressed in a separate paper,” Ms. Armstrong noted.
“We were not surprised by the findings; they aligned with previous findings and confirm the overall safety of intrauterine devices,” said Ms. Armstrong. “Data from this study provides IUD expulsion risk estimates that can be used to inform clinical practice and preinsertion counseling. IUD insertions 0-3 days postpartum might decrease the risk of unintended pregnancy and provide more convenience and efficiency for new mothers. This has proven to be especially important during the pandemic. The higher risk of expulsion at 0-3 days post partum must be balanced with the low IUD-related uterine perforation risk to provide a comprehensive picture that aids in clinical decision-making.
“Potential barriers to postpartum IUD placement include lack of provision of education on the range of contraceptive options available during prenatal care and failure or inability of hospital inpatient units to stock the intrauterine devices for use when needed,” said Ms. Armstrong.
Looking ahead, “future research could evaluate risk factors for partial versus complete expulsions, the association of preinsertion counseling with recognition of potential expulsions and corresponding IUD failure rates, and whether ultrasound verification of IUD position in the uterus after insertion is associated with expulsion risk,” she said.
Identifying risk factors informs patient counseling
“The current study examines breastfeeding at time of IUD insertion as a risk factor for expulsion,” Iris Krishna, MD, of Emory University, Atlanta, said in an interview. “There is biologic plausibility that breastfeeding may be a risk factor of IUD expulsion. Breastfeeding stimulates secretion of oxytocin, a hormone which plays a key role in the contraction of the uterus during labor and uterine involution postpartum. It also plays a key role in the contraction of milk ducts to allow for milk letdown. Because of its dual role some mothers may occasionally report uterine cramping with breastfeeding. Prior studies have suggested that breastfeeding may be associated with an increased risk of uterine perforation with postpartum IUD placement, but how breastfeeding may contribute to risk of IUD expulsion has not been studied extensively.”
The current data are consistent with previous studies suggesting the highest risk of IUD expulsion is with placement in the immediate postpartum period (0-3 days). “In a subcohort analysis by breastfeeding status, the risk of IUD expulsion was lower for women who were breastfeeding versus not breastfeeding;” however, “these findings may be due to amenorrhea that can also be seen with breastfeeding,” Dr. Krishna said. “Menstrual bleeding is an independent risk factor for IUD expulsion and not having menstrual bleeding while breastfeeding may lower risk of expulsion.
“Patients should be counseled on the benefits of immediate postpartum IUD placement, the risk of IUD expulsion, and alternative contraception options to be able to make an informed decision about the right contraception for them,” Dr. Krishna emphasized. “Clinicians can reassure patients that the uterine cramping they may feel while breastfeeding does not appear to increase the risk of IUD expulsion and that the amenorrhea that may result from breastfeeding also may lower the risk of IUD expulsion.”
The study was supported by Bayer through support to RTI Health Solutions, Kaiser Permanente Northern California, Kaiser Permanente Southern California, Kaiser Permanente Washington, and the Regenstrief Institute. Ms. Armstrong and several coauthors disclosed support from Bayer during the study. Dr. Krishna had no relevant disclosures.
FROM JAMA NETWORK OPEN
FDA approves first drug for myelofibrosis with thrombocytopenia
Pacritinib (Vonjo, CTI BioPharma) is indicated for use in the treatment of adults with intermediate- or high-risk primary or secondary (post–polycythemia vera or post–essential thrombocythemia) myelofibrosis with a platelet count below 50 × 109/L.
Pacritinib is a novel oral kinase inhibitor with specificity for activity against Janus associated kinase 2 (JAK2) and IRAK1, without inhibiting JAK1. The recommended dosage is 200 mg orally twice daily.
In the United States, there are approximately 21,000 patients with myelofibrosis, notes the manufacturer. About one-third develop severe thrombocytopenia.
“Myelofibrosis with severe thrombocytopenia, defined as blood platelet counts below 50 × 109/L, has been shown to result in poor survival outcomes coupled with debilitating symptoms. Limited treatment options have rendered this disease as an area of urgent unmet medical need,” said John Mascarenhas, MD, associate professor, medicine, hematology, and medical oncology, Tisch Cancer Institute, Icahn School of Medicine at Mount Sinai, New York.
“I am pleased to see that a new, efficacious, and safe treatment option is now available for these patients,” he said in a company press release.
Dr. Mascarenhas was the lead investigator of the phase 3 PERSIST-2 trial that was the basis for the approval. Results from the trial were published in 2018 in JAMA Oncology and reported in detail at the time by this news organization.
Authors of an accompanying editorial noted the trial was truncated after the FDA imposed a clinical hold on pacritinib in February 2016 after reports from an earlier trial, PERSIST-1, of patient deaths related to cardiac failure and arrest as well as intracranial hemorrhage. The clinical hold was lifted in January 2017 after the manufacturer provided the FDA with more mature data.
Despite the truncation, the PERSIST-2 trial provided sufficient data to obtain accelerated approval for the drug. The study compared pacritinib with best available therapy (BAT).
In the cohort of patients treated with pacritinib 200 mg twice daily, 29% of patients had a reduction in spleen volume of at least 35% compared with 3% of patients receiving BAT, which included ruxolitinib.
The company is now expected to demonstrate clinical benefit in a confirmatory trial and has the PACIFICA trial underway. Results are expected in mid-2025.
The most common adverse reactions (reported by ≥ 20% of patients) were diarrhea, thrombocytopenia, nausea, anemia, and peripheral edema. The most frequent serious adverse reactions (≥ 3%) were anemia, thrombocytopenia, pneumonia, cardiac failure, disease progression, pyrexia, and squamous cell carcinoma of the skin.
A version of this article first appeared on Medscape.com.
Pacritinib (Vonjo, CTI BioPharma) is indicated for use in the treatment of adults with intermediate- or high-risk primary or secondary (post–polycythemia vera or post–essential thrombocythemia) myelofibrosis with a platelet count below 50 × 109/L.
Pacritinib is a novel oral kinase inhibitor with specificity for activity against Janus associated kinase 2 (JAK2) and IRAK1, without inhibiting JAK1. The recommended dosage is 200 mg orally twice daily.
In the United States, there are approximately 21,000 patients with myelofibrosis, notes the manufacturer. About one-third develop severe thrombocytopenia.
“Myelofibrosis with severe thrombocytopenia, defined as blood platelet counts below 50 × 109/L, has been shown to result in poor survival outcomes coupled with debilitating symptoms. Limited treatment options have rendered this disease as an area of urgent unmet medical need,” said John Mascarenhas, MD, associate professor, medicine, hematology, and medical oncology, Tisch Cancer Institute, Icahn School of Medicine at Mount Sinai, New York.
“I am pleased to see that a new, efficacious, and safe treatment option is now available for these patients,” he said in a company press release.
Dr. Mascarenhas was the lead investigator of the phase 3 PERSIST-2 trial that was the basis for the approval. Results from the trial were published in 2018 in JAMA Oncology and reported in detail at the time by this news organization.
Authors of an accompanying editorial noted the trial was truncated after the FDA imposed a clinical hold on pacritinib in February 2016 after reports from an earlier trial, PERSIST-1, of patient deaths related to cardiac failure and arrest as well as intracranial hemorrhage. The clinical hold was lifted in January 2017 after the manufacturer provided the FDA with more mature data.
Despite the truncation, the PERSIST-2 trial provided sufficient data to obtain accelerated approval for the drug. The study compared pacritinib with best available therapy (BAT).
In the cohort of patients treated with pacritinib 200 mg twice daily, 29% of patients had a reduction in spleen volume of at least 35% compared with 3% of patients receiving BAT, which included ruxolitinib.
The company is now expected to demonstrate clinical benefit in a confirmatory trial and has the PACIFICA trial underway. Results are expected in mid-2025.
The most common adverse reactions (reported by ≥ 20% of patients) were diarrhea, thrombocytopenia, nausea, anemia, and peripheral edema. The most frequent serious adverse reactions (≥ 3%) were anemia, thrombocytopenia, pneumonia, cardiac failure, disease progression, pyrexia, and squamous cell carcinoma of the skin.
A version of this article first appeared on Medscape.com.
Pacritinib (Vonjo, CTI BioPharma) is indicated for use in the treatment of adults with intermediate- or high-risk primary or secondary (post–polycythemia vera or post–essential thrombocythemia) myelofibrosis with a platelet count below 50 × 109/L.
Pacritinib is a novel oral kinase inhibitor with specificity for activity against Janus associated kinase 2 (JAK2) and IRAK1, without inhibiting JAK1. The recommended dosage is 200 mg orally twice daily.
In the United States, there are approximately 21,000 patients with myelofibrosis, notes the manufacturer. About one-third develop severe thrombocytopenia.
“Myelofibrosis with severe thrombocytopenia, defined as blood platelet counts below 50 × 109/L, has been shown to result in poor survival outcomes coupled with debilitating symptoms. Limited treatment options have rendered this disease as an area of urgent unmet medical need,” said John Mascarenhas, MD, associate professor, medicine, hematology, and medical oncology, Tisch Cancer Institute, Icahn School of Medicine at Mount Sinai, New York.
“I am pleased to see that a new, efficacious, and safe treatment option is now available for these patients,” he said in a company press release.
Dr. Mascarenhas was the lead investigator of the phase 3 PERSIST-2 trial that was the basis for the approval. Results from the trial were published in 2018 in JAMA Oncology and reported in detail at the time by this news organization.
Authors of an accompanying editorial noted the trial was truncated after the FDA imposed a clinical hold on pacritinib in February 2016 after reports from an earlier trial, PERSIST-1, of patient deaths related to cardiac failure and arrest as well as intracranial hemorrhage. The clinical hold was lifted in January 2017 after the manufacturer provided the FDA with more mature data.
Despite the truncation, the PERSIST-2 trial provided sufficient data to obtain accelerated approval for the drug. The study compared pacritinib with best available therapy (BAT).
In the cohort of patients treated with pacritinib 200 mg twice daily, 29% of patients had a reduction in spleen volume of at least 35% compared with 3% of patients receiving BAT, which included ruxolitinib.
The company is now expected to demonstrate clinical benefit in a confirmatory trial and has the PACIFICA trial underway. Results are expected in mid-2025.
The most common adverse reactions (reported by ≥ 20% of patients) were diarrhea, thrombocytopenia, nausea, anemia, and peripheral edema. The most frequent serious adverse reactions (≥ 3%) were anemia, thrombocytopenia, pneumonia, cardiac failure, disease progression, pyrexia, and squamous cell carcinoma of the skin.
A version of this article first appeared on Medscape.com.
Elective surgery should be delayed 7 weeks after COVID-19 infection for unvaccinated patients, statement recommends
.
For patients fully vaccinated against COVID-19 with breakthrough infections, there is no consensus on how vaccination affects the time between COVID-19 infection and elective surgery. Clinicians should use their clinical judgment to schedule procedures, said Randall M. Clark, MD, president of the American Society of Anesthesiologists (ASA). “We need all physicians, anesthesiologists, surgeons, and others to base their decision to go ahead with elective surgery on the patient’s symptoms, their need for the procedure, and whether delays could cause other problems with their health,” he said in an interview.
Prior to these updated recommendations, which were published Feb. 22, the ASA and the APSF recommended a 4-week gap between COVID-19 diagnosis and elective surgery for asymptomatic or mild cases, regardless of a patient’s vaccination status.
Extending the wait time from 4 to 7 weeks was based on a multination study conducted in October 2020 following more than 140,000 surgical patients. Patients with previous COVID-19 infection had an increased risk for complications and death in elective surgery for up to 6 weeks following their diagnosis, compared with patients without COVID-19. Additional research in the United States found that patients with a preoperative COVID diagnosis were at higher risk for postoperative complications of respiratory failure for up to 4 weeks after diagnosis and postoperative pneumonia complications for up to 8 weeks after diagnosis.
Because these studies were conducted in unvaccinated populations or those with low vaccination rates, and preliminary data suggest vaccinated patients with breakthrough infections may have a lower risk for complications and death postinfection, “we felt that it was prudent to just make recommendations specific to unvaccinated patients,” Dr. Clark added.
Although this guidance is “very helpful” in that it summarizes the currently available research to give evidence-based recommendations, the 7-week wait time is a “very conservative estimate,” Brent Matthews, MD, surgeon-in-chief of the surgery care division of Atrium Health, Charlotte, N.C., told this news organization. At Atrium Health, surgery is scheduled at least 21 days after a patient’s COVID-19 diagnosis, regardless of their vaccination status, Dr. Matthews said.
The studies currently available were conducted earlier in the pandemic, when a different variant was prevalent, Dr. Matthews explained. The Omicron variant is currently the most prevalent COVID-19 variant and is less virulent than earlier strains of the virus. The joint statement does note that there is currently “no robust data” on patients infected with the Delta or Omicron variants of COVID-19, and that “the Omicron variant causes less severe disease and is more likely to reside in the oro- and nasopharynx without infiltration and damage to the lungs.”
Still, the new recommendations are a reminder to re-evaluate the potential complications from surgery for previously infected patients and to consider what comorbidities might make them more vulnerable, Dr. Matthews said. “The real power of the joint statement is to get people to ensure that they make an assessment of every patient that comes in front of them who has had a recent positive COVID test.”
A version of this article first appeared on Medscape.com.
.
For patients fully vaccinated against COVID-19 with breakthrough infections, there is no consensus on how vaccination affects the time between COVID-19 infection and elective surgery. Clinicians should use their clinical judgment to schedule procedures, said Randall M. Clark, MD, president of the American Society of Anesthesiologists (ASA). “We need all physicians, anesthesiologists, surgeons, and others to base their decision to go ahead with elective surgery on the patient’s symptoms, their need for the procedure, and whether delays could cause other problems with their health,” he said in an interview.
Prior to these updated recommendations, which were published Feb. 22, the ASA and the APSF recommended a 4-week gap between COVID-19 diagnosis and elective surgery for asymptomatic or mild cases, regardless of a patient’s vaccination status.
Extending the wait time from 4 to 7 weeks was based on a multination study conducted in October 2020 following more than 140,000 surgical patients. Patients with previous COVID-19 infection had an increased risk for complications and death in elective surgery for up to 6 weeks following their diagnosis, compared with patients without COVID-19. Additional research in the United States found that patients with a preoperative COVID diagnosis were at higher risk for postoperative complications of respiratory failure for up to 4 weeks after diagnosis and postoperative pneumonia complications for up to 8 weeks after diagnosis.
Because these studies were conducted in unvaccinated populations or those with low vaccination rates, and preliminary data suggest vaccinated patients with breakthrough infections may have a lower risk for complications and death postinfection, “we felt that it was prudent to just make recommendations specific to unvaccinated patients,” Dr. Clark added.
Although this guidance is “very helpful” in that it summarizes the currently available research to give evidence-based recommendations, the 7-week wait time is a “very conservative estimate,” Brent Matthews, MD, surgeon-in-chief of the surgery care division of Atrium Health, Charlotte, N.C., told this news organization. At Atrium Health, surgery is scheduled at least 21 days after a patient’s COVID-19 diagnosis, regardless of their vaccination status, Dr. Matthews said.
The studies currently available were conducted earlier in the pandemic, when a different variant was prevalent, Dr. Matthews explained. The Omicron variant is currently the most prevalent COVID-19 variant and is less virulent than earlier strains of the virus. The joint statement does note that there is currently “no robust data” on patients infected with the Delta or Omicron variants of COVID-19, and that “the Omicron variant causes less severe disease and is more likely to reside in the oro- and nasopharynx without infiltration and damage to the lungs.”
Still, the new recommendations are a reminder to re-evaluate the potential complications from surgery for previously infected patients and to consider what comorbidities might make them more vulnerable, Dr. Matthews said. “The real power of the joint statement is to get people to ensure that they make an assessment of every patient that comes in front of them who has had a recent positive COVID test.”
A version of this article first appeared on Medscape.com.
.
For patients fully vaccinated against COVID-19 with breakthrough infections, there is no consensus on how vaccination affects the time between COVID-19 infection and elective surgery. Clinicians should use their clinical judgment to schedule procedures, said Randall M. Clark, MD, president of the American Society of Anesthesiologists (ASA). “We need all physicians, anesthesiologists, surgeons, and others to base their decision to go ahead with elective surgery on the patient’s symptoms, their need for the procedure, and whether delays could cause other problems with their health,” he said in an interview.
Prior to these updated recommendations, which were published Feb. 22, the ASA and the APSF recommended a 4-week gap between COVID-19 diagnosis and elective surgery for asymptomatic or mild cases, regardless of a patient’s vaccination status.
Extending the wait time from 4 to 7 weeks was based on a multination study conducted in October 2020 following more than 140,000 surgical patients. Patients with previous COVID-19 infection had an increased risk for complications and death in elective surgery for up to 6 weeks following their diagnosis, compared with patients without COVID-19. Additional research in the United States found that patients with a preoperative COVID diagnosis were at higher risk for postoperative complications of respiratory failure for up to 4 weeks after diagnosis and postoperative pneumonia complications for up to 8 weeks after diagnosis.
Because these studies were conducted in unvaccinated populations or those with low vaccination rates, and preliminary data suggest vaccinated patients with breakthrough infections may have a lower risk for complications and death postinfection, “we felt that it was prudent to just make recommendations specific to unvaccinated patients,” Dr. Clark added.
Although this guidance is “very helpful” in that it summarizes the currently available research to give evidence-based recommendations, the 7-week wait time is a “very conservative estimate,” Brent Matthews, MD, surgeon-in-chief of the surgery care division of Atrium Health, Charlotte, N.C., told this news organization. At Atrium Health, surgery is scheduled at least 21 days after a patient’s COVID-19 diagnosis, regardless of their vaccination status, Dr. Matthews said.
The studies currently available were conducted earlier in the pandemic, when a different variant was prevalent, Dr. Matthews explained. The Omicron variant is currently the most prevalent COVID-19 variant and is less virulent than earlier strains of the virus. The joint statement does note that there is currently “no robust data” on patients infected with the Delta or Omicron variants of COVID-19, and that “the Omicron variant causes less severe disease and is more likely to reside in the oro- and nasopharynx without infiltration and damage to the lungs.”
Still, the new recommendations are a reminder to re-evaluate the potential complications from surgery for previously infected patients and to consider what comorbidities might make them more vulnerable, Dr. Matthews said. “The real power of the joint statement is to get people to ensure that they make an assessment of every patient that comes in front of them who has had a recent positive COVID test.”
A version of this article first appeared on Medscape.com.
Lung cancer drug price trends cause alarm, highlight need for reform
The findings underscore the need for price reform, according to the investigators, who analyzed prices for 17 brand-name medications used for treating metastatic non–small cell lung cancer (NSCLC).
Prices increased during the study period and correlated within each drug class, Aakash Desai, MBBS, and colleagues from the Mayo Clinic, Rochester, Minn., found.
“Because numerous new drugs have been approved for the treatment of NSCLC in recent years, we sought to specifically study the price competition among drugs used to treat this cancer subtype,” they explained, noting that for most drug classes price increases outpaced changes in the consumer price index for prescription medications and the inflation rate.
The findings were published Jan. 25, 2022, in JAMA Network Open.
Multiple brand-name medications across several drug classes, including four immune checkpoint inhibitors (pembrolizumab, nivolumab, atezolizumab, and durvalumab), five epidermal growth factor receptor inhibitors (gefitinib, afatinib, erlotinib, osimertinib, and dacomitinib), five anaplastic lymphoma kinase inhibitors (crizotinib, ceritinib, alectinib, brigatinib, and lorlatinib), two BRAF inhibitors (dabrafenib, vemurafenib), and one MEK inhibitor (trametinib) were included in the analysis.
Median Pearson correlation coefficients approached 1.0 for all drug classes, indicating that prices increased despite within-class drug competition. Median values ranged from 0.898 for epidermal growth factor inhibitors to 0.999 for anaplastic lymphoma kinase inhibitors and BRAF and MEK inhibitors, the investigators found.
Median compounded annual growth rates (CAGRs) were 1.81% for immune checkpoint inhibitors, 2.56% for epidermal growth factor receptor inhibitors, 2.46% for anaplastic lymphoma kinase and ROS1 inhibitors, and 3.06% for BRAF and MEK inhibitors.
“With the exception of the immunotherapy class, the median cost CAGR outpaced the annual growth rate of the consumer price index for prescription drugs at 2.10% and, for all classes, the average yearly inflation rate of 1.75% during the same period,” they wrote.
Also of note, only one price decrease occurred among all therapeutic classes studied.
“This was observed for erlotinib between 2019 and 2020, and it corresponded with the introduction of a generic competitor to the market,” the authors said.
The findings are reminiscent of an earlier study that showed a 25% increase in the price of 24 patented injectable anticancer agents in the United States over a period of 8 years after launch.
“These increases in cost were not offset by supplemental U.S. Food and Drug Administration approvals, new competitors, or new off-label indications. Thus, price increases over time were not substantially reduced by market competition and increased at similar rates among drugs within the same class,” they wrote, adding that “although one might expect oncology drug prices to decrease over time after market entry, the list price of most anticancer agents increases paradoxically.”
The “lock-step price increases” observed without evidence of price competition in this analysis raise concerns about the affordability of promising oncology drugs, they said, concluding that “academic, industry, and government partnerships should be developed to address the high costs of prescription oncology drugs, which may soon be unaffordable for most patients if the trends discovered in the present study continue.”
Dr. Desai reported having no disclosures.
The findings underscore the need for price reform, according to the investigators, who analyzed prices for 17 brand-name medications used for treating metastatic non–small cell lung cancer (NSCLC).
Prices increased during the study period and correlated within each drug class, Aakash Desai, MBBS, and colleagues from the Mayo Clinic, Rochester, Minn., found.
“Because numerous new drugs have been approved for the treatment of NSCLC in recent years, we sought to specifically study the price competition among drugs used to treat this cancer subtype,” they explained, noting that for most drug classes price increases outpaced changes in the consumer price index for prescription medications and the inflation rate.
The findings were published Jan. 25, 2022, in JAMA Network Open.
Multiple brand-name medications across several drug classes, including four immune checkpoint inhibitors (pembrolizumab, nivolumab, atezolizumab, and durvalumab), five epidermal growth factor receptor inhibitors (gefitinib, afatinib, erlotinib, osimertinib, and dacomitinib), five anaplastic lymphoma kinase inhibitors (crizotinib, ceritinib, alectinib, brigatinib, and lorlatinib), two BRAF inhibitors (dabrafenib, vemurafenib), and one MEK inhibitor (trametinib) were included in the analysis.
Median Pearson correlation coefficients approached 1.0 for all drug classes, indicating that prices increased despite within-class drug competition. Median values ranged from 0.898 for epidermal growth factor inhibitors to 0.999 for anaplastic lymphoma kinase inhibitors and BRAF and MEK inhibitors, the investigators found.
Median compounded annual growth rates (CAGRs) were 1.81% for immune checkpoint inhibitors, 2.56% for epidermal growth factor receptor inhibitors, 2.46% for anaplastic lymphoma kinase and ROS1 inhibitors, and 3.06% for BRAF and MEK inhibitors.
“With the exception of the immunotherapy class, the median cost CAGR outpaced the annual growth rate of the consumer price index for prescription drugs at 2.10% and, for all classes, the average yearly inflation rate of 1.75% during the same period,” they wrote.
Also of note, only one price decrease occurred among all therapeutic classes studied.
“This was observed for erlotinib between 2019 and 2020, and it corresponded with the introduction of a generic competitor to the market,” the authors said.
The findings are reminiscent of an earlier study that showed a 25% increase in the price of 24 patented injectable anticancer agents in the United States over a period of 8 years after launch.
“These increases in cost were not offset by supplemental U.S. Food and Drug Administration approvals, new competitors, or new off-label indications. Thus, price increases over time were not substantially reduced by market competition and increased at similar rates among drugs within the same class,” they wrote, adding that “although one might expect oncology drug prices to decrease over time after market entry, the list price of most anticancer agents increases paradoxically.”
The “lock-step price increases” observed without evidence of price competition in this analysis raise concerns about the affordability of promising oncology drugs, they said, concluding that “academic, industry, and government partnerships should be developed to address the high costs of prescription oncology drugs, which may soon be unaffordable for most patients if the trends discovered in the present study continue.”
Dr. Desai reported having no disclosures.
The findings underscore the need for price reform, according to the investigators, who analyzed prices for 17 brand-name medications used for treating metastatic non–small cell lung cancer (NSCLC).
Prices increased during the study period and correlated within each drug class, Aakash Desai, MBBS, and colleagues from the Mayo Clinic, Rochester, Minn., found.
“Because numerous new drugs have been approved for the treatment of NSCLC in recent years, we sought to specifically study the price competition among drugs used to treat this cancer subtype,” they explained, noting that for most drug classes price increases outpaced changes in the consumer price index for prescription medications and the inflation rate.
The findings were published Jan. 25, 2022, in JAMA Network Open.
Multiple brand-name medications across several drug classes, including four immune checkpoint inhibitors (pembrolizumab, nivolumab, atezolizumab, and durvalumab), five epidermal growth factor receptor inhibitors (gefitinib, afatinib, erlotinib, osimertinib, and dacomitinib), five anaplastic lymphoma kinase inhibitors (crizotinib, ceritinib, alectinib, brigatinib, and lorlatinib), two BRAF inhibitors (dabrafenib, vemurafenib), and one MEK inhibitor (trametinib) were included in the analysis.
Median Pearson correlation coefficients approached 1.0 for all drug classes, indicating that prices increased despite within-class drug competition. Median values ranged from 0.898 for epidermal growth factor inhibitors to 0.999 for anaplastic lymphoma kinase inhibitors and BRAF and MEK inhibitors, the investigators found.
Median compounded annual growth rates (CAGRs) were 1.81% for immune checkpoint inhibitors, 2.56% for epidermal growth factor receptor inhibitors, 2.46% for anaplastic lymphoma kinase and ROS1 inhibitors, and 3.06% for BRAF and MEK inhibitors.
“With the exception of the immunotherapy class, the median cost CAGR outpaced the annual growth rate of the consumer price index for prescription drugs at 2.10% and, for all classes, the average yearly inflation rate of 1.75% during the same period,” they wrote.
Also of note, only one price decrease occurred among all therapeutic classes studied.
“This was observed for erlotinib between 2019 and 2020, and it corresponded with the introduction of a generic competitor to the market,” the authors said.
The findings are reminiscent of an earlier study that showed a 25% increase in the price of 24 patented injectable anticancer agents in the United States over a period of 8 years after launch.
“These increases in cost were not offset by supplemental U.S. Food and Drug Administration approvals, new competitors, or new off-label indications. Thus, price increases over time were not substantially reduced by market competition and increased at similar rates among drugs within the same class,” they wrote, adding that “although one might expect oncology drug prices to decrease over time after market entry, the list price of most anticancer agents increases paradoxically.”
The “lock-step price increases” observed without evidence of price competition in this analysis raise concerns about the affordability of promising oncology drugs, they said, concluding that “academic, industry, and government partnerships should be developed to address the high costs of prescription oncology drugs, which may soon be unaffordable for most patients if the trends discovered in the present study continue.”
Dr. Desai reported having no disclosures.
FROM JAMA NETWORK OPEN
How Lp(a) can help improve ASCVD risk assessment
A look back at a pair of large cohort studies suggests a telling relation between two distinct predictors of atherosclerotic cardiovascular disease (ASCVD) risk and may offer guidance on how to interpret them together.
Elevated levels of lipoprotein(a), or Lp(a), and high coronary artery calcium (CAC) scores were both predictive of ASCVD risk over 10 years, but independent of each other and a host of more traditional cardiovascular risk factors, for example, in the analysis of data from the MESA (Multi-Ethnic Study of Atherosclerosis) and DHS (Dallas Heart Study) longitudinal cohorts.
Notably, the risk when both Lp(a) and CAC scores were high far exceeded that associated with either marker alone. But when CAC scores were less than 100 Agatston units, predicted ASCVD risk wasn’t influenced by levels of Lp(a). Indeed, a CAC score of 0 predicted the lowest levels of ASCVD risk, even with elevated Lp(a).
That is, the findings suggest, the addition of Lp(a) makes a difference to the risk assessment only when CAC scores are high, at least 100 units, and elevated Lp(a) doesn’t mean increased ASCVD risk in the absence of coronary calcium.
“Our novel findings indicate that elevated Lp(a) drives ASCVD risk independent of the subclinical coronary atherosclerosis burden captured by CAC score,” concluded a report on the analysis, published in the Journal of the American College of Cardiology, with lead author Anurag Mehta, MD, Emory University, Atlanta.
There are no formal recommendations on how to interpret Lp(a) and CAC scores together, but the current findings “provide impetus for measuring Lp(a) in more individuals as part of the shared decision-making process,” the authors contended.
“Really, the calcium score carries the majority of the information in terms of risk, except in the highest CAC score group. That is, if you have a high Lp(a) and a high burden of calcium, your risk is significantly higher than if you just have the high calcium score and the normal Lp(a),” senior author Parag H. Joshi, MD, MHS, said in an interview.
“We thought we would see that the group with higher Lp(a) would have more events over 10 years, even among those who didn’t have coronary calcium,” said Dr. Joshi, of the University of Texas Southwestern Medical Center, Dallas. “But we really don’t see that, at least in a statistically significant way.”
A CAC score of 0 would at least support a more conservative approach in a patient with elevated Lp(a) “who is hesitant to be on a statin or to be more aggressive managing their risk,” Dr. Joshi said.
“This study should be very reassuring for a patient like that,” Ron Blankstein, MD, director of cardiac computed tomography at Brigham and Women’s Hospital, Boston, said in an interview.
“If you have a high Lp(a) and you’re concerned, I think this study really supports the role of calcium scoring for further risk assessment,” said Dr. Blankstein, who is not associated with the new report. “We often check Lp(a) in individuals who perhaps have a family history or who come to see us in a preventive cardiology clinic. If it is high and there is concern, a calcium score can be very helpful. If it’s zero, that really means a very low risk of events. And if it’s elevated, I think we’re going to be more concerned about that patient.”
The current analysis suggests “that, when a patient without clinical cardiovascular disease is identified with either CAC ≥100 or Lp(a) >50 mg/dL, the next step in the risk evaluation should be to measure either Lp(a) or CAC, respectively – if not already performed – to identify the patients at highest risk,” Sotirios Tsimikas, MD, director of vascular medicine at University of California, San Diego, wrote in an accompanying editorial.
“Both Lp(a) and CAC should be more broadly applied in clinical care settings in patients without prior ASCVD to identify those that most likely will benefit from more aggressive therapy and, in the future, from Lp(a)-lowering therapies,” he wrote.
The analyses were conducted separately on data from 4,512 initially asymptomatic patients in MESA and 2,078 from the DHS cohort, who were followed for ASCVD events an average of 13 years and 11 years, respectively. Such events included coronary heart disease–related death, nonfatal MI, and fatal or nonfatal stroke.
In the MESA cohort – 52% women, 36.8% White, 29.3% Black, 22.2% Hispanic, and 11.7% Chinese – elevated Lp(a) (quintile 5 vs. quintiles 1-4) and CAC scores of 1-99 and above 100 (both compared with 0) were each independently associated with increased risk for ASCVD events. The hazard ratio was 1.29 (P = .02) for elevated Lp(a), 1.68 (P < .01) for a CAC score of 1-99, and 2.66 (P < .01) for a CAC score of at least 100.
The corresponding HRs in the DHS cohort were 1.54 (P = .07) for Lp(a), 3.32 (P < .01) for a CAC score of 1-99, and 5.21 (P < .01) for a CAC score of at least 100.
Of note, the authors wrote, ASCVD risk among MESA participants with a CAC score of 0 was not significantly different in those with normal and elevated Lp(a).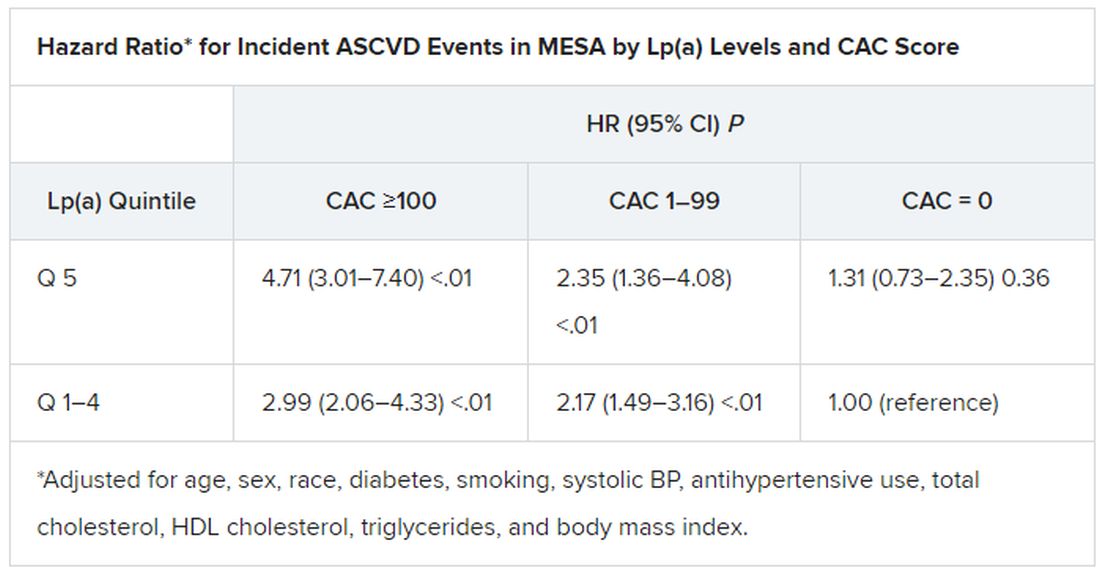
The findings were similar in the corresponding DHS analysis, the authors noted.
When both Lp(a) and CAC scores are considered as dichotomous variables, the highest 10-year ASCVD incidence in MESA was in participants with both elevated Lp(a) (≥50 mg/dL) and a high CAC score (≥100). The lowest risk was seen when Lp(a) was normal (<50 mg/dL) and the CAC score was no more than moderately high (<100).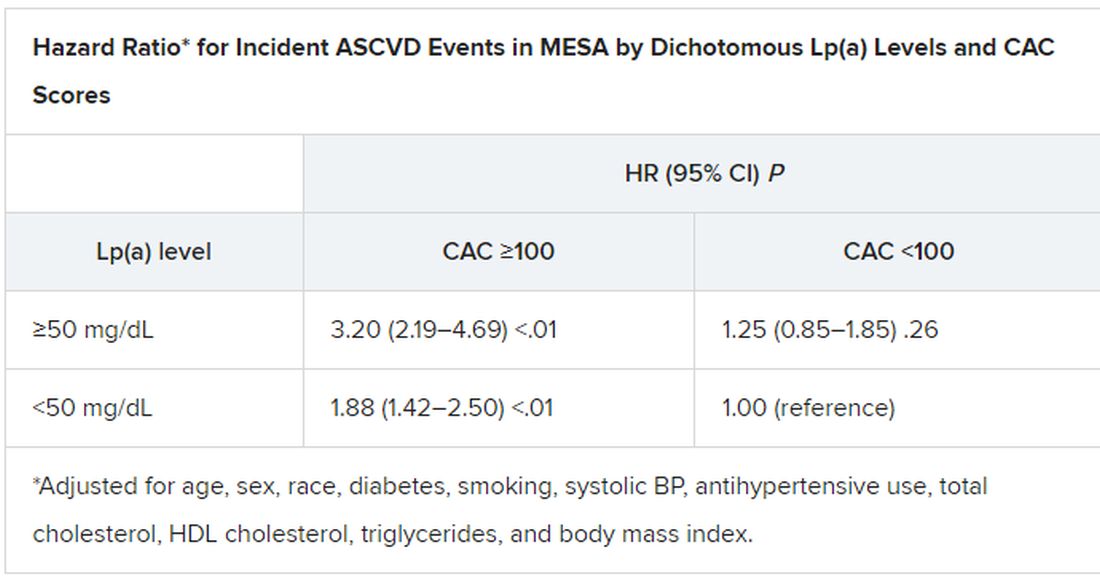
The results in the corresponding DHS analysis, according to the report, again mirrored those from MESA.
“This study has important implications for our patients and also potentially for future clinical trial design,” Dr. Blankstein noted. “A big part of developing a trial in this space is identifying the patients who are at higher risk,” and the current analysis supports CAC scores for identifying the highest-risk patient among those with elevated Lp(a).
Current wisdom is that, for the most part, Lp(a) levels are genetically mediated and are mostly unaffected by interventions such as diet management or exercise. It’s unknown whether reducing elevated Lp(a) levels pharmacologically will cut ASCVD risk, but there are a number of clinical trial programs currently aimed at learning just that. They include the Novartis-sponsored phase 3 HORIZON trial of the antisense agent pelacarsen (TQJ230), with an estimated enrollment of almost 7,700; a randomized, controlled dose-finding study of the small interfering RNA agent olpasiran (AMG890), with 290 patients and funded by Amgen; and an 88-patient phase 1 study of another siRNA agent, SLN360, supported by Silence Therapeutics.
Dr. Mehta reported no relevant relationships. Dr. Joshi has received grant support from Novo Nordisk and consulting income from Bayer and Regeneron; holds equity in G3 Therapeutics; and has served as site investigator for GlaxoSmithKline, Sanofi, AstraZeneca, and Novartis. Dr. Blankstein reported serving as a consultant to Amgen, Novartis, and Silence Therapeutics.
A version of this article first appeared on Medscape.com.
A look back at a pair of large cohort studies suggests a telling relation between two distinct predictors of atherosclerotic cardiovascular disease (ASCVD) risk and may offer guidance on how to interpret them together.
Elevated levels of lipoprotein(a), or Lp(a), and high coronary artery calcium (CAC) scores were both predictive of ASCVD risk over 10 years, but independent of each other and a host of more traditional cardiovascular risk factors, for example, in the analysis of data from the MESA (Multi-Ethnic Study of Atherosclerosis) and DHS (Dallas Heart Study) longitudinal cohorts.
Notably, the risk when both Lp(a) and CAC scores were high far exceeded that associated with either marker alone. But when CAC scores were less than 100 Agatston units, predicted ASCVD risk wasn’t influenced by levels of Lp(a). Indeed, a CAC score of 0 predicted the lowest levels of ASCVD risk, even with elevated Lp(a).
That is, the findings suggest, the addition of Lp(a) makes a difference to the risk assessment only when CAC scores are high, at least 100 units, and elevated Lp(a) doesn’t mean increased ASCVD risk in the absence of coronary calcium.
“Our novel findings indicate that elevated Lp(a) drives ASCVD risk independent of the subclinical coronary atherosclerosis burden captured by CAC score,” concluded a report on the analysis, published in the Journal of the American College of Cardiology, with lead author Anurag Mehta, MD, Emory University, Atlanta.
There are no formal recommendations on how to interpret Lp(a) and CAC scores together, but the current findings “provide impetus for measuring Lp(a) in more individuals as part of the shared decision-making process,” the authors contended.
“Really, the calcium score carries the majority of the information in terms of risk, except in the highest CAC score group. That is, if you have a high Lp(a) and a high burden of calcium, your risk is significantly higher than if you just have the high calcium score and the normal Lp(a),” senior author Parag H. Joshi, MD, MHS, said in an interview.
“We thought we would see that the group with higher Lp(a) would have more events over 10 years, even among those who didn’t have coronary calcium,” said Dr. Joshi, of the University of Texas Southwestern Medical Center, Dallas. “But we really don’t see that, at least in a statistically significant way.”
A CAC score of 0 would at least support a more conservative approach in a patient with elevated Lp(a) “who is hesitant to be on a statin or to be more aggressive managing their risk,” Dr. Joshi said.
“This study should be very reassuring for a patient like that,” Ron Blankstein, MD, director of cardiac computed tomography at Brigham and Women’s Hospital, Boston, said in an interview.
“If you have a high Lp(a) and you’re concerned, I think this study really supports the role of calcium scoring for further risk assessment,” said Dr. Blankstein, who is not associated with the new report. “We often check Lp(a) in individuals who perhaps have a family history or who come to see us in a preventive cardiology clinic. If it is high and there is concern, a calcium score can be very helpful. If it’s zero, that really means a very low risk of events. And if it’s elevated, I think we’re going to be more concerned about that patient.”
The current analysis suggests “that, when a patient without clinical cardiovascular disease is identified with either CAC ≥100 or Lp(a) >50 mg/dL, the next step in the risk evaluation should be to measure either Lp(a) or CAC, respectively – if not already performed – to identify the patients at highest risk,” Sotirios Tsimikas, MD, director of vascular medicine at University of California, San Diego, wrote in an accompanying editorial.
“Both Lp(a) and CAC should be more broadly applied in clinical care settings in patients without prior ASCVD to identify those that most likely will benefit from more aggressive therapy and, in the future, from Lp(a)-lowering therapies,” he wrote.
The analyses were conducted separately on data from 4,512 initially asymptomatic patients in MESA and 2,078 from the DHS cohort, who were followed for ASCVD events an average of 13 years and 11 years, respectively. Such events included coronary heart disease–related death, nonfatal MI, and fatal or nonfatal stroke.
In the MESA cohort – 52% women, 36.8% White, 29.3% Black, 22.2% Hispanic, and 11.7% Chinese – elevated Lp(a) (quintile 5 vs. quintiles 1-4) and CAC scores of 1-99 and above 100 (both compared with 0) were each independently associated with increased risk for ASCVD events. The hazard ratio was 1.29 (P = .02) for elevated Lp(a), 1.68 (P < .01) for a CAC score of 1-99, and 2.66 (P < .01) for a CAC score of at least 100.
The corresponding HRs in the DHS cohort were 1.54 (P = .07) for Lp(a), 3.32 (P < .01) for a CAC score of 1-99, and 5.21 (P < .01) for a CAC score of at least 100.
Of note, the authors wrote, ASCVD risk among MESA participants with a CAC score of 0 was not significantly different in those with normal and elevated Lp(a).
The findings were similar in the corresponding DHS analysis, the authors noted.
When both Lp(a) and CAC scores are considered as dichotomous variables, the highest 10-year ASCVD incidence in MESA was in participants with both elevated Lp(a) (≥50 mg/dL) and a high CAC score (≥100). The lowest risk was seen when Lp(a) was normal (<50 mg/dL) and the CAC score was no more than moderately high (<100).
The results in the corresponding DHS analysis, according to the report, again mirrored those from MESA.
“This study has important implications for our patients and also potentially for future clinical trial design,” Dr. Blankstein noted. “A big part of developing a trial in this space is identifying the patients who are at higher risk,” and the current analysis supports CAC scores for identifying the highest-risk patient among those with elevated Lp(a).
Current wisdom is that, for the most part, Lp(a) levels are genetically mediated and are mostly unaffected by interventions such as diet management or exercise. It’s unknown whether reducing elevated Lp(a) levels pharmacologically will cut ASCVD risk, but there are a number of clinical trial programs currently aimed at learning just that. They include the Novartis-sponsored phase 3 HORIZON trial of the antisense agent pelacarsen (TQJ230), with an estimated enrollment of almost 7,700; a randomized, controlled dose-finding study of the small interfering RNA agent olpasiran (AMG890), with 290 patients and funded by Amgen; and an 88-patient phase 1 study of another siRNA agent, SLN360, supported by Silence Therapeutics.
Dr. Mehta reported no relevant relationships. Dr. Joshi has received grant support from Novo Nordisk and consulting income from Bayer and Regeneron; holds equity in G3 Therapeutics; and has served as site investigator for GlaxoSmithKline, Sanofi, AstraZeneca, and Novartis. Dr. Blankstein reported serving as a consultant to Amgen, Novartis, and Silence Therapeutics.
A version of this article first appeared on Medscape.com.
A look back at a pair of large cohort studies suggests a telling relation between two distinct predictors of atherosclerotic cardiovascular disease (ASCVD) risk and may offer guidance on how to interpret them together.
Elevated levels of lipoprotein(a), or Lp(a), and high coronary artery calcium (CAC) scores were both predictive of ASCVD risk over 10 years, but independent of each other and a host of more traditional cardiovascular risk factors, for example, in the analysis of data from the MESA (Multi-Ethnic Study of Atherosclerosis) and DHS (Dallas Heart Study) longitudinal cohorts.
Notably, the risk when both Lp(a) and CAC scores were high far exceeded that associated with either marker alone. But when CAC scores were less than 100 Agatston units, predicted ASCVD risk wasn’t influenced by levels of Lp(a). Indeed, a CAC score of 0 predicted the lowest levels of ASCVD risk, even with elevated Lp(a).
That is, the findings suggest, the addition of Lp(a) makes a difference to the risk assessment only when CAC scores are high, at least 100 units, and elevated Lp(a) doesn’t mean increased ASCVD risk in the absence of coronary calcium.
“Our novel findings indicate that elevated Lp(a) drives ASCVD risk independent of the subclinical coronary atherosclerosis burden captured by CAC score,” concluded a report on the analysis, published in the Journal of the American College of Cardiology, with lead author Anurag Mehta, MD, Emory University, Atlanta.
There are no formal recommendations on how to interpret Lp(a) and CAC scores together, but the current findings “provide impetus for measuring Lp(a) in more individuals as part of the shared decision-making process,” the authors contended.
“Really, the calcium score carries the majority of the information in terms of risk, except in the highest CAC score group. That is, if you have a high Lp(a) and a high burden of calcium, your risk is significantly higher than if you just have the high calcium score and the normal Lp(a),” senior author Parag H. Joshi, MD, MHS, said in an interview.
“We thought we would see that the group with higher Lp(a) would have more events over 10 years, even among those who didn’t have coronary calcium,” said Dr. Joshi, of the University of Texas Southwestern Medical Center, Dallas. “But we really don’t see that, at least in a statistically significant way.”
A CAC score of 0 would at least support a more conservative approach in a patient with elevated Lp(a) “who is hesitant to be on a statin or to be more aggressive managing their risk,” Dr. Joshi said.
“This study should be very reassuring for a patient like that,” Ron Blankstein, MD, director of cardiac computed tomography at Brigham and Women’s Hospital, Boston, said in an interview.
“If you have a high Lp(a) and you’re concerned, I think this study really supports the role of calcium scoring for further risk assessment,” said Dr. Blankstein, who is not associated with the new report. “We often check Lp(a) in individuals who perhaps have a family history or who come to see us in a preventive cardiology clinic. If it is high and there is concern, a calcium score can be very helpful. If it’s zero, that really means a very low risk of events. And if it’s elevated, I think we’re going to be more concerned about that patient.”
The current analysis suggests “that, when a patient without clinical cardiovascular disease is identified with either CAC ≥100 or Lp(a) >50 mg/dL, the next step in the risk evaluation should be to measure either Lp(a) or CAC, respectively – if not already performed – to identify the patients at highest risk,” Sotirios Tsimikas, MD, director of vascular medicine at University of California, San Diego, wrote in an accompanying editorial.
“Both Lp(a) and CAC should be more broadly applied in clinical care settings in patients without prior ASCVD to identify those that most likely will benefit from more aggressive therapy and, in the future, from Lp(a)-lowering therapies,” he wrote.
The analyses were conducted separately on data from 4,512 initially asymptomatic patients in MESA and 2,078 from the DHS cohort, who were followed for ASCVD events an average of 13 years and 11 years, respectively. Such events included coronary heart disease–related death, nonfatal MI, and fatal or nonfatal stroke.
In the MESA cohort – 52% women, 36.8% White, 29.3% Black, 22.2% Hispanic, and 11.7% Chinese – elevated Lp(a) (quintile 5 vs. quintiles 1-4) and CAC scores of 1-99 and above 100 (both compared with 0) were each independently associated with increased risk for ASCVD events. The hazard ratio was 1.29 (P = .02) for elevated Lp(a), 1.68 (P < .01) for a CAC score of 1-99, and 2.66 (P < .01) for a CAC score of at least 100.
The corresponding HRs in the DHS cohort were 1.54 (P = .07) for Lp(a), 3.32 (P < .01) for a CAC score of 1-99, and 5.21 (P < .01) for a CAC score of at least 100.
Of note, the authors wrote, ASCVD risk among MESA participants with a CAC score of 0 was not significantly different in those with normal and elevated Lp(a).
The findings were similar in the corresponding DHS analysis, the authors noted.
When both Lp(a) and CAC scores are considered as dichotomous variables, the highest 10-year ASCVD incidence in MESA was in participants with both elevated Lp(a) (≥50 mg/dL) and a high CAC score (≥100). The lowest risk was seen when Lp(a) was normal (<50 mg/dL) and the CAC score was no more than moderately high (<100).
The results in the corresponding DHS analysis, according to the report, again mirrored those from MESA.
“This study has important implications for our patients and also potentially for future clinical trial design,” Dr. Blankstein noted. “A big part of developing a trial in this space is identifying the patients who are at higher risk,” and the current analysis supports CAC scores for identifying the highest-risk patient among those with elevated Lp(a).
Current wisdom is that, for the most part, Lp(a) levels are genetically mediated and are mostly unaffected by interventions such as diet management or exercise. It’s unknown whether reducing elevated Lp(a) levels pharmacologically will cut ASCVD risk, but there are a number of clinical trial programs currently aimed at learning just that. They include the Novartis-sponsored phase 3 HORIZON trial of the antisense agent pelacarsen (TQJ230), with an estimated enrollment of almost 7,700; a randomized, controlled dose-finding study of the small interfering RNA agent olpasiran (AMG890), with 290 patients and funded by Amgen; and an 88-patient phase 1 study of another siRNA agent, SLN360, supported by Silence Therapeutics.
Dr. Mehta reported no relevant relationships. Dr. Joshi has received grant support from Novo Nordisk and consulting income from Bayer and Regeneron; holds equity in G3 Therapeutics; and has served as site investigator for GlaxoSmithKline, Sanofi, AstraZeneca, and Novartis. Dr. Blankstein reported serving as a consultant to Amgen, Novartis, and Silence Therapeutics.
A version of this article first appeared on Medscape.com.
FROM THE JOURNAL OF THE AMERICAN COLLEGE OF CARDIOLOGY
Phthalate exposure via maternal and cord blood affects infant outcomes
Exposure to phthalates through maternal blood and cord blood affected outcomes including head circumference and anogenital index for male and female infants, according to data from 65 mother-infant pairs.
Phthalates are recognized endocrine disruptors that have been associated with adverse birth outcomes, but the specific relationship between maternal phthalate exposure and birth outcomes has not been well studied, wrote Hsiao-Lin Hwa, MD, of National Taiwan University, Taipei, and colleagues.
Previous research suggests that trace exposure to hazardous chemicals during the fetal period “may cause fetal metabolic dysfunction and adversely change the morphology of body systems,” they said. In 2011, “the Taiwan Food and Drug Administration found that di‐2‐ethylhexyl phthalate (DEHP) and DiNP [di‐isononyl phthalate] had been illegally added as emulsifiers to replace palm oil in beverages and food,” they added. The researchers sought to examine the association between infant birth outcomes and phthalate exposure levels in the Taiwanese population after 2011. In a study published in Environmental Toxicology and Chemistry, the researchers recruited 65 pregnant women in Taiwan between 2016 and 2017. Birth length, birth weight, head circumference, anogenital distance (AGD), anoscrotal distance (ASD), and anofourchette distance (AFD) were measured for each newborn at the time of delivery. The average age of the women was 33.6 years, and the rate of low birth weight was 13.7%. The mean measures of birth length, birth weight, head circumference, and chest circumference were 47.6 cm, 3022 g, 32.9 cm, and 30.8 mm, respectively. The mean AFD and ASD were 14.2 mm and 22.3 mm, respectively.
The researchers tested for 12 phthalates in maternal blood and cord blood samples. Of these, the six most frequently detected phthalate metabolites were mono‐ethyl phthalate (MEP), mono‐isobutyl phthalate (MiBP), mono‐n‐butyl phthalate (MnBP), mono‐(2‐ethyl‐5‐oxohexyl)‐phthalate (MEOHP), mono‐(2‐ethyl‐5‐hydroxyhexyl) phthalate (MEHHP), and mono‐n‐octyl phthalate (MOP); these six were present in 80%–100% of the maternal blood samples.
Overall, the mean levels of MEP, MiBP, MnBP, and MEHP were relatively higher in both maternal and infant blood than other phthalates, the researchers noted. The mean concentrations of metabolites in maternal blood and infant cord blood were 0.03-2.27 ng/mL and 0.01-3.74 ng/mL, respectively.
Among male infants, levels of MMP, MiBP, and MEHP in maternal blood were inversely related to anogenital index (AGI), with P values for regression coefficients ranging from .011 to .033. In addition, the total concentration of MEHP, MEOHP, and MEHHP (designated as Σdi‐2‐ethylhexyl phthalate, ΣDEHP) was inversely related to AGI in males.
Among female infants, however, phthalates in cord blood, rather than maternal blood, were positively related to AGI, including MMP, MibP, MnBP, and MOP, with P values for regression coefficients ranging from .001 to .034.
Cord blood levels of MnBP, MEOHP, MEHP, and ΣDEHP were inversely associated with gestational age-adjusted head circumference in all infants, with beta coefficients of –0.15, –0.12, –0.01, and –0.01, respectively (P < .05 for all).
“The detection rates of MEHHP, MEOHP, and MEHP in the cord blood were lower than those in the maternal blood, particularly those of MEHHP and MEOHP, which were approximately 25% lower,” which may be caused by slow placental transfer, the researchers wrote in their discussion section. “The high detection rate of phthalate metabolites indicated that our subjects may continue to be exposed to these phthalates even after the 2011 Taiwan DEHP incident,” they noted.
The study findings were limited by several factors including the possibility for contamination of samples and other environmental confounders, the researchers noted. However, the results support the role of phthalates as endocrine disruptors, and the distinction in effects between males and females “may suggest that phthalate monoesters are potentially estrogenic and antiandrogenic chemicals,” they added.
“Further investigations involving multiple phthalate analyses during pregnancy and measurements throughout childhood are necessary to confirm our findings,” they concluded.
Direct clinical implications remain uncertain
“Phthalates are a group of chemicals that are used to make plastic more durable; they are found in multiple everyday materials, food products, and common household products,” Marissa Platner, MD, of Emory University, Atlanta, said in an interview. “It is known that we are exposed to phthalates on a routine basis but the long-term effects of this exposure are unclear,” she said.

The current study findings “were not entirely surprising given data from prior animal studies because they do imply that there is some placental transfer of the phthalate metabolites that can cause adverse effects on the developing fetus,” said Dr. Platner. “However, they also demonstrate that the placenta acts as a filter for certain larger molecules to protect the fetus,” she said.
“This study was based on a small sample size, therefore the clinical implications are not clear,” Dr. Platner noted. “However it may be worthwhile after further research to encourage our pregnant patients to try to decrease their exposure to phthalates,” she said.
Dr. Platner identified two areas for additional research to explore the role of phthalate exposure.
“The first would be to assess the level of maternal phthalate exposure throughout the pregnancy instead of just at one point in time, and the second would be to assess how the reproductive system differences at birth translate to long-term outcomes in children, such as early puberty in females or decreased fertility in males,” she said.
The study was funded by the Ministry of Science and Technology of Taiwan and the Far Eastern Memorial Hospital‐National Taiwan University Hospital. The researchers and Dr. Platner had no financial conflicts to disclose.
Exposure to phthalates through maternal blood and cord blood affected outcomes including head circumference and anogenital index for male and female infants, according to data from 65 mother-infant pairs.
Phthalates are recognized endocrine disruptors that have been associated with adverse birth outcomes, but the specific relationship between maternal phthalate exposure and birth outcomes has not been well studied, wrote Hsiao-Lin Hwa, MD, of National Taiwan University, Taipei, and colleagues.
Previous research suggests that trace exposure to hazardous chemicals during the fetal period “may cause fetal metabolic dysfunction and adversely change the morphology of body systems,” they said. In 2011, “the Taiwan Food and Drug Administration found that di‐2‐ethylhexyl phthalate (DEHP) and DiNP [di‐isononyl phthalate] had been illegally added as emulsifiers to replace palm oil in beverages and food,” they added. The researchers sought to examine the association between infant birth outcomes and phthalate exposure levels in the Taiwanese population after 2011. In a study published in Environmental Toxicology and Chemistry, the researchers recruited 65 pregnant women in Taiwan between 2016 and 2017. Birth length, birth weight, head circumference, anogenital distance (AGD), anoscrotal distance (ASD), and anofourchette distance (AFD) were measured for each newborn at the time of delivery. The average age of the women was 33.6 years, and the rate of low birth weight was 13.7%. The mean measures of birth length, birth weight, head circumference, and chest circumference were 47.6 cm, 3022 g, 32.9 cm, and 30.8 mm, respectively. The mean AFD and ASD were 14.2 mm and 22.3 mm, respectively.
The researchers tested for 12 phthalates in maternal blood and cord blood samples. Of these, the six most frequently detected phthalate metabolites were mono‐ethyl phthalate (MEP), mono‐isobutyl phthalate (MiBP), mono‐n‐butyl phthalate (MnBP), mono‐(2‐ethyl‐5‐oxohexyl)‐phthalate (MEOHP), mono‐(2‐ethyl‐5‐hydroxyhexyl) phthalate (MEHHP), and mono‐n‐octyl phthalate (MOP); these six were present in 80%–100% of the maternal blood samples.
Overall, the mean levels of MEP, MiBP, MnBP, and MEHP were relatively higher in both maternal and infant blood than other phthalates, the researchers noted. The mean concentrations of metabolites in maternal blood and infant cord blood were 0.03-2.27 ng/mL and 0.01-3.74 ng/mL, respectively.
Among male infants, levels of MMP, MiBP, and MEHP in maternal blood were inversely related to anogenital index (AGI), with P values for regression coefficients ranging from .011 to .033. In addition, the total concentration of MEHP, MEOHP, and MEHHP (designated as Σdi‐2‐ethylhexyl phthalate, ΣDEHP) was inversely related to AGI in males.
Among female infants, however, phthalates in cord blood, rather than maternal blood, were positively related to AGI, including MMP, MibP, MnBP, and MOP, with P values for regression coefficients ranging from .001 to .034.
Cord blood levels of MnBP, MEOHP, MEHP, and ΣDEHP were inversely associated with gestational age-adjusted head circumference in all infants, with beta coefficients of –0.15, –0.12, –0.01, and –0.01, respectively (P < .05 for all).
“The detection rates of MEHHP, MEOHP, and MEHP in the cord blood were lower than those in the maternal blood, particularly those of MEHHP and MEOHP, which were approximately 25% lower,” which may be caused by slow placental transfer, the researchers wrote in their discussion section. “The high detection rate of phthalate metabolites indicated that our subjects may continue to be exposed to these phthalates even after the 2011 Taiwan DEHP incident,” they noted.
The study findings were limited by several factors including the possibility for contamination of samples and other environmental confounders, the researchers noted. However, the results support the role of phthalates as endocrine disruptors, and the distinction in effects between males and females “may suggest that phthalate monoesters are potentially estrogenic and antiandrogenic chemicals,” they added.
“Further investigations involving multiple phthalate analyses during pregnancy and measurements throughout childhood are necessary to confirm our findings,” they concluded.
Direct clinical implications remain uncertain
“Phthalates are a group of chemicals that are used to make plastic more durable; they are found in multiple everyday materials, food products, and common household products,” Marissa Platner, MD, of Emory University, Atlanta, said in an interview. “It is known that we are exposed to phthalates on a routine basis but the long-term effects of this exposure are unclear,” she said.
The current study findings “were not entirely surprising given data from prior animal studies because they do imply that there is some placental transfer of the phthalate metabolites that can cause adverse effects on the developing fetus,” said Dr. Platner. “However, they also demonstrate that the placenta acts as a filter for certain larger molecules to protect the fetus,” she said.
“This study was based on a small sample size, therefore the clinical implications are not clear,” Dr. Platner noted. “However it may be worthwhile after further research to encourage our pregnant patients to try to decrease their exposure to phthalates,” she said.
Dr. Platner identified two areas for additional research to explore the role of phthalate exposure.
“The first would be to assess the level of maternal phthalate exposure throughout the pregnancy instead of just at one point in time, and the second would be to assess how the reproductive system differences at birth translate to long-term outcomes in children, such as early puberty in females or decreased fertility in males,” she said.
The study was funded by the Ministry of Science and Technology of Taiwan and the Far Eastern Memorial Hospital‐National Taiwan University Hospital. The researchers and Dr. Platner had no financial conflicts to disclose.
Exposure to phthalates through maternal blood and cord blood affected outcomes including head circumference and anogenital index for male and female infants, according to data from 65 mother-infant pairs.
Phthalates are recognized endocrine disruptors that have been associated with adverse birth outcomes, but the specific relationship between maternal phthalate exposure and birth outcomes has not been well studied, wrote Hsiao-Lin Hwa, MD, of National Taiwan University, Taipei, and colleagues.
Previous research suggests that trace exposure to hazardous chemicals during the fetal period “may cause fetal metabolic dysfunction and adversely change the morphology of body systems,” they said. In 2011, “the Taiwan Food and Drug Administration found that di‐2‐ethylhexyl phthalate (DEHP) and DiNP [di‐isononyl phthalate] had been illegally added as emulsifiers to replace palm oil in beverages and food,” they added. The researchers sought to examine the association between infant birth outcomes and phthalate exposure levels in the Taiwanese population after 2011. In a study published in Environmental Toxicology and Chemistry, the researchers recruited 65 pregnant women in Taiwan between 2016 and 2017. Birth length, birth weight, head circumference, anogenital distance (AGD), anoscrotal distance (ASD), and anofourchette distance (AFD) were measured for each newborn at the time of delivery. The average age of the women was 33.6 years, and the rate of low birth weight was 13.7%. The mean measures of birth length, birth weight, head circumference, and chest circumference were 47.6 cm, 3022 g, 32.9 cm, and 30.8 mm, respectively. The mean AFD and ASD were 14.2 mm and 22.3 mm, respectively.
The researchers tested for 12 phthalates in maternal blood and cord blood samples. Of these, the six most frequently detected phthalate metabolites were mono‐ethyl phthalate (MEP), mono‐isobutyl phthalate (MiBP), mono‐n‐butyl phthalate (MnBP), mono‐(2‐ethyl‐5‐oxohexyl)‐phthalate (MEOHP), mono‐(2‐ethyl‐5‐hydroxyhexyl) phthalate (MEHHP), and mono‐n‐octyl phthalate (MOP); these six were present in 80%–100% of the maternal blood samples.
Overall, the mean levels of MEP, MiBP, MnBP, and MEHP were relatively higher in both maternal and infant blood than other phthalates, the researchers noted. The mean concentrations of metabolites in maternal blood and infant cord blood were 0.03-2.27 ng/mL and 0.01-3.74 ng/mL, respectively.
Among male infants, levels of MMP, MiBP, and MEHP in maternal blood were inversely related to anogenital index (AGI), with P values for regression coefficients ranging from .011 to .033. In addition, the total concentration of MEHP, MEOHP, and MEHHP (designated as Σdi‐2‐ethylhexyl phthalate, ΣDEHP) was inversely related to AGI in males.
Among female infants, however, phthalates in cord blood, rather than maternal blood, were positively related to AGI, including MMP, MibP, MnBP, and MOP, with P values for regression coefficients ranging from .001 to .034.
Cord blood levels of MnBP, MEOHP, MEHP, and ΣDEHP were inversely associated with gestational age-adjusted head circumference in all infants, with beta coefficients of –0.15, –0.12, –0.01, and –0.01, respectively (P < .05 for all).
“The detection rates of MEHHP, MEOHP, and MEHP in the cord blood were lower than those in the maternal blood, particularly those of MEHHP and MEOHP, which were approximately 25% lower,” which may be caused by slow placental transfer, the researchers wrote in their discussion section. “The high detection rate of phthalate metabolites indicated that our subjects may continue to be exposed to these phthalates even after the 2011 Taiwan DEHP incident,” they noted.
The study findings were limited by several factors including the possibility for contamination of samples and other environmental confounders, the researchers noted. However, the results support the role of phthalates as endocrine disruptors, and the distinction in effects between males and females “may suggest that phthalate monoesters are potentially estrogenic and antiandrogenic chemicals,” they added.
“Further investigations involving multiple phthalate analyses during pregnancy and measurements throughout childhood are necessary to confirm our findings,” they concluded.
Direct clinical implications remain uncertain
“Phthalates are a group of chemicals that are used to make plastic more durable; they are found in multiple everyday materials, food products, and common household products,” Marissa Platner, MD, of Emory University, Atlanta, said in an interview. “It is known that we are exposed to phthalates on a routine basis but the long-term effects of this exposure are unclear,” she said.
The current study findings “were not entirely surprising given data from prior animal studies because they do imply that there is some placental transfer of the phthalate metabolites that can cause adverse effects on the developing fetus,” said Dr. Platner. “However, they also demonstrate that the placenta acts as a filter for certain larger molecules to protect the fetus,” she said.
“This study was based on a small sample size, therefore the clinical implications are not clear,” Dr. Platner noted. “However it may be worthwhile after further research to encourage our pregnant patients to try to decrease their exposure to phthalates,” she said.
Dr. Platner identified two areas for additional research to explore the role of phthalate exposure.
“The first would be to assess the level of maternal phthalate exposure throughout the pregnancy instead of just at one point in time, and the second would be to assess how the reproductive system differences at birth translate to long-term outcomes in children, such as early puberty in females or decreased fertility in males,” she said.
The study was funded by the Ministry of Science and Technology of Taiwan and the Far Eastern Memorial Hospital‐National Taiwan University Hospital. The researchers and Dr. Platner had no financial conflicts to disclose.
FROM ENVIRONMENTAL TOXICOLOGY AND CHEMISTRY

Eating disorder may be common in celiac disease
A new study examining avoidant/restrictive food intake disorder (ARFID) among patients with celiac disease found that the condition is common but is not associated with any difference in disease control. The findings suggest that some with celiac disease may pursue dietary control too far, but experts warn that ARFID is only recently being recognized in patients with GI diseases, the definition is in flux, and it’s important to not overpathologize patient behavior.
The new study, published in Gastro Hep Advances, comes in the wake of a 2021 cross-sectional study, which found that 53.7% of celiac disease patients met the criteria for ARFID based on the Nine-Item ARFID Screen, and were more likely to have anxiety, depression, and reduced food-related quality of life.
“I think both studies are hypothesizing that there might be greater fear around eating in these patients with celiac, but that the possible outcomes related to their disease may not actually be different,” said Helen Burton Murray, PhD, director of the GI behavioral health program and staff psychologist at Massachusetts General Hospital, Boston, who was asked to comment on the study.
She also noted that ARFID may represent a subgroup of celiac patients with more severe disease or worse quality of life, though the two studies can’t definitively prove that. The surveys used are intended for screening rather than diagnosis and have not yet been validated in patients with a gastrointestinal disease like celiac.
Although the symptoms of ARFID have been recognized for many years, it only became an official diagnosis with its inclusion in DSM-5 in 2013. Physicians are becoming increasingly aware of this potential comorbidity, but it can be difficult to diagnose or understand the impact of an eating disorder in a condition like celiac disease, where intense dietary management is the key to controlling it. “There’s concern about overpathologizing patients where dietary management can be a normative strategy, and overpathologizing by diagnosing ARFID. Is diagnosing ARFID going to change the patient’s treatment course and improve outcomes for them?” asked Dr. Burton Murray.
In some cases, the answer may be yes. Patients may be so restrictive in their eating that it impacts physical health or lifestyle. “Hypervigilance or worry around eating could extend to even non–gluten based foods. That may be a marker of where a patient’s eating behaviors are crossing the line into ARFID, if their diet is so limited when it doesn’t need to be, and those limitations might be harming them nutritionally, leading to weight loss or making it difficult to live their life in the way that they would like to,” said Dr. Burton Murray.
Still, the results of these studies shouldn’t be overinterpreted, according to Anne R. Lee, EdD, RDN, LD, associate professor of nutritional medicine at the celiac disease center at Columbia University, New York. “In the world of eating disorders, ARFID is the newest kid on the block, and one that’s in transition,” she said. What differentiates ARFID from other eating disorders is that food behavior is related to things like appetite or picky eating, but not body shape and size. Therefore, it helps to combine the ARFID screen with other eating disorder screening tools, Dr. Lee said.
“We need to differentiate between diagnosing someone with a disordered eating pattern versus helping them navigate their life within a gluten-free diet. We need to help them with developing strategies to maneuver through work lunches and social outings and all of those things so that we don’t overdiagnose,” said Dr. Lee.
In the new study, researchers retrospectively analyzed data from 137 patients with celiac disease at the Center for Human Nutrition at Vanderbilt University Medical Center; 107 were women, and the median age was 37 years. The researchers used questionnaires to evaluate diet, including the ARFID Symptom Checklist.
Seventy-eight participants (57%) had suspected ARFID; 30 had symptoms consistent with clinical ARFID and 48 consistent with subclinical ARFID. There were no differences between patients with and without ARFID with respect to anxiety and depression, length of illness, age, gender, body mass index, bone disease, or micronutrient or vitamin deficiency. Serology studies revealed only one difference: a higher frequency of tissue transglutaminase IgG antibody in the ARFID group (15% vs. 2%; P = .007).
There was a strong correlation between ARFID and the Impact of the Gluten Free Diet questionnaire (IGFDQ), with patients scoring higher on the social and food components more likely to also have ARFID. It was also the only predictor of ARFID in a multivariable analysis, with associations in the food (odds ratio, 1.64; P = .01), emotional (OR, 1.66; P = .05), and social (OR, 1.59; P = .01) sections.
The authors concluded that, although there were some study limitations, including possible patient misunderstanding of the survey questions and lack of knowledge of whether the patients had access to gluten-free foods, AFID is not only common, but it also has a significant impact on patients with celiac disease. The authors also noted that this assessment occurred over a 2-year period, with patients attending clinic only once a year. Follow-up surveys, duodenal biopsies, and bone density assessments could identify more differences over time.
Dr. Burton Murray and Dr. Lee have no relevant financial disclosures.
AGA offers guidance on celiac disease to help patients maintain a gluten free diet in the AGA GI Patient Center: www.gastro.org/celiac
A new study examining avoidant/restrictive food intake disorder (ARFID) among patients with celiac disease found that the condition is common but is not associated with any difference in disease control. The findings suggest that some with celiac disease may pursue dietary control too far, but experts warn that ARFID is only recently being recognized in patients with GI diseases, the definition is in flux, and it’s important to not overpathologize patient behavior.
The new study, published in Gastro Hep Advances, comes in the wake of a 2021 cross-sectional study, which found that 53.7% of celiac disease patients met the criteria for ARFID based on the Nine-Item ARFID Screen, and were more likely to have anxiety, depression, and reduced food-related quality of life.
“I think both studies are hypothesizing that there might be greater fear around eating in these patients with celiac, but that the possible outcomes related to their disease may not actually be different,” said Helen Burton Murray, PhD, director of the GI behavioral health program and staff psychologist at Massachusetts General Hospital, Boston, who was asked to comment on the study.
She also noted that ARFID may represent a subgroup of celiac patients with more severe disease or worse quality of life, though the two studies can’t definitively prove that. The surveys used are intended for screening rather than diagnosis and have not yet been validated in patients with a gastrointestinal disease like celiac.
Although the symptoms of ARFID have been recognized for many years, it only became an official diagnosis with its inclusion in DSM-5 in 2013. Physicians are becoming increasingly aware of this potential comorbidity, but it can be difficult to diagnose or understand the impact of an eating disorder in a condition like celiac disease, where intense dietary management is the key to controlling it. “There’s concern about overpathologizing patients where dietary management can be a normative strategy, and overpathologizing by diagnosing ARFID. Is diagnosing ARFID going to change the patient’s treatment course and improve outcomes for them?” asked Dr. Burton Murray.
In some cases, the answer may be yes. Patients may be so restrictive in their eating that it impacts physical health or lifestyle. “Hypervigilance or worry around eating could extend to even non–gluten based foods. That may be a marker of where a patient’s eating behaviors are crossing the line into ARFID, if their diet is so limited when it doesn’t need to be, and those limitations might be harming them nutritionally, leading to weight loss or making it difficult to live their life in the way that they would like to,” said Dr. Burton Murray.
Still, the results of these studies shouldn’t be overinterpreted, according to Anne R. Lee, EdD, RDN, LD, associate professor of nutritional medicine at the celiac disease center at Columbia University, New York. “In the world of eating disorders, ARFID is the newest kid on the block, and one that’s in transition,” she said. What differentiates ARFID from other eating disorders is that food behavior is related to things like appetite or picky eating, but not body shape and size. Therefore, it helps to combine the ARFID screen with other eating disorder screening tools, Dr. Lee said.
“We need to differentiate between diagnosing someone with a disordered eating pattern versus helping them navigate their life within a gluten-free diet. We need to help them with developing strategies to maneuver through work lunches and social outings and all of those things so that we don’t overdiagnose,” said Dr. Lee.
In the new study, researchers retrospectively analyzed data from 137 patients with celiac disease at the Center for Human Nutrition at Vanderbilt University Medical Center; 107 were women, and the median age was 37 years. The researchers used questionnaires to evaluate diet, including the ARFID Symptom Checklist.
Seventy-eight participants (57%) had suspected ARFID; 30 had symptoms consistent with clinical ARFID and 48 consistent with subclinical ARFID. There were no differences between patients with and without ARFID with respect to anxiety and depression, length of illness, age, gender, body mass index, bone disease, or micronutrient or vitamin deficiency. Serology studies revealed only one difference: a higher frequency of tissue transglutaminase IgG antibody in the ARFID group (15% vs. 2%; P = .007).
There was a strong correlation between ARFID and the Impact of the Gluten Free Diet questionnaire (IGFDQ), with patients scoring higher on the social and food components more likely to also have ARFID. It was also the only predictor of ARFID in a multivariable analysis, with associations in the food (odds ratio, 1.64; P = .01), emotional (OR, 1.66; P = .05), and social (OR, 1.59; P = .01) sections.
The authors concluded that, although there were some study limitations, including possible patient misunderstanding of the survey questions and lack of knowledge of whether the patients had access to gluten-free foods, AFID is not only common, but it also has a significant impact on patients with celiac disease. The authors also noted that this assessment occurred over a 2-year period, with patients attending clinic only once a year. Follow-up surveys, duodenal biopsies, and bone density assessments could identify more differences over time.
Dr. Burton Murray and Dr. Lee have no relevant financial disclosures.
AGA offers guidance on celiac disease to help patients maintain a gluten free diet in the AGA GI Patient Center: www.gastro.org/celiac
A new study examining avoidant/restrictive food intake disorder (ARFID) among patients with celiac disease found that the condition is common but is not associated with any difference in disease control. The findings suggest that some with celiac disease may pursue dietary control too far, but experts warn that ARFID is only recently being recognized in patients with GI diseases, the definition is in flux, and it’s important to not overpathologize patient behavior.
The new study, published in Gastro Hep Advances, comes in the wake of a 2021 cross-sectional study, which found that 53.7% of celiac disease patients met the criteria for ARFID based on the Nine-Item ARFID Screen, and were more likely to have anxiety, depression, and reduced food-related quality of life.
“I think both studies are hypothesizing that there might be greater fear around eating in these patients with celiac, but that the possible outcomes related to their disease may not actually be different,” said Helen Burton Murray, PhD, director of the GI behavioral health program and staff psychologist at Massachusetts General Hospital, Boston, who was asked to comment on the study.
She also noted that ARFID may represent a subgroup of celiac patients with more severe disease or worse quality of life, though the two studies can’t definitively prove that. The surveys used are intended for screening rather than diagnosis and have not yet been validated in patients with a gastrointestinal disease like celiac.
Although the symptoms of ARFID have been recognized for many years, it only became an official diagnosis with its inclusion in DSM-5 in 2013. Physicians are becoming increasingly aware of this potential comorbidity, but it can be difficult to diagnose or understand the impact of an eating disorder in a condition like celiac disease, where intense dietary management is the key to controlling it. “There’s concern about overpathologizing patients where dietary management can be a normative strategy, and overpathologizing by diagnosing ARFID. Is diagnosing ARFID going to change the patient’s treatment course and improve outcomes for them?” asked Dr. Burton Murray.
In some cases, the answer may be yes. Patients may be so restrictive in their eating that it impacts physical health or lifestyle. “Hypervigilance or worry around eating could extend to even non–gluten based foods. That may be a marker of where a patient’s eating behaviors are crossing the line into ARFID, if their diet is so limited when it doesn’t need to be, and those limitations might be harming them nutritionally, leading to weight loss or making it difficult to live their life in the way that they would like to,” said Dr. Burton Murray.
Still, the results of these studies shouldn’t be overinterpreted, according to Anne R. Lee, EdD, RDN, LD, associate professor of nutritional medicine at the celiac disease center at Columbia University, New York. “In the world of eating disorders, ARFID is the newest kid on the block, and one that’s in transition,” she said. What differentiates ARFID from other eating disorders is that food behavior is related to things like appetite or picky eating, but not body shape and size. Therefore, it helps to combine the ARFID screen with other eating disorder screening tools, Dr. Lee said.
“We need to differentiate between diagnosing someone with a disordered eating pattern versus helping them navigate their life within a gluten-free diet. We need to help them with developing strategies to maneuver through work lunches and social outings and all of those things so that we don’t overdiagnose,” said Dr. Lee.
In the new study, researchers retrospectively analyzed data from 137 patients with celiac disease at the Center for Human Nutrition at Vanderbilt University Medical Center; 107 were women, and the median age was 37 years. The researchers used questionnaires to evaluate diet, including the ARFID Symptom Checklist.
Seventy-eight participants (57%) had suspected ARFID; 30 had symptoms consistent with clinical ARFID and 48 consistent with subclinical ARFID. There were no differences between patients with and without ARFID with respect to anxiety and depression, length of illness, age, gender, body mass index, bone disease, or micronutrient or vitamin deficiency. Serology studies revealed only one difference: a higher frequency of tissue transglutaminase IgG antibody in the ARFID group (15% vs. 2%; P = .007).
There was a strong correlation between ARFID and the Impact of the Gluten Free Diet questionnaire (IGFDQ), with patients scoring higher on the social and food components more likely to also have ARFID. It was also the only predictor of ARFID in a multivariable analysis, with associations in the food (odds ratio, 1.64; P = .01), emotional (OR, 1.66; P = .05), and social (OR, 1.59; P = .01) sections.
The authors concluded that, although there were some study limitations, including possible patient misunderstanding of the survey questions and lack of knowledge of whether the patients had access to gluten-free foods, AFID is not only common, but it also has a significant impact on patients with celiac disease. The authors also noted that this assessment occurred over a 2-year period, with patients attending clinic only once a year. Follow-up surveys, duodenal biopsies, and bone density assessments could identify more differences over time.
Dr. Burton Murray and Dr. Lee have no relevant financial disclosures.
AGA offers guidance on celiac disease to help patients maintain a gluten free diet in the AGA GI Patient Center: www.gastro.org/celiac
FROM GASTRO HEP ADVANCES

AGA helps break down barriers to CRC screening
The new year has already marked major progress for colorectal cancer (CRC) screening with the implementation of the Removing Barriers to Colorectal Cancer Screening Act by the Centers for Medicare & Medicaid Services, which will protect Medicare beneficiaries from an unexpected bill if a polyp is detected and removed during a screening colonoscopy, as well as new guidance from the federal government requiring private insurers to cover colonoscopy as a follow-up to a noninvasive CRC screening test without imposing cost sharing for patients.
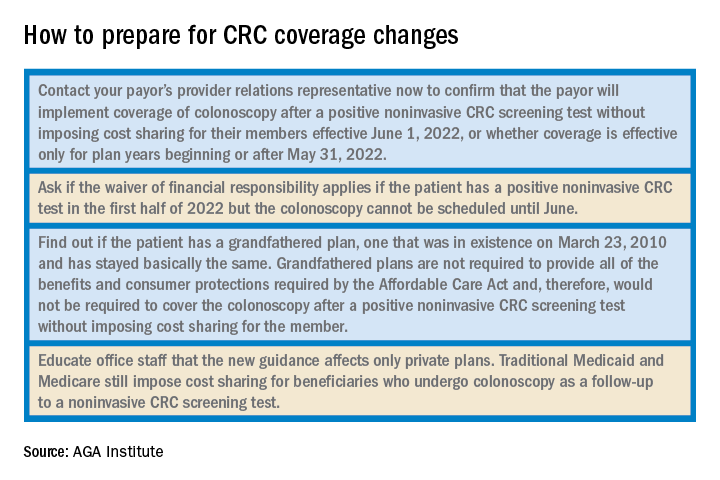
The American Gastroenterological Association is strongly committed to reducing the incidence of and mortality from colorectal cancer. There is strong evidence that CRC screening is effective, but only 65% of eligible individuals have been screened. A. Mark Fendrick, MD, and colleagues recently found that cost sharing for CRC screening occurred in 48.2% of patients with commercial insurance and 77.9% of patients with Medicare coverage. The elimination of these barriers to CRC screening should improve adherence and reduce the burden of CRC.

As one of AGA President John M. Inadomi’s initiatives, the AGA created the CRC Screening Continuum Executive Committee in 2021 to develop AGA Position Statements that highlight the continuum of CRC screening and identify barriers, as well as work with stakeholders to eliminate known barriers. Chaired by former AGA President, David Lieberman, MD, AGAF, and with public policy guidance from Kathleen Teixeira, AGA Vice President of Public Policy and Government Affairs at the AGA, the committee identified that, at that time, colonoscopies after positive stool tests had often been considered “diagnostic” and, therefore, were not covered in full the way a preventive screening is required to be covered by the Affordable Care Act (ACA). The committee recognized that copays and deductibles are barriers to CRC screening and contribute to health inequity and socio-economic disparities. Noninvasive screening should be considered a part of programs with multiple steps, all of which – including follow-up colonoscopy if the test is positive – should be covered by payers without cost sharing as part of the screening continuum. Further, screening with high-quality colonoscopy should be covered by payers without cost sharing, consistent with the aims of the ACA. The committee recommended that the full cost of screening, including the bowel prep, facility and professional fees, anesthesia, and pathology, should be covered by payers without cost sharing.

Over the past decade, the AGA and other organizations have spent countless hours advocating for closing the gap. In September 2021, Dr. Inadomi and Dr. Lieberman, along with the American Cancer Society Cancer Action Network and Fight CRC, met with Assistant Secretary of Labor, Ali Khawar, and representatives from the U.S. Department of Health & Human Services and U.S. Department of Treasury to request they direct private health plans to cover colonoscopy after a positive noninvasive CRC screening. In January 2022, guidance from the United States Department of Labor, HHS, and the USDT clarified that private insurance plans must cover follow-up colonoscopies after a positive noninvasive stool test. In the Frequently Asked Questions (FAQs) about the Affordable Care Act Implementation, Part 51, the departments affirmed that a plan or issuer must cover and may not impose cost sharing with respect to a colonoscopy conducted after a positive noninvasive stool-based screening test or direct visualization screening test for colorectal cancer for individuals described in a U.S. Preventive Services Task Force (USPSTF) recommendation from May 18, 2021. As stated in that USPSTF recommendation, the follow-up colonoscopy is an integral part of the preventive screening without which the screening would not be complete . The follow-up colonoscopy after a positive noninvasive stool-based screening test or direct visualization screening test is therefore required to be covered without cost sharing in accordance with the requirements of Public Health Service Act section 2713 and its implementing regulations.
Plans and issuers must provide coverage without cost sharing for plan or policy years beginning on or after May 31, 2022. While this new guidance will expand coverage of follow-up colonoscopies to many more individuals nationwide, including individuals who have coverage through Medicaid expansion, it does not apply to traditional Medicaid and Medicare plans.
The members of the CRC Screening Continuum Executive Committee includes Dr. Brill and Lieberman, as well as Uri Ladabaum, MD; Larry Kim, MD; Folasade May, MD, PhD, MPhil; Caitlin Murphy, MD; and Richard Wender, MD. Disclosures are on file with the AGA National Office.
Dr. Brill is chief medical officer, Predictive Health, Phoenix. Dr. Lieberman is professor of medicine, division of gastroenterology and hepatology, Oregon Health & Science University, Portland, as well as a past president of the AGA. Dr. Brill discloses consulting for Accomplish Health, Alimetry, Allara Health, AnX Robotica, Arch Therapeutics, Biotax, Boomerang Medical, Brightline, Calyx, Capsovision, Check Cap, Clexio, Curology, Docbot, Echosens, Endogastric Solutions, evoEndo, Family First, FDNA, Food Marble, Freespira, Gala Therapeutics, Glaukos, gTech Medical, Gynesonics, Hbox, Hello Heart, HyGIeaCare, Innovative Health Solutions, IronRod Health, Johnson & Johnson, Lantheus, LeMinou, Lumen, Mainstay Medical, MaternaMed, Medtronic, Mightier, Motus GI, OncoSil Medical, Palette Life Sciences, Perry Health, Perspectum, Red Ventures, Reflexion, Respira Labs, Salaso, Smith+Nephew, SonarMD, Stage Zero Life Sciences, Steris, Sword Health, Tabula Rosa Health Care, Ultrasight, Vertos Medical, WL Gore, and holds options/warrants in Accomplish Health, AnX Robotica, Capsovision, Donsini Health, Hbox, Hello Heart, HyGIeaCare, Restech, Perry Health, StageZero Life Sciences, SonarMD. Dr. Lieberman is a consultant to Geneoscopy.
The new year has already marked major progress for colorectal cancer (CRC) screening with the implementation of the Removing Barriers to Colorectal Cancer Screening Act by the Centers for Medicare & Medicaid Services, which will protect Medicare beneficiaries from an unexpected bill if a polyp is detected and removed during a screening colonoscopy, as well as new guidance from the federal government requiring private insurers to cover colonoscopy as a follow-up to a noninvasive CRC screening test without imposing cost sharing for patients.
The American Gastroenterological Association is strongly committed to reducing the incidence of and mortality from colorectal cancer. There is strong evidence that CRC screening is effective, but only 65% of eligible individuals have been screened. A. Mark Fendrick, MD, and colleagues recently found that cost sharing for CRC screening occurred in 48.2% of patients with commercial insurance and 77.9% of patients with Medicare coverage. The elimination of these barriers to CRC screening should improve adherence and reduce the burden of CRC.
As one of AGA President John M. Inadomi’s initiatives, the AGA created the CRC Screening Continuum Executive Committee in 2021 to develop AGA Position Statements that highlight the continuum of CRC screening and identify barriers, as well as work with stakeholders to eliminate known barriers. Chaired by former AGA President, David Lieberman, MD, AGAF, and with public policy guidance from Kathleen Teixeira, AGA Vice President of Public Policy and Government Affairs at the AGA, the committee identified that, at that time, colonoscopies after positive stool tests had often been considered “diagnostic” and, therefore, were not covered in full the way a preventive screening is required to be covered by the Affordable Care Act (ACA). The committee recognized that copays and deductibles are barriers to CRC screening and contribute to health inequity and socio-economic disparities. Noninvasive screening should be considered a part of programs with multiple steps, all of which – including follow-up colonoscopy if the test is positive – should be covered by payers without cost sharing as part of the screening continuum. Further, screening with high-quality colonoscopy should be covered by payers without cost sharing, consistent with the aims of the ACA. The committee recommended that the full cost of screening, including the bowel prep, facility and professional fees, anesthesia, and pathology, should be covered by payers without cost sharing.
Over the past decade, the AGA and other organizations have spent countless hours advocating for closing the gap. In September 2021, Dr. Inadomi and Dr. Lieberman, along with the American Cancer Society Cancer Action Network and Fight CRC, met with Assistant Secretary of Labor, Ali Khawar, and representatives from the U.S. Department of Health & Human Services and U.S. Department of Treasury to request they direct private health plans to cover colonoscopy after a positive noninvasive CRC screening. In January 2022, guidance from the United States Department of Labor, HHS, and the USDT clarified that private insurance plans must cover follow-up colonoscopies after a positive noninvasive stool test. In the Frequently Asked Questions (FAQs) about the Affordable Care Act Implementation, Part 51, the departments affirmed that a plan or issuer must cover and may not impose cost sharing with respect to a colonoscopy conducted after a positive noninvasive stool-based screening test or direct visualization screening test for colorectal cancer for individuals described in a U.S. Preventive Services Task Force (USPSTF) recommendation from May 18, 2021. As stated in that USPSTF recommendation, the follow-up colonoscopy is an integral part of the preventive screening without which the screening would not be complete . The follow-up colonoscopy after a positive noninvasive stool-based screening test or direct visualization screening test is therefore required to be covered without cost sharing in accordance with the requirements of Public Health Service Act section 2713 and its implementing regulations.
Plans and issuers must provide coverage without cost sharing for plan or policy years beginning on or after May 31, 2022. While this new guidance will expand coverage of follow-up colonoscopies to many more individuals nationwide, including individuals who have coverage through Medicaid expansion, it does not apply to traditional Medicaid and Medicare plans.
The members of the CRC Screening Continuum Executive Committee includes Dr. Brill and Lieberman, as well as Uri Ladabaum, MD; Larry Kim, MD; Folasade May, MD, PhD, MPhil; Caitlin Murphy, MD; and Richard Wender, MD. Disclosures are on file with the AGA National Office.
Dr. Brill is chief medical officer, Predictive Health, Phoenix. Dr. Lieberman is professor of medicine, division of gastroenterology and hepatology, Oregon Health & Science University, Portland, as well as a past president of the AGA. Dr. Brill discloses consulting for Accomplish Health, Alimetry, Allara Health, AnX Robotica, Arch Therapeutics, Biotax, Boomerang Medical, Brightline, Calyx, Capsovision, Check Cap, Clexio, Curology, Docbot, Echosens, Endogastric Solutions, evoEndo, Family First, FDNA, Food Marble, Freespira, Gala Therapeutics, Glaukos, gTech Medical, Gynesonics, Hbox, Hello Heart, HyGIeaCare, Innovative Health Solutions, IronRod Health, Johnson & Johnson, Lantheus, LeMinou, Lumen, Mainstay Medical, MaternaMed, Medtronic, Mightier, Motus GI, OncoSil Medical, Palette Life Sciences, Perry Health, Perspectum, Red Ventures, Reflexion, Respira Labs, Salaso, Smith+Nephew, SonarMD, Stage Zero Life Sciences, Steris, Sword Health, Tabula Rosa Health Care, Ultrasight, Vertos Medical, WL Gore, and holds options/warrants in Accomplish Health, AnX Robotica, Capsovision, Donsini Health, Hbox, Hello Heart, HyGIeaCare, Restech, Perry Health, StageZero Life Sciences, SonarMD. Dr. Lieberman is a consultant to Geneoscopy.
The new year has already marked major progress for colorectal cancer (CRC) screening with the implementation of the Removing Barriers to Colorectal Cancer Screening Act by the Centers for Medicare & Medicaid Services, which will protect Medicare beneficiaries from an unexpected bill if a polyp is detected and removed during a screening colonoscopy, as well as new guidance from the federal government requiring private insurers to cover colonoscopy as a follow-up to a noninvasive CRC screening test without imposing cost sharing for patients.
The American Gastroenterological Association is strongly committed to reducing the incidence of and mortality from colorectal cancer. There is strong evidence that CRC screening is effective, but only 65% of eligible individuals have been screened. A. Mark Fendrick, MD, and colleagues recently found that cost sharing for CRC screening occurred in 48.2% of patients with commercial insurance and 77.9% of patients with Medicare coverage. The elimination of these barriers to CRC screening should improve adherence and reduce the burden of CRC.
As one of AGA President John M. Inadomi’s initiatives, the AGA created the CRC Screening Continuum Executive Committee in 2021 to develop AGA Position Statements that highlight the continuum of CRC screening and identify barriers, as well as work with stakeholders to eliminate known barriers. Chaired by former AGA President, David Lieberman, MD, AGAF, and with public policy guidance from Kathleen Teixeira, AGA Vice President of Public Policy and Government Affairs at the AGA, the committee identified that, at that time, colonoscopies after positive stool tests had often been considered “diagnostic” and, therefore, were not covered in full the way a preventive screening is required to be covered by the Affordable Care Act (ACA). The committee recognized that copays and deductibles are barriers to CRC screening and contribute to health inequity and socio-economic disparities. Noninvasive screening should be considered a part of programs with multiple steps, all of which – including follow-up colonoscopy if the test is positive – should be covered by payers without cost sharing as part of the screening continuum. Further, screening with high-quality colonoscopy should be covered by payers without cost sharing, consistent with the aims of the ACA. The committee recommended that the full cost of screening, including the bowel prep, facility and professional fees, anesthesia, and pathology, should be covered by payers without cost sharing.
Over the past decade, the AGA and other organizations have spent countless hours advocating for closing the gap. In September 2021, Dr. Inadomi and Dr. Lieberman, along with the American Cancer Society Cancer Action Network and Fight CRC, met with Assistant Secretary of Labor, Ali Khawar, and representatives from the U.S. Department of Health & Human Services and U.S. Department of Treasury to request they direct private health plans to cover colonoscopy after a positive noninvasive CRC screening. In January 2022, guidance from the United States Department of Labor, HHS, and the USDT clarified that private insurance plans must cover follow-up colonoscopies after a positive noninvasive stool test. In the Frequently Asked Questions (FAQs) about the Affordable Care Act Implementation, Part 51, the departments affirmed that a plan or issuer must cover and may not impose cost sharing with respect to a colonoscopy conducted after a positive noninvasive stool-based screening test or direct visualization screening test for colorectal cancer for individuals described in a U.S. Preventive Services Task Force (USPSTF) recommendation from May 18, 2021. As stated in that USPSTF recommendation, the follow-up colonoscopy is an integral part of the preventive screening without which the screening would not be complete . The follow-up colonoscopy after a positive noninvasive stool-based screening test or direct visualization screening test is therefore required to be covered without cost sharing in accordance with the requirements of Public Health Service Act section 2713 and its implementing regulations.
Plans and issuers must provide coverage without cost sharing for plan or policy years beginning on or after May 31, 2022. While this new guidance will expand coverage of follow-up colonoscopies to many more individuals nationwide, including individuals who have coverage through Medicaid expansion, it does not apply to traditional Medicaid and Medicare plans.
The members of the CRC Screening Continuum Executive Committee includes Dr. Brill and Lieberman, as well as Uri Ladabaum, MD; Larry Kim, MD; Folasade May, MD, PhD, MPhil; Caitlin Murphy, MD; and Richard Wender, MD. Disclosures are on file with the AGA National Office.
Dr. Brill is chief medical officer, Predictive Health, Phoenix. Dr. Lieberman is professor of medicine, division of gastroenterology and hepatology, Oregon Health & Science University, Portland, as well as a past president of the AGA. Dr. Brill discloses consulting for Accomplish Health, Alimetry, Allara Health, AnX Robotica, Arch Therapeutics, Biotax, Boomerang Medical, Brightline, Calyx, Capsovision, Check Cap, Clexio, Curology, Docbot, Echosens, Endogastric Solutions, evoEndo, Family First, FDNA, Food Marble, Freespira, Gala Therapeutics, Glaukos, gTech Medical, Gynesonics, Hbox, Hello Heart, HyGIeaCare, Innovative Health Solutions, IronRod Health, Johnson & Johnson, Lantheus, LeMinou, Lumen, Mainstay Medical, MaternaMed, Medtronic, Mightier, Motus GI, OncoSil Medical, Palette Life Sciences, Perry Health, Perspectum, Red Ventures, Reflexion, Respira Labs, Salaso, Smith+Nephew, SonarMD, Stage Zero Life Sciences, Steris, Sword Health, Tabula Rosa Health Care, Ultrasight, Vertos Medical, WL Gore, and holds options/warrants in Accomplish Health, AnX Robotica, Capsovision, Donsini Health, Hbox, Hello Heart, HyGIeaCare, Restech, Perry Health, StageZero Life Sciences, SonarMD. Dr. Lieberman is a consultant to Geneoscopy.
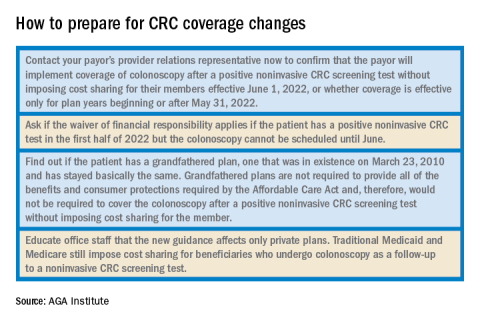
USPSTF releases updated guidance on asymptomatic A-fib
In January 2022, the US Preventive Services Task Force updated its 2018 statement on screening for atrial fibrillation (AF) in older adults (≥ 50 years).1,2 The supporting evidence review sought to include data on newer screening methods, such as automated blood pressure cuffs, pulse oximeters, and consumer-facing devices (eg, smartphone apps). However, ultimately, the recommendation did not change; it remains an “I” statement, meaning the evidence is insufficient to assess the balance of benefits and harms of screening for AF in asymptomatic adults with no signs or symptoms.1,2
Atrial fibrillation and stroke. AF is common, and the prevalence increases with age: from < 0.2% in those younger than 55 years to about 10% for those ages 85 and older.1,2 AF is a strong risk factor for stroke, and when detected, stroke prevention measures—either restoration of normal rhythm or use of anticoagulants—can be implemented as appropriate.
The available evidence for the effectiveness of stroke prevention comes from patients with AF that was detected because of symptoms or pulse palpation during routine care. It is not known if screening asymptomatic adults using electrocardiography, or newer electronic devices that detect irregular heartbeats, achieves these same benefits—and there is the potential for harm from the use of anticoagulants.
How does this compare to other recommendations? The American Heart Association and the American Stroke Association recommend active screening for AF, by pulse assessment, in those ages 65 years and older.3 This does not differ as much as it appears to from the USPSTF statement. The difference is in terminology: The USPSTF considers pulse assessment part of routine care; the other organizations call it “screening.”
What you should—and shouldn’t—do. The USPSTF states that “Clinicians should use their clinical judgement regarding whether to screen and how to screen for AF.” Any patient with signs or symptoms of AF or who is discovered to have an irregular pulse should be assessed for AF. Those found to have AF should be assessed for their risk of stroke and treated accordingly. However, attempting to find “silent” AF in those who do not have an irregular pulse on exam, by way of any screening devices, has no proven benefit.
1. USPSTF; Davidson KW, Barry MJ, Mangione CM, et al. Screening for atrial fibrillation: US Preventive Services Task Force recommendation statement. JAMA. 2022;327:360-365.
2. USPSTF. Screening for atrial fibrillation: final recommendation statement. Published January 25, 2022. Accessed February 2, 2022. https://uspreventiveservicestaskforce.org/uspstf/recommendation/atrial-fibrillation-screening
3. Meschia JF, Bushnell C, Boden-Albala B, et al; American Heart Association Stroke Council; Council on Cardiovascular and Stroke Nursing; Council on Clinical Cardiology; Council on Functional Genomics and Translational Biology; Council on Hypertension. Guidelines for the primary prevention of stroke: a statement for healthcare professionals from the American Heart Association/American Stroke Association. Stroke. 2014;45:3754-3832. doi: 10.1161/STR.0000000000000046
In January 2022, the US Preventive Services Task Force updated its 2018 statement on screening for atrial fibrillation (AF) in older adults (≥ 50 years).1,2 The supporting evidence review sought to include data on newer screening methods, such as automated blood pressure cuffs, pulse oximeters, and consumer-facing devices (eg, smartphone apps). However, ultimately, the recommendation did not change; it remains an “I” statement, meaning the evidence is insufficient to assess the balance of benefits and harms of screening for AF in asymptomatic adults with no signs or symptoms.1,2
Atrial fibrillation and stroke. AF is common, and the prevalence increases with age: from < 0.2% in those younger than 55 years to about 10% for those ages 85 and older.1,2 AF is a strong risk factor for stroke, and when detected, stroke prevention measures—either restoration of normal rhythm or use of anticoagulants—can be implemented as appropriate.
The available evidence for the effectiveness of stroke prevention comes from patients with AF that was detected because of symptoms or pulse palpation during routine care. It is not known if screening asymptomatic adults using electrocardiography, or newer electronic devices that detect irregular heartbeats, achieves these same benefits—and there is the potential for harm from the use of anticoagulants.
How does this compare to other recommendations? The American Heart Association and the American Stroke Association recommend active screening for AF, by pulse assessment, in those ages 65 years and older.3 This does not differ as much as it appears to from the USPSTF statement. The difference is in terminology: The USPSTF considers pulse assessment part of routine care; the other organizations call it “screening.”
What you should—and shouldn’t—do. The USPSTF states that “Clinicians should use their clinical judgement regarding whether to screen and how to screen for AF.” Any patient with signs or symptoms of AF or who is discovered to have an irregular pulse should be assessed for AF. Those found to have AF should be assessed for their risk of stroke and treated accordingly. However, attempting to find “silent” AF in those who do not have an irregular pulse on exam, by way of any screening devices, has no proven benefit.
In January 2022, the US Preventive Services Task Force updated its 2018 statement on screening for atrial fibrillation (AF) in older adults (≥ 50 years).1,2 The supporting evidence review sought to include data on newer screening methods, such as automated blood pressure cuffs, pulse oximeters, and consumer-facing devices (eg, smartphone apps). However, ultimately, the recommendation did not change; it remains an “I” statement, meaning the evidence is insufficient to assess the balance of benefits and harms of screening for AF in asymptomatic adults with no signs or symptoms.1,2
Atrial fibrillation and stroke. AF is common, and the prevalence increases with age: from < 0.2% in those younger than 55 years to about 10% for those ages 85 and older.1,2 AF is a strong risk factor for stroke, and when detected, stroke prevention measures—either restoration of normal rhythm or use of anticoagulants—can be implemented as appropriate.
The available evidence for the effectiveness of stroke prevention comes from patients with AF that was detected because of symptoms or pulse palpation during routine care. It is not known if screening asymptomatic adults using electrocardiography, or newer electronic devices that detect irregular heartbeats, achieves these same benefits—and there is the potential for harm from the use of anticoagulants.
How does this compare to other recommendations? The American Heart Association and the American Stroke Association recommend active screening for AF, by pulse assessment, in those ages 65 years and older.3 This does not differ as much as it appears to from the USPSTF statement. The difference is in terminology: The USPSTF considers pulse assessment part of routine care; the other organizations call it “screening.”
What you should—and shouldn’t—do. The USPSTF states that “Clinicians should use their clinical judgement regarding whether to screen and how to screen for AF.” Any patient with signs or symptoms of AF or who is discovered to have an irregular pulse should be assessed for AF. Those found to have AF should be assessed for their risk of stroke and treated accordingly. However, attempting to find “silent” AF in those who do not have an irregular pulse on exam, by way of any screening devices, has no proven benefit.
1. USPSTF; Davidson KW, Barry MJ, Mangione CM, et al. Screening for atrial fibrillation: US Preventive Services Task Force recommendation statement. JAMA. 2022;327:360-365.
2. USPSTF. Screening for atrial fibrillation: final recommendation statement. Published January 25, 2022. Accessed February 2, 2022. https://uspreventiveservicestaskforce.org/uspstf/recommendation/atrial-fibrillation-screening
3. Meschia JF, Bushnell C, Boden-Albala B, et al; American Heart Association Stroke Council; Council on Cardiovascular and Stroke Nursing; Council on Clinical Cardiology; Council on Functional Genomics and Translational Biology; Council on Hypertension. Guidelines for the primary prevention of stroke: a statement for healthcare professionals from the American Heart Association/American Stroke Association. Stroke. 2014;45:3754-3832. doi: 10.1161/STR.0000000000000046
1. USPSTF; Davidson KW, Barry MJ, Mangione CM, et al. Screening for atrial fibrillation: US Preventive Services Task Force recommendation statement. JAMA. 2022;327:360-365.
2. USPSTF. Screening for atrial fibrillation: final recommendation statement. Published January 25, 2022. Accessed February 2, 2022. https://uspreventiveservicestaskforce.org/uspstf/recommendation/atrial-fibrillation-screening
3. Meschia JF, Bushnell C, Boden-Albala B, et al; American Heart Association Stroke Council; Council on Cardiovascular and Stroke Nursing; Council on Clinical Cardiology; Council on Functional Genomics and Translational Biology; Council on Hypertension. Guidelines for the primary prevention of stroke: a statement for healthcare professionals from the American Heart Association/American Stroke Association. Stroke. 2014;45:3754-3832. doi: 10.1161/STR.0000000000000046