User login
Autism spectrum disorder: Keys to early detection and accurate diagnosis
FIRST OF 2 PARTS
Autism spectrum disorder (ASD) is a complex, heterogenous neurodevelopmental disorder with genetic and environmental underpinnings, and an onset early in life.1-9 It affects social communication, cognition, and sensory-motor domains, and manifests as deficits in social reciprocity, repetitive behavior, restricted range of interests, and sensory sensitivities.6,10-14 In recent years, the prevalence of ASD has been increasing.3,6,10 A large percentage of individuals with ASD experience significant social deficits in adulthood,10 which often leads to isolation, depressive symptoms, and poor occupational and relationship functioning.15,16 Interventions in early childhood can result in significant and lasting changes in outcome and in functioning of individuals with ASD.
This article provides an update on various aspects of ASD diagnosis, with the goal of equipping clinicians with knowledge to help make an accurate ASD diagnosis at an early stage. Part 1 focuses on early detection and diagnosis, while Part 2 will describe treatment strategies.
Benefits of early detection
Substantial research has established that early intervention confers substantial benefits for outcomes among children with ASD.2,3,5,6,9,13,14,16-22 Earlier age of intervention correlates with greater developmental gain and symptom reduction.21,23 The atypical neural development responsible for ASD likely occurs much earlier than the behavioral manifestations of this disorder, which implies that there is a crucial period to intervene before behavioral features emerge.1 This necessitates early recognition of ASD,9,17 and the need for further research to find novel ways to detect ASD earlier.
In the United States, children with ASD are diagnosed with the disorder on average between age 3 and 4 years.6,24 However, evidence suggests there may be a prodromal phase for ASD during the first several months of life, wherein infants and toddlers exhibit developmentally inadequate communication and social skills and/or unusual behaviors.18 Behavioral signs suggestive of ASD may be evident as early as infancy, and commonly earlier than age 18 months.1,17,19 Problems with sleeping and eating may be evident in early childhood.19 Deficits in joint attention may be evident as early as age 6 months to 8 months. Research suggests that a diagnosis of ASD by trained, expert professionals is likely to be accurate at the age of 2, and even as early as 18 months.6,24
In a prospective study, Anderson et al25 found that 9% of children who were diagnosed with ASD at age 2 no longer met the diagnostic criteria for ASD by adulthood.6 Those who no longer met ASD criteria were more likely to have received early intervention, had a verbal IQ ≥70, and had experienced a larger decrease in repetitive behaviors between ages 2 and 3, compared with other youth in this study who had a verbal IQ ≥70. One of the limitations of this study was a small sample size (85 participants); larger, randomized studies are needed to replicate these findings.25
Continue to: Characteristics of ASD...
Characteristics of ASD
Table 16,8,10,13,15,26-29 outlines various characteristics of ASD, which may manifest in varying degrees among children with the condition.
Speech/language. Speech helps to facilitate bonding between parents and an infant by offering a soothing, pleasurable, and reinforcing experience.30 More than 50% of children with ASD have language delays or deficits that persist throughout adulthood.13 The extent of these language deficits varies; in general, the more severe the speech/language deficits, the more severe the long-term symptoms.13 Language deficits in young children with ASD tend to be of both the expressive and receptive type, with onset in infancy, which suggests that neural processes predate the emergence of behavioral symptoms of ASD, and also that early language deficits/delays could be a marker for or indicator of future risk of ASD.13 Individuals with ASD also have been noted to have limitations in orienting or attending to human voices.13,30
Facial recognition. Evidence has linked ASD with deficits in facial recognition that emerge in the first few months of life.2 Earlier studies have found that lack of attention to others’ faces was the strongest distinguishing factor between 1-year-olds with ASD and typically developing 1-year-olds.2,31 A recent study that used EEG to compare facial emotion recognition in boys with ASD vs typically developing boys found that boys with ASD exhibited significantly lower sensitivity to angry and fearful faces.27
Other features. A 2020 study (N = 37) found that compared with typically developing children, those with ASD show less “interactional synchrony’’ (a dynamic process in which the timing of children and caregivers’ behaviors [specifically, vocalizations and movements] become mutually coordinated) with both familiar and unfamiliar adults.32 These researchers concluded that impairment in interactional synchrony may be linked to social communication deficits in ASD.32
A recent study (N = 98) evaluated “sluggish cognitive tempo” in 3 groups of children: children with attention-deficit/hyperactivity disorder (ADHD), children with ASD, and children with both ADHD and ASD.33 It found that children with ASD exhibited sluggish cognitive tempo at levels similar to those of the other 2 groups, and indicated that sluggish cognitive tempo may be linked with “social and global impairment above and beyond” the impairment associated with ASD.
Understanding early aberrations in neurobiologic processes in ASD can help develop biomarkers for early recognition of ASD, as well as guide the development of targeted interventions and treatments (Box1-3,7-9,12,13,30,35-39).
Box
Compared with individuals who do not have autism spectrum disorder (ASD), individuals with ASD exhibit anatomical differences in the brain that can be seen on MRI.9,35 Brain regions affected in ASD include the frontal gyrus, temporal gyrus, cingulate gyrus, postcentral gyrus, precuneus, caudate, and hippocampus.9 Some studies have found anomalous structural neural characteristics in infants, such as in the uncinate fasciculus, that correlated with later joint attention challenges, while others have found aberrations in the corpus callosum(responsible for transfer of procedural learning between the hemispheres, and oculomotor response)and internal capsule (responsible for sensorimotor function, as well as other functions) in children with ASD.12
Widespread white matter anomalies have been noted in ASD.12,35,36 In a 2-year longitudinal study that used diffusion tensor imaging, Li et al35 found that preschool children with ASD experience overgrowth of the uncinate fasciculus, which is one of the brain regions implicated in socioemotional processing, and concluded that this overgrowth correlated with ASD severity.35 Andrews et al37 used diffusion-weighted MRI to examine white matter in 127 preschool children. They found that compared with typically developing children, children with ASD exhibited altered white matter microstructure.37
Research suggests that developing representations of the reward value of social stimuli may be challenging for children with ASD.2 Abrams et al30 used resting-state functional brain MRI to evaluate children with typical development and children with highfunctioning, “verbally fluent” ASD. They found that the children with ASD exhibited lower functional connectivity between voice-specific left hemisphere posterior superior temporal sulcus and areas representing the reward circuitry.30 This study also found that children with ASD had underconnectivity between the right hemisphere posterior superior temporal sulcus (which deals with speech prosody) and areas known for emotion-linked associative learning, the orbitofrontal cortex and amygdala.30 These findings are thought to align with the social motivation theory of ASD.13,30,38
The extent of underconnectivity between these systems was found to determine the severity of communication challenges in high-functioning children with ASD.30 One MRI study observed lower gray matter volume in the voice-selective bilateral superior temporal sulcus in children age approximately 9 to 11 years with ASD.39
Neural systems responsible for facial recognition (particularly the right fusiform gyrus and other brain areas) have been shown to exist or begin “very early in life,” which suggests that impaired face recognition may be an early marker of ASD.2 In addition to problems with visual scanning, preferential attention to (and visual sensitivity to) biological motion is a forerunner for the development of social interactions in infants, specifically in regard to being able to detect and recognize emotion, which is considered vital for attachment.7,8 Impaired biological motion perception has been found in very young children with ASD.7,8 This presents an important avenue/potential biomarker for further research to better understand neurobiologic processes underlying atypical development at an earlier age.3,8
Early neural biomarkers for ASD
Nonlinear EEG values may serve as an early neurobiomarker for detecting ASD in young children.1 Because it is relatively inexpensive and convenient, EEG may be highly useful for detecting ASD.1 A study that compared EEG results of 99 infants who had siblings with ASD and 89 low-risk controls from age 3 months to 36 months found that nonlinear EEG measurements predicted with high accuracy later diagnosis of ASD, and were strongly correlated with later Autism Diagnostic Observation Schedule scores.1
Continue to: A complex differential diagnosis...
A complex differential diagnosis
The differential diagnosis of ASD warrants careful attention and consideration to rule out other developmental and psychiatric conditions.
Intellectual disability (ID). DSM-5 diagnostic criteria for ASD necessitate that disturbances are not better explained by ID or global developmental delay and that deficits should exceed impairment consistent with the level of intellectual disability.28 Still, ASD is often overdiagnosed in children with ID.28 Research suggests phenotypic and genetic overlap between ID and ASD.28 Social functioning is often impaired in patients with ID; the greater the severity of ID, the greater the degree of social deficits.28 In approximately 30% of cases, ASD and ID are comorbid.6 This overlap and comorbidity can pose a challenge, particularly due to the inherent complexities involved in assessment and differentiation.28 When ID is present in ASD, there is a greater degree of social-communication deficits.6 It may be difficult to assess for ASD symptoms in children with severe ID.28 Although there is no minimum age or developmental level below which ASD should not be diagnosed, some studies have started to use minimum criteria for diagnosis, such as a nonverbal mental age of 18 months.28,40 Commonly used tests for ASD have much lower specificity when used for children with nonverbal age <15 months.28 It would make sense, then, that the presence of ID might significantly affect the results of these diagnostic tests.28
Other conditions that need to be ruled out include language disorders, hearing loss, rare genetic neurodevelopmental disorders (eg, Fragile X syndrome,3 Rett syndrome6), childhood-onset schizophrenia, obsessive-compulsive disorder, attachment disorders, and other conditions.18 ASD may be overdiagnosed in children with genetic disorders such as Angelman syndrome.41 In a systematic review, Moss and Howlin42 recommended caution when evaluating ASD-like behavioral symptoms in children with genetic syndromes and severe ID. On the other hand, some research has observed that individuals with Fragile X syndrome may exhibit symptoms that meet criteria for ASD.6,43 McDuffie et al43 used the Autism Diagnostic Interview-Revised (ADI-R) to compare boys with Fragile X syndrome who also met criteria for ASD with boys with nonsyndromic ASD. Those in the former group had lesser impairment in social smiling, offering, showing, and nonverbal gestures, but had more complex mannerisms, compared with boys in the latter group.43
Milder manifestations of ASD may be more challenging to diagnose,1 particularly in children age <3 and those with above-average cognition.6 Generally, in the case of a patient with ASD, parents find that the child did not have a period of typical development, or unusual behaviors were evident early on.17
ASD can be comorbid with ADHD. The presence of ADHD may mask or delay the diagnosis of ASD in children.6 In children with both ASD and ADHD, studies have found greater reduction in social and adaptive functioning compared with children with ADHD alone.44
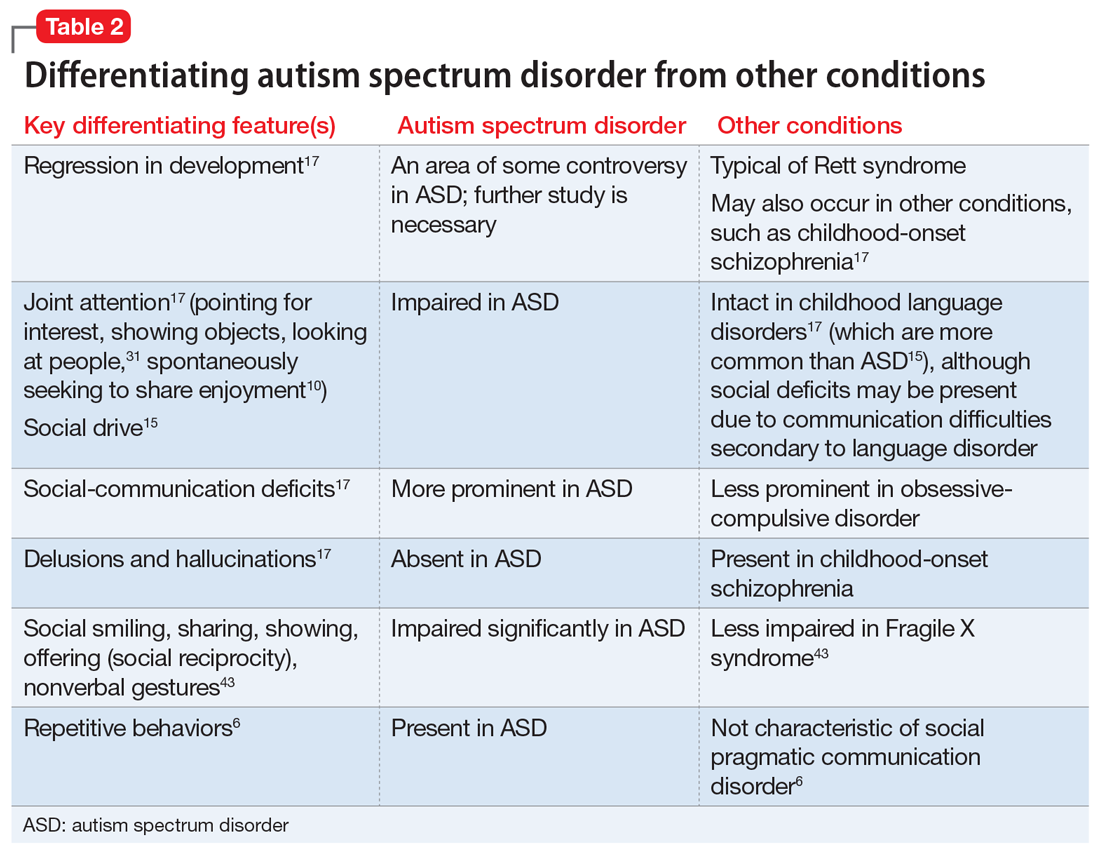
Table 26,10,15,17,31,43 highlights some of the features that can be used to distinguish ASD from other conditions.
Continue to: Screening and diagnosis...
Screening and diagnosis
A medical workup is the first step to rule out other potential conditions that could be masquerading as ASD.17 Obtain a comprehensive history from parents/caregivers, particularly regarding social, behavioral, movement, sensory, and developmental aspects. In addition, audiologic testing is an essential step. Consider genetic testing, particularly if any dysmorphic features and/or ID are present, both of which confer additional risk for a genetic syndrome.6 A physical exam to detect any neurologic anomalies, organ dysfunction, and body dysmorphic features should be conducted.6
The Modified Checklist for Autism in Toddlers–Revised (MCHAT-R) is a commonly used, validated parental screening survey for ASD.5,6 Research has shown that this survey has <50% specificity.5A recent American Academy of Pediatrics Clinical Report recommended universal screening for ASD at pediatric visits at age 18 months and at 24 months, in addition to developmental screening for all children at routine pediatric visits at age 9, 18, and 30 months.6,19
Screening tools such as the Modified Checklist for Autism in Toddlers with Follow-Up (M-CHAT/F) can be integrated into routine primary health care. In a large (N = 25,999) study, Guthrie et al45 used M-CHAT/F to conduct universal, primary care–based screening in young children. They found that the positive predictive value of M-CHAT/F was lower among girls, children of color, and those from lower-income households. There is a need for development of screening tools with higher accuracy and sensitivity for identifying young children with ASD regardless of their ethnic or socioeconomic background, and also for children older than 30 months.5,6,45
Definitive diagnosis of ASD is ideally done by a multidisciplinary team46 using established gold standard measures such as the ADOS (Autism Diagnostic Observation Schedule) and ADI-R.47 Such multidisciplinary teams usually include a child psychiatrist, child psychologist, speech therapist, occupational therapist, school educator, and developmental pediatrician. However, because there are long wait times to receive this type of diagnosis in the United States,6 in the interest of not missing the critical window of early intervention, physicians who suspect a patient may have ASD should refer the child and family for appropriate educational and behavioral interventions as early as possible, rather than waiting for definitive testing.6
ADI-R has limitations in distinguishing ASD from other conditions, especially in very young children, and particularly in distinguishing ASD from childhood-onset schizophrenia.47 Similarly, ADOS, which is a semi-structured, standardized, observation assessment tool, also has limitations, including generating false-positive results, which can make it difficult to distinguish children and adolescents with developmental disabilities from those with ASD.47 However, in combination, these 2 tools are generally efficacious.47 Further research is warranted to develop and fine-tune definitive diagnostic tools with greater sensitivity and specificity.
A newer measure—the Autism Parent Screen for Infants (APSI) questionnaire—has been shown to be effective in detecting early signs predictive of ASD in high-risk infants (eg, siblings of children with ASD), and has potential as an early screening tool.48,49
Part 2 of this article will review nonpharmacologic and pharmacologic treatments for patients with ASD.
1. Bosl WJ, Tager-Flusberg H, Nelson CA. EEG analytics for early detection of autism spectrum disorder: a data-driven approach. Sci Rep. 2018;8(1):6828. doi:10.1038/s41598-018-24318-x
2. Dawson G, Carver L, Meltzoff AN, et al. Neural correlates of face and object recognition in young children with autism spectrum disorder, developmental delay, and typical development. Child Dev. 2002;73(3):700-717. doi:10.1111/1467-8624.00433
3. Frye RE, Vassall S, Kaur G, et al. Emerging biomarkers in autism spectrum disorder: a systematic review. Ann Transl Med. 2019;7(23):792. doi:10.21037/atm.2019.11.5
4. Gordon I, Vander Wyk BC, Bennett RH, et al. Oxytocin enhances brain function in children with autism. Proc Natl Acad Sci U S A. 2013;110(52):20953-20958. doi:10.1073/pnas.1312857110
5. Hicks SD, Carpenter RL, Wagner KE, et al. Saliva microRNA differentiates children with autism from peers with typical and atypical development. J Am Acad Child Adolesc Psychiatry. 2020;59(2):296-308.
6. Hyman SL, Levy SE, Myers SM, et al; Council on Children with Disabilities, Section on Developmental and Behavioral Pediatrics. Identification, evaluation, and management of children with autism spectrum disorder. Pediatrics. 2020;145(1):e20193447. doi:10.1542/peds.2019-3447
7. Kaiser MD, Hudac CM, Shultz S, et al. Neural signatures of autism. Proc Natl Acad Sci U S A. 2010;107(49):21223-1228. doi:10.1073/pnas.1010412107
8. Klin A, Lin DJ, Gorrindo P, et al. Two-year-olds with autism orient to non-social contingencies rather than biological motion. Nature. 2009;459(7244):257-261. doi:10.1038/nature07868
9. Chen T, Chen Y, Yuan M, et al. Towards developing a practical artificial intelligence tool for diagnosing and evaluating autism spectrum disorder: a study using multicenter ABIDE II datasets. JMIR Med Inform. 2020;8(5):e15767. doi:10.2196/15767
10. Maglione MA, Gans D, Das L, et al; Technical Expert Panel, & HRSA Autism Intervention Research – Behavioral (AIR‐B) Network. Nonmedical interventions for children with ASD: recommended guidelines and further research needs. Pediatrics. 2012;30(Suppl 2), S169-S178.
11. Monz BU, Houghton R, Law K, et al. Treatment patterns in children with autism in the United States. Autism Res. 2019;12(3):5170-526. doi:10.1002/aur.2070
12. Shukla DK, Keehn B, Lincoln AJ, et al. White matter compromise of callosal and subcortical fiber tracts in children with autism spectrum disorder: a diffusion tensor imaging study. J Am Acad Child Adolesc Psychiatry. 2010;49(12):1269-1278.e12782. doi:10.1016/j.jaac.2010.08.018
13. Sperdin HF, Schaer M. Aberrant development of speech processing in young children with autism: new insights from neuroimaging biomarkers. Front Neurosci. 2016;10:393. doi: 10.3389/fnins.2016.00393
14. Zwaigenbaum L, Brian JA, Ip A. Early detection for autism spectrum disorder in young children. Paediatr Child Health. 2019;24(7):424-443. doi:10.1093/pch/pxz119
15. Simms MD, Jin XM. Autism, language disorder, and social (pragmatic) communication disorder: DSM-V and differential diagnoses. Pediatr Rev. 2015;36(8):355-363. doi:10.1542/pir.36-8-355
16. Su Maw S, Haga C. Effectiveness of cognitive, developmental, and behavioural interventions for autism spectrum disorder in preschool-aged children: a systematic review and meta-analysis. Heliyon. 2018;4(9):e00763. doi:10.1016/j.heliyon.2018.e00763
17. Volkmar F, Siegel M, Woodbury-Smith M, et al. Practice parameter for the assessment and treatment of children and adolescents with autism spectrum disorder. J Am Acad Child Adolesc Psychiatry, 2014;53(2):237-257.
18. Landa RJ. Efficacy of early interventions for infants and young children with, and at risk for, autism spectrum disorders. Int Rev Psychiatry. 2018;30(1):25-39. doi:10.1080/09540261.2018.1432574
19. Lipkin PH, Macias MM; Council on Children with Disabilities, Section on Developmental and Behavioral Pediatrics. Promoting optimal development: identifying infants and young children with developmental disorders through developmental surveillance and screening. Pediatrics. 2020;145(1)e20193449. doi:10.1542/peds.2019-3449
20. Pickles A, Le Couteur A, Leadbitter K, et al. Parent-mediated social communication therapy for young children with autism (PACT): long-term follow-up of a randomised controlled trial. Lancet. 2016;388:2501-2509.
21. Rogers SJ, Estes A, Lord C, et al. Effects of a brief early start Denver model (ESDM)-based parent intervention on toddlers at risk for autism spectrum disorders: a randomized controlled trial. J Am Acad Child Adolesc Psychiatry. 2012;51(10):1052-1065. doi:10.1016/j.jaac.2012.08.003
22. Schreibman L, Dawson G, Stahmer AC, et al. Naturalistic developmental behavioral interventions: empirically validated treatments for autism spectrum disorder. J Autism Dev Disord. 2015;45(8):2411-2428. doi:10.1007/s10803-015-2407-8
23. Mundy P. A review of joint attention and social-cognitive brain systems in typical development and autism spectrum disorder. Eur J Neurosci. 2018;47(6):497-514.
24. Zwaigenbaum L, Bryson SE, Brian J, et al. Stability of diagnostic assessment for autism spectrum disorder between 18 and 36 months in a high-risk cohort. Autism Res. 2016;9(7):790-800. doi:10.1002/aur.1585
25. Anderson DK, Liang JW, Lord C. Predicting young adult outcome among more and less cognitively able individuals with autism spectrum disorders. J Child Psychol Psychiatry. 2014;55(5):485-494. doi:10.1111/jcpp.12178
26. Jones W, Carr K, Klin A. Absence of preferential looking to the eyes of approaching adults predicts level of social disability in 2-year-old toddlers with autism spectrum disorder. Arch Gen Psychiatry. 2008;65(8):946-954. doi:10.1001/archpsyc.65.8.946
27. Van der Donck S, Dzhelyova M, Vettori S, et al. Rapid neural categorization of angry and fearful faces is specifically impaired in boys with autism spectrum disorder. J Child Psychol Psychiatry. 2020;61(9):1019-1029. doi:10.1111/jcpp.13201
28. Thurm A, Farmer C, Salzman E, et al. State of the field: differentiating intellectual disability from autism spectrum disorder. Front Psychiatry. 2019;10:526. doi:10.3389/fpsyt.2019.00526
29. Kuno-Fujita A, Iwabuchi T, Wakusawa K, et al. Sensory processing patterns and fusiform activity during face processing in autism spectrum disorder. Autism Res. 2020;13(5):741-750. doi: 10.1002/aur.2283
30. Abrams DA, Lynch CJ, Cheng KM, et al. Underconnectivity between voice-selective cortex and reward circuitry in children with autism. Proc Natl Acad Sci U S A. 2013;110(29):12060-12065. doi:10.1073/pnas.1302982110
31. Osterling J, Dawson G. Early recognition of children with autism: a study of first birthday home videotapes. J Autism Dev Disord. 1994;24(3):247-257.
32. Zampella CJ, Csumitta KD, Simon E, et al. Interactional synchrony and its association with social and communication ability in children with and without autism spectrum disorder. J Autism Dev Disord. 2020;50(9):3195-3206. doi:10.1007/s10803-020-04412-8
33. McFayden T, Jarrett MA, White SW, et al. Sluggish cognitive tempo in autism spectrum disorder, ADHD, and their comorbidity: implications for impairment. J Clin Child Adolesc Psychol. 2020:1-8. doi:10.1080/15374416.2020.1716365
34. Baribeau DA, Vigod S, Pullenayegum E, et al. Repetitive behavior severity as an early indicator of risk for elevated anxiety symptoms in autism spectrum disorder. J Am Acad Child Adolesc Psychiatry. 2020;59(7):890-899.e3. doi:10.1016/j.jaac.2019.08.478
35. Li Y, Zhou Z, Chang C, et al. Anomalies in uncinate fasciculus development and social defects in preschoolers with autism spectrum disorder. BMC Psychiatry. 2019;19(1):399. doi:10.1186/s12888-019-2391-1
36. Payabvash S, Palacios EM, Owen JP, et al. White matter connectome edge density in children with autism spectrum disorders: potential imaging biomarkers using machine-learning models. Brain Connect. 2019;9(2):209-220. doi:10.1089/brain.2018.0658
37. Andrews DS, Lee JK, Solomon M, et al. A diffusion-weighted imaging tract-based spatial statistics study of autism spectrum disorder in preschool-aged children. J Neurodev Disord. 2019;11(1):32. doi:10.1186/s11689-019-9291-z
38. Chevallier C, Kohls G, Troiani V, et al. The social motivation theory of autism. Trends Cogn Sci. 2012;16(4):231-239. doi:10.1016/j.tics.2012.02.007
39. Boddaert N, Chabane N, Gervais H, et al. Superior temporal sulcus anatomical abnormalities in childhood autism: a voxel-based morphometry MRI study. Neuroimage. 2004;23(1):364-369. doi:10.1016/j.neuroimage.2004.06.016
40. Lord C, Petkova E, Hus V, et al. A multisite study of the clinical diagnosis of different autism spectrum disorders. Arch Gen Psychiatry. 2012;69(3):306-313. doi:10.1001/archgenpsychiatry.2011.148
41. Trillingsgaard A, ØStergaard JR. Autism in Angelman syndrome: an exploration of comorbidity. Autism. 2004;8(2):163-174.
42. Moss J, Howlin P. Autism spectrum disorders in genetic syndromes: implications for diagnosis, intervention and understanding the wider autism spectrum disorder population. J Intellect Disabil Res. 2009;53(10):852-873. doi:10.1111/j.1365-2788.2009.01197.x
43. McDuffie A, Thurman AJ, Hagerman RJ, et al. Symptoms of autism in males with Fragile X syndrome: a comparison to nonsyndromic ASD using current ADI-R scores. J Autism Dev Disord. 2015;45(7):1925-1937. doi:10.1007/s10803-013-2013-6
44. Ashwood KL, Tye C, Azadi B, et al. Brief report: adaptive functioning in children with ASD, ADHD and ASD + ADHD. J Autism Dev Disord. 2015;45(7):2235-4222. doi:10.1007/s10803-014-2352-y
45. Guthrie W, Wallis K, Bennett A, et al. Accuracy of autism screening in a large pediatric network. Pediatrics. 2019;144(4): e20183963. doi:10.1542/peds.2018-3963
46. Brian JA, Zwaigenbaum L, Ip A. Standards of diagnostic assessment for autism spectrum disorder. Paediatr Child Health. 2019;24(7):444-460. doi:10.1093/pch/pxz117
47. Frigaux A, Evrard R, Lighezzolo-Alnot J. ADI-R and ADOS and the differential diagnosis of autism spectrum disorders: interests, limits and openings. Encephale. 2019;45(5):441-448. doi:10.1016/j.encep.2019.07.002
48. Sacrey LR, Zwaigenbaum L, Bryson S, et al. Screening for behavioral signs of autism spectrum disorder in 9-month-old infant siblings. J Autism Dev Disord. 2021;51(3):839-848. doi:10.1007/s10803-020-04371-0
49. Sacrey LR, Bryson S, Zwaigenbaum L, et al. The autism parent screen for infants: predicting risk of autism spectrum disorder based on parent-reported behavior observed at 6-24 months of age. Autism. 2018;22(3):322-334
FIRST OF 2 PARTS
Autism spectrum disorder (ASD) is a complex, heterogenous neurodevelopmental disorder with genetic and environmental underpinnings, and an onset early in life.1-9 It affects social communication, cognition, and sensory-motor domains, and manifests as deficits in social reciprocity, repetitive behavior, restricted range of interests, and sensory sensitivities.6,10-14 In recent years, the prevalence of ASD has been increasing.3,6,10 A large percentage of individuals with ASD experience significant social deficits in adulthood,10 which often leads to isolation, depressive symptoms, and poor occupational and relationship functioning.15,16 Interventions in early childhood can result in significant and lasting changes in outcome and in functioning of individuals with ASD.
This article provides an update on various aspects of ASD diagnosis, with the goal of equipping clinicians with knowledge to help make an accurate ASD diagnosis at an early stage. Part 1 focuses on early detection and diagnosis, while Part 2 will describe treatment strategies.
Benefits of early detection
Substantial research has established that early intervention confers substantial benefits for outcomes among children with ASD.2,3,5,6,9,13,14,16-22 Earlier age of intervention correlates with greater developmental gain and symptom reduction.21,23 The atypical neural development responsible for ASD likely occurs much earlier than the behavioral manifestations of this disorder, which implies that there is a crucial period to intervene before behavioral features emerge.1 This necessitates early recognition of ASD,9,17 and the need for further research to find novel ways to detect ASD earlier.
In the United States, children with ASD are diagnosed with the disorder on average between age 3 and 4 years.6,24 However, evidence suggests there may be a prodromal phase for ASD during the first several months of life, wherein infants and toddlers exhibit developmentally inadequate communication and social skills and/or unusual behaviors.18 Behavioral signs suggestive of ASD may be evident as early as infancy, and commonly earlier than age 18 months.1,17,19 Problems with sleeping and eating may be evident in early childhood.19 Deficits in joint attention may be evident as early as age 6 months to 8 months. Research suggests that a diagnosis of ASD by trained, expert professionals is likely to be accurate at the age of 2, and even as early as 18 months.6,24
In a prospective study, Anderson et al25 found that 9% of children who were diagnosed with ASD at age 2 no longer met the diagnostic criteria for ASD by adulthood.6 Those who no longer met ASD criteria were more likely to have received early intervention, had a verbal IQ ≥70, and had experienced a larger decrease in repetitive behaviors between ages 2 and 3, compared with other youth in this study who had a verbal IQ ≥70. One of the limitations of this study was a small sample size (85 participants); larger, randomized studies are needed to replicate these findings.25
Continue to: Characteristics of ASD...
Characteristics of ASD
Table 16,8,10,13,15,26-29 outlines various characteristics of ASD, which may manifest in varying degrees among children with the condition.
Speech/language. Speech helps to facilitate bonding between parents and an infant by offering a soothing, pleasurable, and reinforcing experience.30 More than 50% of children with ASD have language delays or deficits that persist throughout adulthood.13 The extent of these language deficits varies; in general, the more severe the speech/language deficits, the more severe the long-term symptoms.13 Language deficits in young children with ASD tend to be of both the expressive and receptive type, with onset in infancy, which suggests that neural processes predate the emergence of behavioral symptoms of ASD, and also that early language deficits/delays could be a marker for or indicator of future risk of ASD.13 Individuals with ASD also have been noted to have limitations in orienting or attending to human voices.13,30
Facial recognition. Evidence has linked ASD with deficits in facial recognition that emerge in the first few months of life.2 Earlier studies have found that lack of attention to others’ faces was the strongest distinguishing factor between 1-year-olds with ASD and typically developing 1-year-olds.2,31 A recent study that used EEG to compare facial emotion recognition in boys with ASD vs typically developing boys found that boys with ASD exhibited significantly lower sensitivity to angry and fearful faces.27
Other features. A 2020 study (N = 37) found that compared with typically developing children, those with ASD show less “interactional synchrony’’ (a dynamic process in which the timing of children and caregivers’ behaviors [specifically, vocalizations and movements] become mutually coordinated) with both familiar and unfamiliar adults.32 These researchers concluded that impairment in interactional synchrony may be linked to social communication deficits in ASD.32
A recent study (N = 98) evaluated “sluggish cognitive tempo” in 3 groups of children: children with attention-deficit/hyperactivity disorder (ADHD), children with ASD, and children with both ADHD and ASD.33 It found that children with ASD exhibited sluggish cognitive tempo at levels similar to those of the other 2 groups, and indicated that sluggish cognitive tempo may be linked with “social and global impairment above and beyond” the impairment associated with ASD.
Understanding early aberrations in neurobiologic processes in ASD can help develop biomarkers for early recognition of ASD, as well as guide the development of targeted interventions and treatments (Box1-3,7-9,12,13,30,35-39).
Box
Compared with individuals who do not have autism spectrum disorder (ASD), individuals with ASD exhibit anatomical differences in the brain that can be seen on MRI.9,35 Brain regions affected in ASD include the frontal gyrus, temporal gyrus, cingulate gyrus, postcentral gyrus, precuneus, caudate, and hippocampus.9 Some studies have found anomalous structural neural characteristics in infants, such as in the uncinate fasciculus, that correlated with later joint attention challenges, while others have found aberrations in the corpus callosum(responsible for transfer of procedural learning between the hemispheres, and oculomotor response)and internal capsule (responsible for sensorimotor function, as well as other functions) in children with ASD.12
Widespread white matter anomalies have been noted in ASD.12,35,36 In a 2-year longitudinal study that used diffusion tensor imaging, Li et al35 found that preschool children with ASD experience overgrowth of the uncinate fasciculus, which is one of the brain regions implicated in socioemotional processing, and concluded that this overgrowth correlated with ASD severity.35 Andrews et al37 used diffusion-weighted MRI to examine white matter in 127 preschool children. They found that compared with typically developing children, children with ASD exhibited altered white matter microstructure.37
Research suggests that developing representations of the reward value of social stimuli may be challenging for children with ASD.2 Abrams et al30 used resting-state functional brain MRI to evaluate children with typical development and children with highfunctioning, “verbally fluent” ASD. They found that the children with ASD exhibited lower functional connectivity between voice-specific left hemisphere posterior superior temporal sulcus and areas representing the reward circuitry.30 This study also found that children with ASD had underconnectivity between the right hemisphere posterior superior temporal sulcus (which deals with speech prosody) and areas known for emotion-linked associative learning, the orbitofrontal cortex and amygdala.30 These findings are thought to align with the social motivation theory of ASD.13,30,38
The extent of underconnectivity between these systems was found to determine the severity of communication challenges in high-functioning children with ASD.30 One MRI study observed lower gray matter volume in the voice-selective bilateral superior temporal sulcus in children age approximately 9 to 11 years with ASD.39
Neural systems responsible for facial recognition (particularly the right fusiform gyrus and other brain areas) have been shown to exist or begin “very early in life,” which suggests that impaired face recognition may be an early marker of ASD.2 In addition to problems with visual scanning, preferential attention to (and visual sensitivity to) biological motion is a forerunner for the development of social interactions in infants, specifically in regard to being able to detect and recognize emotion, which is considered vital for attachment.7,8 Impaired biological motion perception has been found in very young children with ASD.7,8 This presents an important avenue/potential biomarker for further research to better understand neurobiologic processes underlying atypical development at an earlier age.3,8
Early neural biomarkers for ASD
Nonlinear EEG values may serve as an early neurobiomarker for detecting ASD in young children.1 Because it is relatively inexpensive and convenient, EEG may be highly useful for detecting ASD.1 A study that compared EEG results of 99 infants who had siblings with ASD and 89 low-risk controls from age 3 months to 36 months found that nonlinear EEG measurements predicted with high accuracy later diagnosis of ASD, and were strongly correlated with later Autism Diagnostic Observation Schedule scores.1
Continue to: A complex differential diagnosis...
A complex differential diagnosis
The differential diagnosis of ASD warrants careful attention and consideration to rule out other developmental and psychiatric conditions.
Intellectual disability (ID). DSM-5 diagnostic criteria for ASD necessitate that disturbances are not better explained by ID or global developmental delay and that deficits should exceed impairment consistent with the level of intellectual disability.28 Still, ASD is often overdiagnosed in children with ID.28 Research suggests phenotypic and genetic overlap between ID and ASD.28 Social functioning is often impaired in patients with ID; the greater the severity of ID, the greater the degree of social deficits.28 In approximately 30% of cases, ASD and ID are comorbid.6 This overlap and comorbidity can pose a challenge, particularly due to the inherent complexities involved in assessment and differentiation.28 When ID is present in ASD, there is a greater degree of social-communication deficits.6 It may be difficult to assess for ASD symptoms in children with severe ID.28 Although there is no minimum age or developmental level below which ASD should not be diagnosed, some studies have started to use minimum criteria for diagnosis, such as a nonverbal mental age of 18 months.28,40 Commonly used tests for ASD have much lower specificity when used for children with nonverbal age <15 months.28 It would make sense, then, that the presence of ID might significantly affect the results of these diagnostic tests.28
Other conditions that need to be ruled out include language disorders, hearing loss, rare genetic neurodevelopmental disorders (eg, Fragile X syndrome,3 Rett syndrome6), childhood-onset schizophrenia, obsessive-compulsive disorder, attachment disorders, and other conditions.18 ASD may be overdiagnosed in children with genetic disorders such as Angelman syndrome.41 In a systematic review, Moss and Howlin42 recommended caution when evaluating ASD-like behavioral symptoms in children with genetic syndromes and severe ID. On the other hand, some research has observed that individuals with Fragile X syndrome may exhibit symptoms that meet criteria for ASD.6,43 McDuffie et al43 used the Autism Diagnostic Interview-Revised (ADI-R) to compare boys with Fragile X syndrome who also met criteria for ASD with boys with nonsyndromic ASD. Those in the former group had lesser impairment in social smiling, offering, showing, and nonverbal gestures, but had more complex mannerisms, compared with boys in the latter group.43
Milder manifestations of ASD may be more challenging to diagnose,1 particularly in children age <3 and those with above-average cognition.6 Generally, in the case of a patient with ASD, parents find that the child did not have a period of typical development, or unusual behaviors were evident early on.17
ASD can be comorbid with ADHD. The presence of ADHD may mask or delay the diagnosis of ASD in children.6 In children with both ASD and ADHD, studies have found greater reduction in social and adaptive functioning compared with children with ADHD alone.44
Table 26,10,15,17,31,43 highlights some of the features that can be used to distinguish ASD from other conditions.
Continue to: Screening and diagnosis...
Screening and diagnosis
A medical workup is the first step to rule out other potential conditions that could be masquerading as ASD.17 Obtain a comprehensive history from parents/caregivers, particularly regarding social, behavioral, movement, sensory, and developmental aspects. In addition, audiologic testing is an essential step. Consider genetic testing, particularly if any dysmorphic features and/or ID are present, both of which confer additional risk for a genetic syndrome.6 A physical exam to detect any neurologic anomalies, organ dysfunction, and body dysmorphic features should be conducted.6
The Modified Checklist for Autism in Toddlers–Revised (MCHAT-R) is a commonly used, validated parental screening survey for ASD.5,6 Research has shown that this survey has <50% specificity.5A recent American Academy of Pediatrics Clinical Report recommended universal screening for ASD at pediatric visits at age 18 months and at 24 months, in addition to developmental screening for all children at routine pediatric visits at age 9, 18, and 30 months.6,19
Screening tools such as the Modified Checklist for Autism in Toddlers with Follow-Up (M-CHAT/F) can be integrated into routine primary health care. In a large (N = 25,999) study, Guthrie et al45 used M-CHAT/F to conduct universal, primary care–based screening in young children. They found that the positive predictive value of M-CHAT/F was lower among girls, children of color, and those from lower-income households. There is a need for development of screening tools with higher accuracy and sensitivity for identifying young children with ASD regardless of their ethnic or socioeconomic background, and also for children older than 30 months.5,6,45
Definitive diagnosis of ASD is ideally done by a multidisciplinary team46 using established gold standard measures such as the ADOS (Autism Diagnostic Observation Schedule) and ADI-R.47 Such multidisciplinary teams usually include a child psychiatrist, child psychologist, speech therapist, occupational therapist, school educator, and developmental pediatrician. However, because there are long wait times to receive this type of diagnosis in the United States,6 in the interest of not missing the critical window of early intervention, physicians who suspect a patient may have ASD should refer the child and family for appropriate educational and behavioral interventions as early as possible, rather than waiting for definitive testing.6
ADI-R has limitations in distinguishing ASD from other conditions, especially in very young children, and particularly in distinguishing ASD from childhood-onset schizophrenia.47 Similarly, ADOS, which is a semi-structured, standardized, observation assessment tool, also has limitations, including generating false-positive results, which can make it difficult to distinguish children and adolescents with developmental disabilities from those with ASD.47 However, in combination, these 2 tools are generally efficacious.47 Further research is warranted to develop and fine-tune definitive diagnostic tools with greater sensitivity and specificity.
A newer measure—the Autism Parent Screen for Infants (APSI) questionnaire—has been shown to be effective in detecting early signs predictive of ASD in high-risk infants (eg, siblings of children with ASD), and has potential as an early screening tool.48,49
Part 2 of this article will review nonpharmacologic and pharmacologic treatments for patients with ASD.
FIRST OF 2 PARTS
Autism spectrum disorder (ASD) is a complex, heterogenous neurodevelopmental disorder with genetic and environmental underpinnings, and an onset early in life.1-9 It affects social communication, cognition, and sensory-motor domains, and manifests as deficits in social reciprocity, repetitive behavior, restricted range of interests, and sensory sensitivities.6,10-14 In recent years, the prevalence of ASD has been increasing.3,6,10 A large percentage of individuals with ASD experience significant social deficits in adulthood,10 which often leads to isolation, depressive symptoms, and poor occupational and relationship functioning.15,16 Interventions in early childhood can result in significant and lasting changes in outcome and in functioning of individuals with ASD.
This article provides an update on various aspects of ASD diagnosis, with the goal of equipping clinicians with knowledge to help make an accurate ASD diagnosis at an early stage. Part 1 focuses on early detection and diagnosis, while Part 2 will describe treatment strategies.
Benefits of early detection
Substantial research has established that early intervention confers substantial benefits for outcomes among children with ASD.2,3,5,6,9,13,14,16-22 Earlier age of intervention correlates with greater developmental gain and symptom reduction.21,23 The atypical neural development responsible for ASD likely occurs much earlier than the behavioral manifestations of this disorder, which implies that there is a crucial period to intervene before behavioral features emerge.1 This necessitates early recognition of ASD,9,17 and the need for further research to find novel ways to detect ASD earlier.
In the United States, children with ASD are diagnosed with the disorder on average between age 3 and 4 years.6,24 However, evidence suggests there may be a prodromal phase for ASD during the first several months of life, wherein infants and toddlers exhibit developmentally inadequate communication and social skills and/or unusual behaviors.18 Behavioral signs suggestive of ASD may be evident as early as infancy, and commonly earlier than age 18 months.1,17,19 Problems with sleeping and eating may be evident in early childhood.19 Deficits in joint attention may be evident as early as age 6 months to 8 months. Research suggests that a diagnosis of ASD by trained, expert professionals is likely to be accurate at the age of 2, and even as early as 18 months.6,24
In a prospective study, Anderson et al25 found that 9% of children who were diagnosed with ASD at age 2 no longer met the diagnostic criteria for ASD by adulthood.6 Those who no longer met ASD criteria were more likely to have received early intervention, had a verbal IQ ≥70, and had experienced a larger decrease in repetitive behaviors between ages 2 and 3, compared with other youth in this study who had a verbal IQ ≥70. One of the limitations of this study was a small sample size (85 participants); larger, randomized studies are needed to replicate these findings.25
Continue to: Characteristics of ASD...
Characteristics of ASD
Table 16,8,10,13,15,26-29 outlines various characteristics of ASD, which may manifest in varying degrees among children with the condition.
Speech/language. Speech helps to facilitate bonding between parents and an infant by offering a soothing, pleasurable, and reinforcing experience.30 More than 50% of children with ASD have language delays or deficits that persist throughout adulthood.13 The extent of these language deficits varies; in general, the more severe the speech/language deficits, the more severe the long-term symptoms.13 Language deficits in young children with ASD tend to be of both the expressive and receptive type, with onset in infancy, which suggests that neural processes predate the emergence of behavioral symptoms of ASD, and also that early language deficits/delays could be a marker for or indicator of future risk of ASD.13 Individuals with ASD also have been noted to have limitations in orienting or attending to human voices.13,30
Facial recognition. Evidence has linked ASD with deficits in facial recognition that emerge in the first few months of life.2 Earlier studies have found that lack of attention to others’ faces was the strongest distinguishing factor between 1-year-olds with ASD and typically developing 1-year-olds.2,31 A recent study that used EEG to compare facial emotion recognition in boys with ASD vs typically developing boys found that boys with ASD exhibited significantly lower sensitivity to angry and fearful faces.27
Other features. A 2020 study (N = 37) found that compared with typically developing children, those with ASD show less “interactional synchrony’’ (a dynamic process in which the timing of children and caregivers’ behaviors [specifically, vocalizations and movements] become mutually coordinated) with both familiar and unfamiliar adults.32 These researchers concluded that impairment in interactional synchrony may be linked to social communication deficits in ASD.32
A recent study (N = 98) evaluated “sluggish cognitive tempo” in 3 groups of children: children with attention-deficit/hyperactivity disorder (ADHD), children with ASD, and children with both ADHD and ASD.33 It found that children with ASD exhibited sluggish cognitive tempo at levels similar to those of the other 2 groups, and indicated that sluggish cognitive tempo may be linked with “social and global impairment above and beyond” the impairment associated with ASD.
Understanding early aberrations in neurobiologic processes in ASD can help develop biomarkers for early recognition of ASD, as well as guide the development of targeted interventions and treatments (Box1-3,7-9,12,13,30,35-39).
Box
Compared with individuals who do not have autism spectrum disorder (ASD), individuals with ASD exhibit anatomical differences in the brain that can be seen on MRI.9,35 Brain regions affected in ASD include the frontal gyrus, temporal gyrus, cingulate gyrus, postcentral gyrus, precuneus, caudate, and hippocampus.9 Some studies have found anomalous structural neural characteristics in infants, such as in the uncinate fasciculus, that correlated with later joint attention challenges, while others have found aberrations in the corpus callosum(responsible for transfer of procedural learning between the hemispheres, and oculomotor response)and internal capsule (responsible for sensorimotor function, as well as other functions) in children with ASD.12
Widespread white matter anomalies have been noted in ASD.12,35,36 In a 2-year longitudinal study that used diffusion tensor imaging, Li et al35 found that preschool children with ASD experience overgrowth of the uncinate fasciculus, which is one of the brain regions implicated in socioemotional processing, and concluded that this overgrowth correlated with ASD severity.35 Andrews et al37 used diffusion-weighted MRI to examine white matter in 127 preschool children. They found that compared with typically developing children, children with ASD exhibited altered white matter microstructure.37
Research suggests that developing representations of the reward value of social stimuli may be challenging for children with ASD.2 Abrams et al30 used resting-state functional brain MRI to evaluate children with typical development and children with highfunctioning, “verbally fluent” ASD. They found that the children with ASD exhibited lower functional connectivity between voice-specific left hemisphere posterior superior temporal sulcus and areas representing the reward circuitry.30 This study also found that children with ASD had underconnectivity between the right hemisphere posterior superior temporal sulcus (which deals with speech prosody) and areas known for emotion-linked associative learning, the orbitofrontal cortex and amygdala.30 These findings are thought to align with the social motivation theory of ASD.13,30,38
The extent of underconnectivity between these systems was found to determine the severity of communication challenges in high-functioning children with ASD.30 One MRI study observed lower gray matter volume in the voice-selective bilateral superior temporal sulcus in children age approximately 9 to 11 years with ASD.39
Neural systems responsible for facial recognition (particularly the right fusiform gyrus and other brain areas) have been shown to exist or begin “very early in life,” which suggests that impaired face recognition may be an early marker of ASD.2 In addition to problems with visual scanning, preferential attention to (and visual sensitivity to) biological motion is a forerunner for the development of social interactions in infants, specifically in regard to being able to detect and recognize emotion, which is considered vital for attachment.7,8 Impaired biological motion perception has been found in very young children with ASD.7,8 This presents an important avenue/potential biomarker for further research to better understand neurobiologic processes underlying atypical development at an earlier age.3,8
Early neural biomarkers for ASD
Nonlinear EEG values may serve as an early neurobiomarker for detecting ASD in young children.1 Because it is relatively inexpensive and convenient, EEG may be highly useful for detecting ASD.1 A study that compared EEG results of 99 infants who had siblings with ASD and 89 low-risk controls from age 3 months to 36 months found that nonlinear EEG measurements predicted with high accuracy later diagnosis of ASD, and were strongly correlated with later Autism Diagnostic Observation Schedule scores.1
Continue to: A complex differential diagnosis...
A complex differential diagnosis
The differential diagnosis of ASD warrants careful attention and consideration to rule out other developmental and psychiatric conditions.
Intellectual disability (ID). DSM-5 diagnostic criteria for ASD necessitate that disturbances are not better explained by ID or global developmental delay and that deficits should exceed impairment consistent with the level of intellectual disability.28 Still, ASD is often overdiagnosed in children with ID.28 Research suggests phenotypic and genetic overlap between ID and ASD.28 Social functioning is often impaired in patients with ID; the greater the severity of ID, the greater the degree of social deficits.28 In approximately 30% of cases, ASD and ID are comorbid.6 This overlap and comorbidity can pose a challenge, particularly due to the inherent complexities involved in assessment and differentiation.28 When ID is present in ASD, there is a greater degree of social-communication deficits.6 It may be difficult to assess for ASD symptoms in children with severe ID.28 Although there is no minimum age or developmental level below which ASD should not be diagnosed, some studies have started to use minimum criteria for diagnosis, such as a nonverbal mental age of 18 months.28,40 Commonly used tests for ASD have much lower specificity when used for children with nonverbal age <15 months.28 It would make sense, then, that the presence of ID might significantly affect the results of these diagnostic tests.28
Other conditions that need to be ruled out include language disorders, hearing loss, rare genetic neurodevelopmental disorders (eg, Fragile X syndrome,3 Rett syndrome6), childhood-onset schizophrenia, obsessive-compulsive disorder, attachment disorders, and other conditions.18 ASD may be overdiagnosed in children with genetic disorders such as Angelman syndrome.41 In a systematic review, Moss and Howlin42 recommended caution when evaluating ASD-like behavioral symptoms in children with genetic syndromes and severe ID. On the other hand, some research has observed that individuals with Fragile X syndrome may exhibit symptoms that meet criteria for ASD.6,43 McDuffie et al43 used the Autism Diagnostic Interview-Revised (ADI-R) to compare boys with Fragile X syndrome who also met criteria for ASD with boys with nonsyndromic ASD. Those in the former group had lesser impairment in social smiling, offering, showing, and nonverbal gestures, but had more complex mannerisms, compared with boys in the latter group.43
Milder manifestations of ASD may be more challenging to diagnose,1 particularly in children age <3 and those with above-average cognition.6 Generally, in the case of a patient with ASD, parents find that the child did not have a period of typical development, or unusual behaviors were evident early on.17
ASD can be comorbid with ADHD. The presence of ADHD may mask or delay the diagnosis of ASD in children.6 In children with both ASD and ADHD, studies have found greater reduction in social and adaptive functioning compared with children with ADHD alone.44
Table 26,10,15,17,31,43 highlights some of the features that can be used to distinguish ASD from other conditions.
Continue to: Screening and diagnosis...
Screening and diagnosis
A medical workup is the first step to rule out other potential conditions that could be masquerading as ASD.17 Obtain a comprehensive history from parents/caregivers, particularly regarding social, behavioral, movement, sensory, and developmental aspects. In addition, audiologic testing is an essential step. Consider genetic testing, particularly if any dysmorphic features and/or ID are present, both of which confer additional risk for a genetic syndrome.6 A physical exam to detect any neurologic anomalies, organ dysfunction, and body dysmorphic features should be conducted.6
The Modified Checklist for Autism in Toddlers–Revised (MCHAT-R) is a commonly used, validated parental screening survey for ASD.5,6 Research has shown that this survey has <50% specificity.5A recent American Academy of Pediatrics Clinical Report recommended universal screening for ASD at pediatric visits at age 18 months and at 24 months, in addition to developmental screening for all children at routine pediatric visits at age 9, 18, and 30 months.6,19
Screening tools such as the Modified Checklist for Autism in Toddlers with Follow-Up (M-CHAT/F) can be integrated into routine primary health care. In a large (N = 25,999) study, Guthrie et al45 used M-CHAT/F to conduct universal, primary care–based screening in young children. They found that the positive predictive value of M-CHAT/F was lower among girls, children of color, and those from lower-income households. There is a need for development of screening tools with higher accuracy and sensitivity for identifying young children with ASD regardless of their ethnic or socioeconomic background, and also for children older than 30 months.5,6,45
Definitive diagnosis of ASD is ideally done by a multidisciplinary team46 using established gold standard measures such as the ADOS (Autism Diagnostic Observation Schedule) and ADI-R.47 Such multidisciplinary teams usually include a child psychiatrist, child psychologist, speech therapist, occupational therapist, school educator, and developmental pediatrician. However, because there are long wait times to receive this type of diagnosis in the United States,6 in the interest of not missing the critical window of early intervention, physicians who suspect a patient may have ASD should refer the child and family for appropriate educational and behavioral interventions as early as possible, rather than waiting for definitive testing.6
ADI-R has limitations in distinguishing ASD from other conditions, especially in very young children, and particularly in distinguishing ASD from childhood-onset schizophrenia.47 Similarly, ADOS, which is a semi-structured, standardized, observation assessment tool, also has limitations, including generating false-positive results, which can make it difficult to distinguish children and adolescents with developmental disabilities from those with ASD.47 However, in combination, these 2 tools are generally efficacious.47 Further research is warranted to develop and fine-tune definitive diagnostic tools with greater sensitivity and specificity.
A newer measure—the Autism Parent Screen for Infants (APSI) questionnaire—has been shown to be effective in detecting early signs predictive of ASD in high-risk infants (eg, siblings of children with ASD), and has potential as an early screening tool.48,49
Part 2 of this article will review nonpharmacologic and pharmacologic treatments for patients with ASD.
1. Bosl WJ, Tager-Flusberg H, Nelson CA. EEG analytics for early detection of autism spectrum disorder: a data-driven approach. Sci Rep. 2018;8(1):6828. doi:10.1038/s41598-018-24318-x
2. Dawson G, Carver L, Meltzoff AN, et al. Neural correlates of face and object recognition in young children with autism spectrum disorder, developmental delay, and typical development. Child Dev. 2002;73(3):700-717. doi:10.1111/1467-8624.00433
3. Frye RE, Vassall S, Kaur G, et al. Emerging biomarkers in autism spectrum disorder: a systematic review. Ann Transl Med. 2019;7(23):792. doi:10.21037/atm.2019.11.5
4. Gordon I, Vander Wyk BC, Bennett RH, et al. Oxytocin enhances brain function in children with autism. Proc Natl Acad Sci U S A. 2013;110(52):20953-20958. doi:10.1073/pnas.1312857110
5. Hicks SD, Carpenter RL, Wagner KE, et al. Saliva microRNA differentiates children with autism from peers with typical and atypical development. J Am Acad Child Adolesc Psychiatry. 2020;59(2):296-308.
6. Hyman SL, Levy SE, Myers SM, et al; Council on Children with Disabilities, Section on Developmental and Behavioral Pediatrics. Identification, evaluation, and management of children with autism spectrum disorder. Pediatrics. 2020;145(1):e20193447. doi:10.1542/peds.2019-3447
7. Kaiser MD, Hudac CM, Shultz S, et al. Neural signatures of autism. Proc Natl Acad Sci U S A. 2010;107(49):21223-1228. doi:10.1073/pnas.1010412107
8. Klin A, Lin DJ, Gorrindo P, et al. Two-year-olds with autism orient to non-social contingencies rather than biological motion. Nature. 2009;459(7244):257-261. doi:10.1038/nature07868
9. Chen T, Chen Y, Yuan M, et al. Towards developing a practical artificial intelligence tool for diagnosing and evaluating autism spectrum disorder: a study using multicenter ABIDE II datasets. JMIR Med Inform. 2020;8(5):e15767. doi:10.2196/15767
10. Maglione MA, Gans D, Das L, et al; Technical Expert Panel, & HRSA Autism Intervention Research – Behavioral (AIR‐B) Network. Nonmedical interventions for children with ASD: recommended guidelines and further research needs. Pediatrics. 2012;30(Suppl 2), S169-S178.
11. Monz BU, Houghton R, Law K, et al. Treatment patterns in children with autism in the United States. Autism Res. 2019;12(3):5170-526. doi:10.1002/aur.2070
12. Shukla DK, Keehn B, Lincoln AJ, et al. White matter compromise of callosal and subcortical fiber tracts in children with autism spectrum disorder: a diffusion tensor imaging study. J Am Acad Child Adolesc Psychiatry. 2010;49(12):1269-1278.e12782. doi:10.1016/j.jaac.2010.08.018
13. Sperdin HF, Schaer M. Aberrant development of speech processing in young children with autism: new insights from neuroimaging biomarkers. Front Neurosci. 2016;10:393. doi: 10.3389/fnins.2016.00393
14. Zwaigenbaum L, Brian JA, Ip A. Early detection for autism spectrum disorder in young children. Paediatr Child Health. 2019;24(7):424-443. doi:10.1093/pch/pxz119
15. Simms MD, Jin XM. Autism, language disorder, and social (pragmatic) communication disorder: DSM-V and differential diagnoses. Pediatr Rev. 2015;36(8):355-363. doi:10.1542/pir.36-8-355
16. Su Maw S, Haga C. Effectiveness of cognitive, developmental, and behavioural interventions for autism spectrum disorder in preschool-aged children: a systematic review and meta-analysis. Heliyon. 2018;4(9):e00763. doi:10.1016/j.heliyon.2018.e00763
17. Volkmar F, Siegel M, Woodbury-Smith M, et al. Practice parameter for the assessment and treatment of children and adolescents with autism spectrum disorder. J Am Acad Child Adolesc Psychiatry, 2014;53(2):237-257.
18. Landa RJ. Efficacy of early interventions for infants and young children with, and at risk for, autism spectrum disorders. Int Rev Psychiatry. 2018;30(1):25-39. doi:10.1080/09540261.2018.1432574
19. Lipkin PH, Macias MM; Council on Children with Disabilities, Section on Developmental and Behavioral Pediatrics. Promoting optimal development: identifying infants and young children with developmental disorders through developmental surveillance and screening. Pediatrics. 2020;145(1)e20193449. doi:10.1542/peds.2019-3449
20. Pickles A, Le Couteur A, Leadbitter K, et al. Parent-mediated social communication therapy for young children with autism (PACT): long-term follow-up of a randomised controlled trial. Lancet. 2016;388:2501-2509.
21. Rogers SJ, Estes A, Lord C, et al. Effects of a brief early start Denver model (ESDM)-based parent intervention on toddlers at risk for autism spectrum disorders: a randomized controlled trial. J Am Acad Child Adolesc Psychiatry. 2012;51(10):1052-1065. doi:10.1016/j.jaac.2012.08.003
22. Schreibman L, Dawson G, Stahmer AC, et al. Naturalistic developmental behavioral interventions: empirically validated treatments for autism spectrum disorder. J Autism Dev Disord. 2015;45(8):2411-2428. doi:10.1007/s10803-015-2407-8
23. Mundy P. A review of joint attention and social-cognitive brain systems in typical development and autism spectrum disorder. Eur J Neurosci. 2018;47(6):497-514.
24. Zwaigenbaum L, Bryson SE, Brian J, et al. Stability of diagnostic assessment for autism spectrum disorder between 18 and 36 months in a high-risk cohort. Autism Res. 2016;9(7):790-800. doi:10.1002/aur.1585
25. Anderson DK, Liang JW, Lord C. Predicting young adult outcome among more and less cognitively able individuals with autism spectrum disorders. J Child Psychol Psychiatry. 2014;55(5):485-494. doi:10.1111/jcpp.12178
26. Jones W, Carr K, Klin A. Absence of preferential looking to the eyes of approaching adults predicts level of social disability in 2-year-old toddlers with autism spectrum disorder. Arch Gen Psychiatry. 2008;65(8):946-954. doi:10.1001/archpsyc.65.8.946
27. Van der Donck S, Dzhelyova M, Vettori S, et al. Rapid neural categorization of angry and fearful faces is specifically impaired in boys with autism spectrum disorder. J Child Psychol Psychiatry. 2020;61(9):1019-1029. doi:10.1111/jcpp.13201
28. Thurm A, Farmer C, Salzman E, et al. State of the field: differentiating intellectual disability from autism spectrum disorder. Front Psychiatry. 2019;10:526. doi:10.3389/fpsyt.2019.00526
29. Kuno-Fujita A, Iwabuchi T, Wakusawa K, et al. Sensory processing patterns and fusiform activity during face processing in autism spectrum disorder. Autism Res. 2020;13(5):741-750. doi: 10.1002/aur.2283
30. Abrams DA, Lynch CJ, Cheng KM, et al. Underconnectivity between voice-selective cortex and reward circuitry in children with autism. Proc Natl Acad Sci U S A. 2013;110(29):12060-12065. doi:10.1073/pnas.1302982110
31. Osterling J, Dawson G. Early recognition of children with autism: a study of first birthday home videotapes. J Autism Dev Disord. 1994;24(3):247-257.
32. Zampella CJ, Csumitta KD, Simon E, et al. Interactional synchrony and its association with social and communication ability in children with and without autism spectrum disorder. J Autism Dev Disord. 2020;50(9):3195-3206. doi:10.1007/s10803-020-04412-8
33. McFayden T, Jarrett MA, White SW, et al. Sluggish cognitive tempo in autism spectrum disorder, ADHD, and their comorbidity: implications for impairment. J Clin Child Adolesc Psychol. 2020:1-8. doi:10.1080/15374416.2020.1716365
34. Baribeau DA, Vigod S, Pullenayegum E, et al. Repetitive behavior severity as an early indicator of risk for elevated anxiety symptoms in autism spectrum disorder. J Am Acad Child Adolesc Psychiatry. 2020;59(7):890-899.e3. doi:10.1016/j.jaac.2019.08.478
35. Li Y, Zhou Z, Chang C, et al. Anomalies in uncinate fasciculus development and social defects in preschoolers with autism spectrum disorder. BMC Psychiatry. 2019;19(1):399. doi:10.1186/s12888-019-2391-1
36. Payabvash S, Palacios EM, Owen JP, et al. White matter connectome edge density in children with autism spectrum disorders: potential imaging biomarkers using machine-learning models. Brain Connect. 2019;9(2):209-220. doi:10.1089/brain.2018.0658
37. Andrews DS, Lee JK, Solomon M, et al. A diffusion-weighted imaging tract-based spatial statistics study of autism spectrum disorder in preschool-aged children. J Neurodev Disord. 2019;11(1):32. doi:10.1186/s11689-019-9291-z
38. Chevallier C, Kohls G, Troiani V, et al. The social motivation theory of autism. Trends Cogn Sci. 2012;16(4):231-239. doi:10.1016/j.tics.2012.02.007
39. Boddaert N, Chabane N, Gervais H, et al. Superior temporal sulcus anatomical abnormalities in childhood autism: a voxel-based morphometry MRI study. Neuroimage. 2004;23(1):364-369. doi:10.1016/j.neuroimage.2004.06.016
40. Lord C, Petkova E, Hus V, et al. A multisite study of the clinical diagnosis of different autism spectrum disorders. Arch Gen Psychiatry. 2012;69(3):306-313. doi:10.1001/archgenpsychiatry.2011.148
41. Trillingsgaard A, ØStergaard JR. Autism in Angelman syndrome: an exploration of comorbidity. Autism. 2004;8(2):163-174.
42. Moss J, Howlin P. Autism spectrum disorders in genetic syndromes: implications for diagnosis, intervention and understanding the wider autism spectrum disorder population. J Intellect Disabil Res. 2009;53(10):852-873. doi:10.1111/j.1365-2788.2009.01197.x
43. McDuffie A, Thurman AJ, Hagerman RJ, et al. Symptoms of autism in males with Fragile X syndrome: a comparison to nonsyndromic ASD using current ADI-R scores. J Autism Dev Disord. 2015;45(7):1925-1937. doi:10.1007/s10803-013-2013-6
44. Ashwood KL, Tye C, Azadi B, et al. Brief report: adaptive functioning in children with ASD, ADHD and ASD + ADHD. J Autism Dev Disord. 2015;45(7):2235-4222. doi:10.1007/s10803-014-2352-y
45. Guthrie W, Wallis K, Bennett A, et al. Accuracy of autism screening in a large pediatric network. Pediatrics. 2019;144(4): e20183963. doi:10.1542/peds.2018-3963
46. Brian JA, Zwaigenbaum L, Ip A. Standards of diagnostic assessment for autism spectrum disorder. Paediatr Child Health. 2019;24(7):444-460. doi:10.1093/pch/pxz117
47. Frigaux A, Evrard R, Lighezzolo-Alnot J. ADI-R and ADOS and the differential diagnosis of autism spectrum disorders: interests, limits and openings. Encephale. 2019;45(5):441-448. doi:10.1016/j.encep.2019.07.002
48. Sacrey LR, Zwaigenbaum L, Bryson S, et al. Screening for behavioral signs of autism spectrum disorder in 9-month-old infant siblings. J Autism Dev Disord. 2021;51(3):839-848. doi:10.1007/s10803-020-04371-0
49. Sacrey LR, Bryson S, Zwaigenbaum L, et al. The autism parent screen for infants: predicting risk of autism spectrum disorder based on parent-reported behavior observed at 6-24 months of age. Autism. 2018;22(3):322-334
1. Bosl WJ, Tager-Flusberg H, Nelson CA. EEG analytics for early detection of autism spectrum disorder: a data-driven approach. Sci Rep. 2018;8(1):6828. doi:10.1038/s41598-018-24318-x
2. Dawson G, Carver L, Meltzoff AN, et al. Neural correlates of face and object recognition in young children with autism spectrum disorder, developmental delay, and typical development. Child Dev. 2002;73(3):700-717. doi:10.1111/1467-8624.00433
3. Frye RE, Vassall S, Kaur G, et al. Emerging biomarkers in autism spectrum disorder: a systematic review. Ann Transl Med. 2019;7(23):792. doi:10.21037/atm.2019.11.5
4. Gordon I, Vander Wyk BC, Bennett RH, et al. Oxytocin enhances brain function in children with autism. Proc Natl Acad Sci U S A. 2013;110(52):20953-20958. doi:10.1073/pnas.1312857110
5. Hicks SD, Carpenter RL, Wagner KE, et al. Saliva microRNA differentiates children with autism from peers with typical and atypical development. J Am Acad Child Adolesc Psychiatry. 2020;59(2):296-308.
6. Hyman SL, Levy SE, Myers SM, et al; Council on Children with Disabilities, Section on Developmental and Behavioral Pediatrics. Identification, evaluation, and management of children with autism spectrum disorder. Pediatrics. 2020;145(1):e20193447. doi:10.1542/peds.2019-3447
7. Kaiser MD, Hudac CM, Shultz S, et al. Neural signatures of autism. Proc Natl Acad Sci U S A. 2010;107(49):21223-1228. doi:10.1073/pnas.1010412107
8. Klin A, Lin DJ, Gorrindo P, et al. Two-year-olds with autism orient to non-social contingencies rather than biological motion. Nature. 2009;459(7244):257-261. doi:10.1038/nature07868
9. Chen T, Chen Y, Yuan M, et al. Towards developing a practical artificial intelligence tool for diagnosing and evaluating autism spectrum disorder: a study using multicenter ABIDE II datasets. JMIR Med Inform. 2020;8(5):e15767. doi:10.2196/15767
10. Maglione MA, Gans D, Das L, et al; Technical Expert Panel, & HRSA Autism Intervention Research – Behavioral (AIR‐B) Network. Nonmedical interventions for children with ASD: recommended guidelines and further research needs. Pediatrics. 2012;30(Suppl 2), S169-S178.
11. Monz BU, Houghton R, Law K, et al. Treatment patterns in children with autism in the United States. Autism Res. 2019;12(3):5170-526. doi:10.1002/aur.2070
12. Shukla DK, Keehn B, Lincoln AJ, et al. White matter compromise of callosal and subcortical fiber tracts in children with autism spectrum disorder: a diffusion tensor imaging study. J Am Acad Child Adolesc Psychiatry. 2010;49(12):1269-1278.e12782. doi:10.1016/j.jaac.2010.08.018
13. Sperdin HF, Schaer M. Aberrant development of speech processing in young children with autism: new insights from neuroimaging biomarkers. Front Neurosci. 2016;10:393. doi: 10.3389/fnins.2016.00393
14. Zwaigenbaum L, Brian JA, Ip A. Early detection for autism spectrum disorder in young children. Paediatr Child Health. 2019;24(7):424-443. doi:10.1093/pch/pxz119
15. Simms MD, Jin XM. Autism, language disorder, and social (pragmatic) communication disorder: DSM-V and differential diagnoses. Pediatr Rev. 2015;36(8):355-363. doi:10.1542/pir.36-8-355
16. Su Maw S, Haga C. Effectiveness of cognitive, developmental, and behavioural interventions for autism spectrum disorder in preschool-aged children: a systematic review and meta-analysis. Heliyon. 2018;4(9):e00763. doi:10.1016/j.heliyon.2018.e00763
17. Volkmar F, Siegel M, Woodbury-Smith M, et al. Practice parameter for the assessment and treatment of children and adolescents with autism spectrum disorder. J Am Acad Child Adolesc Psychiatry, 2014;53(2):237-257.
18. Landa RJ. Efficacy of early interventions for infants and young children with, and at risk for, autism spectrum disorders. Int Rev Psychiatry. 2018;30(1):25-39. doi:10.1080/09540261.2018.1432574
19. Lipkin PH, Macias MM; Council on Children with Disabilities, Section on Developmental and Behavioral Pediatrics. Promoting optimal development: identifying infants and young children with developmental disorders through developmental surveillance and screening. Pediatrics. 2020;145(1)e20193449. doi:10.1542/peds.2019-3449
20. Pickles A, Le Couteur A, Leadbitter K, et al. Parent-mediated social communication therapy for young children with autism (PACT): long-term follow-up of a randomised controlled trial. Lancet. 2016;388:2501-2509.
21. Rogers SJ, Estes A, Lord C, et al. Effects of a brief early start Denver model (ESDM)-based parent intervention on toddlers at risk for autism spectrum disorders: a randomized controlled trial. J Am Acad Child Adolesc Psychiatry. 2012;51(10):1052-1065. doi:10.1016/j.jaac.2012.08.003
22. Schreibman L, Dawson G, Stahmer AC, et al. Naturalistic developmental behavioral interventions: empirically validated treatments for autism spectrum disorder. J Autism Dev Disord. 2015;45(8):2411-2428. doi:10.1007/s10803-015-2407-8
23. Mundy P. A review of joint attention and social-cognitive brain systems in typical development and autism spectrum disorder. Eur J Neurosci. 2018;47(6):497-514.
24. Zwaigenbaum L, Bryson SE, Brian J, et al. Stability of diagnostic assessment for autism spectrum disorder between 18 and 36 months in a high-risk cohort. Autism Res. 2016;9(7):790-800. doi:10.1002/aur.1585
25. Anderson DK, Liang JW, Lord C. Predicting young adult outcome among more and less cognitively able individuals with autism spectrum disorders. J Child Psychol Psychiatry. 2014;55(5):485-494. doi:10.1111/jcpp.12178
26. Jones W, Carr K, Klin A. Absence of preferential looking to the eyes of approaching adults predicts level of social disability in 2-year-old toddlers with autism spectrum disorder. Arch Gen Psychiatry. 2008;65(8):946-954. doi:10.1001/archpsyc.65.8.946
27. Van der Donck S, Dzhelyova M, Vettori S, et al. Rapid neural categorization of angry and fearful faces is specifically impaired in boys with autism spectrum disorder. J Child Psychol Psychiatry. 2020;61(9):1019-1029. doi:10.1111/jcpp.13201
28. Thurm A, Farmer C, Salzman E, et al. State of the field: differentiating intellectual disability from autism spectrum disorder. Front Psychiatry. 2019;10:526. doi:10.3389/fpsyt.2019.00526
29. Kuno-Fujita A, Iwabuchi T, Wakusawa K, et al. Sensory processing patterns and fusiform activity during face processing in autism spectrum disorder. Autism Res. 2020;13(5):741-750. doi: 10.1002/aur.2283
30. Abrams DA, Lynch CJ, Cheng KM, et al. Underconnectivity between voice-selective cortex and reward circuitry in children with autism. Proc Natl Acad Sci U S A. 2013;110(29):12060-12065. doi:10.1073/pnas.1302982110
31. Osterling J, Dawson G. Early recognition of children with autism: a study of first birthday home videotapes. J Autism Dev Disord. 1994;24(3):247-257.
32. Zampella CJ, Csumitta KD, Simon E, et al. Interactional synchrony and its association with social and communication ability in children with and without autism spectrum disorder. J Autism Dev Disord. 2020;50(9):3195-3206. doi:10.1007/s10803-020-04412-8
33. McFayden T, Jarrett MA, White SW, et al. Sluggish cognitive tempo in autism spectrum disorder, ADHD, and their comorbidity: implications for impairment. J Clin Child Adolesc Psychol. 2020:1-8. doi:10.1080/15374416.2020.1716365
34. Baribeau DA, Vigod S, Pullenayegum E, et al. Repetitive behavior severity as an early indicator of risk for elevated anxiety symptoms in autism spectrum disorder. J Am Acad Child Adolesc Psychiatry. 2020;59(7):890-899.e3. doi:10.1016/j.jaac.2019.08.478
35. Li Y, Zhou Z, Chang C, et al. Anomalies in uncinate fasciculus development and social defects in preschoolers with autism spectrum disorder. BMC Psychiatry. 2019;19(1):399. doi:10.1186/s12888-019-2391-1
36. Payabvash S, Palacios EM, Owen JP, et al. White matter connectome edge density in children with autism spectrum disorders: potential imaging biomarkers using machine-learning models. Brain Connect. 2019;9(2):209-220. doi:10.1089/brain.2018.0658
37. Andrews DS, Lee JK, Solomon M, et al. A diffusion-weighted imaging tract-based spatial statistics study of autism spectrum disorder in preschool-aged children. J Neurodev Disord. 2019;11(1):32. doi:10.1186/s11689-019-9291-z
38. Chevallier C, Kohls G, Troiani V, et al. The social motivation theory of autism. Trends Cogn Sci. 2012;16(4):231-239. doi:10.1016/j.tics.2012.02.007
39. Boddaert N, Chabane N, Gervais H, et al. Superior temporal sulcus anatomical abnormalities in childhood autism: a voxel-based morphometry MRI study. Neuroimage. 2004;23(1):364-369. doi:10.1016/j.neuroimage.2004.06.016
40. Lord C, Petkova E, Hus V, et al. A multisite study of the clinical diagnosis of different autism spectrum disorders. Arch Gen Psychiatry. 2012;69(3):306-313. doi:10.1001/archgenpsychiatry.2011.148
41. Trillingsgaard A, ØStergaard JR. Autism in Angelman syndrome: an exploration of comorbidity. Autism. 2004;8(2):163-174.
42. Moss J, Howlin P. Autism spectrum disorders in genetic syndromes: implications for diagnosis, intervention and understanding the wider autism spectrum disorder population. J Intellect Disabil Res. 2009;53(10):852-873. doi:10.1111/j.1365-2788.2009.01197.x
43. McDuffie A, Thurman AJ, Hagerman RJ, et al. Symptoms of autism in males with Fragile X syndrome: a comparison to nonsyndromic ASD using current ADI-R scores. J Autism Dev Disord. 2015;45(7):1925-1937. doi:10.1007/s10803-013-2013-6
44. Ashwood KL, Tye C, Azadi B, et al. Brief report: adaptive functioning in children with ASD, ADHD and ASD + ADHD. J Autism Dev Disord. 2015;45(7):2235-4222. doi:10.1007/s10803-014-2352-y
45. Guthrie W, Wallis K, Bennett A, et al. Accuracy of autism screening in a large pediatric network. Pediatrics. 2019;144(4): e20183963. doi:10.1542/peds.2018-3963
46. Brian JA, Zwaigenbaum L, Ip A. Standards of diagnostic assessment for autism spectrum disorder. Paediatr Child Health. 2019;24(7):444-460. doi:10.1093/pch/pxz117
47. Frigaux A, Evrard R, Lighezzolo-Alnot J. ADI-R and ADOS and the differential diagnosis of autism spectrum disorders: interests, limits and openings. Encephale. 2019;45(5):441-448. doi:10.1016/j.encep.2019.07.002
48. Sacrey LR, Zwaigenbaum L, Bryson S, et al. Screening for behavioral signs of autism spectrum disorder in 9-month-old infant siblings. J Autism Dev Disord. 2021;51(3):839-848. doi:10.1007/s10803-020-04371-0
49. Sacrey LR, Bryson S, Zwaigenbaum L, et al. The autism parent screen for infants: predicting risk of autism spectrum disorder based on parent-reported behavior observed at 6-24 months of age. Autism. 2018;22(3):322-334
Beyond diabetes: The beneficial uses of metformin in psychiatry
Metabolic dysregulation is quite common among psychiatric patients, especially those with psychotic or mood disorders. Obesity, diabetes, and dyslipidemia can be present at the onset of the illness, or as an iatrogenic complication. This often leads to premature mortality due to elevated cardiovascular and cerebrovascular risks.
Enter metformin. It is the most widely used hypoglycemic agent for type 2 diabetes (T2D), and it is frequently used by psychiatric clinicians. Discovered in 1922 and developed in France in the 1950s, metformin was approved for use in the United States in 1995, 3 decades after its launch in Europe. Its original trade name in the United States was Glucophage, and it is currently available from several companies in generic form. It is included on the World Health Organization list of essential medications.
T2D is currently an epidemic across the general populations globally, especially in the United States, where approximately 95% of the 37 million individuals with diabetes have been diagnosed with T2D.1 This is 300% higher than the prevalence in the 1970s. No wonder metformin is one of the most often-used drugs in all of medicine, and a staple in primary care and psychiatry. It has helped countless patients avoid the multisystem hazards of insulin resistance, which is the root cause of T2D.
Metformin exerts its hypoglycemic effects by:
- decreasing glucose production from the liver
- increasing insulin receptors’ sensitivity in various body tissues
- increasing secretion of growth differentiating factor, which reduces appetite and calorie intake.
In 2017, the American College of Physicians updated its guidelines to adopt metformin as the first-line treatment for T2D, especially because the class of sulfonylureas were associated with a more than 5-fold higher risk of severe low blood sugar events compared with metformin.2 In addition, metformin causes weight loss, while sulfonylureas are associated with weight gain. Metformin is particularly useful in gestational diabetes, where babies are born with less visceral fat and are less prone to insulin resistance later in life as adults.
The adverse effects of metformin are dose-related and mostly gastrointestinal (GI), including nausea, vomiting, cramps, diarrhea, and flatulence. Gradual titration or using the extended-release formulation can lower or avert GI discomfort. Metformin should not be used in patients with severe kidney or liver disease. With long-term use, metformin can cause malabsorption and eventual deficiency of vitamin B12.
The metabolic benefits of metformin listed below are why psychiatrists use it in clinical practice. However, this medication has several benefits that go beyond metabolic disorders. Clinicians should be aware of all of the following salutary physical and mental effects of metformin.
Metabolic benefits
- Decreasing glucose dysregulation with the use of clozapine and other antipsychotics.3
- Decreasing weight, body mass index, and waist circumference with the use of clozapine.4
- Decreasing triglycerides and total cholesterol.5
- Mitigating clozapine-induced obesity, especially if used prophylactically.6
- Lowering antipsychotic-induced weight gain.7
Continue on to: Nonmetabolic benefits...
Nonmetabolic benefits
- Lowering elevated serum prolactin levels to avert sexual dysfunction.8-10
- Increasing the production of neurons by inducing neurogenesis.11,12
- Activating the cerebral cortex to blunt the adverse effects of clozapine (such as deterioration of motivation, attention, cognition, and behavior) and increasing the activity of the dopamine D1 receptor, which is believed to be involved with cognition in schizophrenia.13
- Reducing the symptoms of anxiety and depression by increasing serotonin activity and hippocampal concentration of serotonin.14
- Decreasing the depressive symptoms known to be associated with uncontrolled diabetes.15
- Improving insulin resistance associated with polycystic ovary syndrome and helping with infertility.16
- Exerting multiple anti-aging effects (Table17). Metformin reduces several hallmarks of aging and may increase longevity.17
- Lowering the risks of cancer, dementia, and mortality in patients with and without diabetes18 due to its anti-aging effects. Scientists are actively studying metformin’s anti-aging effects and trying to develop drugs with similar effects.
- Counteracting inflammatory bowel disease, osteoporosis, neurodegeneration, inflammation, frailty, and senescence.19
Metformin may sound like a wonder drug or panacea, but most of its multiple beneficial effects have been reported and replicated. Its therapeutic effects on obesity, diabetes, and dyslipidemia can prevent early mortality, but its anti-aging effects are also important and may help reduce premature mortality, which is common in psychiatric patients.20 So, the question arises: At some point, will metformin be used for persons not afflicted by diabetes or metabolic syndrome? For now, psychiatrists should continue to use it on label, but in the future, our patients may benefit from its “fringe benefits.”
1. Centers for Disease Control and Prevention. Type 2 diabetes. Accessed January 28, 2022. https://www.cdc.gov/diabetes/basics/type2.html
2. Qaseem A, Barry MJ, Humphrey LL, et al; Clinical Guidelines Committee of the American College of Physicians. Oral pharmacologic treatment of type 2 diabetes mellitus: a clinical practice guideline update from the American College of Physicians. Ann Intern Med. 2017;166(4):279-290.
3. Agarwal SM, Panda R, Costa-Dookhan KA, et al. Metformin for early comorbid glucose dysregulation and schizophrenia spectrum disorders: a pilot double-blind randomized clinical trial. Transl Psychiatry. 2021;11(1):219.
4. Hebrani P, Manteghi AA, Behdani F, et al. Double-blind, randomized, clinical trial of metformin as add-on treatment with clozapine in treatment of schizophrenia disorder. J Res Med Sci. 2015;20(4):364-371.
5. Jiang WL, Cai DB, Yin F, et al. Adjunctive metformin for antipsychotic-induced dyslipidemia: a meta-analysis of randomized, double-blind, placebo-controlled trials. Transl Psychiatry. 2020;10(1):117.
6. Siskind DJ, Leung J, Russell AW, et al. Metformin for clozapine associated obesity: a systematic review and meta-analysis. PLoS One. 2016;11(6):e0156208
7. de Silva VA, Suraweera C, Ratnatunga SS, et al. Metformin in prevention and treatment of antipsychotic induced weight gain: a systematic review and meta-analysis. BMC Psychiatry. 2016;16(1):341.
8. Zheng W, Yang XH, Cai DB, et al. Adjunctive metformin for antipsychotic-related hyperprolactinemia: a meta-analysis of randomized controlled trials. J Psychopharmacol. 2017;31(5):625-631.
9. Krysiak R, Kowalcze K, Szkrobka W, et al. The effect of metformin on prolactin levels in patients with drug-induced hyperprolactinemia. Eur J Intern Med. 2016;30:94-98.
10. Bo QJ, Wang ZM, Li XB, et al. Adjunctive metformin for antipsychotic-induced hyperprolactinemia: a systematic review. Psychiatry Res. 2016;237:257-263.
11. Wang J, Gallagher D, DeVito LM, et al. Metformin activates an atypical PKC-CBP pathway to promote neurogenesis and enhance spatial memory formation. Cell Stem Cell. 2012;11(1):23-35.
12. Fatt M, Hsu K, He L, et al. Metformin acts on two different molecular pathways to enhance adult neural precursor proliferation/self-renewal and differentiation. Stem Cell Reports. 2015;5(6):988-995.
13. Horvath G, Kis G, Kekesi G, et al. Interaction of clozapine with metformin in a schizophrenia rat model. Sci Rep. 2021;11(1):16862.
14. Zemdegs J, Martin H, Pintana H, et al. Metformin promotes anxiolytic and antidepressant-like responses in insulin-resistant mice by decreasing circulating branched-chain amino acids. J Neurosci. 2019;39(30):5935-5948.
15. B˘adescu SV, T˘ataru C, Kobylinska L, et al. The association between diabetes mellitus and depression. J Med Life. 2016;9(2):120-125.
16. Erensoy H, Niafar M, Ghafarzadeh S, et al. A pilot trial of metformin for insulin resistance and mood disturbances in adolescent and adult women with polycystic ovary syndrome. Gynecol Endocrinol. 2019;35(1):72-75.
17. Kulkarni AS, Gubbi S, Barzilai N. Benefits of metformin in attenuating the hallmarks of aging. Cell Metab. 2020;32(1):15-30.
18. Campbell JM, Bellman SM, Stephenson MD, et al. Metformin reduces all-cause mortality and diseases of ageing independent of its effect on diabetes control: a systematic review and meta-analysis. Ageing Res Rev. 2017;40:31-44.
19. Ala M, Ala M. Metformin for cardiovascular protection, inflammatory bowel disease, osteoporosis, periodontitis, polycystic ovarian syndrome, neurodegeneration, cancer, inflammation and senescence: what is next? ACS Pharmacol Transl Sci. 2021;4(6):1747-1770.
20. Nasrallah HA. Premature mortality across most psychiatric disorders. Current Psychiatry. 2019;8(10):9-10,12,34.
Metabolic dysregulation is quite common among psychiatric patients, especially those with psychotic or mood disorders. Obesity, diabetes, and dyslipidemia can be present at the onset of the illness, or as an iatrogenic complication. This often leads to premature mortality due to elevated cardiovascular and cerebrovascular risks.
Enter metformin. It is the most widely used hypoglycemic agent for type 2 diabetes (T2D), and it is frequently used by psychiatric clinicians. Discovered in 1922 and developed in France in the 1950s, metformin was approved for use in the United States in 1995, 3 decades after its launch in Europe. Its original trade name in the United States was Glucophage, and it is currently available from several companies in generic form. It is included on the World Health Organization list of essential medications.
T2D is currently an epidemic across the general populations globally, especially in the United States, where approximately 95% of the 37 million individuals with diabetes have been diagnosed with T2D.1 This is 300% higher than the prevalence in the 1970s. No wonder metformin is one of the most often-used drugs in all of medicine, and a staple in primary care and psychiatry. It has helped countless patients avoid the multisystem hazards of insulin resistance, which is the root cause of T2D.
Metformin exerts its hypoglycemic effects by:
- decreasing glucose production from the liver
- increasing insulin receptors’ sensitivity in various body tissues
- increasing secretion of growth differentiating factor, which reduces appetite and calorie intake.
In 2017, the American College of Physicians updated its guidelines to adopt metformin as the first-line treatment for T2D, especially because the class of sulfonylureas were associated with a more than 5-fold higher risk of severe low blood sugar events compared with metformin.2 In addition, metformin causes weight loss, while sulfonylureas are associated with weight gain. Metformin is particularly useful in gestational diabetes, where babies are born with less visceral fat and are less prone to insulin resistance later in life as adults.
The adverse effects of metformin are dose-related and mostly gastrointestinal (GI), including nausea, vomiting, cramps, diarrhea, and flatulence. Gradual titration or using the extended-release formulation can lower or avert GI discomfort. Metformin should not be used in patients with severe kidney or liver disease. With long-term use, metformin can cause malabsorption and eventual deficiency of vitamin B12.
The metabolic benefits of metformin listed below are why psychiatrists use it in clinical practice. However, this medication has several benefits that go beyond metabolic disorders. Clinicians should be aware of all of the following salutary physical and mental effects of metformin.
Metabolic benefits
- Decreasing glucose dysregulation with the use of clozapine and other antipsychotics.3
- Decreasing weight, body mass index, and waist circumference with the use of clozapine.4
- Decreasing triglycerides and total cholesterol.5
- Mitigating clozapine-induced obesity, especially if used prophylactically.6
- Lowering antipsychotic-induced weight gain.7
Continue on to: Nonmetabolic benefits...
Nonmetabolic benefits
- Lowering elevated serum prolactin levels to avert sexual dysfunction.8-10
- Increasing the production of neurons by inducing neurogenesis.11,12
- Activating the cerebral cortex to blunt the adverse effects of clozapine (such as deterioration of motivation, attention, cognition, and behavior) and increasing the activity of the dopamine D1 receptor, which is believed to be involved with cognition in schizophrenia.13
- Reducing the symptoms of anxiety and depression by increasing serotonin activity and hippocampal concentration of serotonin.14
- Decreasing the depressive symptoms known to be associated with uncontrolled diabetes.15
- Improving insulin resistance associated with polycystic ovary syndrome and helping with infertility.16
- Exerting multiple anti-aging effects (Table17). Metformin reduces several hallmarks of aging and may increase longevity.17
- Lowering the risks of cancer, dementia, and mortality in patients with and without diabetes18 due to its anti-aging effects. Scientists are actively studying metformin’s anti-aging effects and trying to develop drugs with similar effects.
- Counteracting inflammatory bowel disease, osteoporosis, neurodegeneration, inflammation, frailty, and senescence.19
Metformin may sound like a wonder drug or panacea, but most of its multiple beneficial effects have been reported and replicated. Its therapeutic effects on obesity, diabetes, and dyslipidemia can prevent early mortality, but its anti-aging effects are also important and may help reduce premature mortality, which is common in psychiatric patients.20 So, the question arises: At some point, will metformin be used for persons not afflicted by diabetes or metabolic syndrome? For now, psychiatrists should continue to use it on label, but in the future, our patients may benefit from its “fringe benefits.”
Metabolic dysregulation is quite common among psychiatric patients, especially those with psychotic or mood disorders. Obesity, diabetes, and dyslipidemia can be present at the onset of the illness, or as an iatrogenic complication. This often leads to premature mortality due to elevated cardiovascular and cerebrovascular risks.
Enter metformin. It is the most widely used hypoglycemic agent for type 2 diabetes (T2D), and it is frequently used by psychiatric clinicians. Discovered in 1922 and developed in France in the 1950s, metformin was approved for use in the United States in 1995, 3 decades after its launch in Europe. Its original trade name in the United States was Glucophage, and it is currently available from several companies in generic form. It is included on the World Health Organization list of essential medications.
T2D is currently an epidemic across the general populations globally, especially in the United States, where approximately 95% of the 37 million individuals with diabetes have been diagnosed with T2D.1 This is 300% higher than the prevalence in the 1970s. No wonder metformin is one of the most often-used drugs in all of medicine, and a staple in primary care and psychiatry. It has helped countless patients avoid the multisystem hazards of insulin resistance, which is the root cause of T2D.
Metformin exerts its hypoglycemic effects by:
- decreasing glucose production from the liver
- increasing insulin receptors’ sensitivity in various body tissues
- increasing secretion of growth differentiating factor, which reduces appetite and calorie intake.
In 2017, the American College of Physicians updated its guidelines to adopt metformin as the first-line treatment for T2D, especially because the class of sulfonylureas were associated with a more than 5-fold higher risk of severe low blood sugar events compared with metformin.2 In addition, metformin causes weight loss, while sulfonylureas are associated with weight gain. Metformin is particularly useful in gestational diabetes, where babies are born with less visceral fat and are less prone to insulin resistance later in life as adults.
The adverse effects of metformin are dose-related and mostly gastrointestinal (GI), including nausea, vomiting, cramps, diarrhea, and flatulence. Gradual titration or using the extended-release formulation can lower or avert GI discomfort. Metformin should not be used in patients with severe kidney or liver disease. With long-term use, metformin can cause malabsorption and eventual deficiency of vitamin B12.
The metabolic benefits of metformin listed below are why psychiatrists use it in clinical practice. However, this medication has several benefits that go beyond metabolic disorders. Clinicians should be aware of all of the following salutary physical and mental effects of metformin.
Metabolic benefits
- Decreasing glucose dysregulation with the use of clozapine and other antipsychotics.3
- Decreasing weight, body mass index, and waist circumference with the use of clozapine.4
- Decreasing triglycerides and total cholesterol.5
- Mitigating clozapine-induced obesity, especially if used prophylactically.6
- Lowering antipsychotic-induced weight gain.7
Continue on to: Nonmetabolic benefits...
Nonmetabolic benefits
- Lowering elevated serum prolactin levels to avert sexual dysfunction.8-10
- Increasing the production of neurons by inducing neurogenesis.11,12
- Activating the cerebral cortex to blunt the adverse effects of clozapine (such as deterioration of motivation, attention, cognition, and behavior) and increasing the activity of the dopamine D1 receptor, which is believed to be involved with cognition in schizophrenia.13
- Reducing the symptoms of anxiety and depression by increasing serotonin activity and hippocampal concentration of serotonin.14
- Decreasing the depressive symptoms known to be associated with uncontrolled diabetes.15
- Improving insulin resistance associated with polycystic ovary syndrome and helping with infertility.16
- Exerting multiple anti-aging effects (Table17). Metformin reduces several hallmarks of aging and may increase longevity.17
- Lowering the risks of cancer, dementia, and mortality in patients with and without diabetes18 due to its anti-aging effects. Scientists are actively studying metformin’s anti-aging effects and trying to develop drugs with similar effects.
- Counteracting inflammatory bowel disease, osteoporosis, neurodegeneration, inflammation, frailty, and senescence.19
Metformin may sound like a wonder drug or panacea, but most of its multiple beneficial effects have been reported and replicated. Its therapeutic effects on obesity, diabetes, and dyslipidemia can prevent early mortality, but its anti-aging effects are also important and may help reduce premature mortality, which is common in psychiatric patients.20 So, the question arises: At some point, will metformin be used for persons not afflicted by diabetes or metabolic syndrome? For now, psychiatrists should continue to use it on label, but in the future, our patients may benefit from its “fringe benefits.”
1. Centers for Disease Control and Prevention. Type 2 diabetes. Accessed January 28, 2022. https://www.cdc.gov/diabetes/basics/type2.html
2. Qaseem A, Barry MJ, Humphrey LL, et al; Clinical Guidelines Committee of the American College of Physicians. Oral pharmacologic treatment of type 2 diabetes mellitus: a clinical practice guideline update from the American College of Physicians. Ann Intern Med. 2017;166(4):279-290.
3. Agarwal SM, Panda R, Costa-Dookhan KA, et al. Metformin for early comorbid glucose dysregulation and schizophrenia spectrum disorders: a pilot double-blind randomized clinical trial. Transl Psychiatry. 2021;11(1):219.
4. Hebrani P, Manteghi AA, Behdani F, et al. Double-blind, randomized, clinical trial of metformin as add-on treatment with clozapine in treatment of schizophrenia disorder. J Res Med Sci. 2015;20(4):364-371.
5. Jiang WL, Cai DB, Yin F, et al. Adjunctive metformin for antipsychotic-induced dyslipidemia: a meta-analysis of randomized, double-blind, placebo-controlled trials. Transl Psychiatry. 2020;10(1):117.
6. Siskind DJ, Leung J, Russell AW, et al. Metformin for clozapine associated obesity: a systematic review and meta-analysis. PLoS One. 2016;11(6):e0156208
7. de Silva VA, Suraweera C, Ratnatunga SS, et al. Metformin in prevention and treatment of antipsychotic induced weight gain: a systematic review and meta-analysis. BMC Psychiatry. 2016;16(1):341.
8. Zheng W, Yang XH, Cai DB, et al. Adjunctive metformin for antipsychotic-related hyperprolactinemia: a meta-analysis of randomized controlled trials. J Psychopharmacol. 2017;31(5):625-631.
9. Krysiak R, Kowalcze K, Szkrobka W, et al. The effect of metformin on prolactin levels in patients with drug-induced hyperprolactinemia. Eur J Intern Med. 2016;30:94-98.
10. Bo QJ, Wang ZM, Li XB, et al. Adjunctive metformin for antipsychotic-induced hyperprolactinemia: a systematic review. Psychiatry Res. 2016;237:257-263.
11. Wang J, Gallagher D, DeVito LM, et al. Metformin activates an atypical PKC-CBP pathway to promote neurogenesis and enhance spatial memory formation. Cell Stem Cell. 2012;11(1):23-35.
12. Fatt M, Hsu K, He L, et al. Metformin acts on two different molecular pathways to enhance adult neural precursor proliferation/self-renewal and differentiation. Stem Cell Reports. 2015;5(6):988-995.
13. Horvath G, Kis G, Kekesi G, et al. Interaction of clozapine with metformin in a schizophrenia rat model. Sci Rep. 2021;11(1):16862.
14. Zemdegs J, Martin H, Pintana H, et al. Metformin promotes anxiolytic and antidepressant-like responses in insulin-resistant mice by decreasing circulating branched-chain amino acids. J Neurosci. 2019;39(30):5935-5948.
15. B˘adescu SV, T˘ataru C, Kobylinska L, et al. The association between diabetes mellitus and depression. J Med Life. 2016;9(2):120-125.
16. Erensoy H, Niafar M, Ghafarzadeh S, et al. A pilot trial of metformin for insulin resistance and mood disturbances in adolescent and adult women with polycystic ovary syndrome. Gynecol Endocrinol. 2019;35(1):72-75.
17. Kulkarni AS, Gubbi S, Barzilai N. Benefits of metformin in attenuating the hallmarks of aging. Cell Metab. 2020;32(1):15-30.
18. Campbell JM, Bellman SM, Stephenson MD, et al. Metformin reduces all-cause mortality and diseases of ageing independent of its effect on diabetes control: a systematic review and meta-analysis. Ageing Res Rev. 2017;40:31-44.
19. Ala M, Ala M. Metformin for cardiovascular protection, inflammatory bowel disease, osteoporosis, periodontitis, polycystic ovarian syndrome, neurodegeneration, cancer, inflammation and senescence: what is next? ACS Pharmacol Transl Sci. 2021;4(6):1747-1770.
20. Nasrallah HA. Premature mortality across most psychiatric disorders. Current Psychiatry. 2019;8(10):9-10,12,34.
1. Centers for Disease Control and Prevention. Type 2 diabetes. Accessed January 28, 2022. https://www.cdc.gov/diabetes/basics/type2.html
2. Qaseem A, Barry MJ, Humphrey LL, et al; Clinical Guidelines Committee of the American College of Physicians. Oral pharmacologic treatment of type 2 diabetes mellitus: a clinical practice guideline update from the American College of Physicians. Ann Intern Med. 2017;166(4):279-290.
3. Agarwal SM, Panda R, Costa-Dookhan KA, et al. Metformin for early comorbid glucose dysregulation and schizophrenia spectrum disorders: a pilot double-blind randomized clinical trial. Transl Psychiatry. 2021;11(1):219.
4. Hebrani P, Manteghi AA, Behdani F, et al. Double-blind, randomized, clinical trial of metformin as add-on treatment with clozapine in treatment of schizophrenia disorder. J Res Med Sci. 2015;20(4):364-371.
5. Jiang WL, Cai DB, Yin F, et al. Adjunctive metformin for antipsychotic-induced dyslipidemia: a meta-analysis of randomized, double-blind, placebo-controlled trials. Transl Psychiatry. 2020;10(1):117.
6. Siskind DJ, Leung J, Russell AW, et al. Metformin for clozapine associated obesity: a systematic review and meta-analysis. PLoS One. 2016;11(6):e0156208
7. de Silva VA, Suraweera C, Ratnatunga SS, et al. Metformin in prevention and treatment of antipsychotic induced weight gain: a systematic review and meta-analysis. BMC Psychiatry. 2016;16(1):341.
8. Zheng W, Yang XH, Cai DB, et al. Adjunctive metformin for antipsychotic-related hyperprolactinemia: a meta-analysis of randomized controlled trials. J Psychopharmacol. 2017;31(5):625-631.
9. Krysiak R, Kowalcze K, Szkrobka W, et al. The effect of metformin on prolactin levels in patients with drug-induced hyperprolactinemia. Eur J Intern Med. 2016;30:94-98.
10. Bo QJ, Wang ZM, Li XB, et al. Adjunctive metformin for antipsychotic-induced hyperprolactinemia: a systematic review. Psychiatry Res. 2016;237:257-263.
11. Wang J, Gallagher D, DeVito LM, et al. Metformin activates an atypical PKC-CBP pathway to promote neurogenesis and enhance spatial memory formation. Cell Stem Cell. 2012;11(1):23-35.
12. Fatt M, Hsu K, He L, et al. Metformin acts on two different molecular pathways to enhance adult neural precursor proliferation/self-renewal and differentiation. Stem Cell Reports. 2015;5(6):988-995.
13. Horvath G, Kis G, Kekesi G, et al. Interaction of clozapine with metformin in a schizophrenia rat model. Sci Rep. 2021;11(1):16862.
14. Zemdegs J, Martin H, Pintana H, et al. Metformin promotes anxiolytic and antidepressant-like responses in insulin-resistant mice by decreasing circulating branched-chain amino acids. J Neurosci. 2019;39(30):5935-5948.
15. B˘adescu SV, T˘ataru C, Kobylinska L, et al. The association between diabetes mellitus and depression. J Med Life. 2016;9(2):120-125.
16. Erensoy H, Niafar M, Ghafarzadeh S, et al. A pilot trial of metformin for insulin resistance and mood disturbances in adolescent and adult women with polycystic ovary syndrome. Gynecol Endocrinol. 2019;35(1):72-75.
17. Kulkarni AS, Gubbi S, Barzilai N. Benefits of metformin in attenuating the hallmarks of aging. Cell Metab. 2020;32(1):15-30.
18. Campbell JM, Bellman SM, Stephenson MD, et al. Metformin reduces all-cause mortality and diseases of ageing independent of its effect on diabetes control: a systematic review and meta-analysis. Ageing Res Rev. 2017;40:31-44.
19. Ala M, Ala M. Metformin for cardiovascular protection, inflammatory bowel disease, osteoporosis, periodontitis, polycystic ovarian syndrome, neurodegeneration, cancer, inflammation and senescence: what is next? ACS Pharmacol Transl Sci. 2021;4(6):1747-1770.
20. Nasrallah HA. Premature mortality across most psychiatric disorders. Current Psychiatry. 2019;8(10):9-10,12,34.
Nonpsychiatric indications for antidepressants and antipsychotics
Ms. A, age 45, is hospitalized for abdominal pain. She is noted to have hiccups, the onset of which she reports was >1 month ago and did not have a clear precipitant. Abdominal and head imaging return no acute findings, and data from a serum electrolyte test, hepatic function test, and thyroid function test are within normal limits. The medical team notices that Ms. A’s speech is pressured, she hardly sleeps, and she appears animated, full of ideas and energy.
Ms. A has a history of bipolar I disorder, hypertension, hyperlipidemia, gastroesophageal reflux disease, and hypothyroidism. Her present medications include hydrochlorothiazide 25 mg/d; levothyroxine 25 mcg/d; omeprazole 20 mg/d; and lovastatin 20 mg/d. She states that she was remotely treated for bipolar disorder, but she was cured by a shamanic healer, and therefore no longer needs treatment.
Approximately 35% of adults in the United States age 60 to 79 reported taking ≥5 prescription medications in 2016, compared to 15% of adults age 40 to 59.1 In a study of 372 patients with advanced, life-limiting illness, Schenker et al2 found that those who took multiple medications (mean: 11.6 medications) had a lower quality of life and worse symptoms. Optimizing medications to patients’ specific needs and diagnoses in order to reduce pill burden can be a favorable intervention. In addition, some patients—approximately 30% of those with schizophrenia and 20% of those with bipolar disorder—may not have insight into their mental illness as they do with their medical conditions, and may be more accepting of treatment for the latter.3 Dual-indication prescribing may be a useful way to decrease polypharmacy, reduce potential drug-drug interactions (DDIs), increase patient acceptance and adherence, and improve a patient’s overall health.
Continue on for: Multiple uses for antidepressants and antipsychotics...
Multiple uses for antidepressants and antipsychotics
One of the first medications discovered to have antidepressant effects was iproniazid, a monoamine oxidase inhibitor (MAOI) initially used to treat tuberculosis.4 Since then, numerous classes of antidepressant medications have been developed that capitalize on monoamine reuptake through several different mechanisms of action. These drugs can be grouped into subclasses that include selective serotonin reuptake inhibitors, serotonin-norepinephrine reuptake inhibitors, tricyclic antidepressants, MAOIs, and others. True to their roots in iproniazid, these medications can have a myriad of effects not limited to mental health and can therefore be beneficial for a variety of comorbid conditions.
As was the case with antidepressants, the first medication approved in the antipsychotic class, chlorpromazine, was serendipitously discovered to treat psychosis and agitation after being approved and used to treat presurgical apprehension.5 The term “antipsychotic” is almost a misnomer given these agents’ broad pharmacology profiles and impact on various mental illnesses, including bipolar disorder, depressive disorders, anxiety disorders, and many other mental conditions. First-generation antipsychotics (FGAs) were the first to enter the market; they work primarily by blocking dopamine-2 (D2) receptors. Second-generation antipsychotics have less movement-based adverse effects than FGAs by having higher affinity for serotonin 5-HT2A receptors than for D2 receptors. However, they tend to carry a higher risk for weight gain and metabolic syndrome.
Antidepressants and antipsychotics are widely utilized in psychiatry. Many have been found to have additional uses beyond their original FDA-approved indication and can therefore be beneficial for a variety of comorbid conditions.
One limitation of using psychiatric medications for nonpsychiatric indications is that different doses of antidepressants and antipsychotics are typically targeted for different indications based on receptor binding affinity. A common example of this is trazodone, where doses below 100 mg are used as needed for insomnia, but higher doses ranging from 200 to 600 mg/d are used for depression. Another important consideration is DDIs. For example, the possibility of adding an agent such as fluoxetine to a complex pain regimen for fibromyalgia could impact the clearance of other agents that are cytochrome P450 (CYP) 2D6 substrates due to fluoxetine’s potent inhibition of the enzyme.6,7 Table 16-51, Table 252-68, Table 369-107, and Table 4108-123 provide information on select antidepressants, while Table 5124-140 and Table 6141-171 provide information on select antipsychotics. Each table lists psychiatric and nonpsychiatric indications for the respective medications, including both FDA-approved (where applicable) and common off-label uses. Most of the indications listed are for adult use only, unless otherwise noted.
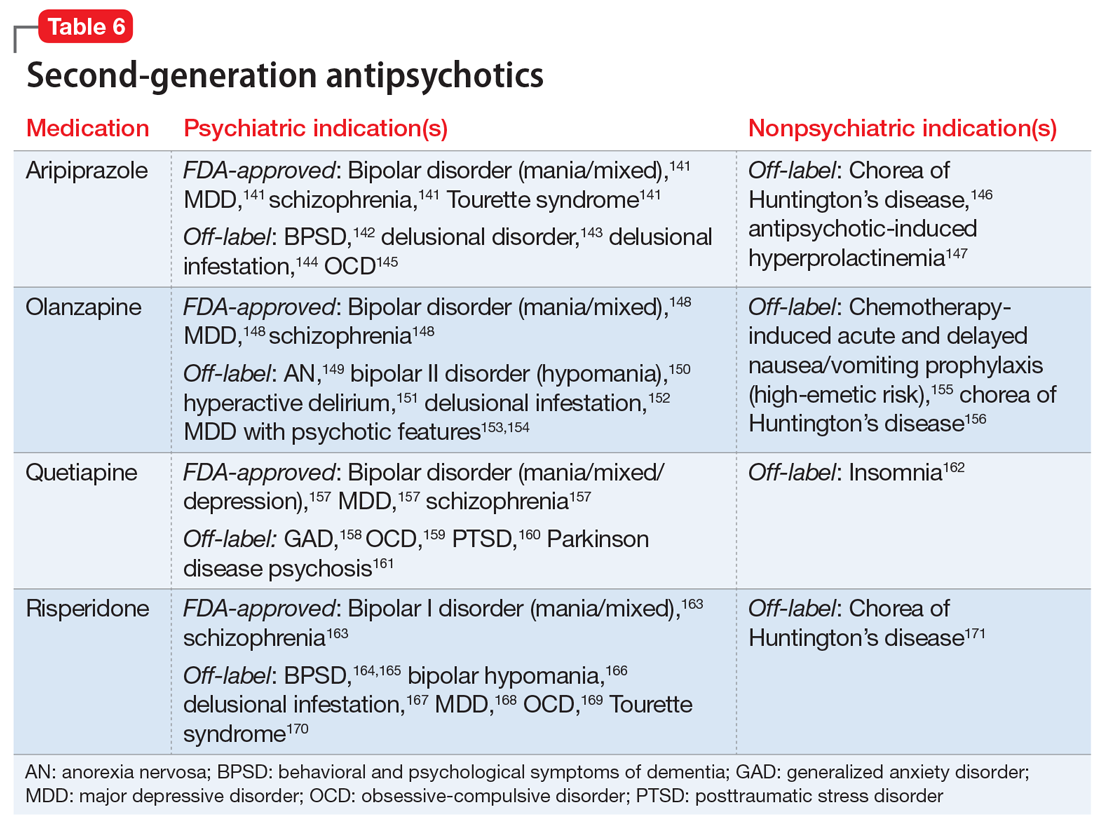
Continue on to: Case Continued...
CASE CONTINUED
After reviewing Ms. A’s medical history, the treatment team initiates chlorpromazine, 25 mg 3 times a day, for intractable hiccups, and increases the dosage to 50 mg 3 times a day after 3 days. Chlorpromazine is FDA-approved for treating bipolar mania, and also for treating intractable hiccups. Shortly thereafter, Ms. A’s hiccups subside, she sleeps for longer periods, and her manic symptoms resolve.
1. Hales CM, Servais J, Martin CB, et al. Prescription drug use among adults aged 40-79 in the United States and Canada. National Center for Health Statistics (Centers for Disease Control and Prevention). 2019. NCHS Data Brief No. 347. https://www.cdc.gov/nchs/products/databriefs/db347.htm
2. Schenker Y, Park SY, Jeong K, et al. Associations between polypharmacy, symptom burden, and quality of life in patients with advanced, life-limiting illness. J Gen Intern Med. 2019;34(4):559-566.
3. National Alliance on Mental Illness. Anosognosia. 2021. https://www.nami.org/About-Mental-Illness/Common-with-Mental-Illness/Anosognosia
4. Meyer JM. A concise guide to monoamine oxidase inhibitors. Current Psychiatry. 2017;16(12):14-16,18-23,47,A.
5. Ban TA. Fifty years chlorpromazine: a historical perspective. Neuropsychiatr Dis Treat. 2007;3(4):495-500.
6. Prozac [package insert]. Indianapolis, IN: Eli Lilly and Company; 2009.
7. Arnold LM, Hess EV, Hudson JI, et al. A randomized, placebo-controlled, double-blind, flexible-dose study of fluoxetine in the treatment of women with fibromyalgia. Am J Med. 2002;112(3):191-197.
8. Celexa [package insert]. St. Louis, MO: Forest Pharmaceuticals, Inc; 2009.
9. Porsteinsson AP, Drye LT, Pollock BG, et al. Effect of citalopram on agitation in Alzheimer disease: the CitAD randomized clinical trial. JAMA. 2014;311(7):682-691.
10. McElroy SL, Hudson JI, Malhotra S, et al. Citalopram in the treatment of binge-eating disorder: a placebo-controlled trial. J Clin Psychiatry. 2003;64(7):807-813.
11. Blank S, Lenze EJ, Mulsant BH, et al. Outcomes of late-life anxiety disorders during 32 weeks of citalopram treatment. J Clin Psychiatry. 2006;67(3):468-472.
12. Lenze EJ, Mulsant BH, Shear MK, et al. Efficacy and tolerability of citalopram in the treatment of late-life anxiety disorders: results from an 8-week randomized, placebo-controlled trial. Am J Psychiatry. 2005;162(1):146-150.
13. Montgomery SA, Kasper S, Stein DJ, et al. Citalopram 20 mg, 40 mg and 60 mg are all effective and well tolerated compared with placebo in obsessive-compulsive disorder. Int Clin Psychopharmacol. 2001;16(2):75-86.
14. Leinonen E, Lepola U, Koponen H, et al. Citalopram controls phobic symptoms in patients with panic disorder: randomized controlled trial. J Psychiatry Neurosci. 2000;25(1):24-32.
15. Perna G, Bertani A, Caldirola D, et al. A comparison of citalopram and paroxetine in the treatment of panic disorder: a randomized, single-blind study. Pharmacopsychiatry. 2001;34(3):85-90.
16. Wikander I, Sundblad C, Andersch B, et al. Citalopram in premenstrual dysphoria: is intermittent treatment during luteal phases more effective than continuous medication throughout the menstrual cycle? J Clin Psychopharmacol. 1998;18(5):390-398.
17. English BA, Jewell M, Jewell G, et al. Treatment of chronic posttraumatic stress disorder in combat veterans with citalopram: an open trial. J Clin Psychopharmacol. 2006;26(1):84-88.
18. Furmark T, Appel L, Michelgård A, et al. Cerebral blood flow changes after treatment of social phobia with neurokinin-1 antagonist GR205171, citalopram, or placebo. Biol Psychiatry. 2005;58(2):132-142.
19. Naranjo CA, Poulos CX, Bremner KE, et al. Citalopram decreases desirability, liking, and consumption of alcohol in alcohol-dependent drinkers. Clin Pharmacol Ther. 1992;51(6):729-739.
20. Safarinejad MR, Hosseini SY. Safety and efficacy of citalopram in the treatment of premature ejaculation: a double-blind placebo-controlled, fixed dose, randomized study. Int J Impot Res. 2006;18(2):164-169.
21. Shams T, Firwana B, Habib F, et al. SSRIs for hot flashes: a systematic review and meta-analysis of randomized trials. J Gen Intern Med. 2014;29(1):204-213.
22. Lexapro [package insert]. Irvine, CA: Allergan USA, Inc; 2016.
23. Guerdjikova AI, McElroy SL, Kotwal R, et al. High-dose escitalopram in the treatment of binge-eating disorder with obesity: a placebo-controlled monotherapy trial. Hum Psychopharmacol. 2008;23(1):1-11.
24. Aigner M, Treasure J, Kaye W, et al. World federation of societies of biological psychiatry (WFSBP) guidelines for pharmacological treatment of eating disorders. World J Biol Psychiatry. 2011;12:400-443.
25. Fineberg NA, Tonnoir B, Lemming O, et al. Escitalopram prevents relapse of obsessive-compulsive disorder. Eur Neuropsychopharmacol. 2007;17(6-7):430-439.
26. Stein DJ, Andersen EW, Tonnoir B, et al. Escitalopram in obsessive-compulsive disorder: a randomized, placebo-controlled, paroxetine-referenced, fixed-dose, 24-week study. Curr Med Res Opin. 2007;23(4):701-711.
27. Stahl SM, Gergel I, Li D. Escitalopram in the treatment of panic disorder: a randomized, double-blind, placebo-controlled trial. J Clin Psychiatry. 2003;64(11):1322-1327.
28. Freeman EW, Sondheimer SJ, Sammel MD, et al. A preliminary study of luteal phase versus symptom-onset dosing with escitalopram for premenstrual dysphoric disorder. J Clin Psychiatry. 2005;66(6):769-773.
29. Qi W, Gevonden M, Shalev A. Efficacy and tolerability of high-dose escitalopram in posttraumatic stress disorder. J Clin Psychopharmacol. 2017;37(1):89-93.
30. Carpenter JS, Guthrie KA, Larson JC, et al. Effect of escitalopram on hot flash interference: a randomized, controlled trial. Fertil Steril. 2012;97(6):1399-1404.
31. Freeman EW, Guthrie KA, Caan B, et al. Efficacy of escitalopram for hot flashes in healthy menopausal women: a randomized controlled trial. JAMA. 2011;305(3):267-274.
32. Arnold LM, McElroy SL, Hudson JI, et al. A placebo-controlled, randomized trial of fluoxetine in the treatment of binge-eating disorder. J Clin Psychiatry. 2002;63(11):1028-1033.
33. Connor KM, Sutherland SM, Tupler LA, et al. Fluoxetine in posttraumatic stress disorder. Randomized, double-blind study. Br J Psychiatry. 1999;175:17-22.
34. Martenyi F, Brown EB, Zhang H, et al. Fluoxetine versus placebo in posttraumatic stress disorder. J Clin Psychiatry. 2002;63(3):199-206.
35. Davidson JR, Foa EB, Huppert JD, et al. Fluoxetine, comprehensive cognitive behavioral therapy, and placebo in generalized social phobia. Arch Gen Psychiatry. 2004;61(10):1005-1013.
36. Kara H, Aydin S, Yücel M, et al. The efficacy of fluoxetine in the treatment of premature ejaculation: a double-blind placebo-controlled study. J Urol. 1996;156(5):1631-1632.
37. Loprinzi CL, Sloan JA, Perez EA, et al. Phase III evaluation of fluoxetine for treatment of hot flashes. J Clin Oncol. 2002;20(6):1578-1583.
38. Coleiro B, Marshall SE, Denton CP, et al. Treatment of Raynaud’s phenomenon with the selective serotonin reuptake inhibitor fluoxetine. Rheumatology (Oxford). 2001;40(9):1038-1043.
39. Paxil [package insert]. Research Triangle Park, NC: GlaxoSmithKline; 2019.
40. Zhang D, Cheng Y, Wu K, et al. Paroxetine in the treatment of premature ejaculation: a systematic review and meta-analysis. BMC Urol. 2019;19(1):2.
41. Walitt B, Urrútia G, Nishishinya MB. Selective serotonin reuptake inhibitors for fibromyalgia syndrome. Cochrane Database Syst Rev. 2015;(6):CD011735.
42. Foster CA, Bafaloukos J. Paroxetine in the treatment of chronic daily headache. Headache. 1994;34:587-589.
43. Zylicz Z, Krajnik M, Sorge A, et al. Paroxetine in the treatment of severe non-dermatological pruritus: a randomized, controlled trial. J Pain Symptom Manage. 2003;26(3):1105-1112.
44. Zoloft [package insert]. New York, NY: Pfizer; 2016.
45. Leombruni P, Pierò A, Lavagnino L, et al. A randomized, double-blind trial comparing sertraline and fluoxetine 6-month treatment in obese patients with binge eating disorder. Prog Neuropsychopharmacol Biol Psychiatry. 2008;32(6):1599-1605.
46. McElroy SL, Casuto LS, Nelson EB, et al. Placebo-controlled trial of sertraline in the treatment of binge eating disorder. Am J Psychiatry. 2000;157(6):1004-1006.
47. Milano W, Petrella C, Sabatino C, et al. Treatment of bulimia nervosa with sertraline: a randomized controlled trial. Adv Ther. 2004;21(4):232-237.
48. Brawman-Mintzer O, Knapp RG, Rynn M, et al. Sertraline treatment for generalized anxiety disorder: a randomized, double-blind, placebo-controlled study. J Clin Psychiatry. 2006;67(6):874-881.
49. McMahon CG. Treatment of premature ejaculation with sertraline hydrochloride: a single-blind placebo-controlled crossover study. J Urol. 1998;159(6):1935-1938.
50. Yi ZM, Chen SD, Tang QY, et al. Efficacy and safety of sertraline for the treatment of premature ejaculation: systematic review and meta-analysis. Medicine (Baltimore). 2019;98(23):e15989.
51. Uçeyler N, Häuser W, Sommer C. A systematic review on the effectiveness of treatment with antidepressants in fibromyalgia syndrome. Arthritis Rheum. 2008;59(9):1279-1298.
52. Pristiq [package insert]. Philadelphia, PA: Wyeth Pharmaceuticals, Inc; 2011.
53. Sun Z, Hao Y, Zhang M. Efficacy and safety of desvenlafaxine treatment for hot flashes associated with menopause: a meta-analysis of randomized controlled trials. Gynecol Obstet Invest. 2013;75(4):255-262.
54. Cymbalta [package insert]. Indianapolis, IN: Eli Lilly and Company; 2008.
55. Li J, Yang L, Pu C, et al. The role of duloxetine in stress urinary incontinence: a systemic review and meta-analysis. Int Urol Nephrol. 2013;45(3):679-686.
56. Filocamo MT, Li Marzi V, Del Popolo G, et al. Pharmacologic treatment in postprostatectomy stress urinary incontinence. Eur Urol. 2007;51(6):1559-1564.
57. Effexor XR [package insert]. Philadelphia, PA: Wyeth Pharmaceuticals, Inc; 2017.
58. Denys D, Van der Wee N, Van Megen HJ, et al. A double-blind comparison of venlafaxine and paroxetine in obsessive-compulsive disorder. J Clin Psychopharmacol. 2003;23(6):568-575.
59. Albert U, Aguglia E, Maina G, et al. Venlafaxine versus clomipramine in the treatment of obsessive-compulsive disorder: a preliminary single-blind, 12-week, controlled study. J Clin Psychiatry. 2002;63(11):1004-1009.
60. Davidson J, Baldwin D, Stein DJ, et al. Treatment of posttraumatic stress disorder with venlafaxine extended release: a 6-month randomized controlled trial. Arch Gen Psychiatry. 2006;63(10):1158-1165.
61. Zarinara AR, Mohammad MR, Hazrati N, et al. Venlafaxine versus methylphenidate in pediatric outpatients with attention deficit hyperactivity disorder: a randomized, double-blind comparison trial. Hum Psychopharmacol. 2010;25(7-8):530-535.
62. Mukaddes NM, Abali O. Venlafaxine in children and adolescents with attention deficit hyperactivity disorder. Psychiatry Clin Neurosci. 2004;58(1):92-95.
63. Cohen LS, Soares CN, Lyster A, et al. Efficacy and tolerability of premenstrual use of venlafaxine (flexible dose) in the treatment of premenstrual dysphoric disorder. J Clin Psychopharmacol. 2004;24(5):540-543.
64. Ozyalcin SN, Talu GK, Kiziltan E, et al. The efficacy and safety of venlafaxine in the prophylaxis of migraine. Headache. 2005;45(2):144-152.
65. Tarlaci S. Escitalopram and venlafaxine for the prophylaxis of migraine headache without mood disorders. Clin Neuropharmacol. 2009;32(5):254-258.
66. Kadiroglu AK, Sit D, Kayabasi H, et al. The effect of venlafaxine HCl on painful peripheral diabetic neuropathy in patients with type 2 diabetes mellitus. J Diabetes Complications. 2008;22(4):241-245.
67. Evans ML, Pritts E, Vittinghoff E, et al. Management of postmenopausal hot flushes with venlafaxine hydrochloride: a randomized, controlled trial. Obstet Gynecol. 2005;105(1):161-166.
68. Farshchian N, Alavi A, Heydarheydari S, et al. Comparative study of the effects of venlafaxine and duloxetine on chemotherapy-induced peripheral neuropathy. Cancer Chemother Pharmacol. 2018;82(5):787-793.
69. Amitriptyline Hydrochloride [package insert]. Princeton, NJ: Sandoz Inc; 2014.
70. Hauser W, Wolfe F, Tolle T, et al. The role of antidepressants in the management of fibromyalgia syndrome: a systemic review and meta-analysis. CNS Drugs. 2012;26(4):297-307.
71. Braak B, Klooker T, Lei A, et al. Randomised clinical trial: the effects of amitriptyline on drinking capacity and symptoms in patients with functional dyspepsia, a double-blind placebo-controlled study. Aliment Pharmacol Ther. 2011;34(6):638-648.
72. Van Ophoven A, Pokupic S, Heinecke A, et al. A prospective, randomized, placebo controlled, double-blind study of amitriptyline for the treatment of interstitial cystitis. J Urol. 2004;172(2):533-536.
73. Foster HE Jr, Hanno P, Nickel JC, et al; Interstitial Cystitis Collaborative Research Network. Effect of amitriptyline on symptoms in treatment naïve patients with interstitial cystitis/painful bladder syndrome. J Urol. 2010;183(5):1853-1858.
74. Vahedi H, Merat S, Momtahen S, et al. Clinical trial: the effect of amitriptyline in patients with diarrhoea-predominent irritable bowel syndrome. Aliment Pharmacol Ther. 2008;27(8):678-684.
75. Bulut S, Berilgen MS, Baran A, et al. Venlafaxine versus amitriptyline in the prophylactic treatment of migraine: a randomized, double-blind, crossover study. Clin Neurol Neurosurg. 2004;107(1):44-48.
76. Keskinbora K, Aydinli I. A double-blind randomized controlled trial of topiramate and amitriptyline either alone or in combination for the prevention of migraine. Clin Neurol Neurosurg. 2008;110(10):979-984.
77. Max MB, Lynch SA, Muir J, et al. Effects of desipramine, amitriptyline, and fluoxetine on pain in diabetic neuropathy. N Engl J Med. 1992;326(19):1250-1256.
78. Boyle J, Eriksson M, Gribble L, et al. Randomized, placebo-controlled comparison of amitriptyline, duloxetine, and pregabalin in patients with chronic diabetic peripheral neuropathic pain: impact on pain, polysomnographic sleep, daytime functioning, and quality of life. Diabetes Care. 2012;35(12):2451-2458.
79. Graff-Radford SB, Shaw LR, Naliboff BN. Amitriptyline and fluphenazine in the treatment of postherpetic neuralgia. Clin J Pain. 2000;16(3):188-192.
80. Watson CP, Evans RJ, Reed K, et al. Amitriptyline versus placebo in postherpetic neuralgia. Neurology. 1982;32(6):671-673.
81. Sinha S, Simlai J, Praharaj SK. Very low dose amitriptyline for clozapine-associated sialorrhea. Curr Drug Saf. 2016;11(3):262-263.
82. Amoxapine [package insert]. Parsippany, NJ: Watson Pharma, Inc; 2014.
83. Weinberg DS, Smalley W, Heidelbaugh JJ, et al. American Gastroenterological Association institute guideline on the pharmacological management of irritable bowel syndrome. Gastroenterology. 2014;147(5):1146-1148.
84. Anafranil (clomipramine hydrochloride) [package insert]. Whitby, Ontario: Patheon Inc; 2012.
85. Clomipramine dose-effect study in patients with depression: clinical end points and pharmacokinetics. Danish University Antidepressant Group (DUAG). Clin Pharmacol Ther. 1999;66(2):152-165.
86. Caillard V, Rouillon F, Viel J, et al. Comparative effects of low and high doses of clomipramine and placebo in panic disorder: a double-blind controlled study. Acta Psychiatr Scand. 1999;99(1):51-58.
87. Segraves RT, Saran A, Segraves K, et al. Clomipramine versus placebo in the treatment of premature ejaculation: a pilot study. J Sex Marital Therap. 1993;19(3):198-200.
88. Rowland DL, de Gouveia Brazao CA, Koos Slob A. Effective daily treatment with clomipramine in men with premature ejaculation when 25 mg (as required) is ineffective. BJU Int. 2001;87(4):357-360.
89. Norpramin (desipramine hydrochloride) [package insert]. Bridgewater, NJ: sanofi-aventis U.S. LLC; 2014.
90. Max MB, Kishore-Kumar R, Schafer SC, et al. Efficacy of desipramine in painful diabetic neuropathy: a placebo-controlled trial. Pain. 1991;45(1):3-9.
91. Drossman DA, Toner BB, Whitehead WE, et al. Cognitive-behavioral therapy versus education and desipramine versus placebo for moderate to severe functional bowel disorders. Gastroenterology. 2003;125(1):19-31.
92. Finnerup NB, Attal N, Haroutounian S, et al. Pharmacotherapy for neuropathic pain in adults: a systemic review and meta-analysis. Lancet Neurol. 2015;14(2):162-173.
93. Doxepin hydrochloride [package insert]. Morgantown, WV: Mylan Pharmaceuticals, Inc; 2014.
94. Goldsobel AB, Rohr AS, Siegel SC, et al. Efficacy of doxepin in the treatment of chronic idiopathic urticaria. J Allergy Clin Immunol. 1986;78(5 Pt 1):867-873.
95. Imipramine hydrochloride [package insert]. Fairfield, NJ: Excellium Pharmaceutical, Inc; 2012.
96. Pope HG Jr, Hudson JI, Jonas JM, et al. Bulimia treated with imipramine: a placebo-controlled, double-blind study. Am J Psychiatry. 1983;140(5):554-558.
97. Barlow DH, Gorman JM, Shear MK, et al. Cognitive-behavioral therapy, imipramine, or their combination for panic disorder: a randomized controlled trial. JAMA. 2000;283(19):2529-2536.
98. Laederach-Hofmann K, Graf C, Horber F, et al. Imipramine and diet counseling with psychological support in the treatment of obese binge eaters: a randomized, placebo-controlled double-blind study. Int J Eat Disord. 1999;26(3):231-244.
99. Sindrup SH, Bach FW, Madsen C, et al. Venlafaxine versus imipramine in painful polyneuropathy: a randomized, controlled trial. Neurology. 2003;60(8):1284-1289.
100. Lin HH, Sheu BC, Lo MC, et al. Comparison of treatment outcomes of imipramine for female genuine stress incontinence. Br J Obstet Gynaecol. 1999;106(10):1089-1092.
101. Pamelor (nortriptyline) [package insert]. Hazelwood, MO: Mallinckrodt Inc; 2007.
102. Spencer T, Biederman J, Wilens T, et al. Nortriptyline treatment of children with attention-deficit hyperactivity disorder and tic disorder or Tourette’s syndrome. J Am Acad Child Adolesc Psychiatry. 1993;32(1):205-210.
103. Atkinson JH, Slater MA, Williams RA, et al. A placebo-controlled randomized clinical trial of nortriptyline for chronic low back pain. Pain. 1998;76(3):287-296.
104. Desai MJ, Saini V, Saini S. Myofacial pain syndrome: a treatment review. Pain Ther. 2013;2(1):21-36.
105. Chandra K, Shafiq N, Pandhi P, et al. Gabapentin versus nortriptyline in post-herpetic neuralgia patients: a randomized, double-blind clinical trial – the GONIP trial. Int J Clin Pharmacol Ther. 2006;44(8):358-363.
106. Jorge RE, Robinson RG, Arndt S, et al. Mortality and poststroke depression: a placebo-controlled trial of antidepressants. Am J Psychiatry. 2003;160(10):1823-1829.
107. Martin MR, Schiff AA. Fluphenazine/nortriptyline in the irritable bladder syndrome. A double-blind placebo-controlled study. Br J Urol. 1984;56(2):178-179.
108. Wellbutrin (bupropion hydrochloride) [package insert]. Research Triangle Park, NC: GlaxoSmithKline; 2017.
109. Maneeton N, Maneeton B, Srisurapanont M, et al. Bupropion for adults with attention-deficit hyperactivity disorder: meta-analysis of randomized, placebo-controlled trials. Psychiatry Clin Neurosci. 2011;65(7):611-617.
110. Li DJ, Tseng PT, Chen YW, et al. Significant treatment effect of bupropion in patients with bipolar disorder but similar phase-shifting rate as other antidepressants: a meta-analysis following the PRISMA guidelines. Medicine (Baltimore). 2016;95(13):e3165.
111. Clayton AH, Warnock JK, Kornstein SG, et al. A placebo-controlled trial of bupropion SR as an antidote for selective serotonin reuptake inhibitor-induced sexual dysfunction. J Clin Psychiatry. 2004;65(1):62-67.
112. Safarinejad MR. Reversal of SSRI-induced female sexual dysfunction by adjunctive bupropion in menstruating women: a double-blind, placebo-controlled and randomized study. J Psychopharmacol. 2011;25(3):370-378.
113. Remeron (mirtazapine) [package insert]. Whitehouse Station, NJ: Merck & Co, Inc; 2020.
114. Boshuisen ML, Slaap BR, Vester-Blokland ED, et al. The effect of mirtazapine in panic disorder: an open label pilot study with a single-blind placebo run-in period. Int Clin Psychopharmacol. 2001;16(6):363-368.
115. Sarchiapone M, Amore M, De Risio S, et al. Mirtazapine in the treatment of panic disorder: an open-label trial. Int Clin Psychopharmacol. 2003;18(1):35-38.
116. Connor KM, Davidson JR, Weisler RH, et al. A pilot study of mirtazapine in post-traumatic stress disorder. Int Clin Psychopharmacol. 1999;14(1):29-31.
117. Wichniak A, Wierzbicka A, Walecka M, et al. Effects of antidepressants on sleep. Curr Psychiatry Rep. 2017;19(9):63.
118. Bedtsen L, Jensen R. Mirtazapine is effective in the prophylactic treatment of chronic tension-type headache. Neurology. 2004;62(10):1706-1711.
119. AbdelFattah MR, Jung SW, Greenspan MA, et al. Efficacy of antidepressants in the treatment of obstructive sleep apnea compared to placebo. A systemic review with meta-analysis. Sleep Breath. 2020;24(2):443-453.
120. Desyrel [package insert]. Locust Valley, NY: Pragma Pharmaceuticals, LLC; 2017.
121. Lebert F, Stekke W, Hasenbroekx C, et al. Frontotemporal dementia: a randomized, controlled trial with trazodone. Dement Geriatr Cogn Disord. 2004;17(4):355-359.
122. Sultzer DL, Gray KF, Gunay I, et al. A double-blind comparison of trazodone and haloperidol for treatment of agitation in patients with dementia. Am J Geriatr Psychiatry. 1997;5(1):60-69.
123. Yi XY, Ni SF, Ghadami MR, et al. Trazodone for the treatment of insomnia: a meta-analysis of randomized placebo-controlled trials. Sleep Med. 2018;45:25-32.
124. Chlorpromazine hydrochloride [package insert]. Minneapolis, MN: Upsher-Smith Laboratories, Inc; 2010.
125. Bigal ME, Bordini CA, Speciali JG. Intravenous chlorpromazine in the emergency department treatment of migraines: a randomized controlled trial. J Emerg Med. 2002;23(2):141-148.
126. Bell R, Montoya D, Shuaib A, et al. A comparative trial of three agents in the treatment of acute migraine headache. Ann Emerg Med. 1990;19(10):1079-1082.
127. Committee on Practice Bulletins-Obstetrics. ACOG Practice Bulletin No. 189: Nausea and vomiting of pregnancy. Obstet Gynecol. 2018;131(1):e15-e30.
128. Fluphenazine hydrochloride [package insert]. Philadelphia, PA: Lannett Company, Inc; 2019.
129. Bonelli RM, Wenning GK. Pharmacological management of Huntington’s disease: an evidence-based review. Curr Pharm Des. 2006;12(21):2701-2720.
130. Haldol [package insert]. Columbus, OH: American Health Packaging; 2020.
131. MacDonald K, Wilson M, Minassian A, et al. A naturalistic study for intramuscular haloperidol versus intramuscular olanzapine for the management of acute agitation. J Clin Psychopharmacol. 2012;32(3):317-322.
132. Goikolea JM, Colom F, Capapey J, et al. Faster onset of antimanic action with haloperidol compared to second-generation antipsychotics. A meta-analysis of randomized clinical trials in acute mania. Eur Neuropsychopharmacol. 2013;23(4):305-316.
133. Girard TD, Exline MC, Carson SS, et al. Haloperidol and ziprasidone for treatment of delirium in critical illness. N Engl J Med. 2018;379(26):2506-2516.
134. Lohr L. Chemotherapy-induced nausea and vomiting. Cancer J. 2008;14(2):85-93.
135. Büttner M, Walder B, von Elm E, et al. Is low-dose haloperidol a useful antiemetic?: A meta-analysis of published and unpublished randomized trials. Anesthesiology. 2004;101(6):1454-1463.
136. Perphenazine [package insert]. Princeton, NJ: Sandoz Inc; 2010.
137. Compazine [package insert]. Research Triangle Park, NC: GlaxoSmithKline; 2004.
138. Hesketh PJ. Chemotherapy-induced nausea and vomiting. N Engl J Med. 2008;358(23):2482-2494.
139. Chen JJ, Frame DG, White TJ. Efficacy of ondansetron and prochlorperazine for the prevention of postoperative nausea and vomiting after total hip replacement or total knee replacement procedures: a randomized, double-blind, comparative trial. Arch Intern Med. 1998;158(19):2124-2128.
140. Campbell K, Rowe H, Azzam H, et al. The management of nausea and vomiting of pregnancy. J Obstet Gynaecol Can. 2016;38(12):1127-1137.
141. Abilify [package insert]. Rockville, MD: Otsuka America Pharmaceutical, Inc; 2014.
142. Kinon BJ, Stauffer VL, Kollack-Walker S, et al. Olanzapine versus aripiprazole for the treatment of agitation in acutely ill patients with schizophrenia. J Clin Psychopharmacol. 2008;28(6):601-607.
143. Iannuzzi GL, Patel AA, Stewart JT. Aripiprazole and delusional disorder. J Psychiatr Pract. 2019;25(2):132-134.
144. Campbell EH, Elston DM, Hawthorne JD, et al. Diagnosis and management of delusional parasitosis. J Am Acad Dermatol. 2019;80(5):1428-1434.
145. Sayyah M, Sayyah M, Boostani H, et al. Effects of aripiprazole augmentation in treatment-resistant obsessive-compulsive disorder (a double-blind clinical trial). Depress Anxiety. 2012;29(10):850-854.
146. Lin WC, Chou YH. Aripiprazole effects on psychosis and chorea in a patient with Huntington’s disease. Am J Psychiatry. 2008;165(9):1207-1208.
147. Li X, Tang Y, Wang C. Adjunctive aripiprazole versus placebo for antipsychotic-induced hyperprolactinemia: meta-analysis of randomized controlled trials. PLoS One. 2013;8(8):e70179.
148. Zyprexa [package insert]. Indianapolis, IN: Eli Lilly and Company; 1997.
149. Attia E, Steinglass JE, Walsh BT, et al. Olanzapine versus placebo in adult outpatients with anorexia nervosa: a randomized clinical trial. Am J Psychiatry. 2019;176(6):449-456.
150. Dennehy EB, Doyle K, Suppes T. The efficacy of olanzapine monotherapy for acute hypomania or mania in an outpatient setting. Int Clin Psychopharmacol. 2003;18(3):143-145.
151. Grover S, Kumar V, Chakrabarti S. Comparative efficacy study of haloperidol, olanzapine and risperidone in delirium. J Psychosom Res. 2011;71(4):277-281.
152. Bosmans A, Verbanck P. Successful treatment of delusional disorder of the somatic type or “delusional parasitosis” with olanzapine. Pharmacopsychiatry. 2008;41(3):121-122.
153. Meyers BS, Flint AJ, Rothschild AJ, et al; STOP-PD Group. A double-blind randomized controlled trial of olanzapine plus sertraline vs olanzapine plus placebo for psychotic depression: the study of pharmacotherapy of psychotic depression (STOP-PD). Arch Gen Psychiatry. 2009;66(8):838-847.
154. Rothschild AJ, Williamson DJ, Tohen MF, et al. A double-blind, randomized study of olanzapine and olanzapine/fluoxetine combination for major depression with psychotic features. J Clin Psychopharmacol. 2004;24(4):365-373.
155. Navari RM, Gray SE, Kerr AC. Olanzapine versus aprepitant for the prevention of chemotherapy-induced nausea and vomiting: a randomized phase III trial. J Support Oncol. 2011;9(5):188-195.
156. Bonelli RM, Mahnert FA, Niederwieser G. Olanzapine for Huntington’s disease: an open label study. Clin Neuropharmacol. 2002;25(5):263-265.
157. Seroquel [package insert]. Wilmington, DE: AstraZeneca Pharmaceuticals LP; 2013.
158. Khan A, Atkinson S, Mezhebovsky I, et al. Extended-release quetiapine fumarate (quetiapine XR) as adjunctive therapy in patients with generalized anxiety disorder and a history of inadequate treatment response: a randomized, double-blind study. Ann Clin Psychiatry. 2014;26(1):3-18.
159. Dold M, Aigner M, Lanzenberger R, et al. Antipsychotic augmentation of serotonin reuptake inhibitors in treatment-resistant obsessive-compulsive disorder: a meta-analysis of double-blind, randomized, placebo-controlled trials. Int J Neuropsychopharmacol. 2013;16(3):557-574.
160. Villarreal G, Hamner MB, Cañive JM, et al. Efficacy of quetiapine monotherapy in posttraumatic stress disorder: a randomized, placebo-controlled trial. Am J Psychiatry. 2016;173(12):1205-1212.
161. Fernandez HH, Friedman JH, Jacques C, et al. Quetiapine for the treatment of drug-induced psychosis in Parkinson’s disease. Mov Disord. 1999;14(3):484-487.
162. Doroudgar S, Chou T, Yu J, et al. Evaluation of trazodone and quetiapine for insomnia: an observational study in psychiatric inpatients. Prim Care Companion CNS Disord. 2013;15(6):PCC.13m01558. doi: 10.4088/PCC.13m01558
163. Risperdal [package insert]. Titusville, NJ: Janssen Pharamceuticals, Inc; 2007.
164. Lim HK, Kim JJ, Pae CU, et al. Comparison of risperidone orodispersible tablet and intramuscular haloperidol in the treatment of acute psychotic agitation: a randomized open, prospective study. Neuropsychobiology. 2010;62(2):81-86.
165. Currier GW, Chou J, Feifel D, et al. Acute treatment of psychotic agitation: a randomized comparison of oral treatment with risperidone and lorazepam versus intramuscular treatment with haloperidol and lorazepam. J Clin Psychiatry. 2004;65(3):386-394.
166. Bahk WM, Yoon JS, Kim YH, et al. Risperidone in combination with mood stabilizers for acute mania: a multicentre, open study. Int Clin Psychopharmacol. 2004;19(5):299-303.
167. Freudenmann RW, Lepping P. Second-generation antipsychotics in primary and secondary delusional parasitosis: outcome and efficacy. J Clin Psychopharmacol. 2008;28(5):500-508.
168. Nelson JC, Papakostas GI. Atypical antipsychotic augmentation in major depressive disorder: a meta-analysis of placebo-controlled randomized trials. Am J Psychiatry. 2009;166(9): 980-991.
169. McDougle CJ, Epperson CN, Pelton GH, et al. A double-blind, placebo-controlled study of risperidone addition in serotonin reuptake inhibitor-refractory obsessive-compulsive disorder. Arch Gen Psychiatry. 2000;57(8):794-801.
170. Scahill L, Leckman JF, Schulz RT, et al. A placebo-controlled trial of risperidone in Tourette syndrome. Neurology. 2003;60(7):1130-1135.
171. Dallocchio C, Buffa C, Tinelli C, et al. Effectiveness of risperidone in Huntington Chorea patients. J Clin Psychopharmacol. 1999;19(1):101-103.
Ms. A, age 45, is hospitalized for abdominal pain. She is noted to have hiccups, the onset of which she reports was >1 month ago and did not have a clear precipitant. Abdominal and head imaging return no acute findings, and data from a serum electrolyte test, hepatic function test, and thyroid function test are within normal limits. The medical team notices that Ms. A’s speech is pressured, she hardly sleeps, and she appears animated, full of ideas and energy.
Ms. A has a history of bipolar I disorder, hypertension, hyperlipidemia, gastroesophageal reflux disease, and hypothyroidism. Her present medications include hydrochlorothiazide 25 mg/d; levothyroxine 25 mcg/d; omeprazole 20 mg/d; and lovastatin 20 mg/d. She states that she was remotely treated for bipolar disorder, but she was cured by a shamanic healer, and therefore no longer needs treatment.
Approximately 35% of adults in the United States age 60 to 79 reported taking ≥5 prescription medications in 2016, compared to 15% of adults age 40 to 59.1 In a study of 372 patients with advanced, life-limiting illness, Schenker et al2 found that those who took multiple medications (mean: 11.6 medications) had a lower quality of life and worse symptoms. Optimizing medications to patients’ specific needs and diagnoses in order to reduce pill burden can be a favorable intervention. In addition, some patients—approximately 30% of those with schizophrenia and 20% of those with bipolar disorder—may not have insight into their mental illness as they do with their medical conditions, and may be more accepting of treatment for the latter.3 Dual-indication prescribing may be a useful way to decrease polypharmacy, reduce potential drug-drug interactions (DDIs), increase patient acceptance and adherence, and improve a patient’s overall health.
Continue on for: Multiple uses for antidepressants and antipsychotics...
Multiple uses for antidepressants and antipsychotics
One of the first medications discovered to have antidepressant effects was iproniazid, a monoamine oxidase inhibitor (MAOI) initially used to treat tuberculosis.4 Since then, numerous classes of antidepressant medications have been developed that capitalize on monoamine reuptake through several different mechanisms of action. These drugs can be grouped into subclasses that include selective serotonin reuptake inhibitors, serotonin-norepinephrine reuptake inhibitors, tricyclic antidepressants, MAOIs, and others. True to their roots in iproniazid, these medications can have a myriad of effects not limited to mental health and can therefore be beneficial for a variety of comorbid conditions.
As was the case with antidepressants, the first medication approved in the antipsychotic class, chlorpromazine, was serendipitously discovered to treat psychosis and agitation after being approved and used to treat presurgical apprehension.5 The term “antipsychotic” is almost a misnomer given these agents’ broad pharmacology profiles and impact on various mental illnesses, including bipolar disorder, depressive disorders, anxiety disorders, and many other mental conditions. First-generation antipsychotics (FGAs) were the first to enter the market; they work primarily by blocking dopamine-2 (D2) receptors. Second-generation antipsychotics have less movement-based adverse effects than FGAs by having higher affinity for serotonin 5-HT2A receptors than for D2 receptors. However, they tend to carry a higher risk for weight gain and metabolic syndrome.
Antidepressants and antipsychotics are widely utilized in psychiatry. Many have been found to have additional uses beyond their original FDA-approved indication and can therefore be beneficial for a variety of comorbid conditions.
One limitation of using psychiatric medications for nonpsychiatric indications is that different doses of antidepressants and antipsychotics are typically targeted for different indications based on receptor binding affinity. A common example of this is trazodone, where doses below 100 mg are used as needed for insomnia, but higher doses ranging from 200 to 600 mg/d are used for depression. Another important consideration is DDIs. For example, the possibility of adding an agent such as fluoxetine to a complex pain regimen for fibromyalgia could impact the clearance of other agents that are cytochrome P450 (CYP) 2D6 substrates due to fluoxetine’s potent inhibition of the enzyme.6,7 Table 16-51, Table 252-68, Table 369-107, and Table 4108-123 provide information on select antidepressants, while Table 5124-140 and Table 6141-171 provide information on select antipsychotics. Each table lists psychiatric and nonpsychiatric indications for the respective medications, including both FDA-approved (where applicable) and common off-label uses. Most of the indications listed are for adult use only, unless otherwise noted.
Continue on to: Case Continued...
CASE CONTINUED
After reviewing Ms. A’s medical history, the treatment team initiates chlorpromazine, 25 mg 3 times a day, for intractable hiccups, and increases the dosage to 50 mg 3 times a day after 3 days. Chlorpromazine is FDA-approved for treating bipolar mania, and also for treating intractable hiccups. Shortly thereafter, Ms. A’s hiccups subside, she sleeps for longer periods, and her manic symptoms resolve.
Ms. A, age 45, is hospitalized for abdominal pain. She is noted to have hiccups, the onset of which she reports was >1 month ago and did not have a clear precipitant. Abdominal and head imaging return no acute findings, and data from a serum electrolyte test, hepatic function test, and thyroid function test are within normal limits. The medical team notices that Ms. A’s speech is pressured, she hardly sleeps, and she appears animated, full of ideas and energy.
Ms. A has a history of bipolar I disorder, hypertension, hyperlipidemia, gastroesophageal reflux disease, and hypothyroidism. Her present medications include hydrochlorothiazide 25 mg/d; levothyroxine 25 mcg/d; omeprazole 20 mg/d; and lovastatin 20 mg/d. She states that she was remotely treated for bipolar disorder, but she was cured by a shamanic healer, and therefore no longer needs treatment.
Approximately 35% of adults in the United States age 60 to 79 reported taking ≥5 prescription medications in 2016, compared to 15% of adults age 40 to 59.1 In a study of 372 patients with advanced, life-limiting illness, Schenker et al2 found that those who took multiple medications (mean: 11.6 medications) had a lower quality of life and worse symptoms. Optimizing medications to patients’ specific needs and diagnoses in order to reduce pill burden can be a favorable intervention. In addition, some patients—approximately 30% of those with schizophrenia and 20% of those with bipolar disorder—may not have insight into their mental illness as they do with their medical conditions, and may be more accepting of treatment for the latter.3 Dual-indication prescribing may be a useful way to decrease polypharmacy, reduce potential drug-drug interactions (DDIs), increase patient acceptance and adherence, and improve a patient’s overall health.
Continue on for: Multiple uses for antidepressants and antipsychotics...
Multiple uses for antidepressants and antipsychotics
One of the first medications discovered to have antidepressant effects was iproniazid, a monoamine oxidase inhibitor (MAOI) initially used to treat tuberculosis.4 Since then, numerous classes of antidepressant medications have been developed that capitalize on monoamine reuptake through several different mechanisms of action. These drugs can be grouped into subclasses that include selective serotonin reuptake inhibitors, serotonin-norepinephrine reuptake inhibitors, tricyclic antidepressants, MAOIs, and others. True to their roots in iproniazid, these medications can have a myriad of effects not limited to mental health and can therefore be beneficial for a variety of comorbid conditions.
As was the case with antidepressants, the first medication approved in the antipsychotic class, chlorpromazine, was serendipitously discovered to treat psychosis and agitation after being approved and used to treat presurgical apprehension.5 The term “antipsychotic” is almost a misnomer given these agents’ broad pharmacology profiles and impact on various mental illnesses, including bipolar disorder, depressive disorders, anxiety disorders, and many other mental conditions. First-generation antipsychotics (FGAs) were the first to enter the market; they work primarily by blocking dopamine-2 (D2) receptors. Second-generation antipsychotics have less movement-based adverse effects than FGAs by having higher affinity for serotonin 5-HT2A receptors than for D2 receptors. However, they tend to carry a higher risk for weight gain and metabolic syndrome.
Antidepressants and antipsychotics are widely utilized in psychiatry. Many have been found to have additional uses beyond their original FDA-approved indication and can therefore be beneficial for a variety of comorbid conditions.
One limitation of using psychiatric medications for nonpsychiatric indications is that different doses of antidepressants and antipsychotics are typically targeted for different indications based on receptor binding affinity. A common example of this is trazodone, where doses below 100 mg are used as needed for insomnia, but higher doses ranging from 200 to 600 mg/d are used for depression. Another important consideration is DDIs. For example, the possibility of adding an agent such as fluoxetine to a complex pain regimen for fibromyalgia could impact the clearance of other agents that are cytochrome P450 (CYP) 2D6 substrates due to fluoxetine’s potent inhibition of the enzyme.6,7 Table 16-51, Table 252-68, Table 369-107, and Table 4108-123 provide information on select antidepressants, while Table 5124-140 and Table 6141-171 provide information on select antipsychotics. Each table lists psychiatric and nonpsychiatric indications for the respective medications, including both FDA-approved (where applicable) and common off-label uses. Most of the indications listed are for adult use only, unless otherwise noted.
Continue on to: Case Continued...
CASE CONTINUED
After reviewing Ms. A’s medical history, the treatment team initiates chlorpromazine, 25 mg 3 times a day, for intractable hiccups, and increases the dosage to 50 mg 3 times a day after 3 days. Chlorpromazine is FDA-approved for treating bipolar mania, and also for treating intractable hiccups. Shortly thereafter, Ms. A’s hiccups subside, she sleeps for longer periods, and her manic symptoms resolve.
1. Hales CM, Servais J, Martin CB, et al. Prescription drug use among adults aged 40-79 in the United States and Canada. National Center for Health Statistics (Centers for Disease Control and Prevention). 2019. NCHS Data Brief No. 347. https://www.cdc.gov/nchs/products/databriefs/db347.htm
2. Schenker Y, Park SY, Jeong K, et al. Associations between polypharmacy, symptom burden, and quality of life in patients with advanced, life-limiting illness. J Gen Intern Med. 2019;34(4):559-566.
3. National Alliance on Mental Illness. Anosognosia. 2021. https://www.nami.org/About-Mental-Illness/Common-with-Mental-Illness/Anosognosia
4. Meyer JM. A concise guide to monoamine oxidase inhibitors. Current Psychiatry. 2017;16(12):14-16,18-23,47,A.
5. Ban TA. Fifty years chlorpromazine: a historical perspective. Neuropsychiatr Dis Treat. 2007;3(4):495-500.
6. Prozac [package insert]. Indianapolis, IN: Eli Lilly and Company; 2009.
7. Arnold LM, Hess EV, Hudson JI, et al. A randomized, placebo-controlled, double-blind, flexible-dose study of fluoxetine in the treatment of women with fibromyalgia. Am J Med. 2002;112(3):191-197.
8. Celexa [package insert]. St. Louis, MO: Forest Pharmaceuticals, Inc; 2009.
9. Porsteinsson AP, Drye LT, Pollock BG, et al. Effect of citalopram on agitation in Alzheimer disease: the CitAD randomized clinical trial. JAMA. 2014;311(7):682-691.
10. McElroy SL, Hudson JI, Malhotra S, et al. Citalopram in the treatment of binge-eating disorder: a placebo-controlled trial. J Clin Psychiatry. 2003;64(7):807-813.
11. Blank S, Lenze EJ, Mulsant BH, et al. Outcomes of late-life anxiety disorders during 32 weeks of citalopram treatment. J Clin Psychiatry. 2006;67(3):468-472.
12. Lenze EJ, Mulsant BH, Shear MK, et al. Efficacy and tolerability of citalopram in the treatment of late-life anxiety disorders: results from an 8-week randomized, placebo-controlled trial. Am J Psychiatry. 2005;162(1):146-150.
13. Montgomery SA, Kasper S, Stein DJ, et al. Citalopram 20 mg, 40 mg and 60 mg are all effective and well tolerated compared with placebo in obsessive-compulsive disorder. Int Clin Psychopharmacol. 2001;16(2):75-86.
14. Leinonen E, Lepola U, Koponen H, et al. Citalopram controls phobic symptoms in patients with panic disorder: randomized controlled trial. J Psychiatry Neurosci. 2000;25(1):24-32.
15. Perna G, Bertani A, Caldirola D, et al. A comparison of citalopram and paroxetine in the treatment of panic disorder: a randomized, single-blind study. Pharmacopsychiatry. 2001;34(3):85-90.
16. Wikander I, Sundblad C, Andersch B, et al. Citalopram in premenstrual dysphoria: is intermittent treatment during luteal phases more effective than continuous medication throughout the menstrual cycle? J Clin Psychopharmacol. 1998;18(5):390-398.
17. English BA, Jewell M, Jewell G, et al. Treatment of chronic posttraumatic stress disorder in combat veterans with citalopram: an open trial. J Clin Psychopharmacol. 2006;26(1):84-88.
18. Furmark T, Appel L, Michelgård A, et al. Cerebral blood flow changes after treatment of social phobia with neurokinin-1 antagonist GR205171, citalopram, or placebo. Biol Psychiatry. 2005;58(2):132-142.
19. Naranjo CA, Poulos CX, Bremner KE, et al. Citalopram decreases desirability, liking, and consumption of alcohol in alcohol-dependent drinkers. Clin Pharmacol Ther. 1992;51(6):729-739.
20. Safarinejad MR, Hosseini SY. Safety and efficacy of citalopram in the treatment of premature ejaculation: a double-blind placebo-controlled, fixed dose, randomized study. Int J Impot Res. 2006;18(2):164-169.
21. Shams T, Firwana B, Habib F, et al. SSRIs for hot flashes: a systematic review and meta-analysis of randomized trials. J Gen Intern Med. 2014;29(1):204-213.
22. Lexapro [package insert]. Irvine, CA: Allergan USA, Inc; 2016.
23. Guerdjikova AI, McElroy SL, Kotwal R, et al. High-dose escitalopram in the treatment of binge-eating disorder with obesity: a placebo-controlled monotherapy trial. Hum Psychopharmacol. 2008;23(1):1-11.
24. Aigner M, Treasure J, Kaye W, et al. World federation of societies of biological psychiatry (WFSBP) guidelines for pharmacological treatment of eating disorders. World J Biol Psychiatry. 2011;12:400-443.
25. Fineberg NA, Tonnoir B, Lemming O, et al. Escitalopram prevents relapse of obsessive-compulsive disorder. Eur Neuropsychopharmacol. 2007;17(6-7):430-439.
26. Stein DJ, Andersen EW, Tonnoir B, et al. Escitalopram in obsessive-compulsive disorder: a randomized, placebo-controlled, paroxetine-referenced, fixed-dose, 24-week study. Curr Med Res Opin. 2007;23(4):701-711.
27. Stahl SM, Gergel I, Li D. Escitalopram in the treatment of panic disorder: a randomized, double-blind, placebo-controlled trial. J Clin Psychiatry. 2003;64(11):1322-1327.
28. Freeman EW, Sondheimer SJ, Sammel MD, et al. A preliminary study of luteal phase versus symptom-onset dosing with escitalopram for premenstrual dysphoric disorder. J Clin Psychiatry. 2005;66(6):769-773.
29. Qi W, Gevonden M, Shalev A. Efficacy and tolerability of high-dose escitalopram in posttraumatic stress disorder. J Clin Psychopharmacol. 2017;37(1):89-93.
30. Carpenter JS, Guthrie KA, Larson JC, et al. Effect of escitalopram on hot flash interference: a randomized, controlled trial. Fertil Steril. 2012;97(6):1399-1404.
31. Freeman EW, Guthrie KA, Caan B, et al. Efficacy of escitalopram for hot flashes in healthy menopausal women: a randomized controlled trial. JAMA. 2011;305(3):267-274.
32. Arnold LM, McElroy SL, Hudson JI, et al. A placebo-controlled, randomized trial of fluoxetine in the treatment of binge-eating disorder. J Clin Psychiatry. 2002;63(11):1028-1033.
33. Connor KM, Sutherland SM, Tupler LA, et al. Fluoxetine in posttraumatic stress disorder. Randomized, double-blind study. Br J Psychiatry. 1999;175:17-22.
34. Martenyi F, Brown EB, Zhang H, et al. Fluoxetine versus placebo in posttraumatic stress disorder. J Clin Psychiatry. 2002;63(3):199-206.
35. Davidson JR, Foa EB, Huppert JD, et al. Fluoxetine, comprehensive cognitive behavioral therapy, and placebo in generalized social phobia. Arch Gen Psychiatry. 2004;61(10):1005-1013.
36. Kara H, Aydin S, Yücel M, et al. The efficacy of fluoxetine in the treatment of premature ejaculation: a double-blind placebo-controlled study. J Urol. 1996;156(5):1631-1632.
37. Loprinzi CL, Sloan JA, Perez EA, et al. Phase III evaluation of fluoxetine for treatment of hot flashes. J Clin Oncol. 2002;20(6):1578-1583.
38. Coleiro B, Marshall SE, Denton CP, et al. Treatment of Raynaud’s phenomenon with the selective serotonin reuptake inhibitor fluoxetine. Rheumatology (Oxford). 2001;40(9):1038-1043.
39. Paxil [package insert]. Research Triangle Park, NC: GlaxoSmithKline; 2019.
40. Zhang D, Cheng Y, Wu K, et al. Paroxetine in the treatment of premature ejaculation: a systematic review and meta-analysis. BMC Urol. 2019;19(1):2.
41. Walitt B, Urrútia G, Nishishinya MB. Selective serotonin reuptake inhibitors for fibromyalgia syndrome. Cochrane Database Syst Rev. 2015;(6):CD011735.
42. Foster CA, Bafaloukos J. Paroxetine in the treatment of chronic daily headache. Headache. 1994;34:587-589.
43. Zylicz Z, Krajnik M, Sorge A, et al. Paroxetine in the treatment of severe non-dermatological pruritus: a randomized, controlled trial. J Pain Symptom Manage. 2003;26(3):1105-1112.
44. Zoloft [package insert]. New York, NY: Pfizer; 2016.
45. Leombruni P, Pierò A, Lavagnino L, et al. A randomized, double-blind trial comparing sertraline and fluoxetine 6-month treatment in obese patients with binge eating disorder. Prog Neuropsychopharmacol Biol Psychiatry. 2008;32(6):1599-1605.
46. McElroy SL, Casuto LS, Nelson EB, et al. Placebo-controlled trial of sertraline in the treatment of binge eating disorder. Am J Psychiatry. 2000;157(6):1004-1006.
47. Milano W, Petrella C, Sabatino C, et al. Treatment of bulimia nervosa with sertraline: a randomized controlled trial. Adv Ther. 2004;21(4):232-237.
48. Brawman-Mintzer O, Knapp RG, Rynn M, et al. Sertraline treatment for generalized anxiety disorder: a randomized, double-blind, placebo-controlled study. J Clin Psychiatry. 2006;67(6):874-881.
49. McMahon CG. Treatment of premature ejaculation with sertraline hydrochloride: a single-blind placebo-controlled crossover study. J Urol. 1998;159(6):1935-1938.
50. Yi ZM, Chen SD, Tang QY, et al. Efficacy and safety of sertraline for the treatment of premature ejaculation: systematic review and meta-analysis. Medicine (Baltimore). 2019;98(23):e15989.
51. Uçeyler N, Häuser W, Sommer C. A systematic review on the effectiveness of treatment with antidepressants in fibromyalgia syndrome. Arthritis Rheum. 2008;59(9):1279-1298.
52. Pristiq [package insert]. Philadelphia, PA: Wyeth Pharmaceuticals, Inc; 2011.
53. Sun Z, Hao Y, Zhang M. Efficacy and safety of desvenlafaxine treatment for hot flashes associated with menopause: a meta-analysis of randomized controlled trials. Gynecol Obstet Invest. 2013;75(4):255-262.
54. Cymbalta [package insert]. Indianapolis, IN: Eli Lilly and Company; 2008.
55. Li J, Yang L, Pu C, et al. The role of duloxetine in stress urinary incontinence: a systemic review and meta-analysis. Int Urol Nephrol. 2013;45(3):679-686.
56. Filocamo MT, Li Marzi V, Del Popolo G, et al. Pharmacologic treatment in postprostatectomy stress urinary incontinence. Eur Urol. 2007;51(6):1559-1564.
57. Effexor XR [package insert]. Philadelphia, PA: Wyeth Pharmaceuticals, Inc; 2017.
58. Denys D, Van der Wee N, Van Megen HJ, et al. A double-blind comparison of venlafaxine and paroxetine in obsessive-compulsive disorder. J Clin Psychopharmacol. 2003;23(6):568-575.
59. Albert U, Aguglia E, Maina G, et al. Venlafaxine versus clomipramine in the treatment of obsessive-compulsive disorder: a preliminary single-blind, 12-week, controlled study. J Clin Psychiatry. 2002;63(11):1004-1009.
60. Davidson J, Baldwin D, Stein DJ, et al. Treatment of posttraumatic stress disorder with venlafaxine extended release: a 6-month randomized controlled trial. Arch Gen Psychiatry. 2006;63(10):1158-1165.
61. Zarinara AR, Mohammad MR, Hazrati N, et al. Venlafaxine versus methylphenidate in pediatric outpatients with attention deficit hyperactivity disorder: a randomized, double-blind comparison trial. Hum Psychopharmacol. 2010;25(7-8):530-535.
62. Mukaddes NM, Abali O. Venlafaxine in children and adolescents with attention deficit hyperactivity disorder. Psychiatry Clin Neurosci. 2004;58(1):92-95.
63. Cohen LS, Soares CN, Lyster A, et al. Efficacy and tolerability of premenstrual use of venlafaxine (flexible dose) in the treatment of premenstrual dysphoric disorder. J Clin Psychopharmacol. 2004;24(5):540-543.
64. Ozyalcin SN, Talu GK, Kiziltan E, et al. The efficacy and safety of venlafaxine in the prophylaxis of migraine. Headache. 2005;45(2):144-152.
65. Tarlaci S. Escitalopram and venlafaxine for the prophylaxis of migraine headache without mood disorders. Clin Neuropharmacol. 2009;32(5):254-258.
66. Kadiroglu AK, Sit D, Kayabasi H, et al. The effect of venlafaxine HCl on painful peripheral diabetic neuropathy in patients with type 2 diabetes mellitus. J Diabetes Complications. 2008;22(4):241-245.
67. Evans ML, Pritts E, Vittinghoff E, et al. Management of postmenopausal hot flushes with venlafaxine hydrochloride: a randomized, controlled trial. Obstet Gynecol. 2005;105(1):161-166.
68. Farshchian N, Alavi A, Heydarheydari S, et al. Comparative study of the effects of venlafaxine and duloxetine on chemotherapy-induced peripheral neuropathy. Cancer Chemother Pharmacol. 2018;82(5):787-793.
69. Amitriptyline Hydrochloride [package insert]. Princeton, NJ: Sandoz Inc; 2014.
70. Hauser W, Wolfe F, Tolle T, et al. The role of antidepressants in the management of fibromyalgia syndrome: a systemic review and meta-analysis. CNS Drugs. 2012;26(4):297-307.
71. Braak B, Klooker T, Lei A, et al. Randomised clinical trial: the effects of amitriptyline on drinking capacity and symptoms in patients with functional dyspepsia, a double-blind placebo-controlled study. Aliment Pharmacol Ther. 2011;34(6):638-648.
72. Van Ophoven A, Pokupic S, Heinecke A, et al. A prospective, randomized, placebo controlled, double-blind study of amitriptyline for the treatment of interstitial cystitis. J Urol. 2004;172(2):533-536.
73. Foster HE Jr, Hanno P, Nickel JC, et al; Interstitial Cystitis Collaborative Research Network. Effect of amitriptyline on symptoms in treatment naïve patients with interstitial cystitis/painful bladder syndrome. J Urol. 2010;183(5):1853-1858.
74. Vahedi H, Merat S, Momtahen S, et al. Clinical trial: the effect of amitriptyline in patients with diarrhoea-predominent irritable bowel syndrome. Aliment Pharmacol Ther. 2008;27(8):678-684.
75. Bulut S, Berilgen MS, Baran A, et al. Venlafaxine versus amitriptyline in the prophylactic treatment of migraine: a randomized, double-blind, crossover study. Clin Neurol Neurosurg. 2004;107(1):44-48.
76. Keskinbora K, Aydinli I. A double-blind randomized controlled trial of topiramate and amitriptyline either alone or in combination for the prevention of migraine. Clin Neurol Neurosurg. 2008;110(10):979-984.
77. Max MB, Lynch SA, Muir J, et al. Effects of desipramine, amitriptyline, and fluoxetine on pain in diabetic neuropathy. N Engl J Med. 1992;326(19):1250-1256.
78. Boyle J, Eriksson M, Gribble L, et al. Randomized, placebo-controlled comparison of amitriptyline, duloxetine, and pregabalin in patients with chronic diabetic peripheral neuropathic pain: impact on pain, polysomnographic sleep, daytime functioning, and quality of life. Diabetes Care. 2012;35(12):2451-2458.
79. Graff-Radford SB, Shaw LR, Naliboff BN. Amitriptyline and fluphenazine in the treatment of postherpetic neuralgia. Clin J Pain. 2000;16(3):188-192.
80. Watson CP, Evans RJ, Reed K, et al. Amitriptyline versus placebo in postherpetic neuralgia. Neurology. 1982;32(6):671-673.
81. Sinha S, Simlai J, Praharaj SK. Very low dose amitriptyline for clozapine-associated sialorrhea. Curr Drug Saf. 2016;11(3):262-263.
82. Amoxapine [package insert]. Parsippany, NJ: Watson Pharma, Inc; 2014.
83. Weinberg DS, Smalley W, Heidelbaugh JJ, et al. American Gastroenterological Association institute guideline on the pharmacological management of irritable bowel syndrome. Gastroenterology. 2014;147(5):1146-1148.
84. Anafranil (clomipramine hydrochloride) [package insert]. Whitby, Ontario: Patheon Inc; 2012.
85. Clomipramine dose-effect study in patients with depression: clinical end points and pharmacokinetics. Danish University Antidepressant Group (DUAG). Clin Pharmacol Ther. 1999;66(2):152-165.
86. Caillard V, Rouillon F, Viel J, et al. Comparative effects of low and high doses of clomipramine and placebo in panic disorder: a double-blind controlled study. Acta Psychiatr Scand. 1999;99(1):51-58.
87. Segraves RT, Saran A, Segraves K, et al. Clomipramine versus placebo in the treatment of premature ejaculation: a pilot study. J Sex Marital Therap. 1993;19(3):198-200.
88. Rowland DL, de Gouveia Brazao CA, Koos Slob A. Effective daily treatment with clomipramine in men with premature ejaculation when 25 mg (as required) is ineffective. BJU Int. 2001;87(4):357-360.
89. Norpramin (desipramine hydrochloride) [package insert]. Bridgewater, NJ: sanofi-aventis U.S. LLC; 2014.
90. Max MB, Kishore-Kumar R, Schafer SC, et al. Efficacy of desipramine in painful diabetic neuropathy: a placebo-controlled trial. Pain. 1991;45(1):3-9.
91. Drossman DA, Toner BB, Whitehead WE, et al. Cognitive-behavioral therapy versus education and desipramine versus placebo for moderate to severe functional bowel disorders. Gastroenterology. 2003;125(1):19-31.
92. Finnerup NB, Attal N, Haroutounian S, et al. Pharmacotherapy for neuropathic pain in adults: a systemic review and meta-analysis. Lancet Neurol. 2015;14(2):162-173.
93. Doxepin hydrochloride [package insert]. Morgantown, WV: Mylan Pharmaceuticals, Inc; 2014.
94. Goldsobel AB, Rohr AS, Siegel SC, et al. Efficacy of doxepin in the treatment of chronic idiopathic urticaria. J Allergy Clin Immunol. 1986;78(5 Pt 1):867-873.
95. Imipramine hydrochloride [package insert]. Fairfield, NJ: Excellium Pharmaceutical, Inc; 2012.
96. Pope HG Jr, Hudson JI, Jonas JM, et al. Bulimia treated with imipramine: a placebo-controlled, double-blind study. Am J Psychiatry. 1983;140(5):554-558.
97. Barlow DH, Gorman JM, Shear MK, et al. Cognitive-behavioral therapy, imipramine, or their combination for panic disorder: a randomized controlled trial. JAMA. 2000;283(19):2529-2536.
98. Laederach-Hofmann K, Graf C, Horber F, et al. Imipramine and diet counseling with psychological support in the treatment of obese binge eaters: a randomized, placebo-controlled double-blind study. Int J Eat Disord. 1999;26(3):231-244.
99. Sindrup SH, Bach FW, Madsen C, et al. Venlafaxine versus imipramine in painful polyneuropathy: a randomized, controlled trial. Neurology. 2003;60(8):1284-1289.
100. Lin HH, Sheu BC, Lo MC, et al. Comparison of treatment outcomes of imipramine for female genuine stress incontinence. Br J Obstet Gynaecol. 1999;106(10):1089-1092.
101. Pamelor (nortriptyline) [package insert]. Hazelwood, MO: Mallinckrodt Inc; 2007.
102. Spencer T, Biederman J, Wilens T, et al. Nortriptyline treatment of children with attention-deficit hyperactivity disorder and tic disorder or Tourette’s syndrome. J Am Acad Child Adolesc Psychiatry. 1993;32(1):205-210.
103. Atkinson JH, Slater MA, Williams RA, et al. A placebo-controlled randomized clinical trial of nortriptyline for chronic low back pain. Pain. 1998;76(3):287-296.
104. Desai MJ, Saini V, Saini S. Myofacial pain syndrome: a treatment review. Pain Ther. 2013;2(1):21-36.
105. Chandra K, Shafiq N, Pandhi P, et al. Gabapentin versus nortriptyline in post-herpetic neuralgia patients: a randomized, double-blind clinical trial – the GONIP trial. Int J Clin Pharmacol Ther. 2006;44(8):358-363.
106. Jorge RE, Robinson RG, Arndt S, et al. Mortality and poststroke depression: a placebo-controlled trial of antidepressants. Am J Psychiatry. 2003;160(10):1823-1829.
107. Martin MR, Schiff AA. Fluphenazine/nortriptyline in the irritable bladder syndrome. A double-blind placebo-controlled study. Br J Urol. 1984;56(2):178-179.
108. Wellbutrin (bupropion hydrochloride) [package insert]. Research Triangle Park, NC: GlaxoSmithKline; 2017.
109. Maneeton N, Maneeton B, Srisurapanont M, et al. Bupropion for adults with attention-deficit hyperactivity disorder: meta-analysis of randomized, placebo-controlled trials. Psychiatry Clin Neurosci. 2011;65(7):611-617.
110. Li DJ, Tseng PT, Chen YW, et al. Significant treatment effect of bupropion in patients with bipolar disorder but similar phase-shifting rate as other antidepressants: a meta-analysis following the PRISMA guidelines. Medicine (Baltimore). 2016;95(13):e3165.
111. Clayton AH, Warnock JK, Kornstein SG, et al. A placebo-controlled trial of bupropion SR as an antidote for selective serotonin reuptake inhibitor-induced sexual dysfunction. J Clin Psychiatry. 2004;65(1):62-67.
112. Safarinejad MR. Reversal of SSRI-induced female sexual dysfunction by adjunctive bupropion in menstruating women: a double-blind, placebo-controlled and randomized study. J Psychopharmacol. 2011;25(3):370-378.
113. Remeron (mirtazapine) [package insert]. Whitehouse Station, NJ: Merck & Co, Inc; 2020.
114. Boshuisen ML, Slaap BR, Vester-Blokland ED, et al. The effect of mirtazapine in panic disorder: an open label pilot study with a single-blind placebo run-in period. Int Clin Psychopharmacol. 2001;16(6):363-368.
115. Sarchiapone M, Amore M, De Risio S, et al. Mirtazapine in the treatment of panic disorder: an open-label trial. Int Clin Psychopharmacol. 2003;18(1):35-38.
116. Connor KM, Davidson JR, Weisler RH, et al. A pilot study of mirtazapine in post-traumatic stress disorder. Int Clin Psychopharmacol. 1999;14(1):29-31.
117. Wichniak A, Wierzbicka A, Walecka M, et al. Effects of antidepressants on sleep. Curr Psychiatry Rep. 2017;19(9):63.
118. Bedtsen L, Jensen R. Mirtazapine is effective in the prophylactic treatment of chronic tension-type headache. Neurology. 2004;62(10):1706-1711.
119. AbdelFattah MR, Jung SW, Greenspan MA, et al. Efficacy of antidepressants in the treatment of obstructive sleep apnea compared to placebo. A systemic review with meta-analysis. Sleep Breath. 2020;24(2):443-453.
120. Desyrel [package insert]. Locust Valley, NY: Pragma Pharmaceuticals, LLC; 2017.
121. Lebert F, Stekke W, Hasenbroekx C, et al. Frontotemporal dementia: a randomized, controlled trial with trazodone. Dement Geriatr Cogn Disord. 2004;17(4):355-359.
122. Sultzer DL, Gray KF, Gunay I, et al. A double-blind comparison of trazodone and haloperidol for treatment of agitation in patients with dementia. Am J Geriatr Psychiatry. 1997;5(1):60-69.
123. Yi XY, Ni SF, Ghadami MR, et al. Trazodone for the treatment of insomnia: a meta-analysis of randomized placebo-controlled trials. Sleep Med. 2018;45:25-32.
124. Chlorpromazine hydrochloride [package insert]. Minneapolis, MN: Upsher-Smith Laboratories, Inc; 2010.
125. Bigal ME, Bordini CA, Speciali JG. Intravenous chlorpromazine in the emergency department treatment of migraines: a randomized controlled trial. J Emerg Med. 2002;23(2):141-148.
126. Bell R, Montoya D, Shuaib A, et al. A comparative trial of three agents in the treatment of acute migraine headache. Ann Emerg Med. 1990;19(10):1079-1082.
127. Committee on Practice Bulletins-Obstetrics. ACOG Practice Bulletin No. 189: Nausea and vomiting of pregnancy. Obstet Gynecol. 2018;131(1):e15-e30.
128. Fluphenazine hydrochloride [package insert]. Philadelphia, PA: Lannett Company, Inc; 2019.
129. Bonelli RM, Wenning GK. Pharmacological management of Huntington’s disease: an evidence-based review. Curr Pharm Des. 2006;12(21):2701-2720.
130. Haldol [package insert]. Columbus, OH: American Health Packaging; 2020.
131. MacDonald K, Wilson M, Minassian A, et al. A naturalistic study for intramuscular haloperidol versus intramuscular olanzapine for the management of acute agitation. J Clin Psychopharmacol. 2012;32(3):317-322.
132. Goikolea JM, Colom F, Capapey J, et al. Faster onset of antimanic action with haloperidol compared to second-generation antipsychotics. A meta-analysis of randomized clinical trials in acute mania. Eur Neuropsychopharmacol. 2013;23(4):305-316.
133. Girard TD, Exline MC, Carson SS, et al. Haloperidol and ziprasidone for treatment of delirium in critical illness. N Engl J Med. 2018;379(26):2506-2516.
134. Lohr L. Chemotherapy-induced nausea and vomiting. Cancer J. 2008;14(2):85-93.
135. Büttner M, Walder B, von Elm E, et al. Is low-dose haloperidol a useful antiemetic?: A meta-analysis of published and unpublished randomized trials. Anesthesiology. 2004;101(6):1454-1463.
136. Perphenazine [package insert]. Princeton, NJ: Sandoz Inc; 2010.
137. Compazine [package insert]. Research Triangle Park, NC: GlaxoSmithKline; 2004.
138. Hesketh PJ. Chemotherapy-induced nausea and vomiting. N Engl J Med. 2008;358(23):2482-2494.
139. Chen JJ, Frame DG, White TJ. Efficacy of ondansetron and prochlorperazine for the prevention of postoperative nausea and vomiting after total hip replacement or total knee replacement procedures: a randomized, double-blind, comparative trial. Arch Intern Med. 1998;158(19):2124-2128.
140. Campbell K, Rowe H, Azzam H, et al. The management of nausea and vomiting of pregnancy. J Obstet Gynaecol Can. 2016;38(12):1127-1137.
141. Abilify [package insert]. Rockville, MD: Otsuka America Pharmaceutical, Inc; 2014.
142. Kinon BJ, Stauffer VL, Kollack-Walker S, et al. Olanzapine versus aripiprazole for the treatment of agitation in acutely ill patients with schizophrenia. J Clin Psychopharmacol. 2008;28(6):601-607.
143. Iannuzzi GL, Patel AA, Stewart JT. Aripiprazole and delusional disorder. J Psychiatr Pract. 2019;25(2):132-134.
144. Campbell EH, Elston DM, Hawthorne JD, et al. Diagnosis and management of delusional parasitosis. J Am Acad Dermatol. 2019;80(5):1428-1434.
145. Sayyah M, Sayyah M, Boostani H, et al. Effects of aripiprazole augmentation in treatment-resistant obsessive-compulsive disorder (a double-blind clinical trial). Depress Anxiety. 2012;29(10):850-854.
146. Lin WC, Chou YH. Aripiprazole effects on psychosis and chorea in a patient with Huntington’s disease. Am J Psychiatry. 2008;165(9):1207-1208.
147. Li X, Tang Y, Wang C. Adjunctive aripiprazole versus placebo for antipsychotic-induced hyperprolactinemia: meta-analysis of randomized controlled trials. PLoS One. 2013;8(8):e70179.
148. Zyprexa [package insert]. Indianapolis, IN: Eli Lilly and Company; 1997.
149. Attia E, Steinglass JE, Walsh BT, et al. Olanzapine versus placebo in adult outpatients with anorexia nervosa: a randomized clinical trial. Am J Psychiatry. 2019;176(6):449-456.
150. Dennehy EB, Doyle K, Suppes T. The efficacy of olanzapine monotherapy for acute hypomania or mania in an outpatient setting. Int Clin Psychopharmacol. 2003;18(3):143-145.
151. Grover S, Kumar V, Chakrabarti S. Comparative efficacy study of haloperidol, olanzapine and risperidone in delirium. J Psychosom Res. 2011;71(4):277-281.
152. Bosmans A, Verbanck P. Successful treatment of delusional disorder of the somatic type or “delusional parasitosis” with olanzapine. Pharmacopsychiatry. 2008;41(3):121-122.
153. Meyers BS, Flint AJ, Rothschild AJ, et al; STOP-PD Group. A double-blind randomized controlled trial of olanzapine plus sertraline vs olanzapine plus placebo for psychotic depression: the study of pharmacotherapy of psychotic depression (STOP-PD). Arch Gen Psychiatry. 2009;66(8):838-847.
154. Rothschild AJ, Williamson DJ, Tohen MF, et al. A double-blind, randomized study of olanzapine and olanzapine/fluoxetine combination for major depression with psychotic features. J Clin Psychopharmacol. 2004;24(4):365-373.
155. Navari RM, Gray SE, Kerr AC. Olanzapine versus aprepitant for the prevention of chemotherapy-induced nausea and vomiting: a randomized phase III trial. J Support Oncol. 2011;9(5):188-195.
156. Bonelli RM, Mahnert FA, Niederwieser G. Olanzapine for Huntington’s disease: an open label study. Clin Neuropharmacol. 2002;25(5):263-265.
157. Seroquel [package insert]. Wilmington, DE: AstraZeneca Pharmaceuticals LP; 2013.
158. Khan A, Atkinson S, Mezhebovsky I, et al. Extended-release quetiapine fumarate (quetiapine XR) as adjunctive therapy in patients with generalized anxiety disorder and a history of inadequate treatment response: a randomized, double-blind study. Ann Clin Psychiatry. 2014;26(1):3-18.
159. Dold M, Aigner M, Lanzenberger R, et al. Antipsychotic augmentation of serotonin reuptake inhibitors in treatment-resistant obsessive-compulsive disorder: a meta-analysis of double-blind, randomized, placebo-controlled trials. Int J Neuropsychopharmacol. 2013;16(3):557-574.
160. Villarreal G, Hamner MB, Cañive JM, et al. Efficacy of quetiapine monotherapy in posttraumatic stress disorder: a randomized, placebo-controlled trial. Am J Psychiatry. 2016;173(12):1205-1212.
161. Fernandez HH, Friedman JH, Jacques C, et al. Quetiapine for the treatment of drug-induced psychosis in Parkinson’s disease. Mov Disord. 1999;14(3):484-487.
162. Doroudgar S, Chou T, Yu J, et al. Evaluation of trazodone and quetiapine for insomnia: an observational study in psychiatric inpatients. Prim Care Companion CNS Disord. 2013;15(6):PCC.13m01558. doi: 10.4088/PCC.13m01558
163. Risperdal [package insert]. Titusville, NJ: Janssen Pharamceuticals, Inc; 2007.
164. Lim HK, Kim JJ, Pae CU, et al. Comparison of risperidone orodispersible tablet and intramuscular haloperidol in the treatment of acute psychotic agitation: a randomized open, prospective study. Neuropsychobiology. 2010;62(2):81-86.
165. Currier GW, Chou J, Feifel D, et al. Acute treatment of psychotic agitation: a randomized comparison of oral treatment with risperidone and lorazepam versus intramuscular treatment with haloperidol and lorazepam. J Clin Psychiatry. 2004;65(3):386-394.
166. Bahk WM, Yoon JS, Kim YH, et al. Risperidone in combination with mood stabilizers for acute mania: a multicentre, open study. Int Clin Psychopharmacol. 2004;19(5):299-303.
167. Freudenmann RW, Lepping P. Second-generation antipsychotics in primary and secondary delusional parasitosis: outcome and efficacy. J Clin Psychopharmacol. 2008;28(5):500-508.
168. Nelson JC, Papakostas GI. Atypical antipsychotic augmentation in major depressive disorder: a meta-analysis of placebo-controlled randomized trials. Am J Psychiatry. 2009;166(9): 980-991.
169. McDougle CJ, Epperson CN, Pelton GH, et al. A double-blind, placebo-controlled study of risperidone addition in serotonin reuptake inhibitor-refractory obsessive-compulsive disorder. Arch Gen Psychiatry. 2000;57(8):794-801.
170. Scahill L, Leckman JF, Schulz RT, et al. A placebo-controlled trial of risperidone in Tourette syndrome. Neurology. 2003;60(7):1130-1135.
171. Dallocchio C, Buffa C, Tinelli C, et al. Effectiveness of risperidone in Huntington Chorea patients. J Clin Psychopharmacol. 1999;19(1):101-103.
1. Hales CM, Servais J, Martin CB, et al. Prescription drug use among adults aged 40-79 in the United States and Canada. National Center for Health Statistics (Centers for Disease Control and Prevention). 2019. NCHS Data Brief No. 347. https://www.cdc.gov/nchs/products/databriefs/db347.htm
2. Schenker Y, Park SY, Jeong K, et al. Associations between polypharmacy, symptom burden, and quality of life in patients with advanced, life-limiting illness. J Gen Intern Med. 2019;34(4):559-566.
3. National Alliance on Mental Illness. Anosognosia. 2021. https://www.nami.org/About-Mental-Illness/Common-with-Mental-Illness/Anosognosia
4. Meyer JM. A concise guide to monoamine oxidase inhibitors. Current Psychiatry. 2017;16(12):14-16,18-23,47,A.
5. Ban TA. Fifty years chlorpromazine: a historical perspective. Neuropsychiatr Dis Treat. 2007;3(4):495-500.
6. Prozac [package insert]. Indianapolis, IN: Eli Lilly and Company; 2009.
7. Arnold LM, Hess EV, Hudson JI, et al. A randomized, placebo-controlled, double-blind, flexible-dose study of fluoxetine in the treatment of women with fibromyalgia. Am J Med. 2002;112(3):191-197.
8. Celexa [package insert]. St. Louis, MO: Forest Pharmaceuticals, Inc; 2009.
9. Porsteinsson AP, Drye LT, Pollock BG, et al. Effect of citalopram on agitation in Alzheimer disease: the CitAD randomized clinical trial. JAMA. 2014;311(7):682-691.
10. McElroy SL, Hudson JI, Malhotra S, et al. Citalopram in the treatment of binge-eating disorder: a placebo-controlled trial. J Clin Psychiatry. 2003;64(7):807-813.
11. Blank S, Lenze EJ, Mulsant BH, et al. Outcomes of late-life anxiety disorders during 32 weeks of citalopram treatment. J Clin Psychiatry. 2006;67(3):468-472.
12. Lenze EJ, Mulsant BH, Shear MK, et al. Efficacy and tolerability of citalopram in the treatment of late-life anxiety disorders: results from an 8-week randomized, placebo-controlled trial. Am J Psychiatry. 2005;162(1):146-150.
13. Montgomery SA, Kasper S, Stein DJ, et al. Citalopram 20 mg, 40 mg and 60 mg are all effective and well tolerated compared with placebo in obsessive-compulsive disorder. Int Clin Psychopharmacol. 2001;16(2):75-86.
14. Leinonen E, Lepola U, Koponen H, et al. Citalopram controls phobic symptoms in patients with panic disorder: randomized controlled trial. J Psychiatry Neurosci. 2000;25(1):24-32.
15. Perna G, Bertani A, Caldirola D, et al. A comparison of citalopram and paroxetine in the treatment of panic disorder: a randomized, single-blind study. Pharmacopsychiatry. 2001;34(3):85-90.
16. Wikander I, Sundblad C, Andersch B, et al. Citalopram in premenstrual dysphoria: is intermittent treatment during luteal phases more effective than continuous medication throughout the menstrual cycle? J Clin Psychopharmacol. 1998;18(5):390-398.
17. English BA, Jewell M, Jewell G, et al. Treatment of chronic posttraumatic stress disorder in combat veterans with citalopram: an open trial. J Clin Psychopharmacol. 2006;26(1):84-88.
18. Furmark T, Appel L, Michelgård A, et al. Cerebral blood flow changes after treatment of social phobia with neurokinin-1 antagonist GR205171, citalopram, or placebo. Biol Psychiatry. 2005;58(2):132-142.
19. Naranjo CA, Poulos CX, Bremner KE, et al. Citalopram decreases desirability, liking, and consumption of alcohol in alcohol-dependent drinkers. Clin Pharmacol Ther. 1992;51(6):729-739.
20. Safarinejad MR, Hosseini SY. Safety and efficacy of citalopram in the treatment of premature ejaculation: a double-blind placebo-controlled, fixed dose, randomized study. Int J Impot Res. 2006;18(2):164-169.
21. Shams T, Firwana B, Habib F, et al. SSRIs for hot flashes: a systematic review and meta-analysis of randomized trials. J Gen Intern Med. 2014;29(1):204-213.
22. Lexapro [package insert]. Irvine, CA: Allergan USA, Inc; 2016.
23. Guerdjikova AI, McElroy SL, Kotwal R, et al. High-dose escitalopram in the treatment of binge-eating disorder with obesity: a placebo-controlled monotherapy trial. Hum Psychopharmacol. 2008;23(1):1-11.
24. Aigner M, Treasure J, Kaye W, et al. World federation of societies of biological psychiatry (WFSBP) guidelines for pharmacological treatment of eating disorders. World J Biol Psychiatry. 2011;12:400-443.
25. Fineberg NA, Tonnoir B, Lemming O, et al. Escitalopram prevents relapse of obsessive-compulsive disorder. Eur Neuropsychopharmacol. 2007;17(6-7):430-439.
26. Stein DJ, Andersen EW, Tonnoir B, et al. Escitalopram in obsessive-compulsive disorder: a randomized, placebo-controlled, paroxetine-referenced, fixed-dose, 24-week study. Curr Med Res Opin. 2007;23(4):701-711.
27. Stahl SM, Gergel I, Li D. Escitalopram in the treatment of panic disorder: a randomized, double-blind, placebo-controlled trial. J Clin Psychiatry. 2003;64(11):1322-1327.
28. Freeman EW, Sondheimer SJ, Sammel MD, et al. A preliminary study of luteal phase versus symptom-onset dosing with escitalopram for premenstrual dysphoric disorder. J Clin Psychiatry. 2005;66(6):769-773.
29. Qi W, Gevonden M, Shalev A. Efficacy and tolerability of high-dose escitalopram in posttraumatic stress disorder. J Clin Psychopharmacol. 2017;37(1):89-93.
30. Carpenter JS, Guthrie KA, Larson JC, et al. Effect of escitalopram on hot flash interference: a randomized, controlled trial. Fertil Steril. 2012;97(6):1399-1404.
31. Freeman EW, Guthrie KA, Caan B, et al. Efficacy of escitalopram for hot flashes in healthy menopausal women: a randomized controlled trial. JAMA. 2011;305(3):267-274.
32. Arnold LM, McElroy SL, Hudson JI, et al. A placebo-controlled, randomized trial of fluoxetine in the treatment of binge-eating disorder. J Clin Psychiatry. 2002;63(11):1028-1033.
33. Connor KM, Sutherland SM, Tupler LA, et al. Fluoxetine in posttraumatic stress disorder. Randomized, double-blind study. Br J Psychiatry. 1999;175:17-22.
34. Martenyi F, Brown EB, Zhang H, et al. Fluoxetine versus placebo in posttraumatic stress disorder. J Clin Psychiatry. 2002;63(3):199-206.
35. Davidson JR, Foa EB, Huppert JD, et al. Fluoxetine, comprehensive cognitive behavioral therapy, and placebo in generalized social phobia. Arch Gen Psychiatry. 2004;61(10):1005-1013.
36. Kara H, Aydin S, Yücel M, et al. The efficacy of fluoxetine in the treatment of premature ejaculation: a double-blind placebo-controlled study. J Urol. 1996;156(5):1631-1632.
37. Loprinzi CL, Sloan JA, Perez EA, et al. Phase III evaluation of fluoxetine for treatment of hot flashes. J Clin Oncol. 2002;20(6):1578-1583.
38. Coleiro B, Marshall SE, Denton CP, et al. Treatment of Raynaud’s phenomenon with the selective serotonin reuptake inhibitor fluoxetine. Rheumatology (Oxford). 2001;40(9):1038-1043.
39. Paxil [package insert]. Research Triangle Park, NC: GlaxoSmithKline; 2019.
40. Zhang D, Cheng Y, Wu K, et al. Paroxetine in the treatment of premature ejaculation: a systematic review and meta-analysis. BMC Urol. 2019;19(1):2.
41. Walitt B, Urrútia G, Nishishinya MB. Selective serotonin reuptake inhibitors for fibromyalgia syndrome. Cochrane Database Syst Rev. 2015;(6):CD011735.
42. Foster CA, Bafaloukos J. Paroxetine in the treatment of chronic daily headache. Headache. 1994;34:587-589.
43. Zylicz Z, Krajnik M, Sorge A, et al. Paroxetine in the treatment of severe non-dermatological pruritus: a randomized, controlled trial. J Pain Symptom Manage. 2003;26(3):1105-1112.
44. Zoloft [package insert]. New York, NY: Pfizer; 2016.
45. Leombruni P, Pierò A, Lavagnino L, et al. A randomized, double-blind trial comparing sertraline and fluoxetine 6-month treatment in obese patients with binge eating disorder. Prog Neuropsychopharmacol Biol Psychiatry. 2008;32(6):1599-1605.
46. McElroy SL, Casuto LS, Nelson EB, et al. Placebo-controlled trial of sertraline in the treatment of binge eating disorder. Am J Psychiatry. 2000;157(6):1004-1006.
47. Milano W, Petrella C, Sabatino C, et al. Treatment of bulimia nervosa with sertraline: a randomized controlled trial. Adv Ther. 2004;21(4):232-237.
48. Brawman-Mintzer O, Knapp RG, Rynn M, et al. Sertraline treatment for generalized anxiety disorder: a randomized, double-blind, placebo-controlled study. J Clin Psychiatry. 2006;67(6):874-881.
49. McMahon CG. Treatment of premature ejaculation with sertraline hydrochloride: a single-blind placebo-controlled crossover study. J Urol. 1998;159(6):1935-1938.
50. Yi ZM, Chen SD, Tang QY, et al. Efficacy and safety of sertraline for the treatment of premature ejaculation: systematic review and meta-analysis. Medicine (Baltimore). 2019;98(23):e15989.
51. Uçeyler N, Häuser W, Sommer C. A systematic review on the effectiveness of treatment with antidepressants in fibromyalgia syndrome. Arthritis Rheum. 2008;59(9):1279-1298.
52. Pristiq [package insert]. Philadelphia, PA: Wyeth Pharmaceuticals, Inc; 2011.
53. Sun Z, Hao Y, Zhang M. Efficacy and safety of desvenlafaxine treatment for hot flashes associated with menopause: a meta-analysis of randomized controlled trials. Gynecol Obstet Invest. 2013;75(4):255-262.
54. Cymbalta [package insert]. Indianapolis, IN: Eli Lilly and Company; 2008.
55. Li J, Yang L, Pu C, et al. The role of duloxetine in stress urinary incontinence: a systemic review and meta-analysis. Int Urol Nephrol. 2013;45(3):679-686.
56. Filocamo MT, Li Marzi V, Del Popolo G, et al. Pharmacologic treatment in postprostatectomy stress urinary incontinence. Eur Urol. 2007;51(6):1559-1564.
57. Effexor XR [package insert]. Philadelphia, PA: Wyeth Pharmaceuticals, Inc; 2017.
58. Denys D, Van der Wee N, Van Megen HJ, et al. A double-blind comparison of venlafaxine and paroxetine in obsessive-compulsive disorder. J Clin Psychopharmacol. 2003;23(6):568-575.
59. Albert U, Aguglia E, Maina G, et al. Venlafaxine versus clomipramine in the treatment of obsessive-compulsive disorder: a preliminary single-blind, 12-week, controlled study. J Clin Psychiatry. 2002;63(11):1004-1009.
60. Davidson J, Baldwin D, Stein DJ, et al. Treatment of posttraumatic stress disorder with venlafaxine extended release: a 6-month randomized controlled trial. Arch Gen Psychiatry. 2006;63(10):1158-1165.
61. Zarinara AR, Mohammad MR, Hazrati N, et al. Venlafaxine versus methylphenidate in pediatric outpatients with attention deficit hyperactivity disorder: a randomized, double-blind comparison trial. Hum Psychopharmacol. 2010;25(7-8):530-535.
62. Mukaddes NM, Abali O. Venlafaxine in children and adolescents with attention deficit hyperactivity disorder. Psychiatry Clin Neurosci. 2004;58(1):92-95.
63. Cohen LS, Soares CN, Lyster A, et al. Efficacy and tolerability of premenstrual use of venlafaxine (flexible dose) in the treatment of premenstrual dysphoric disorder. J Clin Psychopharmacol. 2004;24(5):540-543.
64. Ozyalcin SN, Talu GK, Kiziltan E, et al. The efficacy and safety of venlafaxine in the prophylaxis of migraine. Headache. 2005;45(2):144-152.
65. Tarlaci S. Escitalopram and venlafaxine for the prophylaxis of migraine headache without mood disorders. Clin Neuropharmacol. 2009;32(5):254-258.
66. Kadiroglu AK, Sit D, Kayabasi H, et al. The effect of venlafaxine HCl on painful peripheral diabetic neuropathy in patients with type 2 diabetes mellitus. J Diabetes Complications. 2008;22(4):241-245.
67. Evans ML, Pritts E, Vittinghoff E, et al. Management of postmenopausal hot flushes with venlafaxine hydrochloride: a randomized, controlled trial. Obstet Gynecol. 2005;105(1):161-166.
68. Farshchian N, Alavi A, Heydarheydari S, et al. Comparative study of the effects of venlafaxine and duloxetine on chemotherapy-induced peripheral neuropathy. Cancer Chemother Pharmacol. 2018;82(5):787-793.
69. Amitriptyline Hydrochloride [package insert]. Princeton, NJ: Sandoz Inc; 2014.
70. Hauser W, Wolfe F, Tolle T, et al. The role of antidepressants in the management of fibromyalgia syndrome: a systemic review and meta-analysis. CNS Drugs. 2012;26(4):297-307.
71. Braak B, Klooker T, Lei A, et al. Randomised clinical trial: the effects of amitriptyline on drinking capacity and symptoms in patients with functional dyspepsia, a double-blind placebo-controlled study. Aliment Pharmacol Ther. 2011;34(6):638-648.
72. Van Ophoven A, Pokupic S, Heinecke A, et al. A prospective, randomized, placebo controlled, double-blind study of amitriptyline for the treatment of interstitial cystitis. J Urol. 2004;172(2):533-536.
73. Foster HE Jr, Hanno P, Nickel JC, et al; Interstitial Cystitis Collaborative Research Network. Effect of amitriptyline on symptoms in treatment naïve patients with interstitial cystitis/painful bladder syndrome. J Urol. 2010;183(5):1853-1858.
74. Vahedi H, Merat S, Momtahen S, et al. Clinical trial: the effect of amitriptyline in patients with diarrhoea-predominent irritable bowel syndrome. Aliment Pharmacol Ther. 2008;27(8):678-684.
75. Bulut S, Berilgen MS, Baran A, et al. Venlafaxine versus amitriptyline in the prophylactic treatment of migraine: a randomized, double-blind, crossover study. Clin Neurol Neurosurg. 2004;107(1):44-48.
76. Keskinbora K, Aydinli I. A double-blind randomized controlled trial of topiramate and amitriptyline either alone or in combination for the prevention of migraine. Clin Neurol Neurosurg. 2008;110(10):979-984.
77. Max MB, Lynch SA, Muir J, et al. Effects of desipramine, amitriptyline, and fluoxetine on pain in diabetic neuropathy. N Engl J Med. 1992;326(19):1250-1256.
78. Boyle J, Eriksson M, Gribble L, et al. Randomized, placebo-controlled comparison of amitriptyline, duloxetine, and pregabalin in patients with chronic diabetic peripheral neuropathic pain: impact on pain, polysomnographic sleep, daytime functioning, and quality of life. Diabetes Care. 2012;35(12):2451-2458.
79. Graff-Radford SB, Shaw LR, Naliboff BN. Amitriptyline and fluphenazine in the treatment of postherpetic neuralgia. Clin J Pain. 2000;16(3):188-192.
80. Watson CP, Evans RJ, Reed K, et al. Amitriptyline versus placebo in postherpetic neuralgia. Neurology. 1982;32(6):671-673.
81. Sinha S, Simlai J, Praharaj SK. Very low dose amitriptyline for clozapine-associated sialorrhea. Curr Drug Saf. 2016;11(3):262-263.
82. Amoxapine [package insert]. Parsippany, NJ: Watson Pharma, Inc; 2014.
83. Weinberg DS, Smalley W, Heidelbaugh JJ, et al. American Gastroenterological Association institute guideline on the pharmacological management of irritable bowel syndrome. Gastroenterology. 2014;147(5):1146-1148.
84. Anafranil (clomipramine hydrochloride) [package insert]. Whitby, Ontario: Patheon Inc; 2012.
85. Clomipramine dose-effect study in patients with depression: clinical end points and pharmacokinetics. Danish University Antidepressant Group (DUAG). Clin Pharmacol Ther. 1999;66(2):152-165.
86. Caillard V, Rouillon F, Viel J, et al. Comparative effects of low and high doses of clomipramine and placebo in panic disorder: a double-blind controlled study. Acta Psychiatr Scand. 1999;99(1):51-58.
87. Segraves RT, Saran A, Segraves K, et al. Clomipramine versus placebo in the treatment of premature ejaculation: a pilot study. J Sex Marital Therap. 1993;19(3):198-200.
88. Rowland DL, de Gouveia Brazao CA, Koos Slob A. Effective daily treatment with clomipramine in men with premature ejaculation when 25 mg (as required) is ineffective. BJU Int. 2001;87(4):357-360.
89. Norpramin (desipramine hydrochloride) [package insert]. Bridgewater, NJ: sanofi-aventis U.S. LLC; 2014.
90. Max MB, Kishore-Kumar R, Schafer SC, et al. Efficacy of desipramine in painful diabetic neuropathy: a placebo-controlled trial. Pain. 1991;45(1):3-9.
91. Drossman DA, Toner BB, Whitehead WE, et al. Cognitive-behavioral therapy versus education and desipramine versus placebo for moderate to severe functional bowel disorders. Gastroenterology. 2003;125(1):19-31.
92. Finnerup NB, Attal N, Haroutounian S, et al. Pharmacotherapy for neuropathic pain in adults: a systemic review and meta-analysis. Lancet Neurol. 2015;14(2):162-173.
93. Doxepin hydrochloride [package insert]. Morgantown, WV: Mylan Pharmaceuticals, Inc; 2014.
94. Goldsobel AB, Rohr AS, Siegel SC, et al. Efficacy of doxepin in the treatment of chronic idiopathic urticaria. J Allergy Clin Immunol. 1986;78(5 Pt 1):867-873.
95. Imipramine hydrochloride [package insert]. Fairfield, NJ: Excellium Pharmaceutical, Inc; 2012.
96. Pope HG Jr, Hudson JI, Jonas JM, et al. Bulimia treated with imipramine: a placebo-controlled, double-blind study. Am J Psychiatry. 1983;140(5):554-558.
97. Barlow DH, Gorman JM, Shear MK, et al. Cognitive-behavioral therapy, imipramine, or their combination for panic disorder: a randomized controlled trial. JAMA. 2000;283(19):2529-2536.
98. Laederach-Hofmann K, Graf C, Horber F, et al. Imipramine and diet counseling with psychological support in the treatment of obese binge eaters: a randomized, placebo-controlled double-blind study. Int J Eat Disord. 1999;26(3):231-244.
99. Sindrup SH, Bach FW, Madsen C, et al. Venlafaxine versus imipramine in painful polyneuropathy: a randomized, controlled trial. Neurology. 2003;60(8):1284-1289.
100. Lin HH, Sheu BC, Lo MC, et al. Comparison of treatment outcomes of imipramine for female genuine stress incontinence. Br J Obstet Gynaecol. 1999;106(10):1089-1092.
101. Pamelor (nortriptyline) [package insert]. Hazelwood, MO: Mallinckrodt Inc; 2007.
102. Spencer T, Biederman J, Wilens T, et al. Nortriptyline treatment of children with attention-deficit hyperactivity disorder and tic disorder or Tourette’s syndrome. J Am Acad Child Adolesc Psychiatry. 1993;32(1):205-210.
103. Atkinson JH, Slater MA, Williams RA, et al. A placebo-controlled randomized clinical trial of nortriptyline for chronic low back pain. Pain. 1998;76(3):287-296.
104. Desai MJ, Saini V, Saini S. Myofacial pain syndrome: a treatment review. Pain Ther. 2013;2(1):21-36.
105. Chandra K, Shafiq N, Pandhi P, et al. Gabapentin versus nortriptyline in post-herpetic neuralgia patients: a randomized, double-blind clinical trial – the GONIP trial. Int J Clin Pharmacol Ther. 2006;44(8):358-363.
106. Jorge RE, Robinson RG, Arndt S, et al. Mortality and poststroke depression: a placebo-controlled trial of antidepressants. Am J Psychiatry. 2003;160(10):1823-1829.
107. Martin MR, Schiff AA. Fluphenazine/nortriptyline in the irritable bladder syndrome. A double-blind placebo-controlled study. Br J Urol. 1984;56(2):178-179.
108. Wellbutrin (bupropion hydrochloride) [package insert]. Research Triangle Park, NC: GlaxoSmithKline; 2017.
109. Maneeton N, Maneeton B, Srisurapanont M, et al. Bupropion for adults with attention-deficit hyperactivity disorder: meta-analysis of randomized, placebo-controlled trials. Psychiatry Clin Neurosci. 2011;65(7):611-617.
110. Li DJ, Tseng PT, Chen YW, et al. Significant treatment effect of bupropion in patients with bipolar disorder but similar phase-shifting rate as other antidepressants: a meta-analysis following the PRISMA guidelines. Medicine (Baltimore). 2016;95(13):e3165.
111. Clayton AH, Warnock JK, Kornstein SG, et al. A placebo-controlled trial of bupropion SR as an antidote for selective serotonin reuptake inhibitor-induced sexual dysfunction. J Clin Psychiatry. 2004;65(1):62-67.
112. Safarinejad MR. Reversal of SSRI-induced female sexual dysfunction by adjunctive bupropion in menstruating women: a double-blind, placebo-controlled and randomized study. J Psychopharmacol. 2011;25(3):370-378.
113. Remeron (mirtazapine) [package insert]. Whitehouse Station, NJ: Merck & Co, Inc; 2020.
114. Boshuisen ML, Slaap BR, Vester-Blokland ED, et al. The effect of mirtazapine in panic disorder: an open label pilot study with a single-blind placebo run-in period. Int Clin Psychopharmacol. 2001;16(6):363-368.
115. Sarchiapone M, Amore M, De Risio S, et al. Mirtazapine in the treatment of panic disorder: an open-label trial. Int Clin Psychopharmacol. 2003;18(1):35-38.
116. Connor KM, Davidson JR, Weisler RH, et al. A pilot study of mirtazapine in post-traumatic stress disorder. Int Clin Psychopharmacol. 1999;14(1):29-31.
117. Wichniak A, Wierzbicka A, Walecka M, et al. Effects of antidepressants on sleep. Curr Psychiatry Rep. 2017;19(9):63.
118. Bedtsen L, Jensen R. Mirtazapine is effective in the prophylactic treatment of chronic tension-type headache. Neurology. 2004;62(10):1706-1711.
119. AbdelFattah MR, Jung SW, Greenspan MA, et al. Efficacy of antidepressants in the treatment of obstructive sleep apnea compared to placebo. A systemic review with meta-analysis. Sleep Breath. 2020;24(2):443-453.
120. Desyrel [package insert]. Locust Valley, NY: Pragma Pharmaceuticals, LLC; 2017.
121. Lebert F, Stekke W, Hasenbroekx C, et al. Frontotemporal dementia: a randomized, controlled trial with trazodone. Dement Geriatr Cogn Disord. 2004;17(4):355-359.
122. Sultzer DL, Gray KF, Gunay I, et al. A double-blind comparison of trazodone and haloperidol for treatment of agitation in patients with dementia. Am J Geriatr Psychiatry. 1997;5(1):60-69.
123. Yi XY, Ni SF, Ghadami MR, et al. Trazodone for the treatment of insomnia: a meta-analysis of randomized placebo-controlled trials. Sleep Med. 2018;45:25-32.
124. Chlorpromazine hydrochloride [package insert]. Minneapolis, MN: Upsher-Smith Laboratories, Inc; 2010.
125. Bigal ME, Bordini CA, Speciali JG. Intravenous chlorpromazine in the emergency department treatment of migraines: a randomized controlled trial. J Emerg Med. 2002;23(2):141-148.
126. Bell R, Montoya D, Shuaib A, et al. A comparative trial of three agents in the treatment of acute migraine headache. Ann Emerg Med. 1990;19(10):1079-1082.
127. Committee on Practice Bulletins-Obstetrics. ACOG Practice Bulletin No. 189: Nausea and vomiting of pregnancy. Obstet Gynecol. 2018;131(1):e15-e30.
128. Fluphenazine hydrochloride [package insert]. Philadelphia, PA: Lannett Company, Inc; 2019.
129. Bonelli RM, Wenning GK. Pharmacological management of Huntington’s disease: an evidence-based review. Curr Pharm Des. 2006;12(21):2701-2720.
130. Haldol [package insert]. Columbus, OH: American Health Packaging; 2020.
131. MacDonald K, Wilson M, Minassian A, et al. A naturalistic study for intramuscular haloperidol versus intramuscular olanzapine for the management of acute agitation. J Clin Psychopharmacol. 2012;32(3):317-322.
132. Goikolea JM, Colom F, Capapey J, et al. Faster onset of antimanic action with haloperidol compared to second-generation antipsychotics. A meta-analysis of randomized clinical trials in acute mania. Eur Neuropsychopharmacol. 2013;23(4):305-316.
133. Girard TD, Exline MC, Carson SS, et al. Haloperidol and ziprasidone for treatment of delirium in critical illness. N Engl J Med. 2018;379(26):2506-2516.
134. Lohr L. Chemotherapy-induced nausea and vomiting. Cancer J. 2008;14(2):85-93.
135. Büttner M, Walder B, von Elm E, et al. Is low-dose haloperidol a useful antiemetic?: A meta-analysis of published and unpublished randomized trials. Anesthesiology. 2004;101(6):1454-1463.
136. Perphenazine [package insert]. Princeton, NJ: Sandoz Inc; 2010.
137. Compazine [package insert]. Research Triangle Park, NC: GlaxoSmithKline; 2004.
138. Hesketh PJ. Chemotherapy-induced nausea and vomiting. N Engl J Med. 2008;358(23):2482-2494.
139. Chen JJ, Frame DG, White TJ. Efficacy of ondansetron and prochlorperazine for the prevention of postoperative nausea and vomiting after total hip replacement or total knee replacement procedures: a randomized, double-blind, comparative trial. Arch Intern Med. 1998;158(19):2124-2128.
140. Campbell K, Rowe H, Azzam H, et al. The management of nausea and vomiting of pregnancy. J Obstet Gynaecol Can. 2016;38(12):1127-1137.
141. Abilify [package insert]. Rockville, MD: Otsuka America Pharmaceutical, Inc; 2014.
142. Kinon BJ, Stauffer VL, Kollack-Walker S, et al. Olanzapine versus aripiprazole for the treatment of agitation in acutely ill patients with schizophrenia. J Clin Psychopharmacol. 2008;28(6):601-607.
143. Iannuzzi GL, Patel AA, Stewart JT. Aripiprazole and delusional disorder. J Psychiatr Pract. 2019;25(2):132-134.
144. Campbell EH, Elston DM, Hawthorne JD, et al. Diagnosis and management of delusional parasitosis. J Am Acad Dermatol. 2019;80(5):1428-1434.
145. Sayyah M, Sayyah M, Boostani H, et al. Effects of aripiprazole augmentation in treatment-resistant obsessive-compulsive disorder (a double-blind clinical trial). Depress Anxiety. 2012;29(10):850-854.
146. Lin WC, Chou YH. Aripiprazole effects on psychosis and chorea in a patient with Huntington’s disease. Am J Psychiatry. 2008;165(9):1207-1208.
147. Li X, Tang Y, Wang C. Adjunctive aripiprazole versus placebo for antipsychotic-induced hyperprolactinemia: meta-analysis of randomized controlled trials. PLoS One. 2013;8(8):e70179.
148. Zyprexa [package insert]. Indianapolis, IN: Eli Lilly and Company; 1997.
149. Attia E, Steinglass JE, Walsh BT, et al. Olanzapine versus placebo in adult outpatients with anorexia nervosa: a randomized clinical trial. Am J Psychiatry. 2019;176(6):449-456.
150. Dennehy EB, Doyle K, Suppes T. The efficacy of olanzapine monotherapy for acute hypomania or mania in an outpatient setting. Int Clin Psychopharmacol. 2003;18(3):143-145.
151. Grover S, Kumar V, Chakrabarti S. Comparative efficacy study of haloperidol, olanzapine and risperidone in delirium. J Psychosom Res. 2011;71(4):277-281.
152. Bosmans A, Verbanck P. Successful treatment of delusional disorder of the somatic type or “delusional parasitosis” with olanzapine. Pharmacopsychiatry. 2008;41(3):121-122.
153. Meyers BS, Flint AJ, Rothschild AJ, et al; STOP-PD Group. A double-blind randomized controlled trial of olanzapine plus sertraline vs olanzapine plus placebo for psychotic depression: the study of pharmacotherapy of psychotic depression (STOP-PD). Arch Gen Psychiatry. 2009;66(8):838-847.
154. Rothschild AJ, Williamson DJ, Tohen MF, et al. A double-blind, randomized study of olanzapine and olanzapine/fluoxetine combination for major depression with psychotic features. J Clin Psychopharmacol. 2004;24(4):365-373.
155. Navari RM, Gray SE, Kerr AC. Olanzapine versus aprepitant for the prevention of chemotherapy-induced nausea and vomiting: a randomized phase III trial. J Support Oncol. 2011;9(5):188-195.
156. Bonelli RM, Mahnert FA, Niederwieser G. Olanzapine for Huntington’s disease: an open label study. Clin Neuropharmacol. 2002;25(5):263-265.
157. Seroquel [package insert]. Wilmington, DE: AstraZeneca Pharmaceuticals LP; 2013.
158. Khan A, Atkinson S, Mezhebovsky I, et al. Extended-release quetiapine fumarate (quetiapine XR) as adjunctive therapy in patients with generalized anxiety disorder and a history of inadequate treatment response: a randomized, double-blind study. Ann Clin Psychiatry. 2014;26(1):3-18.
159. Dold M, Aigner M, Lanzenberger R, et al. Antipsychotic augmentation of serotonin reuptake inhibitors in treatment-resistant obsessive-compulsive disorder: a meta-analysis of double-blind, randomized, placebo-controlled trials. Int J Neuropsychopharmacol. 2013;16(3):557-574.
160. Villarreal G, Hamner MB, Cañive JM, et al. Efficacy of quetiapine monotherapy in posttraumatic stress disorder: a randomized, placebo-controlled trial. Am J Psychiatry. 2016;173(12):1205-1212.
161. Fernandez HH, Friedman JH, Jacques C, et al. Quetiapine for the treatment of drug-induced psychosis in Parkinson’s disease. Mov Disord. 1999;14(3):484-487.
162. Doroudgar S, Chou T, Yu J, et al. Evaluation of trazodone and quetiapine for insomnia: an observational study in psychiatric inpatients. Prim Care Companion CNS Disord. 2013;15(6):PCC.13m01558. doi: 10.4088/PCC.13m01558
163. Risperdal [package insert]. Titusville, NJ: Janssen Pharamceuticals, Inc; 2007.
164. Lim HK, Kim JJ, Pae CU, et al. Comparison of risperidone orodispersible tablet and intramuscular haloperidol in the treatment of acute psychotic agitation: a randomized open, prospective study. Neuropsychobiology. 2010;62(2):81-86.
165. Currier GW, Chou J, Feifel D, et al. Acute treatment of psychotic agitation: a randomized comparison of oral treatment with risperidone and lorazepam versus intramuscular treatment with haloperidol and lorazepam. J Clin Psychiatry. 2004;65(3):386-394.
166. Bahk WM, Yoon JS, Kim YH, et al. Risperidone in combination with mood stabilizers for acute mania: a multicentre, open study. Int Clin Psychopharmacol. 2004;19(5):299-303.
167. Freudenmann RW, Lepping P. Second-generation antipsychotics in primary and secondary delusional parasitosis: outcome and efficacy. J Clin Psychopharmacol. 2008;28(5):500-508.
168. Nelson JC, Papakostas GI. Atypical antipsychotic augmentation in major depressive disorder: a meta-analysis of placebo-controlled randomized trials. Am J Psychiatry. 2009;166(9): 980-991.
169. McDougle CJ, Epperson CN, Pelton GH, et al. A double-blind, placebo-controlled study of risperidone addition in serotonin reuptake inhibitor-refractory obsessive-compulsive disorder. Arch Gen Psychiatry. 2000;57(8):794-801.
170. Scahill L, Leckman JF, Schulz RT, et al. A placebo-controlled trial of risperidone in Tourette syndrome. Neurology. 2003;60(7):1130-1135.
171. Dallocchio C, Buffa C, Tinelli C, et al. Effectiveness of risperidone in Huntington Chorea patients. J Clin Psychopharmacol. 1999;19(1):101-103.
Lumateperone for major depressive episodes in bipolar I or bipolar II disorder
Among patients with bipolar I or II disorder (BD I or II), major depressive episodes represent the predominant mood state when not euthymic, and are disproportionately associated with the functional disability of BD and its suicide risk.1 Long-term naturalistic studies of weekly mood states in patients with BD I or II found that the proportion of time spent depressed greatly exceeded that spent in a mixed, hypomanic, or manic state during >12 years of follow-up (Figure 12and Figure 23). In the 20th century, traditional antidepressants represented the sole option for management of bipolar depression despite concerns of manic switching or lack of efficacy.4,5 Efficacy concerns were subsequently confirmed by placebo-controlled studies, such as the Systematic Treatment Enhancement Program for Bipolar Disorder (STEP-BD) trial, which found limited effectiveness of adjunctive antidepressants for bipolar depression.6 Comprehensive reviews of randomized controlled trials and observational studies documented the risk of mood cycling and manic switching, especially in patients with BD I, even if antidepressants were used in the presence of mood-stabilizing medications.7,8
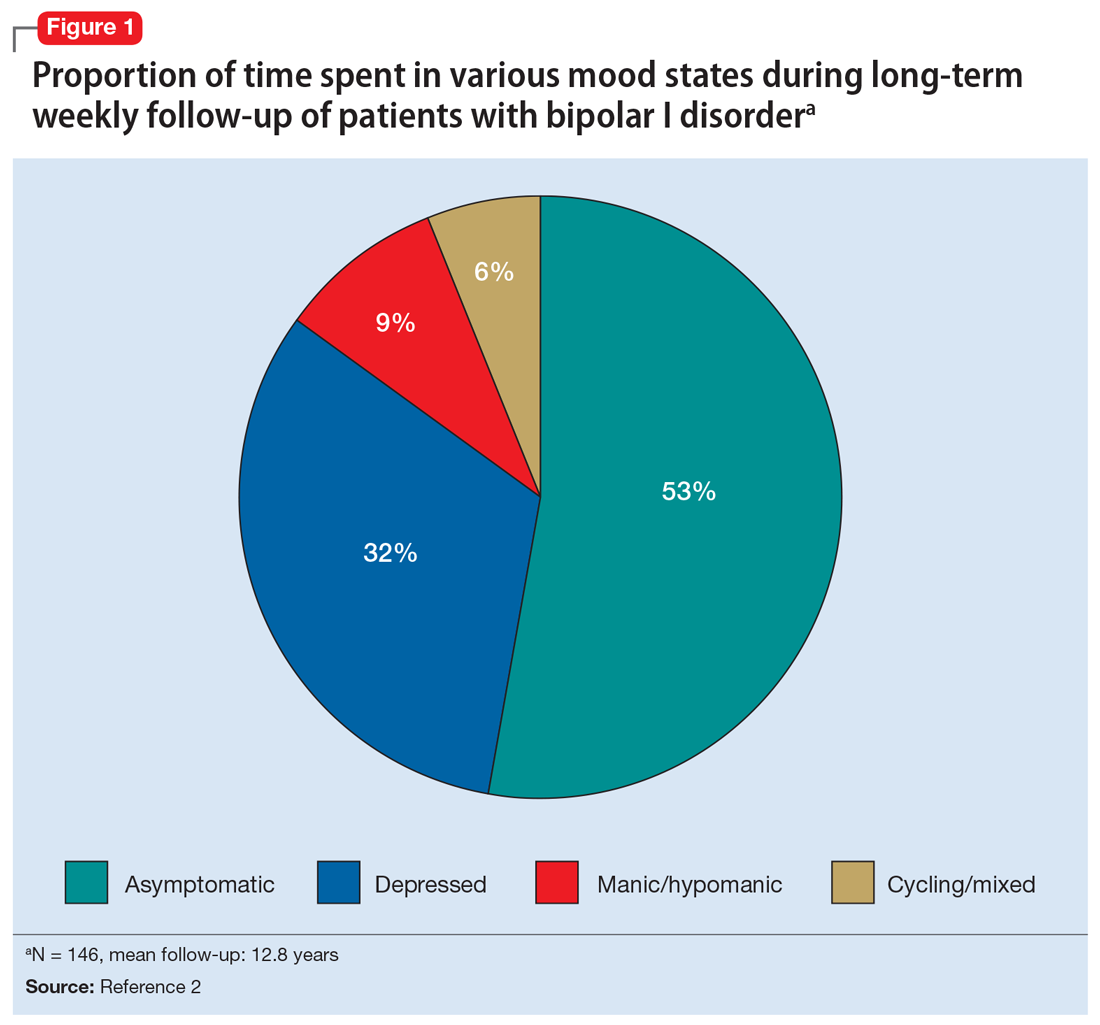
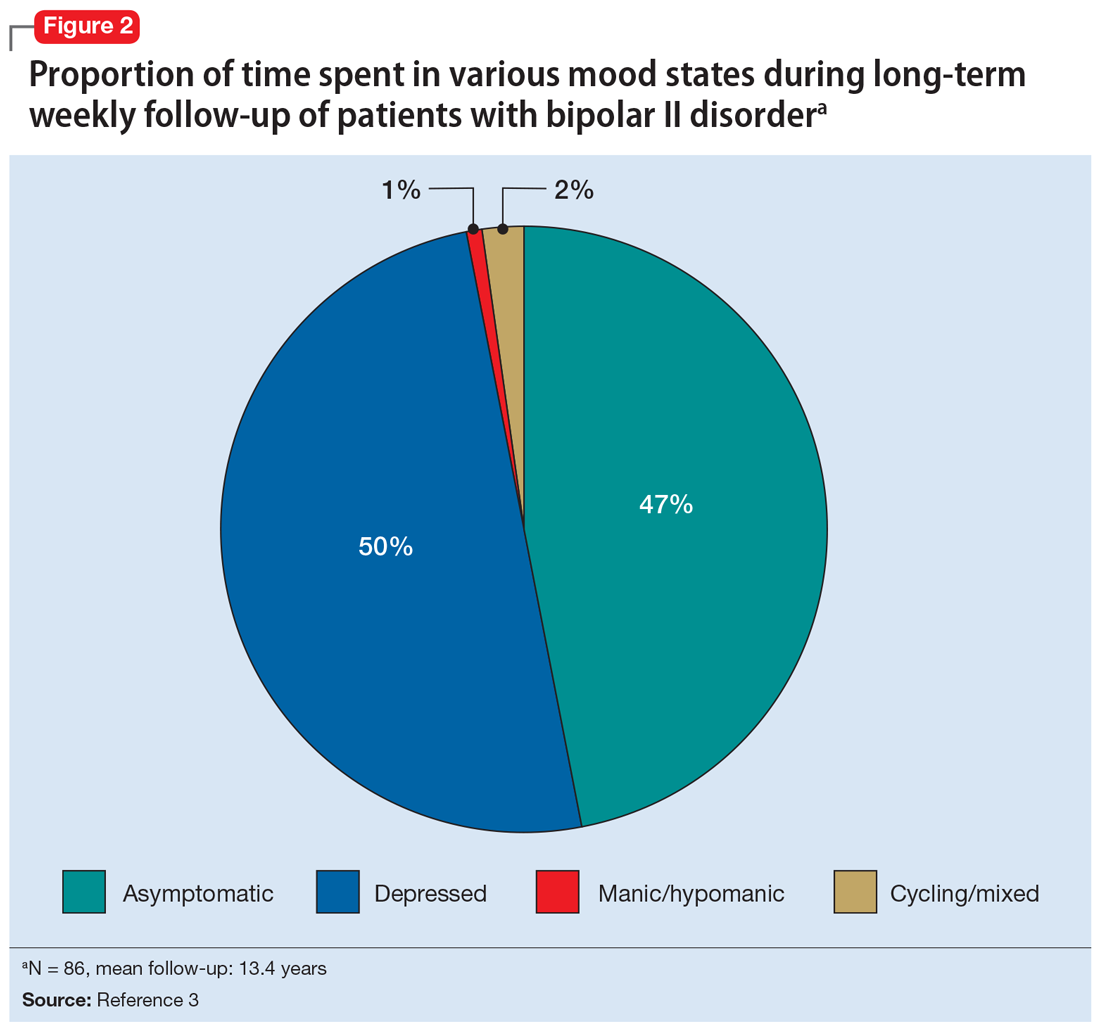
Several newer antipsychotics have been FDA-approved for treating depressive episodes associated with BD (Table 1). Approval of olanzapine/fluoxetine combination (OFC) in December 2003 for depressive episodes associated with BD I established that mechanisms exist which can effectively treat acute depressive episodes in patients with BD without an inordinate risk of mood instability. Subsequent approval of quetiapine in October 2006 for depression associated with BD I or II, lurasidone in June 2013, and cariprazine in May 2019 for major depression in BD I greatly expanded the options for management of acute bipolar depression. However, despite the array of molecules available, for certain patients these agents presented tolerability issues such as sedation, weight gain, akathisia, or parkinsonism that could hamper effective treatment.9 Safety and efficacy data in bipolar depression for adjunctive use with lithium or divalproex/valproate (VPA) also are lacking for quetiapine, OFC, and cariprazine.10,11 Moreover, despite the fact that BD II is as prevalent as BD I, and that patients with BD II have comparable rates of comorbidity, chronicity, disability, and suicidality,12 only quetiapine was approved for acute treatment of depression in patients with BD II. This omission is particularly problematic because the depressive episodes of BD II predominate over the time spent in hypomanic and cycling/mixed states (50.3% for depression vs 3.6% for hypomania/cycling/mixed combined), much more than is seen with BD I (31.9% for depression vs 14.8% for hypomania/cycling/mixed combined).2,3 The paucity of data for the use of newer antipsychotics in BD II depression presents a problem when patients cannot tolerate or refuse to consider quetiapine. This prevents clinicians from engaging in evidence-based efficacy discussions of other options, even if it is assumed that the tolerability profile for BD II depression patients may be similar to that seen when these agents are used for BD I depression.
Continue to: Table 1...
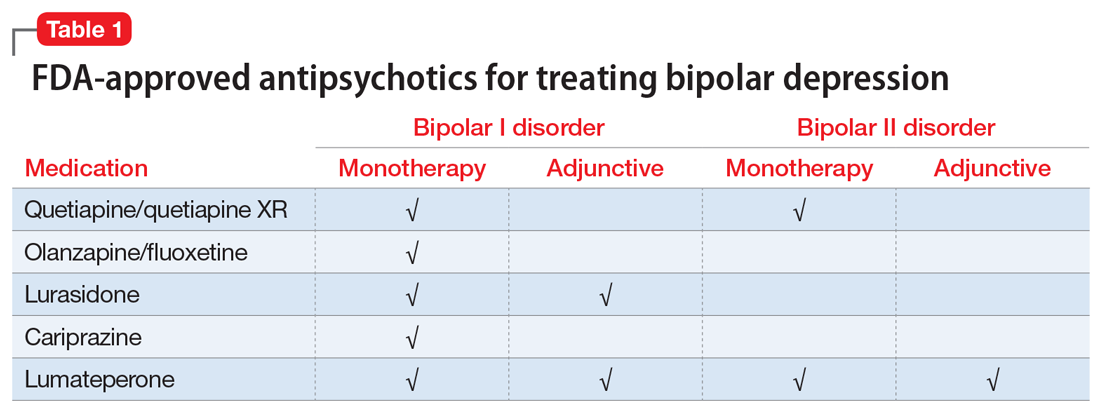
Lumateperone (Caplyta) is a novel oral antipsychotic initially approved in 2019 for the treatment of adult patients with schizophrenia. It was approved in December 2021 for the management of depression associated with BD I or II in adults as monotherapy or when used adjunctively with the mood stabilizers lithium or VPA (Table 2).13 Lumateperone possesses certain binding affinities not unlike those in other newer antipsychotics, including high affinity for serotonin 5HT2A receptors (Ki 0.54 nM), low affinity for dopamine D2 receptors (Ki 32 nM), and low affinity for alpha 1-adrenergic receptors (Ki 73 nM), muscarinic and histaminergic receptors (Ki >100 nM for both).13,14 However, there are some distinguishing features: the ratio of 5HT2A receptor affinity to D2 affinity is 60, greater than that for other second-generation antipsychotics (SGAs) such as risperidone (12), olanzapine (12.4) or aripiprazole (0.18).15 At steady state, D2 receptor occupancy remains <40%, and the corresponding rates of extrapyramidal side effects (EPS)/akathisia differed by only 0.4% for lumateperone vs placebo in short-term adult clinical schizophrenia trials,13,16 by 0.2% for lumateperone vs placebo in the monotherapy BD depression study, and by 1.7% in the adjunctive BD depression study.13,17,18 Lumateperone also exhibited no clinically significant impact on metabolic measures or serum prolactin during the 4-week schizophrenia trials, with mean weight gain ≤1 kg for the 42 mg dose across all studies.19 This favorable tolerability profile for endocrine and metabolic adverse effects was also seen in the BD depression studies. Across the 2 BD depression monotherapy trials and the single adjunctive study, the only adverse reactions occurring in ≥5% of lumateperone-treated patients and more than twice the rate of placebo were somnolence/sedation, dizziness, nausea, and dry mouth.13 There was also no single adverse reaction leading to discontinuation in the BD depression studies that occurred at a rate >2% in patients treated with lumateperone.13
In addition to the low risk of adverse events of all types, lumateperone has several pharmacologic features that distinguish it from other agents in its class. One unique aspect of lumateperone’s pharmacology is differential actions at presynaptic and postsynaptic dopamine D2 receptors noted in preclinical assays, a property that may explain its ability to act as an antipsychotic despite low D2 receptor occupancy.16 Preclinical assays also predicted that lumateperone was likely to have antidepressant effects.15,19,20 Unlike every SGA except ziprasidone, lumateperone also possesses moderate binding affinity for serotonin transporters (SERT) (Ki 33 nM), with SERT occupancy of approximately 30% at 42 mg.21 Lumateperone facilitates dopamine D1-mediated neurotransmission, and this is associated with increased glutamate signaling in the prefrontal cortex and antidepressant actions.14,22 While the extent of SERT occupancy is significantly below the ≥80% SERT occupancy seen with selective serotonin reuptake inhibitors, it is hypothesized that near saturation of the 5HT2A receptor might act synergistically with modest 5HT reuptake inhibition and D1-mediated effects to promote the downstream glutamatergic effects that correlate with antidepressant activity (eg, changes in markers such as phosphorylation of glutamate N-methyl-D-aspartate receptor subunits, potentiation of AMPA receptor-mediated transmission).15,22
Continue to: Clinical implications...
Clinical implications
The approval of lumateperone for both BD I and BD II depression, and for its use as monotherapy and for adjunctive use with lithium or VPA, satisfies several unmet needs for the management of acute major depressive episodes in patients with BD. Clinicians now have both safety and tolerability data to present to their bipolar spectrum patients regardless of subtype, and regardless of whether the patient requires mood stabilizer therapy. The tolerability advantages for lumateperone seen in schizophrenia trials were replicated in a diagnostic group that is very sensitive to D2-related adverse effects, and for whom any signal of clinically significant weight gain or sedation often represents an insuperable barrier to patient acceptance.23
Efficacy in adults with BD I or II depression.
The efficacy of lumateperone for major depressive episodes has been established in 2 pivotal, double-blind, placebo-controlled trials in BD I or II patients: 1 monotherapy study,17 and 1 study when used adjunctively to lithium or VPA.18 The first study was a 6-week, double-blind, placebo-controlled monotherapy trial (study 404) in which 377 patients age 18 to 75 with BD I or BD II experiencing a major depressive episode were randomized in a 1:1 manner to lumateperone 42 mg/d or placebo given once daily in the evening. Symptom entry criteria included a Montgomery-Åsberg Depression Rating Scale (MADRS) total score ≥20, and scores ≥4 on the depression and overall BD illness subscales of the Clinical Global Impressions Scale–Bipolar Version Severity scale (CGI-BP-S) at screening and at baseline.17 Study entry also required a score ≤12 on the Young Mania Rating Scale (YMRS) at screening and at baseline. The duration of the major depressive episode must have been ≥2 weeks but <6 months before screening, with symptoms causing clinically significant distress or functional impairment. The primary outcome measure was change from baseline in MADRS. Several secondary efficacy measures were examined, including the proportion of patients meeting criteria for treatment response (≥50% decrease in MADRS), or remission (MADRS score ≤12), and differential changes in MADRS scores from baseline for BD I and BD II subgroups.17
The patient population was 58% female and 91% White, with 79.9% diagnosed as BD I and 20.1% as BD II. The least squares mean changes on the MADRS total score from baseline to Day 43 were lumateperone 42 mg/d: -16.7 points; placebo: -12.1 points (P < .0001), and the effect size for this difference was moderate: 0.56. Secondary analyses indicated that 51.1% of those taking lumateperone 42 mg/d and 36.7% taking placebo met response criteria (P < .001), while 39.9% of those taking lumateperone 42 mg/d and 33.5% taking placebo met remission criteria (P = .018). Importantly, depression improvement was observed both in patients with BD I (effect size 0.49, P < .0001) and in those with BD II (effect size 0.81, P < .001).
The second pivotal trial (study 402) was a 6-week, double-blind, placebo-controlled adjunctive trial in which 528 patients age 18 to 75 with BD I or BD II experiencing a major depressive episode despite treatment with lithium or VPA were randomized in a 1:1:1 manner to lumateperone 28 mg/d, lumateperone 42 mg/d, or placebo given once daily in the evening.18 Like the monotherapy trial, symptom entry criteria included a MADRS total score ≥20, and scores ≥4 on the depression and overall illness CGI-BP-S subscales at screening and baseline.18 Study entry also required a score ≤12 on the YMRS at screening and baseline. The duration of the major depressive episode must have been ≥2 weeks but <6 months before screening, with symptoms causing clinically significant distress or functional impairment. The primary outcome measure was change from baseline in MADRS for lumateperone 42 mg/d compared to placebo. Secondary efficacy measures included MADRS changes for lumateperone 28 mg/d and the proportion of patients meeting criteria for treatment response (≥50% decrease in MADRS) or remission (MADRS score ≤12).
The patient population was 58% female and 88% White, with 83.3% diagnosed as BD I, 16.7% diagnosed as BD II, and 28.6% treated with lithium vs 71.4% on VPA. The effect size for the difference in MADRS total score from baseline to Day 43 for lumateperone 42 mg/d was 0.27 (P < .05), while that for the lumateperone 28 mg/d dose did not reach statistical significance. Secondary analyses indicated that response rates for lumateperone 28 mg/d and lumateperone 42 mg/d were significantly higher than for placebo (both P < .05). Response rates were placebo: 39%; lumateperone 28 mg/d: 50%; and lumateperone 42 mg/d: 45%. Remission rates were similar at Day 43 in both lumateperone groups compared with placebo: placebo: 31%, lumateperone 28 mg/d: 31%, and lumateperone 42 mg/d: 28%.18 As of this writing, a secondary analysis by BD subtype has not yet been presented.
A third study examining lumateperone monotherapy failed to establish superiority of lumateperone over placebo (NCT02600494). The data regarding tolerability from that study were incorporated in product labeling describing adverse reactions.
Continue on to: Adverse reactions...
Adverse reactions
In the positive monotherapy trial, there were 376 patients in the modified intent-to-treat efficacy population to receive lumateperone (N = 188) or placebo (N = 188) with nearly identical completion rates in the active treatment and placebo cohorts: lumateperone, 88.8%; placebo, 88.3%.17 The proportion experiencing mania was low in both cohorts (lumateperone, 1.1%; placebo, 2.1%), and there was 1 case of hypomania in each group. One participant in the lumateperone group and 1 in the placebo group discontinued the study due to a serious adverse event of mania. There was no worsening of mania in either group as measured by mean change in the YMRS score. There was also no suicidal behavior in either cohort during the study. Pooling the 2 monotherapy trials, the adverse events that occurred at ≥5% in lumateperone-treated patients and at more than twice the rate of the placebo group were somnolence/sedation (lumateperone 42 mg/d: 13%, placebo: 3%), dizziness (lumateperone 42 mg/d: 8%, placebo: 4%), and nausea (lumateperone 42 mg/d: 8%, placebo: 3%).13 Rates of EPS were low for both groups: lumateperone 42 mg/d: 1.3%, placebo: 1.1%.13 Mean weight change at Day 43 was +0.11 kg for lumateperone and +0.03 kg for placebo in the positive monotherapy trial.17 Moreover, compared to placebo, lumateperone exhibited comparable effects on serum prolactin and all metabolic parameters, including fasting insulin, fasting glucose, and fasting lipids, none of which were clinically significant. No patient exhibited a corrected QT interval >500 ms at any time, and increases ≥60 ms from baseline were similar between the lumateperone (n = 1, 0.6%) and placebo (n = 3, 1.8%) cohorts.
Complete safety and tolerability data for the adjunctive trial has not yet been published, but discontinuation rates due to treatment-emergent adverse effects for the 3 arms were: lumateperone 42 mg/d: 5.6%; lumateperone 28 mg/d: 1.7%; and placebo: 1.7%. Overall, 81.4% of patients completed the trial, with only 1 serious adverse event (lithium toxicity) occurring in a patient taking lumateperone 42 mg/d. While this led to study discontinuation, it was not considered related to lumateperone exposure by the investigator. There was no worsening of mania in either lumateperone dosage group or the placebo cohort as measured by mean change in YMRS score: -1.2 for placebo, -1.4 for lumateperone 28 mg/d, and -1.6 for lumateperone 42 mg/d. Suicidal behavior was not observed in any group during treatment. The adverse events that occurred at rates ≥5% in lumateperone-treated patients and at more than twice the rate of the placebo group were somnolence/sedation (lumateperone, 13%; placebo, 3%), dizziness (lumateperone, 11%; placebo, 2%), and nausea (lumateperone, 9%; placebo, 4%).13 Rates of EPS were low for both groups: lumateperone, 4.0%, placebo, 2.3%.13 Mean weight changes at Day 43 were +0.23 kg for placebo, +0.02 kg for lumateperone 28 mg/d, and 0.00 kg for lumateperone 42 mg/d.18 Compared to placebo, both doses of lumateperone exhibited comparable effects on serum prolactin and all metabolic parameters, including fasting insulin, fasting glucose, and fasting lipids, none of which were clinically significant.18
Lastly, the package insert notes that in an uncontrolled, open-label trial of lumateperone for up to 6 months in patients with BD depression, the mean weight change was -0.01 ± 3.1 kg at Day 175.13
Continue on to: Pharmacologic profile...
Pharmacologic profile
Lumateperone’s preclinical discovery program found an impact on markers associated with increased glutamatergic neurotransmission, properties that were predicted to yield antidepressant benefit.14,15,24 This is hypothesized to be based on the complex pharmacology of lumateperone, including dopamine D1 agonism, modest SERT occupancy, and near saturation of the 5HT2A receptor.15,22 Dopamine D2 affinity is modest (32 nM), and the D2 receptor occupancy at the 42 mg dose is low. These properties translate to rates of EPS in clinical studies of schizophrenia and BD that are close to that of placebo. Lumateperone has very high affinity for serotonin 5HT2A receptors (Ki 0.54 nM), which also helps mitigate D2-related adverse effects and may be part of the therapeutic antidepressant mechanism. Underlying the tolerability profile is the low affinity for alpha 1-adrenergic receptors (Ki 73 nM), muscarinic and histaminergic receptors (Ki >100 nM for both).
Clinical considerations
Data from the lumateperone BD depression trials led to it being only the second agent approved for acute major depression in BD II patients, and the only agent which has approvals as monotherapy and adjunctive therapy for both BD subtypes. The monotherapy trial results substantiate that lumateperone was robustly effective regardless of BD subtype, with significant improvement in depressive symptoms experienced by patients with BD I (effect size 0.49, P < .0001) and those with BD II (effect size 0.81, P < .001). Effect sizes in acute BD depression studies are much larger in monotherapy trials than in adjunctive trials, as the latter group represents patients who have already failed pretreatment with a mood stabilizer.25,26 In the lurasidone BD I depression trials, the effect size based on mean change in MADRS score over the course of 6 weeks was 0.51 in the monotherapy study compared to 0.34 when used adjunctively with lithium or VPA.25,26 In the lumateperone adjunctive study, the effect size for the difference in mean MADRS total score from baseline for lumateperone 42 mg/d, was 0.27 (P < .05). Subgroup analyses by BD subtype are not yet available for adjunctive use, but the data presented to FDA were sufficient to permit an indication for adjunctive use across both diagnostic groups.
The absence of clinically significant EPS, the minimal impact on metabolic or endocrine parameters, and the lack of a need for titration are all appealing properties. At the present there is only 1 marketed dose (42 mg capsules), so the package insert includes cautionary language regarding situations when a patient might encounter less drug exposure (concurrent use of cytochrome P450 [CYP] 3A4 inducers), or greater drug exposure due to concurrent use of moderate or strong CYP3A4 inhibitors, as well as in patients with moderate or severe hepatic impairment as defined by Child-Pugh Criteria (Child-Pugh B or C). These are not contraindications.
Unique properties of lumateperone include efficacy established as monotherapy for BD I and BD II patients, and efficacy for adjunctive use with lithium or VPA. Additionally, the extremely low rates of significant EPS and lack of clinically significant metabolic or endocrine adverse effects are unique properties of lumateperone.13
Why Rx? Reasons to prescribe lumateperone for adult BD depression patients include:
- data support efficacy for BD I and BD II patients, and for monotherapy or adjunctive use with lithium/VPA
- favorable tolerability profile, including no significant signal for EPS, endocrine or metabolic adverse effects, or QT prolongation
- no need for titration.
Dosing. There is only 1 dose available for lumateperone: 42 mg capsules (Table 3). As the dose cannot be modified, the package insert contains cautionary language regarding situations with less drug exposure (use of CYP3A4 inducers), or greater drug exposure (use with moderate or strong CYP3A4 inhibitors or in patients with moderate or severe hepatic impairment as defined by Child-Pugh Criteria [Child-Pugh B or C]). These are not contraindications. Based on newer pharmacokinetic studies, lumateperone does not need to be dosed with food, and there is no clinically significant interaction with UGT1A4 inhibitors such as VPA.
Contraindications. The only contraindication is known hypersensitivity to lumateperone.
Bottom Line
Data support the efficacy of lumateperone for treating depressive episodes in adults with bipolar I or bipolar II disorder, either as monotherapy or adjunctive to lithium or divalproex/valproate. Potential advantages of lumateperone for this indication include a favorable tolerability profile and no need for titration.
1. Malhi GS, Bell E, Boyce P, et al. The 2020 Royal Australian and New Zealand College of Psychiatrists clinical practice guidelines for mood disorders: bipolar disorder summary. Bipolar Disord. 2020;22(8):805-821.
2. Judd LL, Akishal HS, Schettler PJ, et al. The long-term natural history of the weekly symptomatic status of bipolar I disorder. Arch Gen Psychiatry. 2002;59(6):530-537.
3. Judd LL, Akishal HS, Schettler PJ, et al. A prospective investigation of the natural history of the long-term weekly symptomatic status of bipolar II disorder. Arch Gen Psychiatry. 2003;60(3):261-269.
4. Post RM. Treatment of bipolar depression: evolving recommendations. Psychiatr Clin North Am. 2016;39(1):11-33.
5. Pacchiarotti I, Verdolini N. Antidepressants in bipolar II depression: yes and no. Eur Neuropsychopharmacol 2021;47:48-50.
6. Sachs GS, Nierenberg AA, Calabrese JR, et al. Effectiveness of adjunctive antidepressant treatment for bipolar depression. N Engl J Med. 2007;356(17):1711-1722.
7. Allain N, Leven C, Falissard B, et al. Manic switches induced by antidepressants: an umbrella review comparing randomized controlled trials and observational studies. Acta Psychiatr Scand. 2017;135(2):106-116.
8. Gitlin MJ. Antidepressants in bipolar depression: an enduring controversy. Int J Bipolar Disord. 2018;6(1):25.
9. Verdolini N, Hidalgo-Mazzei D, Del Matto L, et al. Long-term treatment of bipolar disorder type I: a systematic and critical review of clinical guidelines with derived practice algorithms. Bipolar Disord. 2021;23(4):324-340.
10. Fountoulakis KN, Grunze H, Vieta E, et al. The International College of Neuro-Psychopharmacology (CINP) treatment guidelines for bipolar disorder in adults (CINP-BD-2017), part 3: the clinical guidelines. Int J Neuropsychopharmacol. 2017;20(2):180-195.
11. Vraylar [package insert]. Madison, NJ: Allergan USA, Inc.; 2019.
12. Chakrabarty T, Hadijpavlou G, Bond DJ, et al. Bipolar II disorder in context: a review of its epidemiology, disability and economic burden. In: Parker G. Bipolar II Disorder: Modelling, Measuring and Managing. 3rd ed. Cambridge University Press; 2019:49-59.
13. Caplyta [package insert]. New York, NY: Intra-Cellular Therapies, Inc.; 2021.
14. Davis RE, Correll CU. ITI-007 in the treatment of schizophrenia: from novel pharmacology to clinical outcomes. Expert Rev Neurother. 2016;16(6):601-614.
15. Snyder GL, Vanover KE, Zhu H, et al. Functional profile of a novel modulator of serotonin, dopamine, and glutamate neurotransmission. Psychopharmacology (Berl). 2015;232:605-621.
16. Vanover KE, Davis RE, Zhou Y, et al. Dopamine D2 receptor occupancy of lumateperone (ITI-007): a positron emission tomography study in patients with schizophrenia. Neuropsychopharmacology. 2019;44(3):598-605.
17. Calabrese JR, Durgam S, Satlin A, et al. Efficacy and safety of lumateperone for major depressive episodes associated with bipolar I or bipolar II disorder: a phase 3 randomized placebo-controlled trial. Am J Psychiatry 2021;178(12):1098-1106.
18. Yatham LN, et al. Adjunctive lumateperone (ITI-007) in the treatment of bipolar depression: results from a randomized clinical trial. Poster presented at: American Psychiatric Association Annual Meeting. May 1-3, 2021; virtual conference.
19. Vanover K, Glass S, Kozauer S, et al. 30 Lumateperone (ITI-007) for the treatment of schizophrenia: overview of placebo-controlled clinical trials and an open-label safety switching study. CNS Spectrums. 2019;24(1):190-191.
20. Kumar B, Kuhad A, Kuhad A. Lumateperone: a new treatment approach for neuropsychiatric disorders. Drugs Today (Barc). 2018;54(12):713-719.
21. Davis RE, Vanover KE, Zhou Y, et al. ITI-007 demonstrates brain occupancy at serotonin 5-HT2A and dopamine D2 receptors and serotonin transporters using positron emission tomography in healthy volunteers. Psychopharmacology (Berl). 2015;232(15):2863-72.
22. Björkholm C, Marcus MM, Konradsson-Geuken Å, et al. The novel antipsychotic drug brexpiprazole, alone and in combination with escitalopram, facilitates prefrontal glutamatergic transmission via a dopamine D1 receptor-dependent mechanism. Eur Neuropsychopharmacol. 2017;27(4):411-417.
23. Bai Y, Yang H, Chen G, et al. Acceptability of acute and maintenance pharmacotherapy of bipolar disorder: a systematic review of randomized, double-blind, placebo-controlled clinical trials. J Clin Psychopharmacol. 2020;40(2):167-179.
24. Vyas P, Hwang BJ, Braši´c JR. An evaluation of lumateperone tosylate for the treatment of schizophrenia. Expert Opin Pharmacother. 2020;21(2):139-145.
25. Loebel A, Cucchiaro J, Silva R, et al. Lurasidone monotherapy in the treatment of bipolar I depression: a randomized, double-blind, placebo-controlled study. Am J Psychiatry. 2014;171(2):160-168.
26. Loebel A, Cucchiaro J, Silva R, et al. Lurasidone as adjunctive therapy with lithium or valproate for the treatment of bipolar I depression: a randomized, double-blind, placebo-controlled study. Am J Psychiatry. 2014;171(2):169-77.
Among patients with bipolar I or II disorder (BD I or II), major depressive episodes represent the predominant mood state when not euthymic, and are disproportionately associated with the functional disability of BD and its suicide risk.1 Long-term naturalistic studies of weekly mood states in patients with BD I or II found that the proportion of time spent depressed greatly exceeded that spent in a mixed, hypomanic, or manic state during >12 years of follow-up (Figure 12and Figure 23). In the 20th century, traditional antidepressants represented the sole option for management of bipolar depression despite concerns of manic switching or lack of efficacy.4,5 Efficacy concerns were subsequently confirmed by placebo-controlled studies, such as the Systematic Treatment Enhancement Program for Bipolar Disorder (STEP-BD) trial, which found limited effectiveness of adjunctive antidepressants for bipolar depression.6 Comprehensive reviews of randomized controlled trials and observational studies documented the risk of mood cycling and manic switching, especially in patients with BD I, even if antidepressants were used in the presence of mood-stabilizing medications.7,8
Several newer antipsychotics have been FDA-approved for treating depressive episodes associated with BD (Table 1). Approval of olanzapine/fluoxetine combination (OFC) in December 2003 for depressive episodes associated with BD I established that mechanisms exist which can effectively treat acute depressive episodes in patients with BD without an inordinate risk of mood instability. Subsequent approval of quetiapine in October 2006 for depression associated with BD I or II, lurasidone in June 2013, and cariprazine in May 2019 for major depression in BD I greatly expanded the options for management of acute bipolar depression. However, despite the array of molecules available, for certain patients these agents presented tolerability issues such as sedation, weight gain, akathisia, or parkinsonism that could hamper effective treatment.9 Safety and efficacy data in bipolar depression for adjunctive use with lithium or divalproex/valproate (VPA) also are lacking for quetiapine, OFC, and cariprazine.10,11 Moreover, despite the fact that BD II is as prevalent as BD I, and that patients with BD II have comparable rates of comorbidity, chronicity, disability, and suicidality,12 only quetiapine was approved for acute treatment of depression in patients with BD II. This omission is particularly problematic because the depressive episodes of BD II predominate over the time spent in hypomanic and cycling/mixed states (50.3% for depression vs 3.6% for hypomania/cycling/mixed combined), much more than is seen with BD I (31.9% for depression vs 14.8% for hypomania/cycling/mixed combined).2,3 The paucity of data for the use of newer antipsychotics in BD II depression presents a problem when patients cannot tolerate or refuse to consider quetiapine. This prevents clinicians from engaging in evidence-based efficacy discussions of other options, even if it is assumed that the tolerability profile for BD II depression patients may be similar to that seen when these agents are used for BD I depression.
Continue to: Table 1...
Lumateperone (Caplyta) is a novel oral antipsychotic initially approved in 2019 for the treatment of adult patients with schizophrenia. It was approved in December 2021 for the management of depression associated with BD I or II in adults as monotherapy or when used adjunctively with the mood stabilizers lithium or VPA (Table 2).13 Lumateperone possesses certain binding affinities not unlike those in other newer antipsychotics, including high affinity for serotonin 5HT2A receptors (Ki 0.54 nM), low affinity for dopamine D2 receptors (Ki 32 nM), and low affinity for alpha 1-adrenergic receptors (Ki 73 nM), muscarinic and histaminergic receptors (Ki >100 nM for both).13,14 However, there are some distinguishing features: the ratio of 5HT2A receptor affinity to D2 affinity is 60, greater than that for other second-generation antipsychotics (SGAs) such as risperidone (12), olanzapine (12.4) or aripiprazole (0.18).15 At steady state, D2 receptor occupancy remains <40%, and the corresponding rates of extrapyramidal side effects (EPS)/akathisia differed by only 0.4% for lumateperone vs placebo in short-term adult clinical schizophrenia trials,13,16 by 0.2% for lumateperone vs placebo in the monotherapy BD depression study, and by 1.7% in the adjunctive BD depression study.13,17,18 Lumateperone also exhibited no clinically significant impact on metabolic measures or serum prolactin during the 4-week schizophrenia trials, with mean weight gain ≤1 kg for the 42 mg dose across all studies.19 This favorable tolerability profile for endocrine and metabolic adverse effects was also seen in the BD depression studies. Across the 2 BD depression monotherapy trials and the single adjunctive study, the only adverse reactions occurring in ≥5% of lumateperone-treated patients and more than twice the rate of placebo were somnolence/sedation, dizziness, nausea, and dry mouth.13 There was also no single adverse reaction leading to discontinuation in the BD depression studies that occurred at a rate >2% in patients treated with lumateperone.13
In addition to the low risk of adverse events of all types, lumateperone has several pharmacologic features that distinguish it from other agents in its class. One unique aspect of lumateperone’s pharmacology is differential actions at presynaptic and postsynaptic dopamine D2 receptors noted in preclinical assays, a property that may explain its ability to act as an antipsychotic despite low D2 receptor occupancy.16 Preclinical assays also predicted that lumateperone was likely to have antidepressant effects.15,19,20 Unlike every SGA except ziprasidone, lumateperone also possesses moderate binding affinity for serotonin transporters (SERT) (Ki 33 nM), with SERT occupancy of approximately 30% at 42 mg.21 Lumateperone facilitates dopamine D1-mediated neurotransmission, and this is associated with increased glutamate signaling in the prefrontal cortex and antidepressant actions.14,22 While the extent of SERT occupancy is significantly below the ≥80% SERT occupancy seen with selective serotonin reuptake inhibitors, it is hypothesized that near saturation of the 5HT2A receptor might act synergistically with modest 5HT reuptake inhibition and D1-mediated effects to promote the downstream glutamatergic effects that correlate with antidepressant activity (eg, changes in markers such as phosphorylation of glutamate N-methyl-D-aspartate receptor subunits, potentiation of AMPA receptor-mediated transmission).15,22
Continue to: Clinical implications...
Clinical implications
The approval of lumateperone for both BD I and BD II depression, and for its use as monotherapy and for adjunctive use with lithium or VPA, satisfies several unmet needs for the management of acute major depressive episodes in patients with BD. Clinicians now have both safety and tolerability data to present to their bipolar spectrum patients regardless of subtype, and regardless of whether the patient requires mood stabilizer therapy. The tolerability advantages for lumateperone seen in schizophrenia trials were replicated in a diagnostic group that is very sensitive to D2-related adverse effects, and for whom any signal of clinically significant weight gain or sedation often represents an insuperable barrier to patient acceptance.23
Efficacy in adults with BD I or II depression.
The efficacy of lumateperone for major depressive episodes has been established in 2 pivotal, double-blind, placebo-controlled trials in BD I or II patients: 1 monotherapy study,17 and 1 study when used adjunctively to lithium or VPA.18 The first study was a 6-week, double-blind, placebo-controlled monotherapy trial (study 404) in which 377 patients age 18 to 75 with BD I or BD II experiencing a major depressive episode were randomized in a 1:1 manner to lumateperone 42 mg/d or placebo given once daily in the evening. Symptom entry criteria included a Montgomery-Åsberg Depression Rating Scale (MADRS) total score ≥20, and scores ≥4 on the depression and overall BD illness subscales of the Clinical Global Impressions Scale–Bipolar Version Severity scale (CGI-BP-S) at screening and at baseline.17 Study entry also required a score ≤12 on the Young Mania Rating Scale (YMRS) at screening and at baseline. The duration of the major depressive episode must have been ≥2 weeks but <6 months before screening, with symptoms causing clinically significant distress or functional impairment. The primary outcome measure was change from baseline in MADRS. Several secondary efficacy measures were examined, including the proportion of patients meeting criteria for treatment response (≥50% decrease in MADRS), or remission (MADRS score ≤12), and differential changes in MADRS scores from baseline for BD I and BD II subgroups.17
The patient population was 58% female and 91% White, with 79.9% diagnosed as BD I and 20.1% as BD II. The least squares mean changes on the MADRS total score from baseline to Day 43 were lumateperone 42 mg/d: -16.7 points; placebo: -12.1 points (P < .0001), and the effect size for this difference was moderate: 0.56. Secondary analyses indicated that 51.1% of those taking lumateperone 42 mg/d and 36.7% taking placebo met response criteria (P < .001), while 39.9% of those taking lumateperone 42 mg/d and 33.5% taking placebo met remission criteria (P = .018). Importantly, depression improvement was observed both in patients with BD I (effect size 0.49, P < .0001) and in those with BD II (effect size 0.81, P < .001).
The second pivotal trial (study 402) was a 6-week, double-blind, placebo-controlled adjunctive trial in which 528 patients age 18 to 75 with BD I or BD II experiencing a major depressive episode despite treatment with lithium or VPA were randomized in a 1:1:1 manner to lumateperone 28 mg/d, lumateperone 42 mg/d, or placebo given once daily in the evening.18 Like the monotherapy trial, symptom entry criteria included a MADRS total score ≥20, and scores ≥4 on the depression and overall illness CGI-BP-S subscales at screening and baseline.18 Study entry also required a score ≤12 on the YMRS at screening and baseline. The duration of the major depressive episode must have been ≥2 weeks but <6 months before screening, with symptoms causing clinically significant distress or functional impairment. The primary outcome measure was change from baseline in MADRS for lumateperone 42 mg/d compared to placebo. Secondary efficacy measures included MADRS changes for lumateperone 28 mg/d and the proportion of patients meeting criteria for treatment response (≥50% decrease in MADRS) or remission (MADRS score ≤12).
The patient population was 58% female and 88% White, with 83.3% diagnosed as BD I, 16.7% diagnosed as BD II, and 28.6% treated with lithium vs 71.4% on VPA. The effect size for the difference in MADRS total score from baseline to Day 43 for lumateperone 42 mg/d was 0.27 (P < .05), while that for the lumateperone 28 mg/d dose did not reach statistical significance. Secondary analyses indicated that response rates for lumateperone 28 mg/d and lumateperone 42 mg/d were significantly higher than for placebo (both P < .05). Response rates were placebo: 39%; lumateperone 28 mg/d: 50%; and lumateperone 42 mg/d: 45%. Remission rates were similar at Day 43 in both lumateperone groups compared with placebo: placebo: 31%, lumateperone 28 mg/d: 31%, and lumateperone 42 mg/d: 28%.18 As of this writing, a secondary analysis by BD subtype has not yet been presented.
A third study examining lumateperone monotherapy failed to establish superiority of lumateperone over placebo (NCT02600494). The data regarding tolerability from that study were incorporated in product labeling describing adverse reactions.
Continue on to: Adverse reactions...
Adverse reactions
In the positive monotherapy trial, there were 376 patients in the modified intent-to-treat efficacy population to receive lumateperone (N = 188) or placebo (N = 188) with nearly identical completion rates in the active treatment and placebo cohorts: lumateperone, 88.8%; placebo, 88.3%.17 The proportion experiencing mania was low in both cohorts (lumateperone, 1.1%; placebo, 2.1%), and there was 1 case of hypomania in each group. One participant in the lumateperone group and 1 in the placebo group discontinued the study due to a serious adverse event of mania. There was no worsening of mania in either group as measured by mean change in the YMRS score. There was also no suicidal behavior in either cohort during the study. Pooling the 2 monotherapy trials, the adverse events that occurred at ≥5% in lumateperone-treated patients and at more than twice the rate of the placebo group were somnolence/sedation (lumateperone 42 mg/d: 13%, placebo: 3%), dizziness (lumateperone 42 mg/d: 8%, placebo: 4%), and nausea (lumateperone 42 mg/d: 8%, placebo: 3%).13 Rates of EPS were low for both groups: lumateperone 42 mg/d: 1.3%, placebo: 1.1%.13 Mean weight change at Day 43 was +0.11 kg for lumateperone and +0.03 kg for placebo in the positive monotherapy trial.17 Moreover, compared to placebo, lumateperone exhibited comparable effects on serum prolactin and all metabolic parameters, including fasting insulin, fasting glucose, and fasting lipids, none of which were clinically significant. No patient exhibited a corrected QT interval >500 ms at any time, and increases ≥60 ms from baseline were similar between the lumateperone (n = 1, 0.6%) and placebo (n = 3, 1.8%) cohorts.
Complete safety and tolerability data for the adjunctive trial has not yet been published, but discontinuation rates due to treatment-emergent adverse effects for the 3 arms were: lumateperone 42 mg/d: 5.6%; lumateperone 28 mg/d: 1.7%; and placebo: 1.7%. Overall, 81.4% of patients completed the trial, with only 1 serious adverse event (lithium toxicity) occurring in a patient taking lumateperone 42 mg/d. While this led to study discontinuation, it was not considered related to lumateperone exposure by the investigator. There was no worsening of mania in either lumateperone dosage group or the placebo cohort as measured by mean change in YMRS score: -1.2 for placebo, -1.4 for lumateperone 28 mg/d, and -1.6 for lumateperone 42 mg/d. Suicidal behavior was not observed in any group during treatment. The adverse events that occurred at rates ≥5% in lumateperone-treated patients and at more than twice the rate of the placebo group were somnolence/sedation (lumateperone, 13%; placebo, 3%), dizziness (lumateperone, 11%; placebo, 2%), and nausea (lumateperone, 9%; placebo, 4%).13 Rates of EPS were low for both groups: lumateperone, 4.0%, placebo, 2.3%.13 Mean weight changes at Day 43 were +0.23 kg for placebo, +0.02 kg for lumateperone 28 mg/d, and 0.00 kg for lumateperone 42 mg/d.18 Compared to placebo, both doses of lumateperone exhibited comparable effects on serum prolactin and all metabolic parameters, including fasting insulin, fasting glucose, and fasting lipids, none of which were clinically significant.18
Lastly, the package insert notes that in an uncontrolled, open-label trial of lumateperone for up to 6 months in patients with BD depression, the mean weight change was -0.01 ± 3.1 kg at Day 175.13
Continue on to: Pharmacologic profile...
Pharmacologic profile
Lumateperone’s preclinical discovery program found an impact on markers associated with increased glutamatergic neurotransmission, properties that were predicted to yield antidepressant benefit.14,15,24 This is hypothesized to be based on the complex pharmacology of lumateperone, including dopamine D1 agonism, modest SERT occupancy, and near saturation of the 5HT2A receptor.15,22 Dopamine D2 affinity is modest (32 nM), and the D2 receptor occupancy at the 42 mg dose is low. These properties translate to rates of EPS in clinical studies of schizophrenia and BD that are close to that of placebo. Lumateperone has very high affinity for serotonin 5HT2A receptors (Ki 0.54 nM), which also helps mitigate D2-related adverse effects and may be part of the therapeutic antidepressant mechanism. Underlying the tolerability profile is the low affinity for alpha 1-adrenergic receptors (Ki 73 nM), muscarinic and histaminergic receptors (Ki >100 nM for both).
Clinical considerations
Data from the lumateperone BD depression trials led to it being only the second agent approved for acute major depression in BD II patients, and the only agent which has approvals as monotherapy and adjunctive therapy for both BD subtypes. The monotherapy trial results substantiate that lumateperone was robustly effective regardless of BD subtype, with significant improvement in depressive symptoms experienced by patients with BD I (effect size 0.49, P < .0001) and those with BD II (effect size 0.81, P < .001). Effect sizes in acute BD depression studies are much larger in monotherapy trials than in adjunctive trials, as the latter group represents patients who have already failed pretreatment with a mood stabilizer.25,26 In the lurasidone BD I depression trials, the effect size based on mean change in MADRS score over the course of 6 weeks was 0.51 in the monotherapy study compared to 0.34 when used adjunctively with lithium or VPA.25,26 In the lumateperone adjunctive study, the effect size for the difference in mean MADRS total score from baseline for lumateperone 42 mg/d, was 0.27 (P < .05). Subgroup analyses by BD subtype are not yet available for adjunctive use, but the data presented to FDA were sufficient to permit an indication for adjunctive use across both diagnostic groups.
The absence of clinically significant EPS, the minimal impact on metabolic or endocrine parameters, and the lack of a need for titration are all appealing properties. At the present there is only 1 marketed dose (42 mg capsules), so the package insert includes cautionary language regarding situations when a patient might encounter less drug exposure (concurrent use of cytochrome P450 [CYP] 3A4 inducers), or greater drug exposure due to concurrent use of moderate or strong CYP3A4 inhibitors, as well as in patients with moderate or severe hepatic impairment as defined by Child-Pugh Criteria (Child-Pugh B or C). These are not contraindications.
Unique properties of lumateperone include efficacy established as monotherapy for BD I and BD II patients, and efficacy for adjunctive use with lithium or VPA. Additionally, the extremely low rates of significant EPS and lack of clinically significant metabolic or endocrine adverse effects are unique properties of lumateperone.13
Why Rx? Reasons to prescribe lumateperone for adult BD depression patients include:
- data support efficacy for BD I and BD II patients, and for monotherapy or adjunctive use with lithium/VPA
- favorable tolerability profile, including no significant signal for EPS, endocrine or metabolic adverse effects, or QT prolongation
- no need for titration.
Dosing. There is only 1 dose available for lumateperone: 42 mg capsules (Table 3). As the dose cannot be modified, the package insert contains cautionary language regarding situations with less drug exposure (use of CYP3A4 inducers), or greater drug exposure (use with moderate or strong CYP3A4 inhibitors or in patients with moderate or severe hepatic impairment as defined by Child-Pugh Criteria [Child-Pugh B or C]). These are not contraindications. Based on newer pharmacokinetic studies, lumateperone does not need to be dosed with food, and there is no clinically significant interaction with UGT1A4 inhibitors such as VPA.
Contraindications. The only contraindication is known hypersensitivity to lumateperone.
Bottom Line
Data support the efficacy of lumateperone for treating depressive episodes in adults with bipolar I or bipolar II disorder, either as monotherapy or adjunctive to lithium or divalproex/valproate. Potential advantages of lumateperone for this indication include a favorable tolerability profile and no need for titration.
Among patients with bipolar I or II disorder (BD I or II), major depressive episodes represent the predominant mood state when not euthymic, and are disproportionately associated with the functional disability of BD and its suicide risk.1 Long-term naturalistic studies of weekly mood states in patients with BD I or II found that the proportion of time spent depressed greatly exceeded that spent in a mixed, hypomanic, or manic state during >12 years of follow-up (Figure 12and Figure 23). In the 20th century, traditional antidepressants represented the sole option for management of bipolar depression despite concerns of manic switching or lack of efficacy.4,5 Efficacy concerns were subsequently confirmed by placebo-controlled studies, such as the Systematic Treatment Enhancement Program for Bipolar Disorder (STEP-BD) trial, which found limited effectiveness of adjunctive antidepressants for bipolar depression.6 Comprehensive reviews of randomized controlled trials and observational studies documented the risk of mood cycling and manic switching, especially in patients with BD I, even if antidepressants were used in the presence of mood-stabilizing medications.7,8
Several newer antipsychotics have been FDA-approved for treating depressive episodes associated with BD (Table 1). Approval of olanzapine/fluoxetine combination (OFC) in December 2003 for depressive episodes associated with BD I established that mechanisms exist which can effectively treat acute depressive episodes in patients with BD without an inordinate risk of mood instability. Subsequent approval of quetiapine in October 2006 for depression associated with BD I or II, lurasidone in June 2013, and cariprazine in May 2019 for major depression in BD I greatly expanded the options for management of acute bipolar depression. However, despite the array of molecules available, for certain patients these agents presented tolerability issues such as sedation, weight gain, akathisia, or parkinsonism that could hamper effective treatment.9 Safety and efficacy data in bipolar depression for adjunctive use with lithium or divalproex/valproate (VPA) also are lacking for quetiapine, OFC, and cariprazine.10,11 Moreover, despite the fact that BD II is as prevalent as BD I, and that patients with BD II have comparable rates of comorbidity, chronicity, disability, and suicidality,12 only quetiapine was approved for acute treatment of depression in patients with BD II. This omission is particularly problematic because the depressive episodes of BD II predominate over the time spent in hypomanic and cycling/mixed states (50.3% for depression vs 3.6% for hypomania/cycling/mixed combined), much more than is seen with BD I (31.9% for depression vs 14.8% for hypomania/cycling/mixed combined).2,3 The paucity of data for the use of newer antipsychotics in BD II depression presents a problem when patients cannot tolerate or refuse to consider quetiapine. This prevents clinicians from engaging in evidence-based efficacy discussions of other options, even if it is assumed that the tolerability profile for BD II depression patients may be similar to that seen when these agents are used for BD I depression.
Continue to: Table 1...
Lumateperone (Caplyta) is a novel oral antipsychotic initially approved in 2019 for the treatment of adult patients with schizophrenia. It was approved in December 2021 for the management of depression associated with BD I or II in adults as monotherapy or when used adjunctively with the mood stabilizers lithium or VPA (Table 2).13 Lumateperone possesses certain binding affinities not unlike those in other newer antipsychotics, including high affinity for serotonin 5HT2A receptors (Ki 0.54 nM), low affinity for dopamine D2 receptors (Ki 32 nM), and low affinity for alpha 1-adrenergic receptors (Ki 73 nM), muscarinic and histaminergic receptors (Ki >100 nM for both).13,14 However, there are some distinguishing features: the ratio of 5HT2A receptor affinity to D2 affinity is 60, greater than that for other second-generation antipsychotics (SGAs) such as risperidone (12), olanzapine (12.4) or aripiprazole (0.18).15 At steady state, D2 receptor occupancy remains <40%, and the corresponding rates of extrapyramidal side effects (EPS)/akathisia differed by only 0.4% for lumateperone vs placebo in short-term adult clinical schizophrenia trials,13,16 by 0.2% for lumateperone vs placebo in the monotherapy BD depression study, and by 1.7% in the adjunctive BD depression study.13,17,18 Lumateperone also exhibited no clinically significant impact on metabolic measures or serum prolactin during the 4-week schizophrenia trials, with mean weight gain ≤1 kg for the 42 mg dose across all studies.19 This favorable tolerability profile for endocrine and metabolic adverse effects was also seen in the BD depression studies. Across the 2 BD depression monotherapy trials and the single adjunctive study, the only adverse reactions occurring in ≥5% of lumateperone-treated patients and more than twice the rate of placebo were somnolence/sedation, dizziness, nausea, and dry mouth.13 There was also no single adverse reaction leading to discontinuation in the BD depression studies that occurred at a rate >2% in patients treated with lumateperone.13
In addition to the low risk of adverse events of all types, lumateperone has several pharmacologic features that distinguish it from other agents in its class. One unique aspect of lumateperone’s pharmacology is differential actions at presynaptic and postsynaptic dopamine D2 receptors noted in preclinical assays, a property that may explain its ability to act as an antipsychotic despite low D2 receptor occupancy.16 Preclinical assays also predicted that lumateperone was likely to have antidepressant effects.15,19,20 Unlike every SGA except ziprasidone, lumateperone also possesses moderate binding affinity for serotonin transporters (SERT) (Ki 33 nM), with SERT occupancy of approximately 30% at 42 mg.21 Lumateperone facilitates dopamine D1-mediated neurotransmission, and this is associated with increased glutamate signaling in the prefrontal cortex and antidepressant actions.14,22 While the extent of SERT occupancy is significantly below the ≥80% SERT occupancy seen with selective serotonin reuptake inhibitors, it is hypothesized that near saturation of the 5HT2A receptor might act synergistically with modest 5HT reuptake inhibition and D1-mediated effects to promote the downstream glutamatergic effects that correlate with antidepressant activity (eg, changes in markers such as phosphorylation of glutamate N-methyl-D-aspartate receptor subunits, potentiation of AMPA receptor-mediated transmission).15,22
Continue to: Clinical implications...
Clinical implications
The approval of lumateperone for both BD I and BD II depression, and for its use as monotherapy and for adjunctive use with lithium or VPA, satisfies several unmet needs for the management of acute major depressive episodes in patients with BD. Clinicians now have both safety and tolerability data to present to their bipolar spectrum patients regardless of subtype, and regardless of whether the patient requires mood stabilizer therapy. The tolerability advantages for lumateperone seen in schizophrenia trials were replicated in a diagnostic group that is very sensitive to D2-related adverse effects, and for whom any signal of clinically significant weight gain or sedation often represents an insuperable barrier to patient acceptance.23
Efficacy in adults with BD I or II depression.
The efficacy of lumateperone for major depressive episodes has been established in 2 pivotal, double-blind, placebo-controlled trials in BD I or II patients: 1 monotherapy study,17 and 1 study when used adjunctively to lithium or VPA.18 The first study was a 6-week, double-blind, placebo-controlled monotherapy trial (study 404) in which 377 patients age 18 to 75 with BD I or BD II experiencing a major depressive episode were randomized in a 1:1 manner to lumateperone 42 mg/d or placebo given once daily in the evening. Symptom entry criteria included a Montgomery-Åsberg Depression Rating Scale (MADRS) total score ≥20, and scores ≥4 on the depression and overall BD illness subscales of the Clinical Global Impressions Scale–Bipolar Version Severity scale (CGI-BP-S) at screening and at baseline.17 Study entry also required a score ≤12 on the Young Mania Rating Scale (YMRS) at screening and at baseline. The duration of the major depressive episode must have been ≥2 weeks but <6 months before screening, with symptoms causing clinically significant distress or functional impairment. The primary outcome measure was change from baseline in MADRS. Several secondary efficacy measures were examined, including the proportion of patients meeting criteria for treatment response (≥50% decrease in MADRS), or remission (MADRS score ≤12), and differential changes in MADRS scores from baseline for BD I and BD II subgroups.17
The patient population was 58% female and 91% White, with 79.9% diagnosed as BD I and 20.1% as BD II. The least squares mean changes on the MADRS total score from baseline to Day 43 were lumateperone 42 mg/d: -16.7 points; placebo: -12.1 points (P < .0001), and the effect size for this difference was moderate: 0.56. Secondary analyses indicated that 51.1% of those taking lumateperone 42 mg/d and 36.7% taking placebo met response criteria (P < .001), while 39.9% of those taking lumateperone 42 mg/d and 33.5% taking placebo met remission criteria (P = .018). Importantly, depression improvement was observed both in patients with BD I (effect size 0.49, P < .0001) and in those with BD II (effect size 0.81, P < .001).
The second pivotal trial (study 402) was a 6-week, double-blind, placebo-controlled adjunctive trial in which 528 patients age 18 to 75 with BD I or BD II experiencing a major depressive episode despite treatment with lithium or VPA were randomized in a 1:1:1 manner to lumateperone 28 mg/d, lumateperone 42 mg/d, or placebo given once daily in the evening.18 Like the monotherapy trial, symptom entry criteria included a MADRS total score ≥20, and scores ≥4 on the depression and overall illness CGI-BP-S subscales at screening and baseline.18 Study entry also required a score ≤12 on the YMRS at screening and baseline. The duration of the major depressive episode must have been ≥2 weeks but <6 months before screening, with symptoms causing clinically significant distress or functional impairment. The primary outcome measure was change from baseline in MADRS for lumateperone 42 mg/d compared to placebo. Secondary efficacy measures included MADRS changes for lumateperone 28 mg/d and the proportion of patients meeting criteria for treatment response (≥50% decrease in MADRS) or remission (MADRS score ≤12).
The patient population was 58% female and 88% White, with 83.3% diagnosed as BD I, 16.7% diagnosed as BD II, and 28.6% treated with lithium vs 71.4% on VPA. The effect size for the difference in MADRS total score from baseline to Day 43 for lumateperone 42 mg/d was 0.27 (P < .05), while that for the lumateperone 28 mg/d dose did not reach statistical significance. Secondary analyses indicated that response rates for lumateperone 28 mg/d and lumateperone 42 mg/d were significantly higher than for placebo (both P < .05). Response rates were placebo: 39%; lumateperone 28 mg/d: 50%; and lumateperone 42 mg/d: 45%. Remission rates were similar at Day 43 in both lumateperone groups compared with placebo: placebo: 31%, lumateperone 28 mg/d: 31%, and lumateperone 42 mg/d: 28%.18 As of this writing, a secondary analysis by BD subtype has not yet been presented.
A third study examining lumateperone monotherapy failed to establish superiority of lumateperone over placebo (NCT02600494). The data regarding tolerability from that study were incorporated in product labeling describing adverse reactions.
Continue on to: Adverse reactions...
Adverse reactions
In the positive monotherapy trial, there were 376 patients in the modified intent-to-treat efficacy population to receive lumateperone (N = 188) or placebo (N = 188) with nearly identical completion rates in the active treatment and placebo cohorts: lumateperone, 88.8%; placebo, 88.3%.17 The proportion experiencing mania was low in both cohorts (lumateperone, 1.1%; placebo, 2.1%), and there was 1 case of hypomania in each group. One participant in the lumateperone group and 1 in the placebo group discontinued the study due to a serious adverse event of mania. There was no worsening of mania in either group as measured by mean change in the YMRS score. There was also no suicidal behavior in either cohort during the study. Pooling the 2 monotherapy trials, the adverse events that occurred at ≥5% in lumateperone-treated patients and at more than twice the rate of the placebo group were somnolence/sedation (lumateperone 42 mg/d: 13%, placebo: 3%), dizziness (lumateperone 42 mg/d: 8%, placebo: 4%), and nausea (lumateperone 42 mg/d: 8%, placebo: 3%).13 Rates of EPS were low for both groups: lumateperone 42 mg/d: 1.3%, placebo: 1.1%.13 Mean weight change at Day 43 was +0.11 kg for lumateperone and +0.03 kg for placebo in the positive monotherapy trial.17 Moreover, compared to placebo, lumateperone exhibited comparable effects on serum prolactin and all metabolic parameters, including fasting insulin, fasting glucose, and fasting lipids, none of which were clinically significant. No patient exhibited a corrected QT interval >500 ms at any time, and increases ≥60 ms from baseline were similar between the lumateperone (n = 1, 0.6%) and placebo (n = 3, 1.8%) cohorts.
Complete safety and tolerability data for the adjunctive trial has not yet been published, but discontinuation rates due to treatment-emergent adverse effects for the 3 arms were: lumateperone 42 mg/d: 5.6%; lumateperone 28 mg/d: 1.7%; and placebo: 1.7%. Overall, 81.4% of patients completed the trial, with only 1 serious adverse event (lithium toxicity) occurring in a patient taking lumateperone 42 mg/d. While this led to study discontinuation, it was not considered related to lumateperone exposure by the investigator. There was no worsening of mania in either lumateperone dosage group or the placebo cohort as measured by mean change in YMRS score: -1.2 for placebo, -1.4 for lumateperone 28 mg/d, and -1.6 for lumateperone 42 mg/d. Suicidal behavior was not observed in any group during treatment. The adverse events that occurred at rates ≥5% in lumateperone-treated patients and at more than twice the rate of the placebo group were somnolence/sedation (lumateperone, 13%; placebo, 3%), dizziness (lumateperone, 11%; placebo, 2%), and nausea (lumateperone, 9%; placebo, 4%).13 Rates of EPS were low for both groups: lumateperone, 4.0%, placebo, 2.3%.13 Mean weight changes at Day 43 were +0.23 kg for placebo, +0.02 kg for lumateperone 28 mg/d, and 0.00 kg for lumateperone 42 mg/d.18 Compared to placebo, both doses of lumateperone exhibited comparable effects on serum prolactin and all metabolic parameters, including fasting insulin, fasting glucose, and fasting lipids, none of which were clinically significant.18
Lastly, the package insert notes that in an uncontrolled, open-label trial of lumateperone for up to 6 months in patients with BD depression, the mean weight change was -0.01 ± 3.1 kg at Day 175.13
Continue on to: Pharmacologic profile...
Pharmacologic profile
Lumateperone’s preclinical discovery program found an impact on markers associated with increased glutamatergic neurotransmission, properties that were predicted to yield antidepressant benefit.14,15,24 This is hypothesized to be based on the complex pharmacology of lumateperone, including dopamine D1 agonism, modest SERT occupancy, and near saturation of the 5HT2A receptor.15,22 Dopamine D2 affinity is modest (32 nM), and the D2 receptor occupancy at the 42 mg dose is low. These properties translate to rates of EPS in clinical studies of schizophrenia and BD that are close to that of placebo. Lumateperone has very high affinity for serotonin 5HT2A receptors (Ki 0.54 nM), which also helps mitigate D2-related adverse effects and may be part of the therapeutic antidepressant mechanism. Underlying the tolerability profile is the low affinity for alpha 1-adrenergic receptors (Ki 73 nM), muscarinic and histaminergic receptors (Ki >100 nM for both).
Clinical considerations
Data from the lumateperone BD depression trials led to it being only the second agent approved for acute major depression in BD II patients, and the only agent which has approvals as monotherapy and adjunctive therapy for both BD subtypes. The monotherapy trial results substantiate that lumateperone was robustly effective regardless of BD subtype, with significant improvement in depressive symptoms experienced by patients with BD I (effect size 0.49, P < .0001) and those with BD II (effect size 0.81, P < .001). Effect sizes in acute BD depression studies are much larger in monotherapy trials than in adjunctive trials, as the latter group represents patients who have already failed pretreatment with a mood stabilizer.25,26 In the lurasidone BD I depression trials, the effect size based on mean change in MADRS score over the course of 6 weeks was 0.51 in the monotherapy study compared to 0.34 when used adjunctively with lithium or VPA.25,26 In the lumateperone adjunctive study, the effect size for the difference in mean MADRS total score from baseline for lumateperone 42 mg/d, was 0.27 (P < .05). Subgroup analyses by BD subtype are not yet available for adjunctive use, but the data presented to FDA were sufficient to permit an indication for adjunctive use across both diagnostic groups.
The absence of clinically significant EPS, the minimal impact on metabolic or endocrine parameters, and the lack of a need for titration are all appealing properties. At the present there is only 1 marketed dose (42 mg capsules), so the package insert includes cautionary language regarding situations when a patient might encounter less drug exposure (concurrent use of cytochrome P450 [CYP] 3A4 inducers), or greater drug exposure due to concurrent use of moderate or strong CYP3A4 inhibitors, as well as in patients with moderate or severe hepatic impairment as defined by Child-Pugh Criteria (Child-Pugh B or C). These are not contraindications.
Unique properties of lumateperone include efficacy established as monotherapy for BD I and BD II patients, and efficacy for adjunctive use with lithium or VPA. Additionally, the extremely low rates of significant EPS and lack of clinically significant metabolic or endocrine adverse effects are unique properties of lumateperone.13
Why Rx? Reasons to prescribe lumateperone for adult BD depression patients include:
- data support efficacy for BD I and BD II patients, and for monotherapy or adjunctive use with lithium/VPA
- favorable tolerability profile, including no significant signal for EPS, endocrine or metabolic adverse effects, or QT prolongation
- no need for titration.
Dosing. There is only 1 dose available for lumateperone: 42 mg capsules (Table 3). As the dose cannot be modified, the package insert contains cautionary language regarding situations with less drug exposure (use of CYP3A4 inducers), or greater drug exposure (use with moderate or strong CYP3A4 inhibitors or in patients with moderate or severe hepatic impairment as defined by Child-Pugh Criteria [Child-Pugh B or C]). These are not contraindications. Based on newer pharmacokinetic studies, lumateperone does not need to be dosed with food, and there is no clinically significant interaction with UGT1A4 inhibitors such as VPA.
Contraindications. The only contraindication is known hypersensitivity to lumateperone.
Bottom Line
Data support the efficacy of lumateperone for treating depressive episodes in adults with bipolar I or bipolar II disorder, either as monotherapy or adjunctive to lithium or divalproex/valproate. Potential advantages of lumateperone for this indication include a favorable tolerability profile and no need for titration.
1. Malhi GS, Bell E, Boyce P, et al. The 2020 Royal Australian and New Zealand College of Psychiatrists clinical practice guidelines for mood disorders: bipolar disorder summary. Bipolar Disord. 2020;22(8):805-821.
2. Judd LL, Akishal HS, Schettler PJ, et al. The long-term natural history of the weekly symptomatic status of bipolar I disorder. Arch Gen Psychiatry. 2002;59(6):530-537.
3. Judd LL, Akishal HS, Schettler PJ, et al. A prospective investigation of the natural history of the long-term weekly symptomatic status of bipolar II disorder. Arch Gen Psychiatry. 2003;60(3):261-269.
4. Post RM. Treatment of bipolar depression: evolving recommendations. Psychiatr Clin North Am. 2016;39(1):11-33.
5. Pacchiarotti I, Verdolini N. Antidepressants in bipolar II depression: yes and no. Eur Neuropsychopharmacol 2021;47:48-50.
6. Sachs GS, Nierenberg AA, Calabrese JR, et al. Effectiveness of adjunctive antidepressant treatment for bipolar depression. N Engl J Med. 2007;356(17):1711-1722.
7. Allain N, Leven C, Falissard B, et al. Manic switches induced by antidepressants: an umbrella review comparing randomized controlled trials and observational studies. Acta Psychiatr Scand. 2017;135(2):106-116.
8. Gitlin MJ. Antidepressants in bipolar depression: an enduring controversy. Int J Bipolar Disord. 2018;6(1):25.
9. Verdolini N, Hidalgo-Mazzei D, Del Matto L, et al. Long-term treatment of bipolar disorder type I: a systematic and critical review of clinical guidelines with derived practice algorithms. Bipolar Disord. 2021;23(4):324-340.
10. Fountoulakis KN, Grunze H, Vieta E, et al. The International College of Neuro-Psychopharmacology (CINP) treatment guidelines for bipolar disorder in adults (CINP-BD-2017), part 3: the clinical guidelines. Int J Neuropsychopharmacol. 2017;20(2):180-195.
11. Vraylar [package insert]. Madison, NJ: Allergan USA, Inc.; 2019.
12. Chakrabarty T, Hadijpavlou G, Bond DJ, et al. Bipolar II disorder in context: a review of its epidemiology, disability and economic burden. In: Parker G. Bipolar II Disorder: Modelling, Measuring and Managing. 3rd ed. Cambridge University Press; 2019:49-59.
13. Caplyta [package insert]. New York, NY: Intra-Cellular Therapies, Inc.; 2021.
14. Davis RE, Correll CU. ITI-007 in the treatment of schizophrenia: from novel pharmacology to clinical outcomes. Expert Rev Neurother. 2016;16(6):601-614.
15. Snyder GL, Vanover KE, Zhu H, et al. Functional profile of a novel modulator of serotonin, dopamine, and glutamate neurotransmission. Psychopharmacology (Berl). 2015;232:605-621.
16. Vanover KE, Davis RE, Zhou Y, et al. Dopamine D2 receptor occupancy of lumateperone (ITI-007): a positron emission tomography study in patients with schizophrenia. Neuropsychopharmacology. 2019;44(3):598-605.
17. Calabrese JR, Durgam S, Satlin A, et al. Efficacy and safety of lumateperone for major depressive episodes associated with bipolar I or bipolar II disorder: a phase 3 randomized placebo-controlled trial. Am J Psychiatry 2021;178(12):1098-1106.
18. Yatham LN, et al. Adjunctive lumateperone (ITI-007) in the treatment of bipolar depression: results from a randomized clinical trial. Poster presented at: American Psychiatric Association Annual Meeting. May 1-3, 2021; virtual conference.
19. Vanover K, Glass S, Kozauer S, et al. 30 Lumateperone (ITI-007) for the treatment of schizophrenia: overview of placebo-controlled clinical trials and an open-label safety switching study. CNS Spectrums. 2019;24(1):190-191.
20. Kumar B, Kuhad A, Kuhad A. Lumateperone: a new treatment approach for neuropsychiatric disorders. Drugs Today (Barc). 2018;54(12):713-719.
21. Davis RE, Vanover KE, Zhou Y, et al. ITI-007 demonstrates brain occupancy at serotonin 5-HT2A and dopamine D2 receptors and serotonin transporters using positron emission tomography in healthy volunteers. Psychopharmacology (Berl). 2015;232(15):2863-72.
22. Björkholm C, Marcus MM, Konradsson-Geuken Å, et al. The novel antipsychotic drug brexpiprazole, alone and in combination with escitalopram, facilitates prefrontal glutamatergic transmission via a dopamine D1 receptor-dependent mechanism. Eur Neuropsychopharmacol. 2017;27(4):411-417.
23. Bai Y, Yang H, Chen G, et al. Acceptability of acute and maintenance pharmacotherapy of bipolar disorder: a systematic review of randomized, double-blind, placebo-controlled clinical trials. J Clin Psychopharmacol. 2020;40(2):167-179.
24. Vyas P, Hwang BJ, Braši´c JR. An evaluation of lumateperone tosylate for the treatment of schizophrenia. Expert Opin Pharmacother. 2020;21(2):139-145.
25. Loebel A, Cucchiaro J, Silva R, et al. Lurasidone monotherapy in the treatment of bipolar I depression: a randomized, double-blind, placebo-controlled study. Am J Psychiatry. 2014;171(2):160-168.
26. Loebel A, Cucchiaro J, Silva R, et al. Lurasidone as adjunctive therapy with lithium or valproate for the treatment of bipolar I depression: a randomized, double-blind, placebo-controlled study. Am J Psychiatry. 2014;171(2):169-77.
1. Malhi GS, Bell E, Boyce P, et al. The 2020 Royal Australian and New Zealand College of Psychiatrists clinical practice guidelines for mood disorders: bipolar disorder summary. Bipolar Disord. 2020;22(8):805-821.
2. Judd LL, Akishal HS, Schettler PJ, et al. The long-term natural history of the weekly symptomatic status of bipolar I disorder. Arch Gen Psychiatry. 2002;59(6):530-537.
3. Judd LL, Akishal HS, Schettler PJ, et al. A prospective investigation of the natural history of the long-term weekly symptomatic status of bipolar II disorder. Arch Gen Psychiatry. 2003;60(3):261-269.
4. Post RM. Treatment of bipolar depression: evolving recommendations. Psychiatr Clin North Am. 2016;39(1):11-33.
5. Pacchiarotti I, Verdolini N. Antidepressants in bipolar II depression: yes and no. Eur Neuropsychopharmacol 2021;47:48-50.
6. Sachs GS, Nierenberg AA, Calabrese JR, et al. Effectiveness of adjunctive antidepressant treatment for bipolar depression. N Engl J Med. 2007;356(17):1711-1722.
7. Allain N, Leven C, Falissard B, et al. Manic switches induced by antidepressants: an umbrella review comparing randomized controlled trials and observational studies. Acta Psychiatr Scand. 2017;135(2):106-116.
8. Gitlin MJ. Antidepressants in bipolar depression: an enduring controversy. Int J Bipolar Disord. 2018;6(1):25.
9. Verdolini N, Hidalgo-Mazzei D, Del Matto L, et al. Long-term treatment of bipolar disorder type I: a systematic and critical review of clinical guidelines with derived practice algorithms. Bipolar Disord. 2021;23(4):324-340.
10. Fountoulakis KN, Grunze H, Vieta E, et al. The International College of Neuro-Psychopharmacology (CINP) treatment guidelines for bipolar disorder in adults (CINP-BD-2017), part 3: the clinical guidelines. Int J Neuropsychopharmacol. 2017;20(2):180-195.
11. Vraylar [package insert]. Madison, NJ: Allergan USA, Inc.; 2019.
12. Chakrabarty T, Hadijpavlou G, Bond DJ, et al. Bipolar II disorder in context: a review of its epidemiology, disability and economic burden. In: Parker G. Bipolar II Disorder: Modelling, Measuring and Managing. 3rd ed. Cambridge University Press; 2019:49-59.
13. Caplyta [package insert]. New York, NY: Intra-Cellular Therapies, Inc.; 2021.
14. Davis RE, Correll CU. ITI-007 in the treatment of schizophrenia: from novel pharmacology to clinical outcomes. Expert Rev Neurother. 2016;16(6):601-614.
15. Snyder GL, Vanover KE, Zhu H, et al. Functional profile of a novel modulator of serotonin, dopamine, and glutamate neurotransmission. Psychopharmacology (Berl). 2015;232:605-621.
16. Vanover KE, Davis RE, Zhou Y, et al. Dopamine D2 receptor occupancy of lumateperone (ITI-007): a positron emission tomography study in patients with schizophrenia. Neuropsychopharmacology. 2019;44(3):598-605.
17. Calabrese JR, Durgam S, Satlin A, et al. Efficacy and safety of lumateperone for major depressive episodes associated with bipolar I or bipolar II disorder: a phase 3 randomized placebo-controlled trial. Am J Psychiatry 2021;178(12):1098-1106.
18. Yatham LN, et al. Adjunctive lumateperone (ITI-007) in the treatment of bipolar depression: results from a randomized clinical trial. Poster presented at: American Psychiatric Association Annual Meeting. May 1-3, 2021; virtual conference.
19. Vanover K, Glass S, Kozauer S, et al. 30 Lumateperone (ITI-007) for the treatment of schizophrenia: overview of placebo-controlled clinical trials and an open-label safety switching study. CNS Spectrums. 2019;24(1):190-191.
20. Kumar B, Kuhad A, Kuhad A. Lumateperone: a new treatment approach for neuropsychiatric disorders. Drugs Today (Barc). 2018;54(12):713-719.
21. Davis RE, Vanover KE, Zhou Y, et al. ITI-007 demonstrates brain occupancy at serotonin 5-HT2A and dopamine D2 receptors and serotonin transporters using positron emission tomography in healthy volunteers. Psychopharmacology (Berl). 2015;232(15):2863-72.
22. Björkholm C, Marcus MM, Konradsson-Geuken Å, et al. The novel antipsychotic drug brexpiprazole, alone and in combination with escitalopram, facilitates prefrontal glutamatergic transmission via a dopamine D1 receptor-dependent mechanism. Eur Neuropsychopharmacol. 2017;27(4):411-417.
23. Bai Y, Yang H, Chen G, et al. Acceptability of acute and maintenance pharmacotherapy of bipolar disorder: a systematic review of randomized, double-blind, placebo-controlled clinical trials. J Clin Psychopharmacol. 2020;40(2):167-179.
24. Vyas P, Hwang BJ, Braši´c JR. An evaluation of lumateperone tosylate for the treatment of schizophrenia. Expert Opin Pharmacother. 2020;21(2):139-145.
25. Loebel A, Cucchiaro J, Silva R, et al. Lurasidone monotherapy in the treatment of bipolar I depression: a randomized, double-blind, placebo-controlled study. Am J Psychiatry. 2014;171(2):160-168.
26. Loebel A, Cucchiaro J, Silva R, et al. Lurasidone as adjunctive therapy with lithium or valproate for the treatment of bipolar I depression: a randomized, double-blind, placebo-controlled study. Am J Psychiatry. 2014;171(2):169-77.
Differentiating pediatric schizotypal disorder from schizophrenia and autism
Schizotypal disorder is a complex condition that is characterized by cognitive-perceptual impairments, oddness, disorganization, and interpersonal difficulties. It often is unrecognized or underdiagnosed. In DSM-5, schizotypal disorder is categorized a personality disorder, but it is also considered part of the schizophrenia spectrum disorders.1 The diagnostic criteria for schizotypal disorder are outlined in the Table.1,2
Although schizotypal disorder has a lifetime prevalence of approximately 4% in the general population of the United States,2 it can present during childhood or adolescence and may be overlooked in the differential diagnosis for psychotic symptoms in pediatric patients.3 Schizotypal disorder of childhood (SDC) can present with significant overlap with several pediatric diagnoses, including schizophrenia spectrum disorders and autism spectrum disorder (ASD), all of which may include psychotic symptoms and difficulties in interpersonal relationships. This overlap, combined with the lack of awareness of schizotypal disorder, can pose a diagnostic challenge. Better recognition of SDC could result in earlier and more effective treatment. In this article, we provide tips for differentiating SDC from childhood-onset schizophrenia and from ASD.
Differentiating SDC from schizophrenia
SDC may be mistaken for childhood-onset schizophrenia due to its perceptual disturbances (which may be interpreted as visual or auditory hallucinations), bizarre fantasies (which may be mistaken for overt delusions), paranoia, and odd behavior. Two ways to distinguish SDC from childhood schizophrenia are by clinical course and by severity of negative psychotic symptoms.
SDC tends to have an overall stable clinical course,4 with patients experiencing periods of time when they exhibit a more normal mental status complemented by fluctuations in symptom severity, which are exacerbated by stressors and followed by a return to baseline.3 SDC psychotic symptoms are predominantly positive, and patients typically do not demonstrate negative features beyond social difficulties. Childhood-onset schizophrenia is typically progressive and disabling, with worsening severity over time, and is much more likely to incorporate prominent negative symptoms.3
Differentiating SDC from ASD
SDC also demonstrates considerable diagnostic overlap with ASD, especially with regards to inappropriate affect; odd thinking, behavior, and speech; and social difficulties. Further complicating the diagnosis, ASD and SDC are comorbid in approximately 40% of ASD cases.3,5 The Melbourne Assessment of Schizotypy in Kids demonstrates validity in diagnosing schizotypal disorder in patients with comorbid ASD.5,6 For clinicians without easy access to advanced testing, 2 ways to distinguish SDC from ASD are the content of the odd behavior and thoughts, and the patient’s reaction to social deficits.
In SDC, odd behavior and thoughts most often revolve around daydreaming and a focus on “elaborate inner fantasies.”3,6 Unlike in ASD, in patients with SDC, behaviors don’t typically involve stereotyped mannerisms, the patient is unlikely to have rigid interests (apart from their fantasies), and there is not a particular focus on detail in the external world.3,6 Notably, imaginary companions are common in SDC; children with ASD are less likely to have an imaginary companion compared with children with SDC or those with no psychiatric diagnosis.6 Patients with SDC have social difficulties (often due to social anxiety stemming from their paranoia) but usually seek out interaction and are bothered by alienation, while patients with ASD may have less interest in social engagement.6
1. Diagnostic and Statistical Manual of Mental Disorders: DSM-5. 5th ed. American Psychiatric Association; 2013.
2. Pulay AJ, Stinson FS, Dawson DA, et al. Prevalence, correlates, disability, and comorbidity of DSM-IV schizotypal personality disorder: results from the wave 2 national epidemiologic survey on alcohol and related conditions. Prim Care Companion J Clin Psychiatry. 2009;11(2):53-67. doi:10.4088/pcc.08m00679
3. Tonge BJ, Testa R, Díaz-Arteche C, et al. Schizotypal disorder in children—a neglected diagnosis. Schizophrenia Bulletin Open. 2020;1(1):sgaa048. doi:10.1093/schizbullopen/sgaa048
4. Asarnow JR. Childhood-onset schizotypal disorder: a follow-up study and comparison with childhood-onset schizophrenia. J Child Adolesc Psychopharmacol. 2005;15(3):395-402.
5. Jones HP, Testa RR, Ross N, et al. The Melbourne Assessment of Schizotypy in Kids: a useful measure of childhood schizotypal personality disorder. Biomed Res Int. 2015;2015:635732. doi:10.1155/2015/635732
6. Poletti M, Raballo A. Childhood schizotypal features vs. high-functioning autism spectrum disorder: developmental overlaps and phenomenological differences. Schizophr Res. 2020;223:53-58. doi:10.1016/j.schres.2020.09.027
Schizotypal disorder is a complex condition that is characterized by cognitive-perceptual impairments, oddness, disorganization, and interpersonal difficulties. It often is unrecognized or underdiagnosed. In DSM-5, schizotypal disorder is categorized a personality disorder, but it is also considered part of the schizophrenia spectrum disorders.1 The diagnostic criteria for schizotypal disorder are outlined in the Table.1,2
Although schizotypal disorder has a lifetime prevalence of approximately 4% in the general population of the United States,2 it can present during childhood or adolescence and may be overlooked in the differential diagnosis for psychotic symptoms in pediatric patients.3 Schizotypal disorder of childhood (SDC) can present with significant overlap with several pediatric diagnoses, including schizophrenia spectrum disorders and autism spectrum disorder (ASD), all of which may include psychotic symptoms and difficulties in interpersonal relationships. This overlap, combined with the lack of awareness of schizotypal disorder, can pose a diagnostic challenge. Better recognition of SDC could result in earlier and more effective treatment. In this article, we provide tips for differentiating SDC from childhood-onset schizophrenia and from ASD.
Differentiating SDC from schizophrenia
SDC may be mistaken for childhood-onset schizophrenia due to its perceptual disturbances (which may be interpreted as visual or auditory hallucinations), bizarre fantasies (which may be mistaken for overt delusions), paranoia, and odd behavior. Two ways to distinguish SDC from childhood schizophrenia are by clinical course and by severity of negative psychotic symptoms.
SDC tends to have an overall stable clinical course,4 with patients experiencing periods of time when they exhibit a more normal mental status complemented by fluctuations in symptom severity, which are exacerbated by stressors and followed by a return to baseline.3 SDC psychotic symptoms are predominantly positive, and patients typically do not demonstrate negative features beyond social difficulties. Childhood-onset schizophrenia is typically progressive and disabling, with worsening severity over time, and is much more likely to incorporate prominent negative symptoms.3
Differentiating SDC from ASD
SDC also demonstrates considerable diagnostic overlap with ASD, especially with regards to inappropriate affect; odd thinking, behavior, and speech; and social difficulties. Further complicating the diagnosis, ASD and SDC are comorbid in approximately 40% of ASD cases.3,5 The Melbourne Assessment of Schizotypy in Kids demonstrates validity in diagnosing schizotypal disorder in patients with comorbid ASD.5,6 For clinicians without easy access to advanced testing, 2 ways to distinguish SDC from ASD are the content of the odd behavior and thoughts, and the patient’s reaction to social deficits.
In SDC, odd behavior and thoughts most often revolve around daydreaming and a focus on “elaborate inner fantasies.”3,6 Unlike in ASD, in patients with SDC, behaviors don’t typically involve stereotyped mannerisms, the patient is unlikely to have rigid interests (apart from their fantasies), and there is not a particular focus on detail in the external world.3,6 Notably, imaginary companions are common in SDC; children with ASD are less likely to have an imaginary companion compared with children with SDC or those with no psychiatric diagnosis.6 Patients with SDC have social difficulties (often due to social anxiety stemming from their paranoia) but usually seek out interaction and are bothered by alienation, while patients with ASD may have less interest in social engagement.6
Schizotypal disorder is a complex condition that is characterized by cognitive-perceptual impairments, oddness, disorganization, and interpersonal difficulties. It often is unrecognized or underdiagnosed. In DSM-5, schizotypal disorder is categorized a personality disorder, but it is also considered part of the schizophrenia spectrum disorders.1 The diagnostic criteria for schizotypal disorder are outlined in the Table.1,2
Although schizotypal disorder has a lifetime prevalence of approximately 4% in the general population of the United States,2 it can present during childhood or adolescence and may be overlooked in the differential diagnosis for psychotic symptoms in pediatric patients.3 Schizotypal disorder of childhood (SDC) can present with significant overlap with several pediatric diagnoses, including schizophrenia spectrum disorders and autism spectrum disorder (ASD), all of which may include psychotic symptoms and difficulties in interpersonal relationships. This overlap, combined with the lack of awareness of schizotypal disorder, can pose a diagnostic challenge. Better recognition of SDC could result in earlier and more effective treatment. In this article, we provide tips for differentiating SDC from childhood-onset schizophrenia and from ASD.
Differentiating SDC from schizophrenia
SDC may be mistaken for childhood-onset schizophrenia due to its perceptual disturbances (which may be interpreted as visual or auditory hallucinations), bizarre fantasies (which may be mistaken for overt delusions), paranoia, and odd behavior. Two ways to distinguish SDC from childhood schizophrenia are by clinical course and by severity of negative psychotic symptoms.
SDC tends to have an overall stable clinical course,4 with patients experiencing periods of time when they exhibit a more normal mental status complemented by fluctuations in symptom severity, which are exacerbated by stressors and followed by a return to baseline.3 SDC psychotic symptoms are predominantly positive, and patients typically do not demonstrate negative features beyond social difficulties. Childhood-onset schizophrenia is typically progressive and disabling, with worsening severity over time, and is much more likely to incorporate prominent negative symptoms.3
Differentiating SDC from ASD
SDC also demonstrates considerable diagnostic overlap with ASD, especially with regards to inappropriate affect; odd thinking, behavior, and speech; and social difficulties. Further complicating the diagnosis, ASD and SDC are comorbid in approximately 40% of ASD cases.3,5 The Melbourne Assessment of Schizotypy in Kids demonstrates validity in diagnosing schizotypal disorder in patients with comorbid ASD.5,6 For clinicians without easy access to advanced testing, 2 ways to distinguish SDC from ASD are the content of the odd behavior and thoughts, and the patient’s reaction to social deficits.
In SDC, odd behavior and thoughts most often revolve around daydreaming and a focus on “elaborate inner fantasies.”3,6 Unlike in ASD, in patients with SDC, behaviors don’t typically involve stereotyped mannerisms, the patient is unlikely to have rigid interests (apart from their fantasies), and there is not a particular focus on detail in the external world.3,6 Notably, imaginary companions are common in SDC; children with ASD are less likely to have an imaginary companion compared with children with SDC or those with no psychiatric diagnosis.6 Patients with SDC have social difficulties (often due to social anxiety stemming from their paranoia) but usually seek out interaction and are bothered by alienation, while patients with ASD may have less interest in social engagement.6
1. Diagnostic and Statistical Manual of Mental Disorders: DSM-5. 5th ed. American Psychiatric Association; 2013.
2. Pulay AJ, Stinson FS, Dawson DA, et al. Prevalence, correlates, disability, and comorbidity of DSM-IV schizotypal personality disorder: results from the wave 2 national epidemiologic survey on alcohol and related conditions. Prim Care Companion J Clin Psychiatry. 2009;11(2):53-67. doi:10.4088/pcc.08m00679
3. Tonge BJ, Testa R, Díaz-Arteche C, et al. Schizotypal disorder in children—a neglected diagnosis. Schizophrenia Bulletin Open. 2020;1(1):sgaa048. doi:10.1093/schizbullopen/sgaa048
4. Asarnow JR. Childhood-onset schizotypal disorder: a follow-up study and comparison with childhood-onset schizophrenia. J Child Adolesc Psychopharmacol. 2005;15(3):395-402.
5. Jones HP, Testa RR, Ross N, et al. The Melbourne Assessment of Schizotypy in Kids: a useful measure of childhood schizotypal personality disorder. Biomed Res Int. 2015;2015:635732. doi:10.1155/2015/635732
6. Poletti M, Raballo A. Childhood schizotypal features vs. high-functioning autism spectrum disorder: developmental overlaps and phenomenological differences. Schizophr Res. 2020;223:53-58. doi:10.1016/j.schres.2020.09.027
1. Diagnostic and Statistical Manual of Mental Disorders: DSM-5. 5th ed. American Psychiatric Association; 2013.
2. Pulay AJ, Stinson FS, Dawson DA, et al. Prevalence, correlates, disability, and comorbidity of DSM-IV schizotypal personality disorder: results from the wave 2 national epidemiologic survey on alcohol and related conditions. Prim Care Companion J Clin Psychiatry. 2009;11(2):53-67. doi:10.4088/pcc.08m00679
3. Tonge BJ, Testa R, Díaz-Arteche C, et al. Schizotypal disorder in children—a neglected diagnosis. Schizophrenia Bulletin Open. 2020;1(1):sgaa048. doi:10.1093/schizbullopen/sgaa048
4. Asarnow JR. Childhood-onset schizotypal disorder: a follow-up study and comparison with childhood-onset schizophrenia. J Child Adolesc Psychopharmacol. 2005;15(3):395-402.
5. Jones HP, Testa RR, Ross N, et al. The Melbourne Assessment of Schizotypy in Kids: a useful measure of childhood schizotypal personality disorder. Biomed Res Int. 2015;2015:635732. doi:10.1155/2015/635732
6. Poletti M, Raballo A. Childhood schizotypal features vs. high-functioning autism spectrum disorder: developmental overlaps and phenomenological differences. Schizophr Res. 2020;223:53-58. doi:10.1016/j.schres.2020.09.027
How to say ‘no’ to inappropriate patient requests
Although we may want to say “yes” when our patients ask us for certain medications, work excuses, etc, often it is more appropriate to say “no” because the conditions do not support those requests. Saying no to a patient usually is not a comfortable experience, but we should not say yes to avoid hurting their feelings, damaging our rapport with them, or having them post potential negative reviews about us. For many of us, saying no is a skill that does not come naturally. For some, bluntly telling a patient no may work, but this approach is more likely to be ineffective. At the same time, saying no in an equivocal manner may weaken our patients’ confidence in us and could be displeasing for both our patients and us.1,2
We should say no in an “effective, professional manner that fosters good patient care and preserves the therapeutic relationship, while supporting physician well-being.”1 In this article, I provide practical tips for saying no to inappropriate patient requests in an emphatic manner so that we can feel more empowered and less uncomfortable.
Acknowledge and analyze your discomfort.
Before saying no, recognize that you are feeling uncomfortable with your patient’s inappropriate request. This uncomfortable feeling is a probable cue that there is likely no appropriate context for their request, ie, saying yes would be poor medical care, illegal, against policy, etc.1,3 In most cases, you should be able to identify the reason(s) your patient’s request feels inappropriate and uncomfortable.
Gather information and provide an explanation.
Ask your patient for more information about their request so you can determine if there are any underlying factors and if any additional information is needed.3 Once you decide to say no, explain why. Your explanation should be brief, because lengthy explanations might create room for debate (which could be exhausting and/or time-consuming), lead to giving in to their inappropriate request, and/or lead them to become more frustrated and misunderstood.1
Be empathetic, and re-establish rapport.
After declining a patient’s request, you may have to use empathy to re-establish rapport if it has been damaged. After being told no, your patient may feel frustrated or powerless. Acknowledge their feelings with statements such as “I know this is not want you wanted to hear” or “I can see you are irritated.”Accept your patient’s negative emotions, rather than minimizing them or trying to fix them.1,3
1. Kane M, Chambliss ML. Getting to no: how to respond to inappropriate patient requests. Fam Prac Manag. 2018;25(1):25-30.
2. Paterniti DA, Facher TL, Cipri CS, et al. Getting to “no”: strategies primary care physicians use to deny patient requests. Arch Intern Med. 2010;170(4):381-388.
3. Huben-Kearney A. Just say no to certain patient requests—and here’s how. Psychiatric News. 2021;56(2):13.
Although we may want to say “yes” when our patients ask us for certain medications, work excuses, etc, often it is more appropriate to say “no” because the conditions do not support those requests. Saying no to a patient usually is not a comfortable experience, but we should not say yes to avoid hurting their feelings, damaging our rapport with them, or having them post potential negative reviews about us. For many of us, saying no is a skill that does not come naturally. For some, bluntly telling a patient no may work, but this approach is more likely to be ineffective. At the same time, saying no in an equivocal manner may weaken our patients’ confidence in us and could be displeasing for both our patients and us.1,2
We should say no in an “effective, professional manner that fosters good patient care and preserves the therapeutic relationship, while supporting physician well-being.”1 In this article, I provide practical tips for saying no to inappropriate patient requests in an emphatic manner so that we can feel more empowered and less uncomfortable.
Acknowledge and analyze your discomfort.
Before saying no, recognize that you are feeling uncomfortable with your patient’s inappropriate request. This uncomfortable feeling is a probable cue that there is likely no appropriate context for their request, ie, saying yes would be poor medical care, illegal, against policy, etc.1,3 In most cases, you should be able to identify the reason(s) your patient’s request feels inappropriate and uncomfortable.
Gather information and provide an explanation.
Ask your patient for more information about their request so you can determine if there are any underlying factors and if any additional information is needed.3 Once you decide to say no, explain why. Your explanation should be brief, because lengthy explanations might create room for debate (which could be exhausting and/or time-consuming), lead to giving in to their inappropriate request, and/or lead them to become more frustrated and misunderstood.1
Be empathetic, and re-establish rapport.
After declining a patient’s request, you may have to use empathy to re-establish rapport if it has been damaged. After being told no, your patient may feel frustrated or powerless. Acknowledge their feelings with statements such as “I know this is not want you wanted to hear” or “I can see you are irritated.”Accept your patient’s negative emotions, rather than minimizing them or trying to fix them.1,3
Although we may want to say “yes” when our patients ask us for certain medications, work excuses, etc, often it is more appropriate to say “no” because the conditions do not support those requests. Saying no to a patient usually is not a comfortable experience, but we should not say yes to avoid hurting their feelings, damaging our rapport with them, or having them post potential negative reviews about us. For many of us, saying no is a skill that does not come naturally. For some, bluntly telling a patient no may work, but this approach is more likely to be ineffective. At the same time, saying no in an equivocal manner may weaken our patients’ confidence in us and could be displeasing for both our patients and us.1,2
We should say no in an “effective, professional manner that fosters good patient care and preserves the therapeutic relationship, while supporting physician well-being.”1 In this article, I provide practical tips for saying no to inappropriate patient requests in an emphatic manner so that we can feel more empowered and less uncomfortable.
Acknowledge and analyze your discomfort.
Before saying no, recognize that you are feeling uncomfortable with your patient’s inappropriate request. This uncomfortable feeling is a probable cue that there is likely no appropriate context for their request, ie, saying yes would be poor medical care, illegal, against policy, etc.1,3 In most cases, you should be able to identify the reason(s) your patient’s request feels inappropriate and uncomfortable.
Gather information and provide an explanation.
Ask your patient for more information about their request so you can determine if there are any underlying factors and if any additional information is needed.3 Once you decide to say no, explain why. Your explanation should be brief, because lengthy explanations might create room for debate (which could be exhausting and/or time-consuming), lead to giving in to their inappropriate request, and/or lead them to become more frustrated and misunderstood.1
Be empathetic, and re-establish rapport.
After declining a patient’s request, you may have to use empathy to re-establish rapport if it has been damaged. After being told no, your patient may feel frustrated or powerless. Acknowledge their feelings with statements such as “I know this is not want you wanted to hear” or “I can see you are irritated.”Accept your patient’s negative emotions, rather than minimizing them or trying to fix them.1,3
1. Kane M, Chambliss ML. Getting to no: how to respond to inappropriate patient requests. Fam Prac Manag. 2018;25(1):25-30.
2. Paterniti DA, Facher TL, Cipri CS, et al. Getting to “no”: strategies primary care physicians use to deny patient requests. Arch Intern Med. 2010;170(4):381-388.
3. Huben-Kearney A. Just say no to certain patient requests—and here’s how. Psychiatric News. 2021;56(2):13.
1. Kane M, Chambliss ML. Getting to no: how to respond to inappropriate patient requests. Fam Prac Manag. 2018;25(1):25-30.
2. Paterniti DA, Facher TL, Cipri CS, et al. Getting to “no”: strategies primary care physicians use to deny patient requests. Arch Intern Med. 2010;170(4):381-388.
3. Huben-Kearney A. Just say no to certain patient requests—and here’s how. Psychiatric News. 2021;56(2):13.
Closing your practice: What to consider
Closing your practice can be a stressful experience, and it requires careful planning. The process requires numerous steps, such as informing your staff, notifying your patients, closing accounts with your vendors and suppliers, storing medical records, and following applicable federal and state laws for dissolving your practice.1,2 Many of these steps may require consulting with an attorney, an accountant, and your malpractice insurance carrier.1,2 Although the recommendations I provide in this article are not exhaustive, when faced with closing your practice, be sure to consider the following factors.
Notify staff and patients.
Select a date to close your practice that will allow you to stop taking new patients, provides adequate leeway for your staff to find new employment and for you to hire temporary staff if needed, ensures you meet your obligations to your staff, such as payroll, and gives you time to set up appropriate continuity of care for your patients. In addition to verbally notifying your patients of your practice’s closing, inform them in writing (whether hand-delivered or via certified mail with return receipt) of the date of the practice’s closure, reason for the closure, cancellation of scheduled appointments after the closure date, referral options, and how they can obtain a copy of their medical records.1,2 Make sure your patients have an adequate supply of their medications before the closure.
Notify other parties.
Inform all suppliers, vendors, contracted service providers, insurance broker(s) for your practice, and payers (including Medicare and Medicaid, if applicable) of your intent to close your practice.1,2 Provide payers with a forwarding address to send payments that resolve after your practice closes, and request final invoices from vendors and suppliers so you can close your accounts with them. If you don’t own the building in which your practice is located, notify the building management in accordance with the provisions of your lease.1,2 Give cancellation notices to utilities and ancillary services (eg, labs, imaging facilities) to which you refer your patients, and notify facilities where you are credentialed and have admitting privileges.1,2 Inform your state medical licensing board, your state’s controlled substance division, and the Drug Enforcement Administration, because these agencies have requirements regarding changing the status of your medical license (if you decide to retire), continuing or surrendering your state and federal controlled substance registration, and disposal of prescription medications and prescription pads.1,2 Contact your local post office and delivery services with your change of address.
Address other considerations.
Set up a medical record retention and destruction plan in accordance with state and federal regulations, arrange for the safe storage for both paper and electronic medical records, and make sure storage facilities have experience handling confidential, Health Insurance Portability and Accountability Act (HIPAA)-sensitive patient information.1,2 In addition, establish a process for permanently deleting all HIPAA-sensitive patient information from any equipment that you don’t intend to keep.1,2
1. Funicelli AM. Risk management checklist when closing your practice. Psychiatric News. 2020;55(23):11.
2. American Academy of Family Physicians. Closing your practice checklist. Accessed January 21, 2022. https://www.aafp.org/dam/AAFP/documents/practice_management/admin_staffing/ClosingPracticeChecklist.pdf
Closing your practice can be a stressful experience, and it requires careful planning. The process requires numerous steps, such as informing your staff, notifying your patients, closing accounts with your vendors and suppliers, storing medical records, and following applicable federal and state laws for dissolving your practice.1,2 Many of these steps may require consulting with an attorney, an accountant, and your malpractice insurance carrier.1,2 Although the recommendations I provide in this article are not exhaustive, when faced with closing your practice, be sure to consider the following factors.
Notify staff and patients.
Select a date to close your practice that will allow you to stop taking new patients, provides adequate leeway for your staff to find new employment and for you to hire temporary staff if needed, ensures you meet your obligations to your staff, such as payroll, and gives you time to set up appropriate continuity of care for your patients. In addition to verbally notifying your patients of your practice’s closing, inform them in writing (whether hand-delivered or via certified mail with return receipt) of the date of the practice’s closure, reason for the closure, cancellation of scheduled appointments after the closure date, referral options, and how they can obtain a copy of their medical records.1,2 Make sure your patients have an adequate supply of their medications before the closure.
Notify other parties.
Inform all suppliers, vendors, contracted service providers, insurance broker(s) for your practice, and payers (including Medicare and Medicaid, if applicable) of your intent to close your practice.1,2 Provide payers with a forwarding address to send payments that resolve after your practice closes, and request final invoices from vendors and suppliers so you can close your accounts with them. If you don’t own the building in which your practice is located, notify the building management in accordance with the provisions of your lease.1,2 Give cancellation notices to utilities and ancillary services (eg, labs, imaging facilities) to which you refer your patients, and notify facilities where you are credentialed and have admitting privileges.1,2 Inform your state medical licensing board, your state’s controlled substance division, and the Drug Enforcement Administration, because these agencies have requirements regarding changing the status of your medical license (if you decide to retire), continuing or surrendering your state and federal controlled substance registration, and disposal of prescription medications and prescription pads.1,2 Contact your local post office and delivery services with your change of address.
Address other considerations.
Set up a medical record retention and destruction plan in accordance with state and federal regulations, arrange for the safe storage for both paper and electronic medical records, and make sure storage facilities have experience handling confidential, Health Insurance Portability and Accountability Act (HIPAA)-sensitive patient information.1,2 In addition, establish a process for permanently deleting all HIPAA-sensitive patient information from any equipment that you don’t intend to keep.1,2
Closing your practice can be a stressful experience, and it requires careful planning. The process requires numerous steps, such as informing your staff, notifying your patients, closing accounts with your vendors and suppliers, storing medical records, and following applicable federal and state laws for dissolving your practice.1,2 Many of these steps may require consulting with an attorney, an accountant, and your malpractice insurance carrier.1,2 Although the recommendations I provide in this article are not exhaustive, when faced with closing your practice, be sure to consider the following factors.
Notify staff and patients.
Select a date to close your practice that will allow you to stop taking new patients, provides adequate leeway for your staff to find new employment and for you to hire temporary staff if needed, ensures you meet your obligations to your staff, such as payroll, and gives you time to set up appropriate continuity of care for your patients. In addition to verbally notifying your patients of your practice’s closing, inform them in writing (whether hand-delivered or via certified mail with return receipt) of the date of the practice’s closure, reason for the closure, cancellation of scheduled appointments after the closure date, referral options, and how they can obtain a copy of their medical records.1,2 Make sure your patients have an adequate supply of their medications before the closure.
Notify other parties.
Inform all suppliers, vendors, contracted service providers, insurance broker(s) for your practice, and payers (including Medicare and Medicaid, if applicable) of your intent to close your practice.1,2 Provide payers with a forwarding address to send payments that resolve after your practice closes, and request final invoices from vendors and suppliers so you can close your accounts with them. If you don’t own the building in which your practice is located, notify the building management in accordance with the provisions of your lease.1,2 Give cancellation notices to utilities and ancillary services (eg, labs, imaging facilities) to which you refer your patients, and notify facilities where you are credentialed and have admitting privileges.1,2 Inform your state medical licensing board, your state’s controlled substance division, and the Drug Enforcement Administration, because these agencies have requirements regarding changing the status of your medical license (if you decide to retire), continuing or surrendering your state and federal controlled substance registration, and disposal of prescription medications and prescription pads.1,2 Contact your local post office and delivery services with your change of address.
Address other considerations.
Set up a medical record retention and destruction plan in accordance with state and federal regulations, arrange for the safe storage for both paper and electronic medical records, and make sure storage facilities have experience handling confidential, Health Insurance Portability and Accountability Act (HIPAA)-sensitive patient information.1,2 In addition, establish a process for permanently deleting all HIPAA-sensitive patient information from any equipment that you don’t intend to keep.1,2
1. Funicelli AM. Risk management checklist when closing your practice. Psychiatric News. 2020;55(23):11.
2. American Academy of Family Physicians. Closing your practice checklist. Accessed January 21, 2022. https://www.aafp.org/dam/AAFP/documents/practice_management/admin_staffing/ClosingPracticeChecklist.pdf
1. Funicelli AM. Risk management checklist when closing your practice. Psychiatric News. 2020;55(23):11.
2. American Academy of Family Physicians. Closing your practice checklist. Accessed January 21, 2022. https://www.aafp.org/dam/AAFP/documents/practice_management/admin_staffing/ClosingPracticeChecklist.pdf
Clinical Edge Journal Scan Commentary: Atopic Dermatitis March 2022
Recent insights into the epidemiology of atopic dermatitis
Atopic dermatitis (AD) has complex risk factors and effects on patients. AD patients experience itch, skin pain, sleep disturbances, and other symptoms that can profoundly impact their quality of life. Yet, little is known about the longitudinal epidemiology and burden of AD in children.
- Johansson et al1 reported on the ongoing BAMSE cohort study. BAMSE followed 4089 individuals regularly from birth regarding AD and atopic diseases with surveys and clinical examinations; 3055 individuals were assessed at year 24 of follow-up. At 24 years, the 12-month prevalence of AD was 17.8% and more common in women than men (20.5% vs. 14.8%). The point prevalence of AD on clinical examination was 8.0%. These high prevalence estimates are consistent with multiple other recent studies in the United States and globally.2-4 Prevalence measures a combination of both new-onset (incident) cases and persistence of childhood disease. Importantly, BAMSE found the proportion of adult-onset AD was 16.9%. These results are consistent with previous studies that found substantial rates of adult-onset AD.5 Additionally, men were more likely to have AD in the first year of life, but less likely than women to have AD in adolescence and young adulthood.
- Paller et al6 recently initiated PEDISTAT, an international, longitudinal 5-year registry of the disease course, comorbidities, treatment, and disease burden children age <12 years with moderate-severe AD. While the study is ongoing, the authors reported the baseline characteristics of the registry. They found that most of the enrolled children were not treated with a systemic therapy, had inadequately controlled disease and a high disease burden. These results emphasize the need for very safe and highly effective systemic therapies for moderate-severe AD in children.
I look forward to seeing the results of these ongoing study and how they will inform our understanding of the epidemiology and comorbidities of AD.
Numerous risk factors for AD have been examined. Infections have been explored as a potential risk factor for AD for more than 30 years.
- Lin et al7 conducted a population-based, nationwide case-control study including 5,454 children with AD matched with 16,362 healthy controls without AD. They found that prior to AD diagnosis, all infections including skin infection up to 2 years of age were more frequent in children who subsequently developed AD compared to healthy controls.
- Medeleanu et al8 reported findings from the Canadian Healthy Infant Longitudinal Development (CHILD) Cohort Study, which included a longitudinal birth cohort of 3,272 parents and infants recruited during pregnancy. They found that infants with moderate-severe vs. no or mild lower respiratory tract infections in the first 18 months of life had significantly higher rates of AD and type 1 allergen polysensitization at age 3 and 5 years. These associations remained significant after adjusting for sex, breastfeeding duration, and parental history of atopy or asthma.
Together, these studies suggest that prevention and expedient treatment of early life infections may lower risk for AD in childhood. Conversely, children at risk for AD who experience certain infections early in life may benefit from increased surveillance for AD and atopic disease.
References
- Johansson EK et al. Prevalence and characteristics of atopic dermatitis among young adult females and males-report from the Swedish population-based study BAMSE. J Eur Acad Dermatol Venereol. 2022 (Jan 15).
- Silverberg JI. Public health burden and epidemiology of atopic dermatitis. Dermatol Clin. 2017;35(3):283-289.
- Silverberg JI et al. Patient burden and quality of life in atopic dermatitis in US adults: A population-based cross-sectional study. Ann Allerg Asthma Immunol. 2018;121(3):340-347.
- Hua T, Silverberg JI. Atopic dermatitis in US adults: Epidemiology, association with marital status, and atopy. Ann Allerg Asthma Immunol. 2018;121(5):622-624.
- Lee HH et al. A systematic review and meta-analysis of the prevalence and phenotype of adult-onset atopic dermatitis. J Am Acad Dermatol. 2019;80(6):1526-1532.e7.
- Paller AS et al. Infections in children and adolescents treated with dupilumab in pediatric clinical trials for atopic dermatitis—A pooled analysis of trial data. Pediatr Dermatol. 2022 (Jan 26).
- Lin T-L et al. Early-life infections in association with the development of atopic dermatitis in infancy and early childhood: a nationwide nested case–control study. J Eur Acad Dermatol Venereol. 2022 (Jan 9).
- Medeleanu M et al. Moderate-to-severe lower respiratory tract infection in early life is associated with increased risk of polysensitization and atopic dermatitis: Findings from the CHILD Study. J Allergy Clin Immunol. 2022 (Jan 16).
Recent insights into the epidemiology of atopic dermatitis
Atopic dermatitis (AD) has complex risk factors and effects on patients. AD patients experience itch, skin pain, sleep disturbances, and other symptoms that can profoundly impact their quality of life. Yet, little is known about the longitudinal epidemiology and burden of AD in children.
- Johansson et al1 reported on the ongoing BAMSE cohort study. BAMSE followed 4089 individuals regularly from birth regarding AD and atopic diseases with surveys and clinical examinations; 3055 individuals were assessed at year 24 of follow-up. At 24 years, the 12-month prevalence of AD was 17.8% and more common in women than men (20.5% vs. 14.8%). The point prevalence of AD on clinical examination was 8.0%. These high prevalence estimates are consistent with multiple other recent studies in the United States and globally.2-4 Prevalence measures a combination of both new-onset (incident) cases and persistence of childhood disease. Importantly, BAMSE found the proportion of adult-onset AD was 16.9%. These results are consistent with previous studies that found substantial rates of adult-onset AD.5 Additionally, men were more likely to have AD in the first year of life, but less likely than women to have AD in adolescence and young adulthood.
- Paller et al6 recently initiated PEDISTAT, an international, longitudinal 5-year registry of the disease course, comorbidities, treatment, and disease burden children age <12 years with moderate-severe AD. While the study is ongoing, the authors reported the baseline characteristics of the registry. They found that most of the enrolled children were not treated with a systemic therapy, had inadequately controlled disease and a high disease burden. These results emphasize the need for very safe and highly effective systemic therapies for moderate-severe AD in children.
I look forward to seeing the results of these ongoing study and how they will inform our understanding of the epidemiology and comorbidities of AD.
Numerous risk factors for AD have been examined. Infections have been explored as a potential risk factor for AD for more than 30 years.
- Lin et al7 conducted a population-based, nationwide case-control study including 5,454 children with AD matched with 16,362 healthy controls without AD. They found that prior to AD diagnosis, all infections including skin infection up to 2 years of age were more frequent in children who subsequently developed AD compared to healthy controls.
- Medeleanu et al8 reported findings from the Canadian Healthy Infant Longitudinal Development (CHILD) Cohort Study, which included a longitudinal birth cohort of 3,272 parents and infants recruited during pregnancy. They found that infants with moderate-severe vs. no or mild lower respiratory tract infections in the first 18 months of life had significantly higher rates of AD and type 1 allergen polysensitization at age 3 and 5 years. These associations remained significant after adjusting for sex, breastfeeding duration, and parental history of atopy or asthma.
Together, these studies suggest that prevention and expedient treatment of early life infections may lower risk for AD in childhood. Conversely, children at risk for AD who experience certain infections early in life may benefit from increased surveillance for AD and atopic disease.
References
- Johansson EK et al. Prevalence and characteristics of atopic dermatitis among young adult females and males-report from the Swedish population-based study BAMSE. J Eur Acad Dermatol Venereol. 2022 (Jan 15).
- Silverberg JI. Public health burden and epidemiology of atopic dermatitis. Dermatol Clin. 2017;35(3):283-289.
- Silverberg JI et al. Patient burden and quality of life in atopic dermatitis in US adults: A population-based cross-sectional study. Ann Allerg Asthma Immunol. 2018;121(3):340-347.
- Hua T, Silverberg JI. Atopic dermatitis in US adults: Epidemiology, association with marital status, and atopy. Ann Allerg Asthma Immunol. 2018;121(5):622-624.
- Lee HH et al. A systematic review and meta-analysis of the prevalence and phenotype of adult-onset atopic dermatitis. J Am Acad Dermatol. 2019;80(6):1526-1532.e7.
- Paller AS et al. Infections in children and adolescents treated with dupilumab in pediatric clinical trials for atopic dermatitis—A pooled analysis of trial data. Pediatr Dermatol. 2022 (Jan 26).
- Lin T-L et al. Early-life infections in association with the development of atopic dermatitis in infancy and early childhood: a nationwide nested case–control study. J Eur Acad Dermatol Venereol. 2022 (Jan 9).
- Medeleanu M et al. Moderate-to-severe lower respiratory tract infection in early life is associated with increased risk of polysensitization and atopic dermatitis: Findings from the CHILD Study. J Allergy Clin Immunol. 2022 (Jan 16).
Recent insights into the epidemiology of atopic dermatitis
Atopic dermatitis (AD) has complex risk factors and effects on patients. AD patients experience itch, skin pain, sleep disturbances, and other symptoms that can profoundly impact their quality of life. Yet, little is known about the longitudinal epidemiology and burden of AD in children.
- Johansson et al1 reported on the ongoing BAMSE cohort study. BAMSE followed 4089 individuals regularly from birth regarding AD and atopic diseases with surveys and clinical examinations; 3055 individuals were assessed at year 24 of follow-up. At 24 years, the 12-month prevalence of AD was 17.8% and more common in women than men (20.5% vs. 14.8%). The point prevalence of AD on clinical examination was 8.0%. These high prevalence estimates are consistent with multiple other recent studies in the United States and globally.2-4 Prevalence measures a combination of both new-onset (incident) cases and persistence of childhood disease. Importantly, BAMSE found the proportion of adult-onset AD was 16.9%. These results are consistent with previous studies that found substantial rates of adult-onset AD.5 Additionally, men were more likely to have AD in the first year of life, but less likely than women to have AD in adolescence and young adulthood.
- Paller et al6 recently initiated PEDISTAT, an international, longitudinal 5-year registry of the disease course, comorbidities, treatment, and disease burden children age <12 years with moderate-severe AD. While the study is ongoing, the authors reported the baseline characteristics of the registry. They found that most of the enrolled children were not treated with a systemic therapy, had inadequately controlled disease and a high disease burden. These results emphasize the need for very safe and highly effective systemic therapies for moderate-severe AD in children.
I look forward to seeing the results of these ongoing study and how they will inform our understanding of the epidemiology and comorbidities of AD.
Numerous risk factors for AD have been examined. Infections have been explored as a potential risk factor for AD for more than 30 years.
- Lin et al7 conducted a population-based, nationwide case-control study including 5,454 children with AD matched with 16,362 healthy controls without AD. They found that prior to AD diagnosis, all infections including skin infection up to 2 years of age were more frequent in children who subsequently developed AD compared to healthy controls.
- Medeleanu et al8 reported findings from the Canadian Healthy Infant Longitudinal Development (CHILD) Cohort Study, which included a longitudinal birth cohort of 3,272 parents and infants recruited during pregnancy. They found that infants with moderate-severe vs. no or mild lower respiratory tract infections in the first 18 months of life had significantly higher rates of AD and type 1 allergen polysensitization at age 3 and 5 years. These associations remained significant after adjusting for sex, breastfeeding duration, and parental history of atopy or asthma.
Together, these studies suggest that prevention and expedient treatment of early life infections may lower risk for AD in childhood. Conversely, children at risk for AD who experience certain infections early in life may benefit from increased surveillance for AD and atopic disease.
References
- Johansson EK et al. Prevalence and characteristics of atopic dermatitis among young adult females and males-report from the Swedish population-based study BAMSE. J Eur Acad Dermatol Venereol. 2022 (Jan 15).
- Silverberg JI. Public health burden and epidemiology of atopic dermatitis. Dermatol Clin. 2017;35(3):283-289.
- Silverberg JI et al. Patient burden and quality of life in atopic dermatitis in US adults: A population-based cross-sectional study. Ann Allerg Asthma Immunol. 2018;121(3):340-347.
- Hua T, Silverberg JI. Atopic dermatitis in US adults: Epidemiology, association with marital status, and atopy. Ann Allerg Asthma Immunol. 2018;121(5):622-624.
- Lee HH et al. A systematic review and meta-analysis of the prevalence and phenotype of adult-onset atopic dermatitis. J Am Acad Dermatol. 2019;80(6):1526-1532.e7.
- Paller AS et al. Infections in children and adolescents treated with dupilumab in pediatric clinical trials for atopic dermatitis—A pooled analysis of trial data. Pediatr Dermatol. 2022 (Jan 26).
- Lin T-L et al. Early-life infections in association with the development of atopic dermatitis in infancy and early childhood: a nationwide nested case–control study. J Eur Acad Dermatol Venereol. 2022 (Jan 9).
- Medeleanu M et al. Moderate-to-severe lower respiratory tract infection in early life is associated with increased risk of polysensitization and atopic dermatitis: Findings from the CHILD Study. J Allergy Clin Immunol. 2022 (Jan 16).
Clinical Edge Journal Scan Commentary: Migraine March 2022
The theme of the articles this month is migraine and blood vessels. Migraine is a known risk factor for vascular events, it is a known vasodilatory phenomenon, and it is commonly treated with vasoconstrictive medications. Genetic studies are further elucidating the connection between migraine and vascular risk factors. The following studies take this vascular connection to clinical relevance in different ways.
Previous studies have investigated the combination of simvastatin and vitamin D for migraine prevention. Statins have anti-inflammatory properties and migraine can partially be understood as an inflammatory vascular phenomenon. Vitamin D and simvastatin were previously shown to be effective in a randomized trial; this study1 investigated the combination of atorvastatin with nortriptyline for migraine prevention. Patients were excluded if they had a vitamin D deficiency.
This was a triple-blinded study with one control group, one placebo plus notriptyline group, and one atorvastatin plus nortiptyline group. The nortiptyline dosage was 25mg nightly, and the interventions were given for 24 weeks. The primary outcome was decrease in headache day frequency; secondary outcomes were severity and quality of life as measured by the Migraine-Specific Quality of Life Questionnaire (MSQ).
Migraine frequency was seen to be significantly improved after 24 weeks in the statin group; however severity was not significantly affected. Adverse effects were mild and overall no subjects discontinued due to the intervention. Quality of life was also seen to be better in the combination statin/nortriptyline group.
The results of this study are compelling enough to consider the addition of a tricyclic antidepressant (TCA) for a patient already on a statin or to start a statin (in the appropriate clinical setting) on a patient already on a TCA. The main limiting factor may be the hesitation to use a TCA medication in an older patient, where the anticholinergic effects may be less predictable.
Caffeine has a controversial place in the headache world. Many patients either use caffeine as a way to treat their migraine attacks, or avoid it completely as they are told it is a migraine trigger. Most headache specialists recommend the avoidance of excessive caffeine use (typically considered >150 mg daily) and tell their patients to be consistent about when they consume caffeine. The effect of caffeine on migraine likely is due to its vasoactive property, specifically that it is vasoconstrictive in nature. These vasoactive properties may also be why many studies investigating cerebrovascular reactivity have been inconclusive in the past.
The authors in this study2 recruited patients with episodic migraine and divided them based on caffeine use. All subjects underwent transcranial Doppler testing at baseline and after 3 months, caffeine users were instructed to discontinue caffeine in the interim. Doppler testing looked for differences in BHI (breath holding index) of the bilateral posterior cerebral arteries (PCA), which is a standard at their institution. Subjects were only investigated if they were headache-free and had not used a migraine abortive medication in the previous 48 hours. Preventive medications were not controlled for.
Although the investigators recommended discontinuation of caffeine for the caffeine users, only 28% of that subgroup did discontinue. They then subdivided the group of caffeine users into those whose caffeine intake increased, decreased, or stayed the same. Transcranial Doppler testing was performed in all subgroups.
The investigators found a lower BHI-PCA, or decrease in vasodilatory function, in the subgroups that remained on caffeine. Those who stopped caffeine had improvement in this metric, showing the possible reversibility that discontinuation of caffeine can have. It remains unclear precisely how caffeine is vasoactive, and the effects may be via adenosine receptors, endothelial function, neurotransmitter production, or regulation of the autonomic nervous system. The long-term vascular effects of caffeine are unknown, but they do appear to be reversible after a 3 month period.
Migraine, and especially migraine with aura, is well known as a vascular risk factor. The presence of migraine increases the odds ratio of stroke, myocardial ischemia, deep vein thrombosis and other vascular events significantly. The American College of Obstetrics and Gynecology recommends avoiding the use of any estrogen containing medication in the presence of migraine, due to estrogen itself being a pro-thrombotic hormone. The precise mechanism that leads to this increased risk is unknown.
This study investigated the connection between migraine and large artery atherosclerosis (LAA). This group observed 415 consecutive patients aged 18-54 who presented for a first time ischemic stroke (other neurovascular events, such as cerebral venous sinus thrombosis, subarachnoid hemorrhage with secondary ischemia and transient ischemic attacks, were excluded). Data regarding these patient’s risks factors was collected and analyzed including elevated body mass index (BMI), hypertension, diabetes, tobacco use, and hyperlipidemia.
All patients underwent magnetic resonance imaging (MRI), as well as either magnetic resonance angiography (MRA) or computed tomography angiography (CTA), and duplex ultrasound confirmed the images. Atherosclerosis was classified using a standardized system (ASCOD: atherosclerosis, small-vessel disease, cardiac pathology, other causes, and dissection) that grades atheroslerotic lesions on a 0-3 scale.
The results may be considered counterintuitive. The presence of migraine was negatively associated with the presence of LAA: a history of migraine did not increase the risk of atherosclerosis. This was even the case when controlling for the traditional vascular risk factors. The authors theorize that likely the association between migraine and stroke and other vascular events is not related to atherosclerosis and may be due to other causes.
A genome-wide association study recently identified a specific polymorphism that was shared by migraine and coronary artery disease. But just like this study, the people with migraine had a negative association with coronary artery disease. If people with migraine do develop stroke or other vascular phenomena they typically present younger and healthier, and this may be why this negative correlation exists.
References
- Sherafat M et al. The preventive effect of the combination of atorvastatin and nortriptyline in migraine-type headache: a randomized, triple-blind, placebo-controlled trial. Neurol Res. 2022 (Jan 17).
- Gil Y-E et al. Effect of caffeine and caffeine cessation on cerebrovascular reactivity in patients with migraine. Headache. 2022;62(2):169-75 (Feb 3).
- Gollion C et al. Migraine and large artery atherosclerosis in young adults with ischemic stroke. Headache. 2022;62(2):191-7 (Feb 5).
The theme of the articles this month is migraine and blood vessels. Migraine is a known risk factor for vascular events, it is a known vasodilatory phenomenon, and it is commonly treated with vasoconstrictive medications. Genetic studies are further elucidating the connection between migraine and vascular risk factors. The following studies take this vascular connection to clinical relevance in different ways.
Previous studies have investigated the combination of simvastatin and vitamin D for migraine prevention. Statins have anti-inflammatory properties and migraine can partially be understood as an inflammatory vascular phenomenon. Vitamin D and simvastatin were previously shown to be effective in a randomized trial; this study1 investigated the combination of atorvastatin with nortriptyline for migraine prevention. Patients were excluded if they had a vitamin D deficiency.
This was a triple-blinded study with one control group, one placebo plus notriptyline group, and one atorvastatin plus nortiptyline group. The nortiptyline dosage was 25mg nightly, and the interventions were given for 24 weeks. The primary outcome was decrease in headache day frequency; secondary outcomes were severity and quality of life as measured by the Migraine-Specific Quality of Life Questionnaire (MSQ).
Migraine frequency was seen to be significantly improved after 24 weeks in the statin group; however severity was not significantly affected. Adverse effects were mild and overall no subjects discontinued due to the intervention. Quality of life was also seen to be better in the combination statin/nortriptyline group.
The results of this study are compelling enough to consider the addition of a tricyclic antidepressant (TCA) for a patient already on a statin or to start a statin (in the appropriate clinical setting) on a patient already on a TCA. The main limiting factor may be the hesitation to use a TCA medication in an older patient, where the anticholinergic effects may be less predictable.
Caffeine has a controversial place in the headache world. Many patients either use caffeine as a way to treat their migraine attacks, or avoid it completely as they are told it is a migraine trigger. Most headache specialists recommend the avoidance of excessive caffeine use (typically considered >150 mg daily) and tell their patients to be consistent about when they consume caffeine. The effect of caffeine on migraine likely is due to its vasoactive property, specifically that it is vasoconstrictive in nature. These vasoactive properties may also be why many studies investigating cerebrovascular reactivity have been inconclusive in the past.
The authors in this study2 recruited patients with episodic migraine and divided them based on caffeine use. All subjects underwent transcranial Doppler testing at baseline and after 3 months, caffeine users were instructed to discontinue caffeine in the interim. Doppler testing looked for differences in BHI (breath holding index) of the bilateral posterior cerebral arteries (PCA), which is a standard at their institution. Subjects were only investigated if they were headache-free and had not used a migraine abortive medication in the previous 48 hours. Preventive medications were not controlled for.
Although the investigators recommended discontinuation of caffeine for the caffeine users, only 28% of that subgroup did discontinue. They then subdivided the group of caffeine users into those whose caffeine intake increased, decreased, or stayed the same. Transcranial Doppler testing was performed in all subgroups.
The investigators found a lower BHI-PCA, or decrease in vasodilatory function, in the subgroups that remained on caffeine. Those who stopped caffeine had improvement in this metric, showing the possible reversibility that discontinuation of caffeine can have. It remains unclear precisely how caffeine is vasoactive, and the effects may be via adenosine receptors, endothelial function, neurotransmitter production, or regulation of the autonomic nervous system. The long-term vascular effects of caffeine are unknown, but they do appear to be reversible after a 3 month period.
Migraine, and especially migraine with aura, is well known as a vascular risk factor. The presence of migraine increases the odds ratio of stroke, myocardial ischemia, deep vein thrombosis and other vascular events significantly. The American College of Obstetrics and Gynecology recommends avoiding the use of any estrogen containing medication in the presence of migraine, due to estrogen itself being a pro-thrombotic hormone. The precise mechanism that leads to this increased risk is unknown.
This study investigated the connection between migraine and large artery atherosclerosis (LAA). This group observed 415 consecutive patients aged 18-54 who presented for a first time ischemic stroke (other neurovascular events, such as cerebral venous sinus thrombosis, subarachnoid hemorrhage with secondary ischemia and transient ischemic attacks, were excluded). Data regarding these patient’s risks factors was collected and analyzed including elevated body mass index (BMI), hypertension, diabetes, tobacco use, and hyperlipidemia.
All patients underwent magnetic resonance imaging (MRI), as well as either magnetic resonance angiography (MRA) or computed tomography angiography (CTA), and duplex ultrasound confirmed the images. Atherosclerosis was classified using a standardized system (ASCOD: atherosclerosis, small-vessel disease, cardiac pathology, other causes, and dissection) that grades atheroslerotic lesions on a 0-3 scale.
The results may be considered counterintuitive. The presence of migraine was negatively associated with the presence of LAA: a history of migraine did not increase the risk of atherosclerosis. This was even the case when controlling for the traditional vascular risk factors. The authors theorize that likely the association between migraine and stroke and other vascular events is not related to atherosclerosis and may be due to other causes.
A genome-wide association study recently identified a specific polymorphism that was shared by migraine and coronary artery disease. But just like this study, the people with migraine had a negative association with coronary artery disease. If people with migraine do develop stroke or other vascular phenomena they typically present younger and healthier, and this may be why this negative correlation exists.
References
- Sherafat M et al. The preventive effect of the combination of atorvastatin and nortriptyline in migraine-type headache: a randomized, triple-blind, placebo-controlled trial. Neurol Res. 2022 (Jan 17).
- Gil Y-E et al. Effect of caffeine and caffeine cessation on cerebrovascular reactivity in patients with migraine. Headache. 2022;62(2):169-75 (Feb 3).
- Gollion C et al. Migraine and large artery atherosclerosis in young adults with ischemic stroke. Headache. 2022;62(2):191-7 (Feb 5).
The theme of the articles this month is migraine and blood vessels. Migraine is a known risk factor for vascular events, it is a known vasodilatory phenomenon, and it is commonly treated with vasoconstrictive medications. Genetic studies are further elucidating the connection between migraine and vascular risk factors. The following studies take this vascular connection to clinical relevance in different ways.
Previous studies have investigated the combination of simvastatin and vitamin D for migraine prevention. Statins have anti-inflammatory properties and migraine can partially be understood as an inflammatory vascular phenomenon. Vitamin D and simvastatin were previously shown to be effective in a randomized trial; this study1 investigated the combination of atorvastatin with nortriptyline for migraine prevention. Patients were excluded if they had a vitamin D deficiency.
This was a triple-blinded study with one control group, one placebo plus notriptyline group, and one atorvastatin plus nortiptyline group. The nortiptyline dosage was 25mg nightly, and the interventions were given for 24 weeks. The primary outcome was decrease in headache day frequency; secondary outcomes were severity and quality of life as measured by the Migraine-Specific Quality of Life Questionnaire (MSQ).
Migraine frequency was seen to be significantly improved after 24 weeks in the statin group; however severity was not significantly affected. Adverse effects were mild and overall no subjects discontinued due to the intervention. Quality of life was also seen to be better in the combination statin/nortriptyline group.
The results of this study are compelling enough to consider the addition of a tricyclic antidepressant (TCA) for a patient already on a statin or to start a statin (in the appropriate clinical setting) on a patient already on a TCA. The main limiting factor may be the hesitation to use a TCA medication in an older patient, where the anticholinergic effects may be less predictable.
Caffeine has a controversial place in the headache world. Many patients either use caffeine as a way to treat their migraine attacks, or avoid it completely as they are told it is a migraine trigger. Most headache specialists recommend the avoidance of excessive caffeine use (typically considered >150 mg daily) and tell their patients to be consistent about when they consume caffeine. The effect of caffeine on migraine likely is due to its vasoactive property, specifically that it is vasoconstrictive in nature. These vasoactive properties may also be why many studies investigating cerebrovascular reactivity have been inconclusive in the past.
The authors in this study2 recruited patients with episodic migraine and divided them based on caffeine use. All subjects underwent transcranial Doppler testing at baseline and after 3 months, caffeine users were instructed to discontinue caffeine in the interim. Doppler testing looked for differences in BHI (breath holding index) of the bilateral posterior cerebral arteries (PCA), which is a standard at their institution. Subjects were only investigated if they were headache-free and had not used a migraine abortive medication in the previous 48 hours. Preventive medications were not controlled for.
Although the investigators recommended discontinuation of caffeine for the caffeine users, only 28% of that subgroup did discontinue. They then subdivided the group of caffeine users into those whose caffeine intake increased, decreased, or stayed the same. Transcranial Doppler testing was performed in all subgroups.
The investigators found a lower BHI-PCA, or decrease in vasodilatory function, in the subgroups that remained on caffeine. Those who stopped caffeine had improvement in this metric, showing the possible reversibility that discontinuation of caffeine can have. It remains unclear precisely how caffeine is vasoactive, and the effects may be via adenosine receptors, endothelial function, neurotransmitter production, or regulation of the autonomic nervous system. The long-term vascular effects of caffeine are unknown, but they do appear to be reversible after a 3 month period.
Migraine, and especially migraine with aura, is well known as a vascular risk factor. The presence of migraine increases the odds ratio of stroke, myocardial ischemia, deep vein thrombosis and other vascular events significantly. The American College of Obstetrics and Gynecology recommends avoiding the use of any estrogen containing medication in the presence of migraine, due to estrogen itself being a pro-thrombotic hormone. The precise mechanism that leads to this increased risk is unknown.
This study investigated the connection between migraine and large artery atherosclerosis (LAA). This group observed 415 consecutive patients aged 18-54 who presented for a first time ischemic stroke (other neurovascular events, such as cerebral venous sinus thrombosis, subarachnoid hemorrhage with secondary ischemia and transient ischemic attacks, were excluded). Data regarding these patient’s risks factors was collected and analyzed including elevated body mass index (BMI), hypertension, diabetes, tobacco use, and hyperlipidemia.
All patients underwent magnetic resonance imaging (MRI), as well as either magnetic resonance angiography (MRA) or computed tomography angiography (CTA), and duplex ultrasound confirmed the images. Atherosclerosis was classified using a standardized system (ASCOD: atherosclerosis, small-vessel disease, cardiac pathology, other causes, and dissection) that grades atheroslerotic lesions on a 0-3 scale.
The results may be considered counterintuitive. The presence of migraine was negatively associated with the presence of LAA: a history of migraine did not increase the risk of atherosclerosis. This was even the case when controlling for the traditional vascular risk factors. The authors theorize that likely the association between migraine and stroke and other vascular events is not related to atherosclerosis and may be due to other causes.
A genome-wide association study recently identified a specific polymorphism that was shared by migraine and coronary artery disease. But just like this study, the people with migraine had a negative association with coronary artery disease. If people with migraine do develop stroke or other vascular phenomena they typically present younger and healthier, and this may be why this negative correlation exists.
References
- Sherafat M et al. The preventive effect of the combination of atorvastatin and nortriptyline in migraine-type headache: a randomized, triple-blind, placebo-controlled trial. Neurol Res. 2022 (Jan 17).
- Gil Y-E et al. Effect of caffeine and caffeine cessation on cerebrovascular reactivity in patients with migraine. Headache. 2022;62(2):169-75 (Feb 3).
- Gollion C et al. Migraine and large artery atherosclerosis in young adults with ischemic stroke. Headache. 2022;62(2):191-7 (Feb 5).
What's your diagnosis?
Mucous membrane pemphigoid with esophageal web stricture.
Additional laboratory examination showed that his serum anti-BP180 antibody level was high (11.7 U/mL; normal range, <9.0 U/mL). Biopsy specimens taken from the laryngopharyngeal erosion showed subepithelial blister formation and it was consistent with pemphigoid pathologically (Figure D). He did not have cutaneous lesions and was diagnosed with mucous membrane pemphigoid (MMP). After performing endoscopic dilation, prednisolone (20 mg/d) was administered orally. Three months after starting the prednisolone treatment, follow-up endoscopy showed improvements of the laryngopharyngeal erosions (Figure E) and esophageal blister on the web. However, esophageal narrowing remained, and thus endoscopic balloon dilation was performed (Figure F-H). Three months after the dilation, the narrowing improved (Figure I).
MMP is an autoimmune blistering disease that induces the formation of mucous membrane subepithelial bullae. Basement membrane zone components such as collagen XVII (also known as BP180) are targets of autoantibodies in MMP. Symptomatic esophageal involvement affects 5.4% of patients with MMP and dysphagia is the most frequent symptom.1 Endoscopic findings include erosion, web stricture, subepithelial hematomas, and scars.2,3 Endoscopic dilation is sometimes necessary for the treatment of severe esophageal strictures.1
References
1. Zehou O et al. Br J Dermatol. 2017 Oct;177(4):1074-85.
2. Sallout H et al. Gastrointest Endosc. 2000 Sep;52(3):429-33.
3. Gaspar R et al. Gastrointest Endosc. 2017 Aug;86(2):400-2.
Mucous membrane pemphigoid with esophageal web stricture.
Additional laboratory examination showed that his serum anti-BP180 antibody level was high (11.7 U/mL; normal range, <9.0 U/mL). Biopsy specimens taken from the laryngopharyngeal erosion showed subepithelial blister formation and it was consistent with pemphigoid pathologically (Figure D). He did not have cutaneous lesions and was diagnosed with mucous membrane pemphigoid (MMP). After performing endoscopic dilation, prednisolone (20 mg/d) was administered orally. Three months after starting the prednisolone treatment, follow-up endoscopy showed improvements of the laryngopharyngeal erosions (Figure E) and esophageal blister on the web. However, esophageal narrowing remained, and thus endoscopic balloon dilation was performed (Figure F-H). Three months after the dilation, the narrowing improved (Figure I).
MMP is an autoimmune blistering disease that induces the formation of mucous membrane subepithelial bullae. Basement membrane zone components such as collagen XVII (also known as BP180) are targets of autoantibodies in MMP. Symptomatic esophageal involvement affects 5.4% of patients with MMP and dysphagia is the most frequent symptom.1 Endoscopic findings include erosion, web stricture, subepithelial hematomas, and scars.2,3 Endoscopic dilation is sometimes necessary for the treatment of severe esophageal strictures.1
References
1. Zehou O et al. Br J Dermatol. 2017 Oct;177(4):1074-85.
2. Sallout H et al. Gastrointest Endosc. 2000 Sep;52(3):429-33.
3. Gaspar R et al. Gastrointest Endosc. 2017 Aug;86(2):400-2.
Mucous membrane pemphigoid with esophageal web stricture.
Additional laboratory examination showed that his serum anti-BP180 antibody level was high (11.7 U/mL; normal range, <9.0 U/mL). Biopsy specimens taken from the laryngopharyngeal erosion showed subepithelial blister formation and it was consistent with pemphigoid pathologically (Figure D). He did not have cutaneous lesions and was diagnosed with mucous membrane pemphigoid (MMP). After performing endoscopic dilation, prednisolone (20 mg/d) was administered orally. Three months after starting the prednisolone treatment, follow-up endoscopy showed improvements of the laryngopharyngeal erosions (Figure E) and esophageal blister on the web. However, esophageal narrowing remained, and thus endoscopic balloon dilation was performed (Figure F-H). Three months after the dilation, the narrowing improved (Figure I).
MMP is an autoimmune blistering disease that induces the formation of mucous membrane subepithelial bullae. Basement membrane zone components such as collagen XVII (also known as BP180) are targets of autoantibodies in MMP. Symptomatic esophageal involvement affects 5.4% of patients with MMP and dysphagia is the most frequent symptom.1 Endoscopic findings include erosion, web stricture, subepithelial hematomas, and scars.2,3 Endoscopic dilation is sometimes necessary for the treatment of severe esophageal strictures.1
References
1. Zehou O et al. Br J Dermatol. 2017 Oct;177(4):1074-85.
2. Sallout H et al. Gastrointest Endosc. 2000 Sep;52(3):429-33.
3. Gaspar R et al. Gastrointest Endosc. 2017 Aug;86(2):400-2.
A 70-year-old man with a history of rectal cancer was referred to our clinic for chronic dysphagia and odynophagia. He did not have fevers or an allergic history. Physical examination was unremarkable except for multiple erosions in the oral cavity. Upper gastrointestinal endoscopy revealed multiple erosions in the palate and laryngopharynx (Figure A), a web stricture in the cervical esophagus (Figure B), and multiple scars in the thoracic esophagus.
Laboratory examination showed normal results including a normal white blood cell count (8010/mcL; eosinophils 360/mcL), hemoglobin level (14.0 g/dL), mean corpuscular volume (97.8 fL), serum iron level (140 mcg/dL), and ferritin level (50.5 mg/L). His dysphagia gradually worsened and he finally could not take pills nor solid food. Two weeks after the first endoscopy, a second endoscopic examination was performed and it showed exacerbation of esophageal stricture and appearance of a bloody blister (Figure C).
What is the diagnosis?
Previously published in Gastroenterology