User login
Whole Health(y) Aging With Gerofit: The Development of a Pilot Wellness Program for Older Veterans
Whole Health(y) Aging With Gerofit: The Development of a Pilot Wellness Program for Older Veterans
About half of the > 9 million veterans served by the Veterans Health Administration (VHA) are aged ≥ 65 years.1 Veterans are at a higher risk for comorbidities, which may contribute to increased health care costs, mobility limitations and disability, poor quality of life, and mortality. 2-5 Programs and policies that promote health maintenance, independent living, and quality of life are needed among older veterans. To support veterans’ overall health and well-being, the VHA has shifted to whole health, a patient-centered care model.6
The whole health paradigm employs personalized, proactive, and patient-driven care, emphasizing complementary and integrative health practices, and prioritizing health promotion and disease prevention over disease treatment.7 The veteran is empowered to decide “what matters to [me],” reflect on life and health, and define mission, aspiration, and purpose. This approach gives veterans a more active and direct role in their care, distinguishing it from traditional care models. In turn, it helps reduce the burden on clinicians and fosters a more collaborative environment in which both the clinician and veteran work together to shape the care process.7 Veterans utilize the Circle of Health to identify skills and support needed to implement changes in self-care. The Circle of Health includes 8 self-care components: moving the body; surroundings; personal development; food and drink; recharge; family, friends, and coworkers; spirit and soul; and power of the mind.6 This process drives the creation of a personal health plan, creating opportunities for individuals to engage in well-being programs that matter to them and help them meet their goals.
Gerofit is a VHA best practice and whole health outpatient exercise program for veterans aged ≥65 years.8 Gerofit has focused primarily on exercise within the moving the body self-care component.9 A longitudinal study followed 691 Gerofit participants across 6 US Department of Veterans Affairs (VA) medical centers who on average were 73 years old, had 16 different medical conditions, and took 10 medications. Most were obese and had a mean gait speed of 1.04 m/s, suggesting functional impairment.10 Prior studies have shown that Gerofit participation is associated with a range of health benefits. Two studies reported improvements in psychological well-being and sustained gains in endurance, strength, and flexibility following early Gerofit program participation. 11,12 A 10-year analysis of 115 veterans found that long-term Gerofit participation reduced mortality risk, while another study of 452 veterans showed decreased medication use following 1 year in the program.13,14
The VHA whole health model comprises 3 components: (1) The Pathway, (2) well-being programs, and (3) whole health clinical care.6 The Pathway engages veterans in identifying personal health goals, while well-being programs offer selfcare and skill-building activities. Traditional clinical settings often focus primarily on the third component due to time and resource constraints. The Gerofit platform addresses all 3 components. Its existing infrastructure, including a supportive community and dedicated facilities, provides a setting for implementing The Pathway and well-being programs. The Gerofit structure allows for the time and continuity necessary for these components, which are often limited during standard clinical visits.
By expanding the Gerofit exercise regimen to include additional wellness activities, it can holistically support older veterans. Research supports this integrative approach. For example, a 2020 study found that incorporating a holistic health program into an existing exercise program within a church setting led to improved physical activity and overall health among women participants.15 This article describes the integration of Whole Health(y) Aging with Gerofit (WHAG), a pilot program in Baltimore, Maryland, that integrates whole health components into the established Gerofit framework to enhance the overall well-being of participating veterans (Figure 1).

WHOLE HEALTH(Y) AGING WITH GEROFIT
Gerofit enrollment has been described elsewhere in detail.16 Patients aged ≥ 65 years are eligible to participate with clinician approval if they are medically stable. Following VHA clinician referral and primary care approval, veterans completed a telephone visit to determine eligibility and discuss their exercise history, goals, and preferences. Veterans dependent in activities of daily living and those with cognitive impairment, unstable angina, active proliferative diabetic retinopathy, oxygen dependence, frank incontinence, active open wounds, active substance abuse, volatile behavioral issues, or who are experiencing homelessness are not eligible for Gerofit.
The exercise physiologist identified veteran barriers and incentives to participation and assisted with a plan to maximize SMART goals (specific, measurable, achievable, relevant, and time-bound). Veterans then completed an assessment visit, either in person or virtually, depending on the selected programming. Functional assessments conducted by trained Gerofit exercise physiologists include testing of lower and upper body strength and submaximal endurance.9,17,18 Participation in Gerofit is voluntary and not time limited.
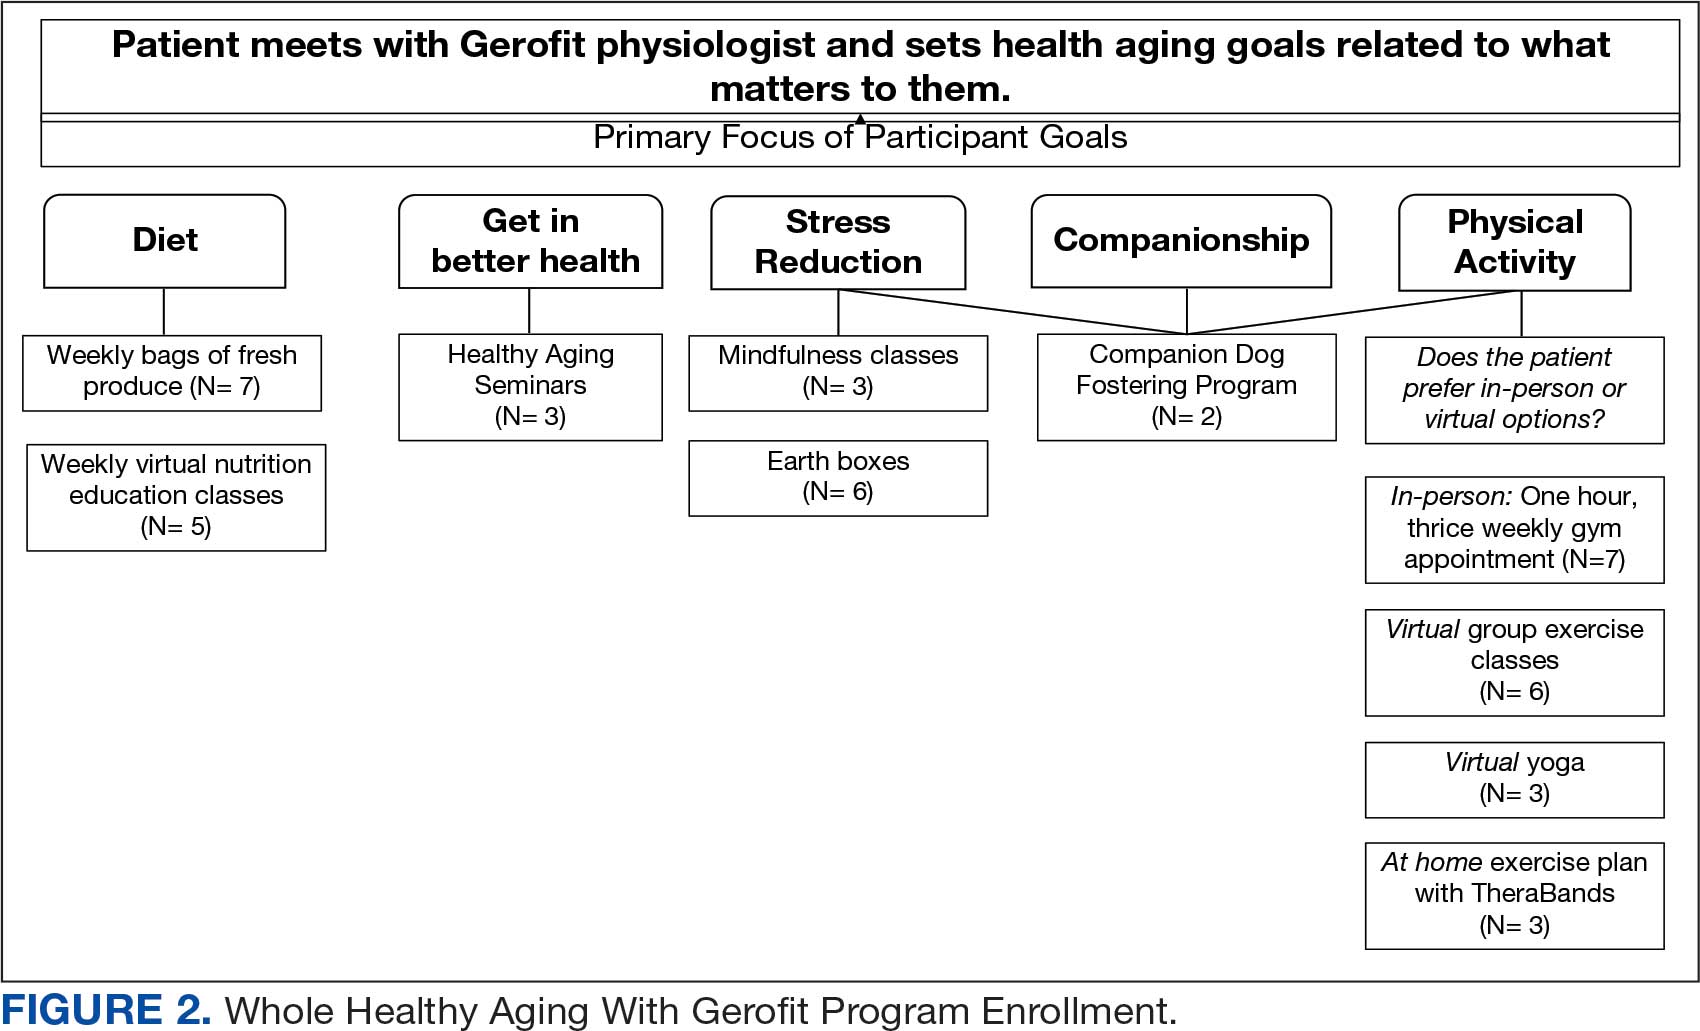
Prior to these newly expanded offerings, veterans could only enroll in a personalized, structured exercise program. Based on feedback from Gerofit participants indicating areas of interest, WHAG was developed to provide additional wellness offerings aligned with other Circle of Health components.6 This included virtual group nutrition education and cooking interventions with optional fresh produce delivery; wellness classes, the Companion Dog Fostering & Adoption program, and Gerofit in the Mind, which included mindfulness classes and relaxation seminars (Figure 1). Programs were virtual (except dog fostering and adoption) and rotated throughout the year. Not all programs are offered simultaneously.
Attendance, completion of selected questions from the individual Personal Health Inventory (PHI) Short Form, measured physical function, self-reported physical activity levels, physical and mental health status, and program satisfaction were measured for all WHAG subprograms.18 Selected questions from the PHI Short Form use a 5-point Likert scale to rate the following whole health components: physical activity; sleep, relaxation, and recovery; healthy eating habits; and positive outlook, healthy relationships, and caring for mental health. Physical function was assessed using 30-second arm curls (upper body strength), 30-second chair stands (lower body strength), and the 2-minute step test (virtual) or 6-minute walk test (in person) (submaximal cardiovascular endurance).
Self-reported physical activity was assessed by asking frequency (days per week) and duration (minutes per session) of cardiovascular and strength exercises to calculate total minutes per week. Physical and mental health status was assessed using the Patient Reported Outcomes Measurement Information System (PROMIS) Global Health Scale.19 Demographic data included sex, race and ethnicity, and age at baseline visit. Mean (SD) was calculated for continuous variables and presented unless otherwise specified, and frequencies were calculated for categorical variables. Subsequent reports will describe additional assessments and detailed outcomes unique to individual programs.
Overview
Veterans chose the programs that best suited their needs without limitations.7 Staff provided guidance on newly available programs based on an individual’s specified goals. Gerofit staff assisted veterans with development of individualized personal health plans, monitoring progress towards their goals, supporting program participation, and connecting veterans with additional whole health resources.
Gerofit Exercise Group. Exercise was designed to address the Moving the Body component of whole health. Veterans could elect to schedule 1-hour, 3-times-weekly in-person gym appointments, participate in 3-times-weekly livestreamed virtual group exercise classes through VA Video Connect, or receive a self-directed at-home exercise plan.
Gerofit Learning Opportunities for Wellness Classes. These virtual health education sessions addressed the personal development component of whole health and were designed to increase self-efficacy and empower veterans to take an active role in their health care. Topics focused broadly on issues related to healthy aging (eg, importance of sleep, goal setting, self-care, and comorbidity education). Veterans could participate in any classes of interest, which were led by health care professionals and offered twice monthly. Sessions encouraged participant questions and peer interaction.
Nutrition. Improving dietary quality is a frequently reported goal of Gerofit participants. WHAG incorporated multiple strategies to assist veterans in meeting these goals. For example, through a partnership with Therapeutic Alternative of Maryland Farm, Gerofit provided veterans free, locally grown fresh produce. This initiative addressed barriers to healthy eating by improving access to fresh produce, which has been shown to influence cooking frequency and diet quality.20-22 Participation in nutrition classes was not required. In 2021, veterans received produce weekly; however, many reported excess quantities. Beginning in 2022, veterans could select both produce items and quantities desired.
In addition, a registered dietitian led a 14-week virtual nutrition education program guided by the social cognitive theory framework and focused on self-regulation skills such as goal setting, overcoming barriers, and identifying triggers.23 Prior research highlighted low health literacy as a common barrier among older veterans, which informed several key components of the curriculum.24 These included how to read and interpret nutrition labels, define balanced meals and snacks, and understand the classification of various food groups such as fats, carbohydrates, and proteins. The online program curriculum included an instructor guide and participant materials for each individual lesson, including an educational handout on the specific week’s topic, applied activity (group or individual), and recipes related to the produce shares. Structured group discussion promoted camaraderie and recipe sharing, and additional instruction on produce preparation and storage.
Reported lack of self-efficacy and knowledge regarding produce preparation prompted a 5-week virtual cooking series, led by a medical student and supervised by a registered dietitian. Sessions combined brief nutrition education with live cooking demonstrations adapted from the VA Healthy Teaching Kitchen curriculum. Recipes emphasized low-cost, commonly found food items. The Healthy Teaching Kitchen modifications focused on Dietary Approaches to Stop Hypertension diets, diabetes, and the importance of protein for older adults. Participants were allowed time to discuss recipes and food preparation tips, and other household members were allowed to observe.
Dog Fostering and Adoption. Veterans could foster or adopt a rescue dog through a partnership with local rescue groups. This program allowed participating veterans to have a companion, which addressed the surroundings, moving the body, and spirit and soul whole health components. The Companion Dog Fostering and Adoption Program and results on physical function and daily physical activity from the first 3 months were recently published. Positive effects on physical activity, physical function, and quality of life were observed at 3 months as compared to baseline in veterans who received a companion dog.25
Gerofit in the Garden. Veterans could opt to receive an EarthBox containing soil and seedlings for 1 vegetable and 1 herb. The boxes are designed to fit on a small tabletop, regardless of home type or availability of backyard. In-person instruction for veterans on care and maintenance was provided by a farm employee with experience in gardening and farming practices.
Gerofit in the Mind. Online relaxation seminars were offered twice monthly for 4 months. Led by a certified sound health guide, sessions incorporated sound baths, crystal bowls, Tibetan bowls, tuning forks, and breath work. Virtual mindfulness classes led by a certified yoga instructor were offered weekly for 1 month. Veterans could drop in and participate based on their availability. Classes were designed to introduce veterans to the practice of mindfulness, improve mood, and lower stress and anxiety.
Pilot Program Outcomes
Sixteen male veterans participated in WHAG. Participants were 62% Black, with a mean age of 76 years. Veterans collaborated with Gerofit staff to develop personal health plans, which ultimately guided program participation (Figure 2).
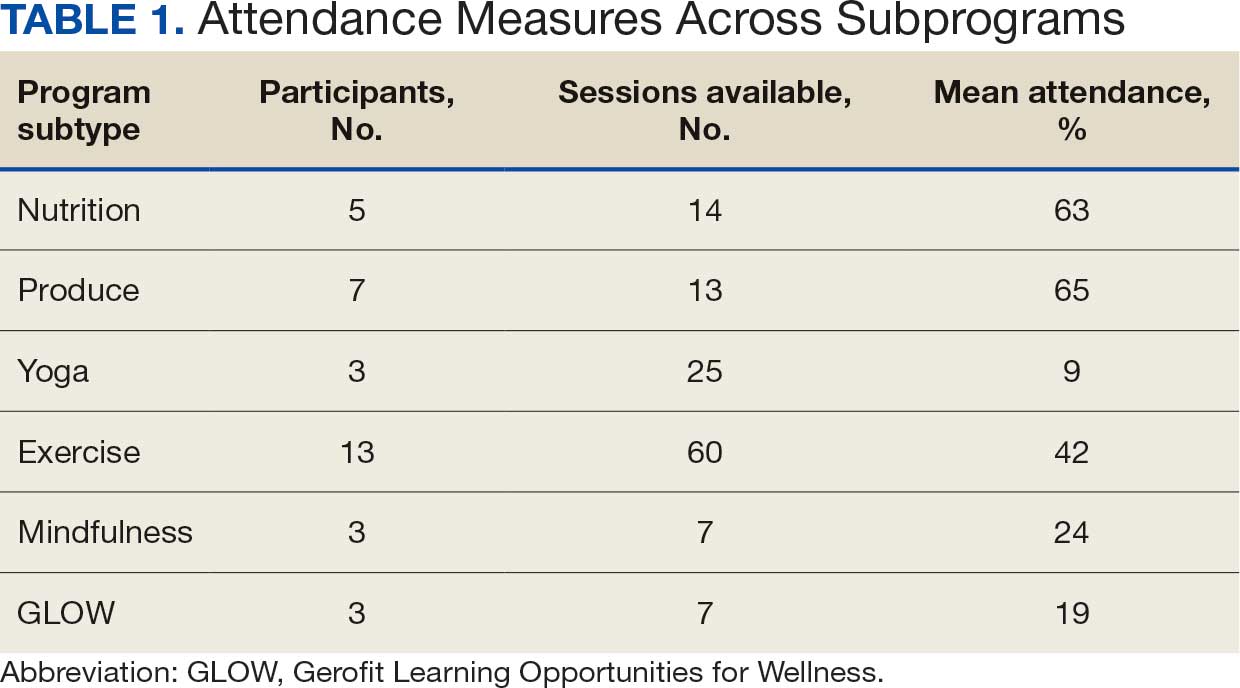
Five participants enrolled in 1 WHAG program, 11 enrolled in 2, and 8 enrolled in ≥ 3 (Table 1). Sixteen veterans completed baseline testing and 12 completed 3-month follow-up assessments (Table 2). At baseline, participants were below the reference range for physical functioning and physical activity levels. After 3 months, improvements were observed in endurance self-reported physical activity, and strength with many values in the reference range. However, physical and mental global health scores did not change.

Ten veterans completed the PHI Short Form. Veterans most frequently identified multiple areas they wished to improve, including moving the body (n = 10), recharge (n = 10), food and drink (n = 9), and power of the mind (n = 7). Baseline self-ratings on each whole health component, along with follow-up ratings at the program’s conclusion, are presented in Figure 3. Some participants aimed to maintain current levels rather than seek improvement. At the 3-month mark, most veterans perceived themselves as improving in ≥1 health component.

Discussion Programs that target holistic wellness are needed to ensure the health of a rapidly aging population. The WHAG pilot program is an example of a comprehensive, patient-centered wellness program that supports participants in defining personal wellness goals to promote healthy aging. Gerofit addresses the continuum by beginning with goal-oriented discussions with veterans to guide program participation and support desired outcomes.
Gerofit provided a strong pre-existing framework of virtual social support and physical infrastructure for the addition of WHAG. Gerofit staff were responsible for recruitment and engagement, program oversight, and outcome data collection. Additionally, VHA facilities provide physical space for in-person and virtual programming. Integrating WHAG into Gerofit allows veterans to prioritize “what matters” and engage with peers in a nontraditional way, such as the dog fostering and adoption program provides veterans with an opportunity to increase physical activity levels and improve mental and physical health through the human-animal bond.25
By providing virtual options, WHAG enhances access to health care in medically underserved areas. WHAG also improves the veteran experience with the VA, building on Gerofit’s track record of high patient satisfaction, strong adherence, high retention, and consistent consults for veterans to join.10 The program allows veterans to be at the forefront of their VHA care, choosing to participate in the various offerings based on their personal preferences.
In this population of older veterans from Baltimore, Maryland, the majority of whom reside in disadvantaged areas, we observed that the programs with the highest participation were related to diet, stress reduction, and physical activity. These 3 areas align with common barriers faced by individuals in underserved communities. Many of these communities are food deserts, lack space or resources for gardening, and have limited or unsafe access to opportunities for physical activity, making gyms or even neighborhood exercise difficult to access.26-28 Offering produce delivery and virtual nutrition classes may potentially alleviate this barrier by providing economic stability by increasing access to healthy foods paired with nutrition education to promote use of free, fresh food. Teaching older adults with impaired mobility how to overcome barriers to consuming a healthy diet may improve their dietary intake.23,29,30 Future evaluations aim to examine how these various nutrition programs impact dietary intake and how changes in dietary intake may impact functional outcomes among this group.
Group classes provide opportunities for social connection and mutual support, both of which are powerful motivators for older adults. Frequent contact with others may help reduce the risk of depression, loneliness, and social isolation.28 Routine contact with staff allows for observation of short-term changes in behavior and mood, giving staff the chance to follow up when needed. The addition of these new programs gives participants more opportunities to engage with Gerofit staff and fellow veterans beyond traditional exercise sessions. This WHAG model could expand to other Gerofit sites; however, future whole health programs should take into account the unique needs and barriers specific to each location. Doing so will help ensure offerings align with participant preferences. Programs should be thoughtfully selected and designed to directly address local challenges to promote optimal engagement and support the greatest potential for success.
CONCLUSIONS
Programs that promote and support functional independence in older adults are needed, particularly given the rapidly growing and aging population. Identifying comprehensive strategies that promote healthy aging is likely to be beneficial not only for chronic disease management and social engagement but may also promote functional independence and reduce the risk of further functional decline.
- US Department of Veterans Affairs. Veterans Health Administration– About VHA. Veterans Health Administration. 2023. Accessed December 4, 2025. https://www.va.gov/health/aboutvha.asp
- Nelson KM. The burden of obesity among a national probability sample of veterans. J Gen Intern Med. 2006;21:915- 919. doi:10.1111/j.1525-1497.2006.00526.x
- Koepsell TD, Forsberg CW, Littman AJ. Obesity, overweight, and weight control practices in U.S. veterans. Prev Med. 2009;48:267-271. doi:10.1016/j.ypmed.2009.01.008
- Das SR, Kinsinger LS, Yancy WS Jr, et al. Obesity prevalence among veterans at Veterans Affairs medical facilities. Am J Prev Med. 2005;28:291-294. doi:10.1016/j.amepre.2004.12.007
- Agha Z, Lofgren RP, VanRuiswyk JV, et al. Are patients at Veterans Affairs medical centers sicker? A comparative analysis of health status and medical resource use. Arch Intern Med. 2000;160:3252-3257. doi:10.1001/archinte.160.21.3252
- Bokhour BG, Haun JN, Hyde J, et al. Transforming the Veterans Affairs to a whole health system of care: time for action and research. Med Care. 2020;58:295-300. doi:10.1097/MLR.0000000000001316
- Marchand WR, Beckstrom J, Nazarenko E, et al. The Veterans Health Administration whole health model of care: early implementation and utilization at a large healthcare system. Mil Med. 2020;185:2150-2157. doi:10.1093/milmed/usaa198
- Shulkin D, Elnahal S, Maddock E, Shaheen M. Best Care Everywhere by VA Professionals Across the Nation. US Dept of Veterans Affairs; 2017.
- Morey MC, Lee CC, Castle S, et al. Should structured exercise be promoted as a model of care? Dissemination of the Department of Veterans Affairs Gerofit Program. J Am Geriatr Soc. 2018;66:1009-1016. doi:10.1111/jgs.15276
- Cowper PA, Morey MC, Bearon LB, et al. The impact of supervised exercise on the psychological well-being and health status of older veterans. J Appl Gerontol. 1991;10:469-485. doi:10.1177/073346489101000408
- Pepin MJ, Valencia WM, Bettger JP, et al. Impact of supervised exercise on one-year medication use in older veterans with multiple morbidities. Gerontol Geriatr Med. 2020;6:2333721420956751. doi:10.1177/073346489101000408
- Morey MC, Pieper CF, Sullivan RJ Jr, et al. Fiveyear performance trends for older exercisers: a hierarchical model of endurance, strength, and flexibility. J Am Geriatr Soc. 1996;44:1226-1231. doi:10.1111/j.1532-5415.1996.tb01374.x
- Morey MC, Pieper CF, Crowley GM, et al. Exercise adherence and 10-year mortality in chronically ill older adults. J Am Geriatr Soc. 2002;50:1929-1933. doi:10.1046/j.1532-5415.2002.50602.x
- Jorna M, Ball K, Salmon J. Effects of a holistic health program on women’s physical activity and mental and spiritual health. J Sci Med Sport. 2006;9:395-401. doi:10.1016/j.jsams.2006.06.011
- Jennings SC, Manning KM, Bettger JP, et al. Rapid transition to telehealth group exercise and functional assessments in response to COVID-19. Gerontol Geriatr Med. 2020;6:2333721420980313. doi:10.1177/2333721420980313
- Morey MC, Crowley GM, Robbins MS, et al. The Gerofit program: a VA innovation. South Med J. 1994;87:S83-87.
- Addison O, Serra MC, Katzel L, et al. Mobility improvements are found in older veterans after 6 months of Gerofit regardless of BMI classification. J Aging Phys Act. 2019;27:848-854. doi:10.1123/japa.2018-0317
- Veterans Health Administration Office of Patient Centered Care and Cultural Transformation. Making your plan— whole health. November 14, 2023. Accessed December 4, 2025. https://www.va.gov/WHOLEHEALTH/phi.asp
- Hays RD, Bjorner JB, Revicki DA, et al. Development of physical and mental health summary scores from the Patient-Reported Outcomes Measurement Information System (PROMIS) global items. Qual Life Res. 2009;18:873-880. doi:10.1007/s11136-009-9496-9
- Aktary ML, Caron-Roy S, Sajobi T, et al. Impact of a farmers’ market nutrition coupon programme on diet quality and psychosocial well-being among low-income adults: protocol for a randomised controlled trial and a longitudinal qualitative investigation. BMJ Open. 2020;10:e035143. doi:10.1136/bmjopen-2019-035143
- Afshin A, Penalvo JL, Del Gobbo L, et al. The prospective impact of food pricing on improving dietary consumption: a systematic review and meta-analysis. PLoS One. 2017;12:e0172277. doi:10.1371/journal.pone.0172277
- Singleton CR, Kessee N, Chatman C, et al. Racial/ ethnic differences in the shopping behaviors and fruit and vegetable consumption of farmers’ market incentive program users in Illinois. Ethn Dis. 2020;30:109. doi:10.18865/ed.30.1.109
- Cassatt S, Giffuni J, Ortmeyer H, et al. A pilot study to evaluate the development and implementation of a virtual nutrition education program in older veterans. Abstract presented at: American Heart Association Epidemiology and Prevention/Lifestyle and Cardiometabolic Health 2022 Scientific Sessions; March 1-4, 2022; Chicago, IL. https:// www.ahajournals.org/doi/10.1161/circ.145.suppl_1.P002
- Parker EA, Perez WJ, Phipps B, et al. Dietary quality and perceived barriers to weight loss among older overweight veterans with dysmobility. Int J Environ Res Public Health. 2022;19:9153. doi:10.3390/ijerph19159153
- Ortmeyer HK, Giffuni J, Etchberger D, et al. The role of companion dogs in the VA Maryland Health Care System Whole Health(y) GeroFit Program. Animals (Basel). 2023;13:19. doi:10.3390/ani13193047
- Milaneschi Y, Tanaka T, Ferrucci L. Nutritional determinants of mobility. Curr Opin Clin Nutr Metab Care. 2010;13:625- 629.
- Lane JM, Davis BA. Food, physical activity, and health deserts in Alabama: the spatial link between healthy eating, exercise, and socioeconomic factors. GeoJournal. 2022;87:5229-5249.
- Komatsu H, Yagasaki K, Saito Y, et al. Regular group exercise contributes to balanced health in older adults in Japan: a qualitative study. BMC Geriatr. 2017;17:190. doi:10.1186/s12877-017-0584-3
- Komatsu H, Yagasaki K, Saito Y, et al. Regular group exercise contributes to balanced health in older adults in Japan: a qualitative study. BMC Geriatr. 2017;17:190. doi:10.1186/s12877-017-0584-3
- Wolfson JA, Ramsing R, Richardson CR, et al. Barriers to healthy food access: associations with household income and cooking behavior. Prev Med Rep. 2019;13:298-305. doi:10.1016/j.pmedr.2019.01.023
About half of the > 9 million veterans served by the Veterans Health Administration (VHA) are aged ≥ 65 years.1 Veterans are at a higher risk for comorbidities, which may contribute to increased health care costs, mobility limitations and disability, poor quality of life, and mortality. 2-5 Programs and policies that promote health maintenance, independent living, and quality of life are needed among older veterans. To support veterans’ overall health and well-being, the VHA has shifted to whole health, a patient-centered care model.6
The whole health paradigm employs personalized, proactive, and patient-driven care, emphasizing complementary and integrative health practices, and prioritizing health promotion and disease prevention over disease treatment.7 The veteran is empowered to decide “what matters to [me],” reflect on life and health, and define mission, aspiration, and purpose. This approach gives veterans a more active and direct role in their care, distinguishing it from traditional care models. In turn, it helps reduce the burden on clinicians and fosters a more collaborative environment in which both the clinician and veteran work together to shape the care process.7 Veterans utilize the Circle of Health to identify skills and support needed to implement changes in self-care. The Circle of Health includes 8 self-care components: moving the body; surroundings; personal development; food and drink; recharge; family, friends, and coworkers; spirit and soul; and power of the mind.6 This process drives the creation of a personal health plan, creating opportunities for individuals to engage in well-being programs that matter to them and help them meet their goals.
Gerofit is a VHA best practice and whole health outpatient exercise program for veterans aged ≥65 years.8 Gerofit has focused primarily on exercise within the moving the body self-care component.9 A longitudinal study followed 691 Gerofit participants across 6 US Department of Veterans Affairs (VA) medical centers who on average were 73 years old, had 16 different medical conditions, and took 10 medications. Most were obese and had a mean gait speed of 1.04 m/s, suggesting functional impairment.10 Prior studies have shown that Gerofit participation is associated with a range of health benefits. Two studies reported improvements in psychological well-being and sustained gains in endurance, strength, and flexibility following early Gerofit program participation. 11,12 A 10-year analysis of 115 veterans found that long-term Gerofit participation reduced mortality risk, while another study of 452 veterans showed decreased medication use following 1 year in the program.13,14
The VHA whole health model comprises 3 components: (1) The Pathway, (2) well-being programs, and (3) whole health clinical care.6 The Pathway engages veterans in identifying personal health goals, while well-being programs offer selfcare and skill-building activities. Traditional clinical settings often focus primarily on the third component due to time and resource constraints. The Gerofit platform addresses all 3 components. Its existing infrastructure, including a supportive community and dedicated facilities, provides a setting for implementing The Pathway and well-being programs. The Gerofit structure allows for the time and continuity necessary for these components, which are often limited during standard clinical visits.
By expanding the Gerofit exercise regimen to include additional wellness activities, it can holistically support older veterans. Research supports this integrative approach. For example, a 2020 study found that incorporating a holistic health program into an existing exercise program within a church setting led to improved physical activity and overall health among women participants.15 This article describes the integration of Whole Health(y) Aging with Gerofit (WHAG), a pilot program in Baltimore, Maryland, that integrates whole health components into the established Gerofit framework to enhance the overall well-being of participating veterans (Figure 1).
WHOLE HEALTH(Y) AGING WITH GEROFIT
Gerofit enrollment has been described elsewhere in detail.16 Patients aged ≥ 65 years are eligible to participate with clinician approval if they are medically stable. Following VHA clinician referral and primary care approval, veterans completed a telephone visit to determine eligibility and discuss their exercise history, goals, and preferences. Veterans dependent in activities of daily living and those with cognitive impairment, unstable angina, active proliferative diabetic retinopathy, oxygen dependence, frank incontinence, active open wounds, active substance abuse, volatile behavioral issues, or who are experiencing homelessness are not eligible for Gerofit.
The exercise physiologist identified veteran barriers and incentives to participation and assisted with a plan to maximize SMART goals (specific, measurable, achievable, relevant, and time-bound). Veterans then completed an assessment visit, either in person or virtually, depending on the selected programming. Functional assessments conducted by trained Gerofit exercise physiologists include testing of lower and upper body strength and submaximal endurance.9,17,18 Participation in Gerofit is voluntary and not time limited.
Prior to these newly expanded offerings, veterans could only enroll in a personalized, structured exercise program. Based on feedback from Gerofit participants indicating areas of interest, WHAG was developed to provide additional wellness offerings aligned with other Circle of Health components.6 This included virtual group nutrition education and cooking interventions with optional fresh produce delivery; wellness classes, the Companion Dog Fostering & Adoption program, and Gerofit in the Mind, which included mindfulness classes and relaxation seminars (Figure 1). Programs were virtual (except dog fostering and adoption) and rotated throughout the year. Not all programs are offered simultaneously.
Attendance, completion of selected questions from the individual Personal Health Inventory (PHI) Short Form, measured physical function, self-reported physical activity levels, physical and mental health status, and program satisfaction were measured for all WHAG subprograms.18 Selected questions from the PHI Short Form use a 5-point Likert scale to rate the following whole health components: physical activity; sleep, relaxation, and recovery; healthy eating habits; and positive outlook, healthy relationships, and caring for mental health. Physical function was assessed using 30-second arm curls (upper body strength), 30-second chair stands (lower body strength), and the 2-minute step test (virtual) or 6-minute walk test (in person) (submaximal cardiovascular endurance).
Self-reported physical activity was assessed by asking frequency (days per week) and duration (minutes per session) of cardiovascular and strength exercises to calculate total minutes per week. Physical and mental health status was assessed using the Patient Reported Outcomes Measurement Information System (PROMIS) Global Health Scale.19 Demographic data included sex, race and ethnicity, and age at baseline visit. Mean (SD) was calculated for continuous variables and presented unless otherwise specified, and frequencies were calculated for categorical variables. Subsequent reports will describe additional assessments and detailed outcomes unique to individual programs.
Overview
Veterans chose the programs that best suited their needs without limitations.7 Staff provided guidance on newly available programs based on an individual’s specified goals. Gerofit staff assisted veterans with development of individualized personal health plans, monitoring progress towards their goals, supporting program participation, and connecting veterans with additional whole health resources.
Gerofit Exercise Group. Exercise was designed to address the Moving the Body component of whole health. Veterans could elect to schedule 1-hour, 3-times-weekly in-person gym appointments, participate in 3-times-weekly livestreamed virtual group exercise classes through VA Video Connect, or receive a self-directed at-home exercise plan.
Gerofit Learning Opportunities for Wellness Classes. These virtual health education sessions addressed the personal development component of whole health and were designed to increase self-efficacy and empower veterans to take an active role in their health care. Topics focused broadly on issues related to healthy aging (eg, importance of sleep, goal setting, self-care, and comorbidity education). Veterans could participate in any classes of interest, which were led by health care professionals and offered twice monthly. Sessions encouraged participant questions and peer interaction.
Nutrition. Improving dietary quality is a frequently reported goal of Gerofit participants. WHAG incorporated multiple strategies to assist veterans in meeting these goals. For example, through a partnership with Therapeutic Alternative of Maryland Farm, Gerofit provided veterans free, locally grown fresh produce. This initiative addressed barriers to healthy eating by improving access to fresh produce, which has been shown to influence cooking frequency and diet quality.20-22 Participation in nutrition classes was not required. In 2021, veterans received produce weekly; however, many reported excess quantities. Beginning in 2022, veterans could select both produce items and quantities desired.
In addition, a registered dietitian led a 14-week virtual nutrition education program guided by the social cognitive theory framework and focused on self-regulation skills such as goal setting, overcoming barriers, and identifying triggers.23 Prior research highlighted low health literacy as a common barrier among older veterans, which informed several key components of the curriculum.24 These included how to read and interpret nutrition labels, define balanced meals and snacks, and understand the classification of various food groups such as fats, carbohydrates, and proteins. The online program curriculum included an instructor guide and participant materials for each individual lesson, including an educational handout on the specific week’s topic, applied activity (group or individual), and recipes related to the produce shares. Structured group discussion promoted camaraderie and recipe sharing, and additional instruction on produce preparation and storage.
Reported lack of self-efficacy and knowledge regarding produce preparation prompted a 5-week virtual cooking series, led by a medical student and supervised by a registered dietitian. Sessions combined brief nutrition education with live cooking demonstrations adapted from the VA Healthy Teaching Kitchen curriculum. Recipes emphasized low-cost, commonly found food items. The Healthy Teaching Kitchen modifications focused on Dietary Approaches to Stop Hypertension diets, diabetes, and the importance of protein for older adults. Participants were allowed time to discuss recipes and food preparation tips, and other household members were allowed to observe.
Dog Fostering and Adoption. Veterans could foster or adopt a rescue dog through a partnership with local rescue groups. This program allowed participating veterans to have a companion, which addressed the surroundings, moving the body, and spirit and soul whole health components. The Companion Dog Fostering and Adoption Program and results on physical function and daily physical activity from the first 3 months were recently published. Positive effects on physical activity, physical function, and quality of life were observed at 3 months as compared to baseline in veterans who received a companion dog.25
Gerofit in the Garden. Veterans could opt to receive an EarthBox containing soil and seedlings for 1 vegetable and 1 herb. The boxes are designed to fit on a small tabletop, regardless of home type or availability of backyard. In-person instruction for veterans on care and maintenance was provided by a farm employee with experience in gardening and farming practices.
Gerofit in the Mind. Online relaxation seminars were offered twice monthly for 4 months. Led by a certified sound health guide, sessions incorporated sound baths, crystal bowls, Tibetan bowls, tuning forks, and breath work. Virtual mindfulness classes led by a certified yoga instructor were offered weekly for 1 month. Veterans could drop in and participate based on their availability. Classes were designed to introduce veterans to the practice of mindfulness, improve mood, and lower stress and anxiety.
Pilot Program Outcomes
Sixteen male veterans participated in WHAG. Participants were 62% Black, with a mean age of 76 years. Veterans collaborated with Gerofit staff to develop personal health plans, which ultimately guided program participation (Figure 2).
Five participants enrolled in 1 WHAG program, 11 enrolled in 2, and 8 enrolled in ≥ 3 (Table 1). Sixteen veterans completed baseline testing and 12 completed 3-month follow-up assessments (Table 2). At baseline, participants were below the reference range for physical functioning and physical activity levels. After 3 months, improvements were observed in endurance self-reported physical activity, and strength with many values in the reference range. However, physical and mental global health scores did not change.
Ten veterans completed the PHI Short Form. Veterans most frequently identified multiple areas they wished to improve, including moving the body (n = 10), recharge (n = 10), food and drink (n = 9), and power of the mind (n = 7). Baseline self-ratings on each whole health component, along with follow-up ratings at the program’s conclusion, are presented in Figure 3. Some participants aimed to maintain current levels rather than seek improvement. At the 3-month mark, most veterans perceived themselves as improving in ≥1 health component.
Discussion Programs that target holistic wellness are needed to ensure the health of a rapidly aging population. The WHAG pilot program is an example of a comprehensive, patient-centered wellness program that supports participants in defining personal wellness goals to promote healthy aging. Gerofit addresses the continuum by beginning with goal-oriented discussions with veterans to guide program participation and support desired outcomes.
Gerofit provided a strong pre-existing framework of virtual social support and physical infrastructure for the addition of WHAG. Gerofit staff were responsible for recruitment and engagement, program oversight, and outcome data collection. Additionally, VHA facilities provide physical space for in-person and virtual programming. Integrating WHAG into Gerofit allows veterans to prioritize “what matters” and engage with peers in a nontraditional way, such as the dog fostering and adoption program provides veterans with an opportunity to increase physical activity levels and improve mental and physical health through the human-animal bond.25
By providing virtual options, WHAG enhances access to health care in medically underserved areas. WHAG also improves the veteran experience with the VA, building on Gerofit’s track record of high patient satisfaction, strong adherence, high retention, and consistent consults for veterans to join.10 The program allows veterans to be at the forefront of their VHA care, choosing to participate in the various offerings based on their personal preferences.
In this population of older veterans from Baltimore, Maryland, the majority of whom reside in disadvantaged areas, we observed that the programs with the highest participation were related to diet, stress reduction, and physical activity. These 3 areas align with common barriers faced by individuals in underserved communities. Many of these communities are food deserts, lack space or resources for gardening, and have limited or unsafe access to opportunities for physical activity, making gyms or even neighborhood exercise difficult to access.26-28 Offering produce delivery and virtual nutrition classes may potentially alleviate this barrier by providing economic stability by increasing access to healthy foods paired with nutrition education to promote use of free, fresh food. Teaching older adults with impaired mobility how to overcome barriers to consuming a healthy diet may improve their dietary intake.23,29,30 Future evaluations aim to examine how these various nutrition programs impact dietary intake and how changes in dietary intake may impact functional outcomes among this group.
Group classes provide opportunities for social connection and mutual support, both of which are powerful motivators for older adults. Frequent contact with others may help reduce the risk of depression, loneliness, and social isolation.28 Routine contact with staff allows for observation of short-term changes in behavior and mood, giving staff the chance to follow up when needed. The addition of these new programs gives participants more opportunities to engage with Gerofit staff and fellow veterans beyond traditional exercise sessions. This WHAG model could expand to other Gerofit sites; however, future whole health programs should take into account the unique needs and barriers specific to each location. Doing so will help ensure offerings align with participant preferences. Programs should be thoughtfully selected and designed to directly address local challenges to promote optimal engagement and support the greatest potential for success.
CONCLUSIONS
Programs that promote and support functional independence in older adults are needed, particularly given the rapidly growing and aging population. Identifying comprehensive strategies that promote healthy aging is likely to be beneficial not only for chronic disease management and social engagement but may also promote functional independence and reduce the risk of further functional decline.
- US Department of Veterans Affairs. Veterans Health Administration– About VHA. Veterans Health Administration. 2023. Accessed December 4, 2025. https://www.va.gov/health/aboutvha.asp
- Nelson KM. The burden of obesity among a national probability sample of veterans. J Gen Intern Med. 2006;21:915- 919. doi:10.1111/j.1525-1497.2006.00526.x
- Koepsell TD, Forsberg CW, Littman AJ. Obesity, overweight, and weight control practices in U.S. veterans. Prev Med. 2009;48:267-271. doi:10.1016/j.ypmed.2009.01.008
- Das SR, Kinsinger LS, Yancy WS Jr, et al. Obesity prevalence among veterans at Veterans Affairs medical facilities. Am J Prev Med. 2005;28:291-294. doi:10.1016/j.amepre.2004.12.007
- Agha Z, Lofgren RP, VanRuiswyk JV, et al. Are patients at Veterans Affairs medical centers sicker? A comparative analysis of health status and medical resource use. Arch Intern Med. 2000;160:3252-3257. doi:10.1001/archinte.160.21.3252
- Bokhour BG, Haun JN, Hyde J, et al. Transforming the Veterans Affairs to a whole health system of care: time for action and research. Med Care. 2020;58:295-300. doi:10.1097/MLR.0000000000001316
- Marchand WR, Beckstrom J, Nazarenko E, et al. The Veterans Health Administration whole health model of care: early implementation and utilization at a large healthcare system. Mil Med. 2020;185:2150-2157. doi:10.1093/milmed/usaa198
- Shulkin D, Elnahal S, Maddock E, Shaheen M. Best Care Everywhere by VA Professionals Across the Nation. US Dept of Veterans Affairs; 2017.
- Morey MC, Lee CC, Castle S, et al. Should structured exercise be promoted as a model of care? Dissemination of the Department of Veterans Affairs Gerofit Program. J Am Geriatr Soc. 2018;66:1009-1016. doi:10.1111/jgs.15276
- Cowper PA, Morey MC, Bearon LB, et al. The impact of supervised exercise on the psychological well-being and health status of older veterans. J Appl Gerontol. 1991;10:469-485. doi:10.1177/073346489101000408
- Pepin MJ, Valencia WM, Bettger JP, et al. Impact of supervised exercise on one-year medication use in older veterans with multiple morbidities. Gerontol Geriatr Med. 2020;6:2333721420956751. doi:10.1177/073346489101000408
- Morey MC, Pieper CF, Sullivan RJ Jr, et al. Fiveyear performance trends for older exercisers: a hierarchical model of endurance, strength, and flexibility. J Am Geriatr Soc. 1996;44:1226-1231. doi:10.1111/j.1532-5415.1996.tb01374.x
- Morey MC, Pieper CF, Crowley GM, et al. Exercise adherence and 10-year mortality in chronically ill older adults. J Am Geriatr Soc. 2002;50:1929-1933. doi:10.1046/j.1532-5415.2002.50602.x
- Jorna M, Ball K, Salmon J. Effects of a holistic health program on women’s physical activity and mental and spiritual health. J Sci Med Sport. 2006;9:395-401. doi:10.1016/j.jsams.2006.06.011
- Jennings SC, Manning KM, Bettger JP, et al. Rapid transition to telehealth group exercise and functional assessments in response to COVID-19. Gerontol Geriatr Med. 2020;6:2333721420980313. doi:10.1177/2333721420980313
- Morey MC, Crowley GM, Robbins MS, et al. The Gerofit program: a VA innovation. South Med J. 1994;87:S83-87.
- Addison O, Serra MC, Katzel L, et al. Mobility improvements are found in older veterans after 6 months of Gerofit regardless of BMI classification. J Aging Phys Act. 2019;27:848-854. doi:10.1123/japa.2018-0317
- Veterans Health Administration Office of Patient Centered Care and Cultural Transformation. Making your plan— whole health. November 14, 2023. Accessed December 4, 2025. https://www.va.gov/WHOLEHEALTH/phi.asp
- Hays RD, Bjorner JB, Revicki DA, et al. Development of physical and mental health summary scores from the Patient-Reported Outcomes Measurement Information System (PROMIS) global items. Qual Life Res. 2009;18:873-880. doi:10.1007/s11136-009-9496-9
- Aktary ML, Caron-Roy S, Sajobi T, et al. Impact of a farmers’ market nutrition coupon programme on diet quality and psychosocial well-being among low-income adults: protocol for a randomised controlled trial and a longitudinal qualitative investigation. BMJ Open. 2020;10:e035143. doi:10.1136/bmjopen-2019-035143
- Afshin A, Penalvo JL, Del Gobbo L, et al. The prospective impact of food pricing on improving dietary consumption: a systematic review and meta-analysis. PLoS One. 2017;12:e0172277. doi:10.1371/journal.pone.0172277
- Singleton CR, Kessee N, Chatman C, et al. Racial/ ethnic differences in the shopping behaviors and fruit and vegetable consumption of farmers’ market incentive program users in Illinois. Ethn Dis. 2020;30:109. doi:10.18865/ed.30.1.109
- Cassatt S, Giffuni J, Ortmeyer H, et al. A pilot study to evaluate the development and implementation of a virtual nutrition education program in older veterans. Abstract presented at: American Heart Association Epidemiology and Prevention/Lifestyle and Cardiometabolic Health 2022 Scientific Sessions; March 1-4, 2022; Chicago, IL. https:// www.ahajournals.org/doi/10.1161/circ.145.suppl_1.P002
- Parker EA, Perez WJ, Phipps B, et al. Dietary quality and perceived barriers to weight loss among older overweight veterans with dysmobility. Int J Environ Res Public Health. 2022;19:9153. doi:10.3390/ijerph19159153
- Ortmeyer HK, Giffuni J, Etchberger D, et al. The role of companion dogs in the VA Maryland Health Care System Whole Health(y) GeroFit Program. Animals (Basel). 2023;13:19. doi:10.3390/ani13193047
- Milaneschi Y, Tanaka T, Ferrucci L. Nutritional determinants of mobility. Curr Opin Clin Nutr Metab Care. 2010;13:625- 629.
- Lane JM, Davis BA. Food, physical activity, and health deserts in Alabama: the spatial link between healthy eating, exercise, and socioeconomic factors. GeoJournal. 2022;87:5229-5249.
- Komatsu H, Yagasaki K, Saito Y, et al. Regular group exercise contributes to balanced health in older adults in Japan: a qualitative study. BMC Geriatr. 2017;17:190. doi:10.1186/s12877-017-0584-3
- Komatsu H, Yagasaki K, Saito Y, et al. Regular group exercise contributes to balanced health in older adults in Japan: a qualitative study. BMC Geriatr. 2017;17:190. doi:10.1186/s12877-017-0584-3
- Wolfson JA, Ramsing R, Richardson CR, et al. Barriers to healthy food access: associations with household income and cooking behavior. Prev Med Rep. 2019;13:298-305. doi:10.1016/j.pmedr.2019.01.023
Whole Health(y) Aging With Gerofit: The Development of a Pilot Wellness Program for Older Veterans
Whole Health(y) Aging With Gerofit: The Development of a Pilot Wellness Program for Older Veterans

Cross-Sectional Analysis of Biologic Use in the Treatment of Veterans With Hidradenitis Suppurativa
Cross-Sectional Analysis of Biologic Use in the Treatment of Veterans With Hidradenitis Suppurativa
Hidradenitis suppurativa (HS) is a chronic, inflammatory skin disorder characterized by painful nodules, abscesses, and tunnels predominantly affecting intertriginous areas of the body.1,2 The condition poses significant challenges in terms of diagnosis, treatment, and quality of life for affected individuals. Various systemic therapies have been explored to manage this debilitating condition, with the emergence of biologic agents offering hope for improved outcomes. In 2015, adalimumab (ADA) was the first biologic approved by the US Food and Drug Administration (FDA) for the treatment of HS, followed by secukinumab in 2023 and bimekizumab in 2024. However, the off-label use of other biologics and/or tumor necrosis factor inhibitors such as infliximab (IFX) has become common practice.3
Although these therapies have demonstrated promising results in the treatment of HS, their widespread use may be hindered by accessibility and cost barriers. Orenstein et al analyzed data from the IBM Explorys platform from 2015 to 2020 and found that only 1.8% of patients diagnosed with HS had been prescribed ADA or IFX.4 More recently, Garg et al examined IBM MarketScan and IBM US Medicaid data from 2015 to 2018 to evaluate trends in clinical care and treatment. The prevalence of ADA and IFX prescriptions among patients with HS ranged from 2.3% to 8.0% (ADA) and 0.7% to 0.9% (IFX) for patients with commercial insurance, and 1.4% to 4.8% (ADA) and 0.5% to 0.7% (IFX) for patients with Medicaid.5 Biologics are often expensive, and the high cost associated with these therapies has been identified as a significant barrier to access for patients with HS, particularly those who lack adequate insurance coverage or face financial constraints.6
Furthermore, these barriers, particularly the financial barriers, are potentially compounded by the demographics of patients most notably affected by HS. In the US, a disproportionate incidence of HS has been noted in specific groups and age ranges, including women, individuals aged 18 to 29 years, and Black individuals.4 Orenstein et al found a statistically significant difference in use of ADA and IFX biologics based on age, sex, and race.4
The aim of this study was to examine the use of 2 biologics (ADA and IFX) in the Veterans Health Administration (VHA), a unique population in which financial barriers are reduced due to the single-payer government health care system structure. This design allowed for improved isolation and evaluation of variation in ADA and/or IFX prescription rates by demographics and health-related factors among patients with HS. To our knowledge, no studies have analyzed these metrics within the VHA.
Methods
This retrospective, cross-sectional analysis of VHA patients used data from the US Department of Veterans Affairs (VA) Corporate Data Warehouse, a data repository that provides access to longitudinal national electronic health record data for all veterans receiving care through VHA facilities. This study received ethical approval from institutional review boards at the Minneapolis Veterans Affairs Health Care System and VA Salt Lake City Healthcare System. Patient information was deidentified, and patient consent was not required.
Patients with HS were identified using ≥ 1 International Classification of Diseases (ICD) diagnostic code: (ICD-9 [705.83] or ICD-10 [L73.2]) between January 1, 2011, and December 31, 2021. The study included patients aged ≥ 18 years as of January 1, 2011, with ≥ 2 patient encounters during the postdiagnosis follow-up period, and with ≥ 1 encounter 6 months postindex. Patients with a biologic prescription prior to HS diagnosis were excluded. For this study, the term biologics refers to ADA and/or IFX prescriptions, unless otherwise specified. Only ADA and IFX were included in this analysis because ADA, a tumor necrosis factor (TNF)-á inhibitor, was the only FDA-approved medication at the time of the search, and IFX is another common TNF-α inhibitor used for the treatment of HS.
Statistical Analysis
We calculated logistic regression using SAS 9.4 (SAS Institute, Cary, NC). For each variable, the univariate relationship with biologic prescriptions was examined first, followed by the multivariate relationship controlling for all other variables. The following variables were controlled for in the multivariate models and were chosen a priori: sex, age, race, ethnicity, US region, hospital setting, current or previous tobacco use, obesity (defined as body mass index [BMI] ≥ 30), and Charlson Comorbidity Index (CCI).7
Results
Using ICD codes, we identified 29,483 individuals with ≥ 1 HS diagnosis (Figure 1). Of those identified, 1537 patients (5.21%) had been prescribed ≥ 1 biologic. The cohort was predominantly White (60.56%), male (75.27%), obese (59.34%), and had a history of current or previous tobacco use (73.47%) (Table 1). There were significant adjusted differences in prescription rates among veterans with HS based on age, race, and BMI. Notably, there was an age-dependent reduction in the odds of being prescribed a biologic in patients with HS. Compared with patients aged 18 to 44 years, patients aged 45 to 64 years (adjusted odds ratio [aOR], 0.63; 95% CI, 0.54–0.74; P < .001) and patients aged ≥ 65 years (aOR, 0.36; 95% CI, 0.27–0.48; P < .001) had significantly lower odds of receiving a biologic prescription (Table 2). Compared with White patients with HS, Native Hawaiian (NH) or Pacific Islander (PI) patients were less likely to be prescribed a biologic (aOR, 0.23; 95% CI, 0.06–0.92; P = .04). Patients with obesity had significantly higher odds of receiving a biologic prescription compared with patients without obesity (aOR, 1.47; 95% CI, 1.27– 1.71; P < .001).
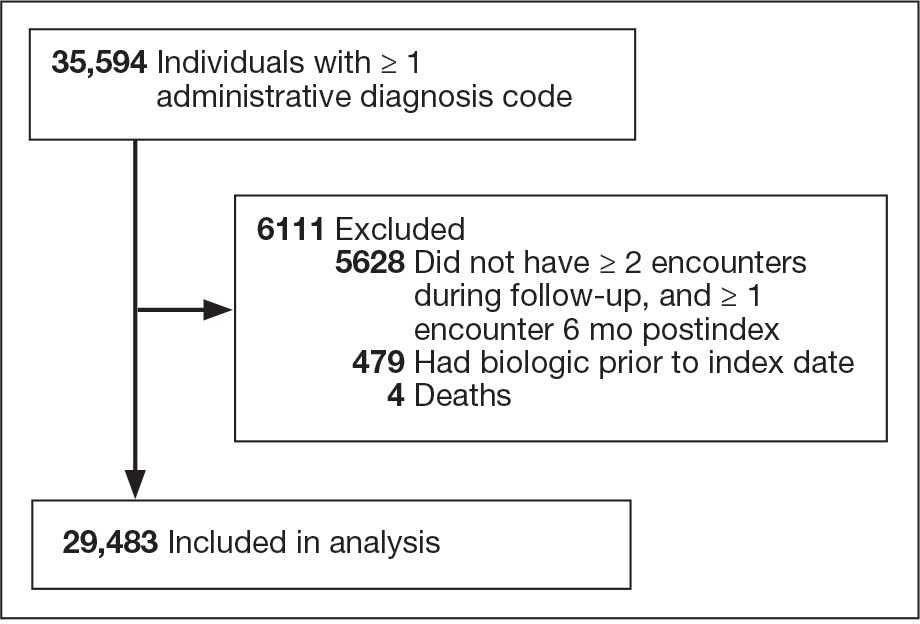
Included in Analysis.
After adjusting for the variables listed in Table 1, there were no significant differences in biologic prescription rates for men compared with women (aOR, 0.97; 95% CI, 0.83-1.12; P = .68). We observed slight variations in biologic prescriptions between US regions (Midwest 5.0%, East 4.2%, South 5.8%, West 4.6%), none of which were significantly different in the fully adjusted model. No statistically significant differences were found in biologic prescriptions between urban and rural VA settings (5.4% vs 4.8%; aOR, 1.06; 95% CI, 0.90–1.24; P = .47). Tobacco use was not associated with the rate of biologic prescription receipt (aOR, 1.14; 95% CI, 0.97–1.34; P = .11). After adjusting for other variables (as outlined in Table 2), no significant differences were found between CCI of 0 and 1 (aOR, 0.97; 95% CI, 0.82–1.16; P = .77) or between CCI of 0 and 2 (aOR, 0.89; 95% CI, 0.74–1.07; P = .22).7
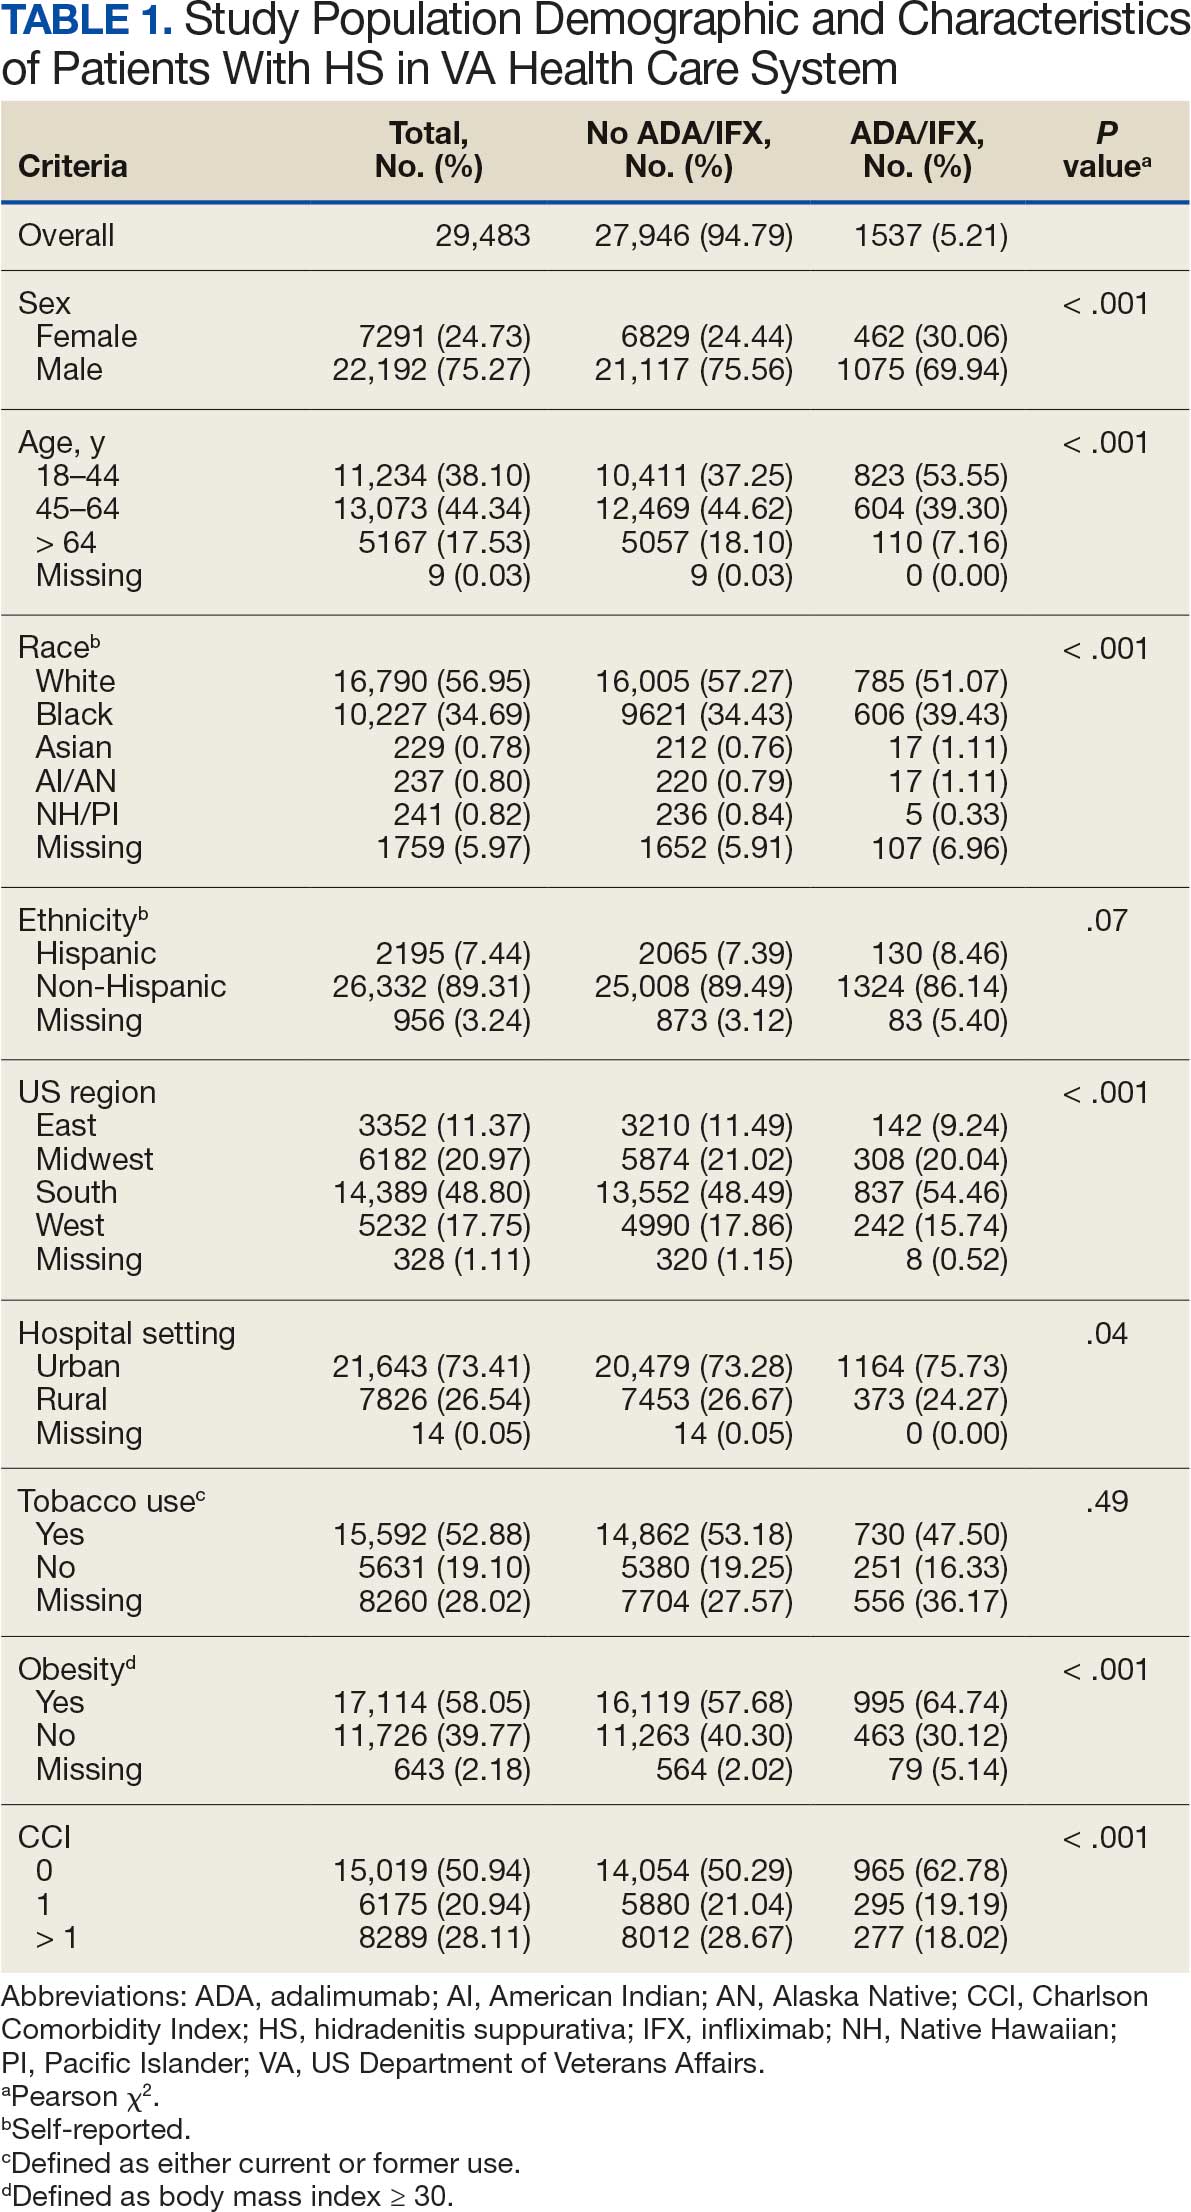
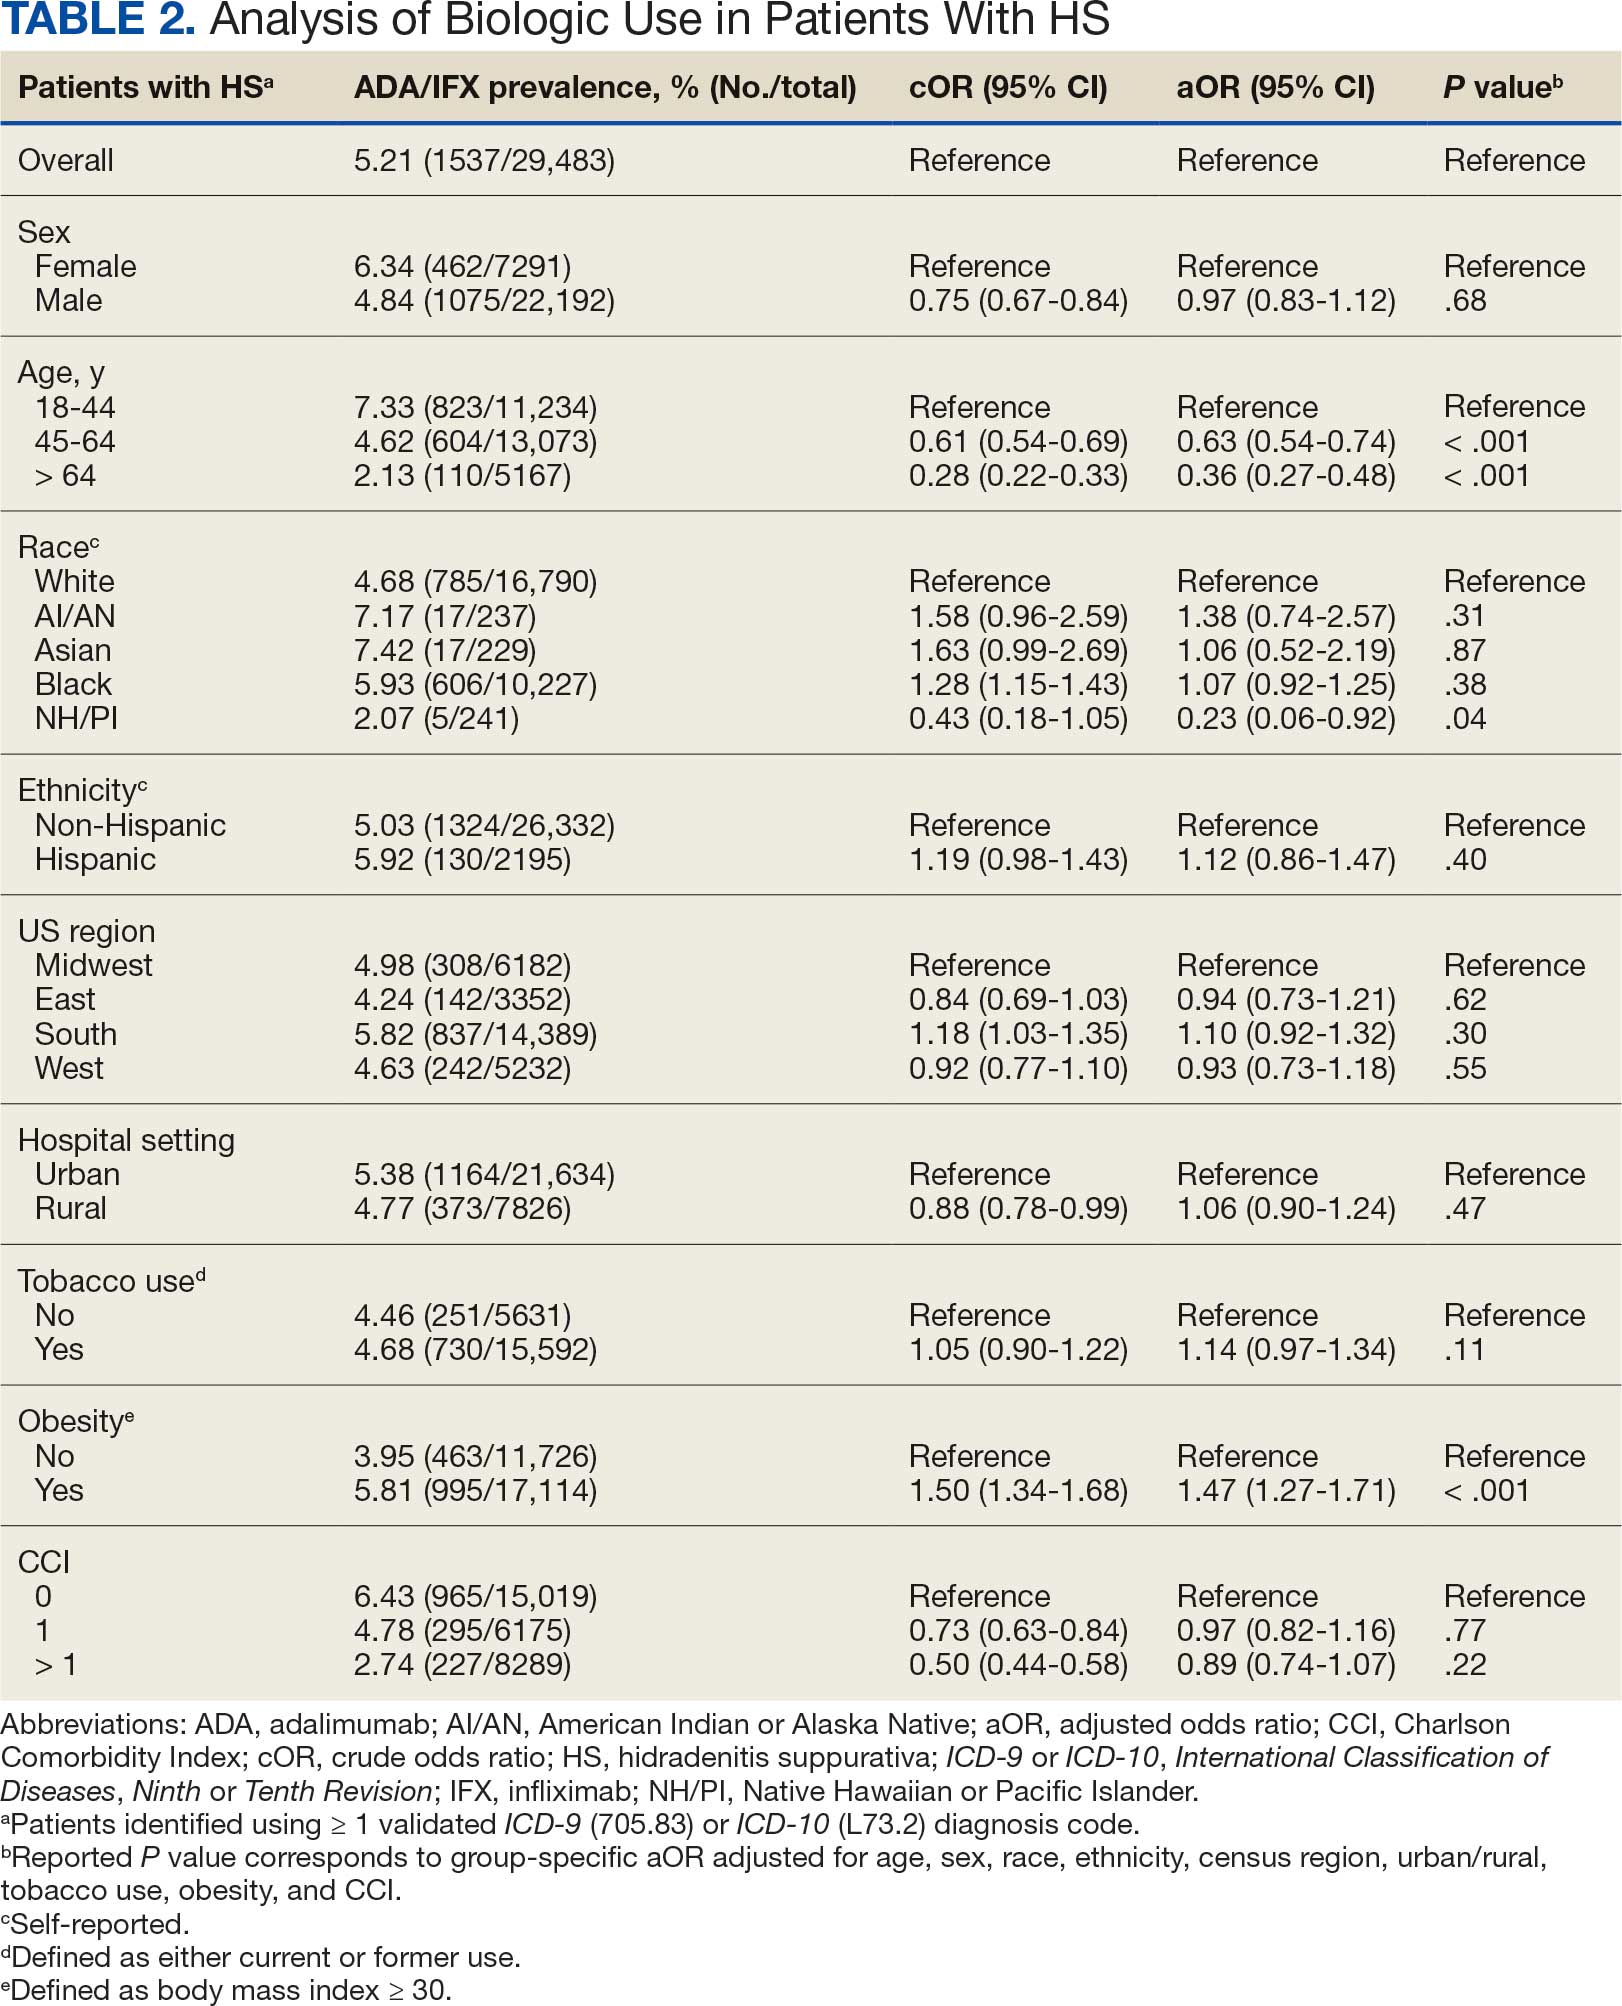
Discussion
The aim of the study was to ascertain potential discrepancies in biologic prescription patterns among patients with HS in the VHA by demographic and lifestyle behavior modifiers. Veteran cohorts are unique in composition, consisting predominantly of older White men within a single-payer health care system. The prevalence of biologic prescriptions in this population was low (5.2%), consistent with prior studies (1.8%–8.9%).4,5
We found a significant difference in ADA/IFX prescription patterns between White patients and NH/PI patients (aOR, 0.23; 95% CI, 0.06-0.92; P = .04). Further replication of this result is needed due to the small number of NH/PI patients included in the study (n = 241). Notably, we did not find a significant difference in the odds of Black patients being prescribed a biologic compared with White patients (aOR, 1.07; 95% CI, 0.92–1.25; P = .38), consistent with prior studies.4
In line with prior studies, age was associated with the likelihood of receiving a biologic prescription.4 Using the multivariate model adjusting for variables listed in Table 1, including CCI, patients aged 45 to 64 years and > 64 years were less likely to be prescribed a biologic than patients aged 18 to 44 years. HS disease activity could be a potential confounding variable, as HS severity may subside in some people with increasing age or menopause.8
Because different regions in the US have different sociopolitical ideologies and governing legislation, we hypothesized that there may be dissimilarities in the prevalence rates of biologic prescribing across various US regions. However, no significant differences were found in prescription patterns among US regions or between rural and urban settings. Previous research has demonstrated discernible disparities in both dermatologic care and clinical outcomes based on hospital setting (ie, urban vs rural).9-11
Tobacco use has been demonstrated to be associated with the development of HS.12 In a large retrospective analysis, Garg et al reported increased odds of receiving a new HS diagnosis in known tobacco users (aOR, 1.9; 95% CI, 1.8–2.0).13 The extent to which tobacco use affects HS severity is less understood. While some studies have found an association between smoking and HS severity, other analyses have failed to find this association.14,15 The effects of smoking cessation on the disease course of HS are unknown.16 This analysis, found no significant difference in prescriptions for biologics among patients with HS comparing current or previous tobacco users with nonusers.
There is a known positive correlation between increasing BMI and HS prevalence and severity that may be explained by the downstream effects of adipose tissue secretion of proinflammatory mediators and insulin resistance in the setting of chronic inflammation.12 This analysis found that patients with HS and obesity were 1.47 times more likely to be prescribed a biologic than patients with HS without obesity, which may be confounded by increased HS severity among patients with obesity. The initial concern when analyzing tobacco use and obesity was that clinician bias may result in a decrease in the prevalence of biologic use in these demographics, which was not supported in this study.
Although we identified few disparities, the results demonstrated a substantial underutilization of biologic therapies (5.2%), similar to the other US civilian studies (1.8-8.9%).4,5 While there is no current universal, standardized severity scoring system to evaluate HS (it is difficult to objectively define moderate to severe HS), estimates have shown that 40.3% to 65.8% of patients with HS have Hurley stage II or III.17-19 Therefore, only a small percentage of patients with moderate to severe disease were prescribed the only FDA-approved medication during this time period. The persistence of this underutilization within a medical system that reduces financial barriers suggests that nonfinancial barriers have a notable role in the underutilization of biologics.
For instance, risk of adverse events, particularly lymphoma and infection, has been cited by patients as a reason to avoid biologics. Additionally, treatment fatigue reduced some patients’ willingness to try new treatments, as did lack of knowledge about treatment options.6,20 Other reported barriers included the frequency of injections and fear of needles.6 Additionally, within the VA, ADA may require prior authorization at the local facility level.21 An established relationship with a dermatologist has been shown to significantly increase the odds of being prescribed a biologic medication in the face of these barriers.4 Future system-wide quality improvement initiatives could be implemented to identify patients with HS not followed by dermatology, with the goal of establishing care with a dermatologist.
Limitations
Limitations to this study include an inability to categorize HS disease severity and assess the degree to which disease severity confounded study findings, particularly in relation to tobacco use and obesity. The generalizability of this study is also limited because of the demographic characteristics of the veteran patient population, which is predominantly older, White, and male, whereas HS disproportionately affects younger, Black, and female individuals in the US.22 Despite these limitations, this study contributes valuable insights into the use of biologic therapies for veteran populations with HS using a national dataset.
Conclusions
This study was performed within a single-payer government medical system, likely reducing or removing the financial barriers that some patient populations may face when pursuing biologics for HS treatment. However, the prevalence of biologic use in this population was low overall (5.2%), suggesting that other factors play a role in the underutilization of biologics in HS. Consistent with previous studies, younger individuals were more likely to be prescribed a biologic, and no difference in prescription rates between Black and White patients was observed. Unlike previous studies, no significant difference in prescription rates between men and women was observed.
- Goldburg SR, Strober BE, Payette MJ. Hidradenitis suppurativa: epidemiology, clinical presentation, and pathogenesis. J Am Acad Dermatol. 2020;82:1045-1058. doi:10.1016/j.jaad.2019.08.090
- Tchero H, Herlin C, Bekara F, et al. Hidradenitis suppurativa: a systematic review and meta-analysis of therapeutic interventions. Indian J Dermatol Venereol Leprol. 2019;85:248-257. doi:10.4103/ijdvl.IJDVL_69_18
- Shih T, Lee K, Grogan T, et al. Infliximab in hidradenitis suppurativa: a systematic review and meta-analysis. Dermatol Ther. 2022;35:e15691. doi:10.1111/dth.15691
- Orenstein LAV, Wright S, Strunk A, et al. Low prescription of tumor necrosis alpha inhibitors in hidradenitis suppurativa: a cross-sectional analysis. J Am Acad Dermatol. 2021;84:1399-1401. doi:10.1016/j.jaad.2020.07.108
- Garg A, Naik HB, Alavi A, et al. Real-world findings on the characteristics and treatment exposures of patients with hidradenitis suppurativa from US claims data. Dermatol Ther (Heidelb). 2023;13:581-594. doi:10.1007/s13555-022-00872-1
- De DR, Shih T, Fixsen D, et al. Biologic use in hidradenitis suppurativa: patient perspectives and barriers. J Dermatolog Treat. 2022;33:3060-3062. doi:10.1080/09546634.2022.2089336
- Charlson ME, Pompei P, Ales KL, et al. A new method of classifying prognostic comorbidity in longitudinal studies: development and validation. J Chronic Dis. 1987;40:373- 383. doi:10.1016/0021-9681(87)90171-8
- von der Werth JM, Williams HC. The natural history of hidradenitis suppurativa. J Eur Acad Dermatol Venereol. 2000;14:389-392. doi:10.1046/j.1468-3083.2000.00087.x
- Silverberg JI, Barbarot S, Gadkari A, et al. Atopic dermatitis in the pediatric population: a cross-sectional, international epidemiologic study. Ann Allergy Asthma Immunol. 2021;126:417-428.e2. doi:10.1016/j.anai.2020.12.020
- Wu YP, Parsons B, Jo Y, et al. Outdoor activities and sunburn among urban and rural families in a Western region of the US: implications for skin cancer prevention. Prev Med Rep. 2022;29:101914. doi:10.1016/j.pmedr.2022.101914
- Mannschreck DB, Li X, Okoye G. Rural melanoma patients in Maryland do not present with more advanced disease than urban patients. Dermatol Online J. 2021;27. doi:10.5070/D327553607
- Garg A, Malviya N, Strunk A, et al. Comorbidity screening in hidradenitis suppurativa: evidence-based recommendations from the US and Canadian Hidradenitis Suppurativa Foundations. J Am Acad Dermatol. 2022;86:1092-1101. doi:10.1016/j.jaad.2021.01.059
- Garg A, Papagermanos V, Midura M, et al. Incidence of hidradenitis suppurativa among tobacco smokers: a population- based retrospective analysis in the U.S.A. Br J Dermatol. 2018;178:709-714. doi:10.1111/bjd.15939
- Sartorius K, Emtestam L, Jemec GBE, et al. Objective scoring of hidradenitis suppurativa reflecting the role of tobacco smoking and obesity. Br J Dermatol. 2009;161:831- 839. doi:10.1111/j.1365-2133.2009.09198.x
- Canoui-Poitrine F, Revuz JE, Wolkenstein P, et al. Clinical characteristics of a series of 302 French patients with hidradenitis suppurativa, with an analysis of factors associated with disease severity. J Am Acad Dermatol. 2009;61:51-57. doi:10.1016/j.jaad.2009.02.013
- Dufour DN, Emtestam L, Jemec GB. Hidradenitis suppurativa: a common and burdensome, yet under-recognised, inflammatory skin disease. Postgrad Med J. 2014;90:216- 221. doi:10.1136/postgradmedj-2013-131994
- Vazquez BG, Alikhan A, Weaver AL, et al. Incidence of hidradenitis suppurativa and associated factors: a population- based study of Olmsted County, Minnesota. J Invest Dermatol. 2013;133:97-103. doi:10.1038/jid.2012.255
- Vanlaerhoven AMJD, Ardon CB, van Straalen KR, et al. Hurley III hidradenitis suppurativa has an aggressive disease course. Dermatology. 2018;234:232-233. doi:10.1159/000491547
- Shahi V, Alikhan A, Vazquez BG, et al. Prevalence of hidradenitis suppurativa: a population-based study in Olmsted County, Minnesota. Dermatology. 2014;229:154-158. doi:10.1159/000363381
- Salame N, Sow YN, Siira MR, et al. Factors affecting treatment selection among patients with hidradenitis suppurativa. JAMA Dermatol. 2024;160:179. doi:10.1001/jamadermatol.2023.5425
- VA Formulary Advisor: ADALIMUMAB-BWWD INJ,SOLN. US Department of Veterans Affairs. Updated December 17, 2025. Accessed January 15, 2026. https://www.va.gov/formularyadvisor/drugs/4042383-ADALIMUMAB-BWWD-INJ-SOLN
- Garg A, Lavian J, Lin G, et al. Incidence of hidradenitis suppurativa in the United States: a sex- and age-adjusted population analysis. J Am Acad Dermatol. 2017;77:118- 122. doi:10.1016/j.jaad.2017.02.005
Hidradenitis suppurativa (HS) is a chronic, inflammatory skin disorder characterized by painful nodules, abscesses, and tunnels predominantly affecting intertriginous areas of the body.1,2 The condition poses significant challenges in terms of diagnosis, treatment, and quality of life for affected individuals. Various systemic therapies have been explored to manage this debilitating condition, with the emergence of biologic agents offering hope for improved outcomes. In 2015, adalimumab (ADA) was the first biologic approved by the US Food and Drug Administration (FDA) for the treatment of HS, followed by secukinumab in 2023 and bimekizumab in 2024. However, the off-label use of other biologics and/or tumor necrosis factor inhibitors such as infliximab (IFX) has become common practice.3
Although these therapies have demonstrated promising results in the treatment of HS, their widespread use may be hindered by accessibility and cost barriers. Orenstein et al analyzed data from the IBM Explorys platform from 2015 to 2020 and found that only 1.8% of patients diagnosed with HS had been prescribed ADA or IFX.4 More recently, Garg et al examined IBM MarketScan and IBM US Medicaid data from 2015 to 2018 to evaluate trends in clinical care and treatment. The prevalence of ADA and IFX prescriptions among patients with HS ranged from 2.3% to 8.0% (ADA) and 0.7% to 0.9% (IFX) for patients with commercial insurance, and 1.4% to 4.8% (ADA) and 0.5% to 0.7% (IFX) for patients with Medicaid.5 Biologics are often expensive, and the high cost associated with these therapies has been identified as a significant barrier to access for patients with HS, particularly those who lack adequate insurance coverage or face financial constraints.6
Furthermore, these barriers, particularly the financial barriers, are potentially compounded by the demographics of patients most notably affected by HS. In the US, a disproportionate incidence of HS has been noted in specific groups and age ranges, including women, individuals aged 18 to 29 years, and Black individuals.4 Orenstein et al found a statistically significant difference in use of ADA and IFX biologics based on age, sex, and race.4
The aim of this study was to examine the use of 2 biologics (ADA and IFX) in the Veterans Health Administration (VHA), a unique population in which financial barriers are reduced due to the single-payer government health care system structure. This design allowed for improved isolation and evaluation of variation in ADA and/or IFX prescription rates by demographics and health-related factors among patients with HS. To our knowledge, no studies have analyzed these metrics within the VHA.
Methods
This retrospective, cross-sectional analysis of VHA patients used data from the US Department of Veterans Affairs (VA) Corporate Data Warehouse, a data repository that provides access to longitudinal national electronic health record data for all veterans receiving care through VHA facilities. This study received ethical approval from institutional review boards at the Minneapolis Veterans Affairs Health Care System and VA Salt Lake City Healthcare System. Patient information was deidentified, and patient consent was not required.
Patients with HS were identified using ≥ 1 International Classification of Diseases (ICD) diagnostic code: (ICD-9 [705.83] or ICD-10 [L73.2]) between January 1, 2011, and December 31, 2021. The study included patients aged ≥ 18 years as of January 1, 2011, with ≥ 2 patient encounters during the postdiagnosis follow-up period, and with ≥ 1 encounter 6 months postindex. Patients with a biologic prescription prior to HS diagnosis were excluded. For this study, the term biologics refers to ADA and/or IFX prescriptions, unless otherwise specified. Only ADA and IFX were included in this analysis because ADA, a tumor necrosis factor (TNF)-á inhibitor, was the only FDA-approved medication at the time of the search, and IFX is another common TNF-α inhibitor used for the treatment of HS.
Statistical Analysis
We calculated logistic regression using SAS 9.4 (SAS Institute, Cary, NC). For each variable, the univariate relationship with biologic prescriptions was examined first, followed by the multivariate relationship controlling for all other variables. The following variables were controlled for in the multivariate models and were chosen a priori: sex, age, race, ethnicity, US region, hospital setting, current or previous tobacco use, obesity (defined as body mass index [BMI] ≥ 30), and Charlson Comorbidity Index (CCI).7
Results
Using ICD codes, we identified 29,483 individuals with ≥ 1 HS diagnosis (Figure 1). Of those identified, 1537 patients (5.21%) had been prescribed ≥ 1 biologic. The cohort was predominantly White (60.56%), male (75.27%), obese (59.34%), and had a history of current or previous tobacco use (73.47%) (Table 1). There were significant adjusted differences in prescription rates among veterans with HS based on age, race, and BMI. Notably, there was an age-dependent reduction in the odds of being prescribed a biologic in patients with HS. Compared with patients aged 18 to 44 years, patients aged 45 to 64 years (adjusted odds ratio [aOR], 0.63; 95% CI, 0.54–0.74; P < .001) and patients aged ≥ 65 years (aOR, 0.36; 95% CI, 0.27–0.48; P < .001) had significantly lower odds of receiving a biologic prescription (Table 2). Compared with White patients with HS, Native Hawaiian (NH) or Pacific Islander (PI) patients were less likely to be prescribed a biologic (aOR, 0.23; 95% CI, 0.06–0.92; P = .04). Patients with obesity had significantly higher odds of receiving a biologic prescription compared with patients without obesity (aOR, 1.47; 95% CI, 1.27– 1.71; P < .001).
Included in Analysis.
After adjusting for the variables listed in Table 1, there were no significant differences in biologic prescription rates for men compared with women (aOR, 0.97; 95% CI, 0.83-1.12; P = .68). We observed slight variations in biologic prescriptions between US regions (Midwest 5.0%, East 4.2%, South 5.8%, West 4.6%), none of which were significantly different in the fully adjusted model. No statistically significant differences were found in biologic prescriptions between urban and rural VA settings (5.4% vs 4.8%; aOR, 1.06; 95% CI, 0.90–1.24; P = .47). Tobacco use was not associated with the rate of biologic prescription receipt (aOR, 1.14; 95% CI, 0.97–1.34; P = .11). After adjusting for other variables (as outlined in Table 2), no significant differences were found between CCI of 0 and 1 (aOR, 0.97; 95% CI, 0.82–1.16; P = .77) or between CCI of 0 and 2 (aOR, 0.89; 95% CI, 0.74–1.07; P = .22).7
Discussion
The aim of the study was to ascertain potential discrepancies in biologic prescription patterns among patients with HS in the VHA by demographic and lifestyle behavior modifiers. Veteran cohorts are unique in composition, consisting predominantly of older White men within a single-payer health care system. The prevalence of biologic prescriptions in this population was low (5.2%), consistent with prior studies (1.8%–8.9%).4,5
We found a significant difference in ADA/IFX prescription patterns between White patients and NH/PI patients (aOR, 0.23; 95% CI, 0.06-0.92; P = .04). Further replication of this result is needed due to the small number of NH/PI patients included in the study (n = 241). Notably, we did not find a significant difference in the odds of Black patients being prescribed a biologic compared with White patients (aOR, 1.07; 95% CI, 0.92–1.25; P = .38), consistent with prior studies.4
In line with prior studies, age was associated with the likelihood of receiving a biologic prescription.4 Using the multivariate model adjusting for variables listed in Table 1, including CCI, patients aged 45 to 64 years and > 64 years were less likely to be prescribed a biologic than patients aged 18 to 44 years. HS disease activity could be a potential confounding variable, as HS severity may subside in some people with increasing age or menopause.8
Because different regions in the US have different sociopolitical ideologies and governing legislation, we hypothesized that there may be dissimilarities in the prevalence rates of biologic prescribing across various US regions. However, no significant differences were found in prescription patterns among US regions or between rural and urban settings. Previous research has demonstrated discernible disparities in both dermatologic care and clinical outcomes based on hospital setting (ie, urban vs rural).9-11
Tobacco use has been demonstrated to be associated with the development of HS.12 In a large retrospective analysis, Garg et al reported increased odds of receiving a new HS diagnosis in known tobacco users (aOR, 1.9; 95% CI, 1.8–2.0).13 The extent to which tobacco use affects HS severity is less understood. While some studies have found an association between smoking and HS severity, other analyses have failed to find this association.14,15 The effects of smoking cessation on the disease course of HS are unknown.16 This analysis, found no significant difference in prescriptions for biologics among patients with HS comparing current or previous tobacco users with nonusers.
There is a known positive correlation between increasing BMI and HS prevalence and severity that may be explained by the downstream effects of adipose tissue secretion of proinflammatory mediators and insulin resistance in the setting of chronic inflammation.12 This analysis found that patients with HS and obesity were 1.47 times more likely to be prescribed a biologic than patients with HS without obesity, which may be confounded by increased HS severity among patients with obesity. The initial concern when analyzing tobacco use and obesity was that clinician bias may result in a decrease in the prevalence of biologic use in these demographics, which was not supported in this study.
Although we identified few disparities, the results demonstrated a substantial underutilization of biologic therapies (5.2%), similar to the other US civilian studies (1.8-8.9%).4,5 While there is no current universal, standardized severity scoring system to evaluate HS (it is difficult to objectively define moderate to severe HS), estimates have shown that 40.3% to 65.8% of patients with HS have Hurley stage II or III.17-19 Therefore, only a small percentage of patients with moderate to severe disease were prescribed the only FDA-approved medication during this time period. The persistence of this underutilization within a medical system that reduces financial barriers suggests that nonfinancial barriers have a notable role in the underutilization of biologics.
For instance, risk of adverse events, particularly lymphoma and infection, has been cited by patients as a reason to avoid biologics. Additionally, treatment fatigue reduced some patients’ willingness to try new treatments, as did lack of knowledge about treatment options.6,20 Other reported barriers included the frequency of injections and fear of needles.6 Additionally, within the VA, ADA may require prior authorization at the local facility level.21 An established relationship with a dermatologist has been shown to significantly increase the odds of being prescribed a biologic medication in the face of these barriers.4 Future system-wide quality improvement initiatives could be implemented to identify patients with HS not followed by dermatology, with the goal of establishing care with a dermatologist.
Limitations
Limitations to this study include an inability to categorize HS disease severity and assess the degree to which disease severity confounded study findings, particularly in relation to tobacco use and obesity. The generalizability of this study is also limited because of the demographic characteristics of the veteran patient population, which is predominantly older, White, and male, whereas HS disproportionately affects younger, Black, and female individuals in the US.22 Despite these limitations, this study contributes valuable insights into the use of biologic therapies for veteran populations with HS using a national dataset.
Conclusions
This study was performed within a single-payer government medical system, likely reducing or removing the financial barriers that some patient populations may face when pursuing biologics for HS treatment. However, the prevalence of biologic use in this population was low overall (5.2%), suggesting that other factors play a role in the underutilization of biologics in HS. Consistent with previous studies, younger individuals were more likely to be prescribed a biologic, and no difference in prescription rates between Black and White patients was observed. Unlike previous studies, no significant difference in prescription rates between men and women was observed.
- Goldburg SR, Strober BE, Payette MJ. Hidradenitis suppurativa: epidemiology, clinical presentation, and pathogenesis. J Am Acad Dermatol. 2020;82:1045-1058. doi:10.1016/j.jaad.2019.08.090
- Tchero H, Herlin C, Bekara F, et al. Hidradenitis suppurativa: a systematic review and meta-analysis of therapeutic interventions. Indian J Dermatol Venereol Leprol. 2019;85:248-257. doi:10.4103/ijdvl.IJDVL_69_18
- Shih T, Lee K, Grogan T, et al. Infliximab in hidradenitis suppurativa: a systematic review and meta-analysis. Dermatol Ther. 2022;35:e15691. doi:10.1111/dth.15691
- Orenstein LAV, Wright S, Strunk A, et al. Low prescription of tumor necrosis alpha inhibitors in hidradenitis suppurativa: a cross-sectional analysis. J Am Acad Dermatol. 2021;84:1399-1401. doi:10.1016/j.jaad.2020.07.108
- Garg A, Naik HB, Alavi A, et al. Real-world findings on the characteristics and treatment exposures of patients with hidradenitis suppurativa from US claims data. Dermatol Ther (Heidelb). 2023;13:581-594. doi:10.1007/s13555-022-00872-1
- De DR, Shih T, Fixsen D, et al. Biologic use in hidradenitis suppurativa: patient perspectives and barriers. J Dermatolog Treat. 2022;33:3060-3062. doi:10.1080/09546634.2022.2089336
- Charlson ME, Pompei P, Ales KL, et al. A new method of classifying prognostic comorbidity in longitudinal studies: development and validation. J Chronic Dis. 1987;40:373- 383. doi:10.1016/0021-9681(87)90171-8
- von der Werth JM, Williams HC. The natural history of hidradenitis suppurativa. J Eur Acad Dermatol Venereol. 2000;14:389-392. doi:10.1046/j.1468-3083.2000.00087.x
- Silverberg JI, Barbarot S, Gadkari A, et al. Atopic dermatitis in the pediatric population: a cross-sectional, international epidemiologic study. Ann Allergy Asthma Immunol. 2021;126:417-428.e2. doi:10.1016/j.anai.2020.12.020
- Wu YP, Parsons B, Jo Y, et al. Outdoor activities and sunburn among urban and rural families in a Western region of the US: implications for skin cancer prevention. Prev Med Rep. 2022;29:101914. doi:10.1016/j.pmedr.2022.101914
- Mannschreck DB, Li X, Okoye G. Rural melanoma patients in Maryland do not present with more advanced disease than urban patients. Dermatol Online J. 2021;27. doi:10.5070/D327553607
- Garg A, Malviya N, Strunk A, et al. Comorbidity screening in hidradenitis suppurativa: evidence-based recommendations from the US and Canadian Hidradenitis Suppurativa Foundations. J Am Acad Dermatol. 2022;86:1092-1101. doi:10.1016/j.jaad.2021.01.059
- Garg A, Papagermanos V, Midura M, et al. Incidence of hidradenitis suppurativa among tobacco smokers: a population- based retrospective analysis in the U.S.A. Br J Dermatol. 2018;178:709-714. doi:10.1111/bjd.15939
- Sartorius K, Emtestam L, Jemec GBE, et al. Objective scoring of hidradenitis suppurativa reflecting the role of tobacco smoking and obesity. Br J Dermatol. 2009;161:831- 839. doi:10.1111/j.1365-2133.2009.09198.x
- Canoui-Poitrine F, Revuz JE, Wolkenstein P, et al. Clinical characteristics of a series of 302 French patients with hidradenitis suppurativa, with an analysis of factors associated with disease severity. J Am Acad Dermatol. 2009;61:51-57. doi:10.1016/j.jaad.2009.02.013
- Dufour DN, Emtestam L, Jemec GB. Hidradenitis suppurativa: a common and burdensome, yet under-recognised, inflammatory skin disease. Postgrad Med J. 2014;90:216- 221. doi:10.1136/postgradmedj-2013-131994
- Vazquez BG, Alikhan A, Weaver AL, et al. Incidence of hidradenitis suppurativa and associated factors: a population- based study of Olmsted County, Minnesota. J Invest Dermatol. 2013;133:97-103. doi:10.1038/jid.2012.255
- Vanlaerhoven AMJD, Ardon CB, van Straalen KR, et al. Hurley III hidradenitis suppurativa has an aggressive disease course. Dermatology. 2018;234:232-233. doi:10.1159/000491547
- Shahi V, Alikhan A, Vazquez BG, et al. Prevalence of hidradenitis suppurativa: a population-based study in Olmsted County, Minnesota. Dermatology. 2014;229:154-158. doi:10.1159/000363381
- Salame N, Sow YN, Siira MR, et al. Factors affecting treatment selection among patients with hidradenitis suppurativa. JAMA Dermatol. 2024;160:179. doi:10.1001/jamadermatol.2023.5425
- VA Formulary Advisor: ADALIMUMAB-BWWD INJ,SOLN. US Department of Veterans Affairs. Updated December 17, 2025. Accessed January 15, 2026. https://www.va.gov/formularyadvisor/drugs/4042383-ADALIMUMAB-BWWD-INJ-SOLN
- Garg A, Lavian J, Lin G, et al. Incidence of hidradenitis suppurativa in the United States: a sex- and age-adjusted population analysis. J Am Acad Dermatol. 2017;77:118- 122. doi:10.1016/j.jaad.2017.02.005
Cross-Sectional Analysis of Biologic Use in the Treatment of Veterans With Hidradenitis Suppurativa
Cross-Sectional Analysis of Biologic Use in the Treatment of Veterans With Hidradenitis Suppurativa

Managing Resistance to Change Along the Journey to High Reliability
Managing Resistance to Change Along the Journey to High Reliability
To improve safety performance, many health care organizations have embarked on the journey to becoming high reliability organizations (HROs). HROs operate in complex, high-risk, constantly changing environments and avoid catastrophic events despite the inherent risks.1 HROs maintain high levels of safety and reliability by adhering to core principles, foundational practices, rigorous processes, a strong organizational culture, and continuous learning and process improvement.1-3
Becoming an HRO requires understanding what makes systems safer for patients and staff at all levels by taking ownership of 5 principles: (1) sensitivity to operations (increased awareness of the current status of systems); (2) reluctance to simplify (avoiding oversimplification of the cause[s] of problems); (3) preoccupation with failure (anticipating risks that might be symptomatic of a larger problem); (4) deference to expertise (relying on the most qualified individuals to make decisions); and (5) commitment to resilience (planning for potential failure and being prepared to respond).1,2,4 In addition to these, the Veterans Health Administration has identified 3 pillars of HROs: leadership commitment (safety and reliability are central to leadership vision, decision-making, and action-oriented behaviors), safety culture (across the organization, safety values are key to preventing harm and learning from mistakes), and continuous process improvement (promoting constant learning and improvement with evidence-based tools and methodologies).5
Implementing these principles is not enough to achieve high reliability. This transition requires significant change, which can be met with resistance. Without attending to organizational change, implementation of HRO principles can be superficial, scattered, and isolated.6 Large organizations often struggle with change as it conflicts with the fundamental human need for stability and security.7 Consequently, the journey to becoming an HRO requires an understanding of the reasons for resistance to change (RtC) as well as evidence-based strategies.
REASONS FOR RESISTANCE TO CHANGE
RtC is the informal and covert behavior of an individual or group to a particular change. RtC is commonly recognized as the failure of employees to do anything requested by managers and is a main reason change initiatives fail.8 While some staff see change as opportunities for learning and growth, others resist based on uncertainty about how the changes will impact their current work situation, or fear, frustration, confusion, and distrust.8,9 Resistance can overtly manifest with some staff publicly expressing their discontent in public without offering solutions, or covertly by ignoring the change or avoiding participation in any aspect of the change process. Both forms of RtC are equally detrimental.8
Frequent changes in organizations can also cause cynicism. Employees will view the change as something initially popular, but will only last until another change comes along.8,9 Resistance can result in the failure to achieve desired objectives, wasted time, effort, and resources, decreased momentum, and loss of confidence and trust in leaders to effectively manage the change process.9 To understand RtC, 3 main factors must be considered: individual, interpersonal, and organizational.
Individual
An individual’s personality can be an important indicator for how they will respond to change. Some individuals welcome and thrive on change while others resist in preference for the status quo.8,10 Individuals will also resist change if they believe their position, power, or prestige within the organization are in jeopardy or that the change is contrary to current personal or organizational values, principles, and objectives.8-12 Resistance can also be the result of uncertainty about what the change means, lack of information regarding the change, or questioning motives for the change.9
Interpersonal
Another influence on RtC is the interpersonal factors of employees. The personal satisfaction individuals receive from their work and the type of interactions they experience with colleagues can impact RtC. When communication with colleagues is lacking before and during change implementation, negative reactions to the change can fuel resistance.11 Cross-functional and bidirectional communication is vital; its absence can leave staff feeling inadequately informed and less supportive of the change.8 Employees’ understanding of changes through communication between other members of the organization is critical to success.11
Organizational
How organizational leaders introduce change affects the extent to which staff respond.10 RtC can emerge if staff feel change is imposed on them. Change is better received when people are actively engaged in the process and adopt a sense of ownership that will ultimately affect them and their role within the organization.12,13 Organizations are also better equipped to address potential RtC when leadership is respected and have a genuine concern for the overall well-being of staff members. Organizational leaders who mainly focus on the bottom line and have little regard for staff are more likely to be perceived as untrustworthy, which contributes to RtC.9,13 Lack of proper education and guidance from organizational leaders, as well as poor communication, can lead to RtC.8,13
MANAGING RESISTANCE TO CHANGE
RtC can be a significant factor in the success or failure of the change process. Poorly managed change can exponentially increase resistance, necessitating a multifaceted approach to managing RtC, while well-managed change can result in a high success rate. Evidence-based strategies to counter RtC focus on communication, employee participation, education and training, and engaging managers.8
Communication
Open and effective communication is critical to managing RtC, as uncertainty often exaggerates the negative aspects of change. Effective communication involves active listening, with leadership and management addressing employee concerns in a clear and concise manner. A psychologically safe culture for open dialogue is essential when addressing RtC.9,14,15 Psychological safety empowers staff to speak up, ask questions, and offer ideas, forming a solid basis for open and effective communication and participation. Leaders and managers should create opportunities for open dialogue for all members of the organization throughout the process. This can be accomplished with one-on-one meetings, open forums, town hall meetings, electronic mail, newsletters, and social media. Topics should cover the reasons for change, details of what is changing, the individual, organizational, and patient risks of not changing, as well as the benefits of changing.9 Encouraging staff to ask questions and provide feedback to promote bidirectional and closed-loop communication is essential to avoid misunderstandings.9,15 While open communication is essential, leaders must carefully plan what information to share, how much to share, and how to avoid information overload. Information about the change should be timely, adequate, applicable, and informative.15 The HRO practice of leader rounding for high reliability can be instrumental to ensure effective, bidirectional communication and collaboration among all disciplines across a health care organization through improving leadership visibility during times of change and enhancing interactions and communication with staff.3
Employee Participation
Involving staff in the change process significantly reduces RtC. Engagement fosters ownership in the change process, increasing the likelihood employees will support and even champion it. Health care professionals welcome opportunities to be involved in helping with aspects of organizational change, especially when invited to participate in the change early in the process and throughout the course of change.7,14,15
Leaders should encourage staff to provide feedback to understand the impact the change is having on them and their roles and responsibilities within the organization. This exemplifies the HRO principle of deference to expertise as the employee often has the most in-depth knowledge of their work setting. Employee perspectives can significantly influence the success of change initatives.7,14 Participation is impactful in providing employees with a sense of agency facilitating acceptance and improving desire to adopt the change.14
Tiered safety huddles and visual management systems (VMSs) also can engage staff. Tiered safety huddles provide a forum for transparent communication, increasing situational awareness, and improving a health care organization’s ability to appropriately respond to staff questions, suggestions, and concerns. VMSs display the status and progress toward organizational goals during the change process, and are highly effective in creating environments where staff feel empowered to voice concerns related to the change process.3
Education and Training
Educating employees on the value of change is crucial to overcome RtC. RtC often stems from employees not feeling prepared to adapt or adopt new processes. Health care professionals who do not receive information about change are less likely to support it.7,12,15 Staff are more likely to accept change when they understand why it is needed and how it impacts the organization’s long-term mission.11,15 Timely, compelling, and informative education on how to adapt to the change will promote more positive appraisal of the change and reduce RtC.8,15 Employees must feel confident they will receive the appropriate training, resources, and support to successfully adapt to the change. This requires leaders and managers taking time to clarify expectations, conduct a gap analysis to identify the skills and knowledge needed to support the planned change, and provide sufficient educational opportunities to fill those gaps.8 For example, the US Department of Veterans Affairs offers classes to employees on the Prosci ADKAR (Awareness, Desire, Knowledge, Ability, and Reinforcement) Model. This training provides individuals with the information and skills needed for change to be successful.16
Safety forums can be influential and allow leadership to educate staff on updates related to change processes and promote bidirectional communication.3 In safety forums, staff have an opportunity to ask questions, especially as they relate to learning about available resources to become more informed about the organizational changes.
Engaging Managers
Managers are pivotal to the successful implementation of organizational change.8 They serve as the bridge between senior leadership and frontline employees and are positioned to influence the adoption and success of change initiatives. Often the first point of contact for employees, managers can effectively communicate the need for change, and act as the liaison to align it with individual employee motivations. Since they are often the first to encounter resistance among employees, managers serve as advocates through the process. Through a coaching role, managers can help employees develop the knowledge and ability to be successful and thrive in the new environment. The Table summarizes the evidence-based strategies.
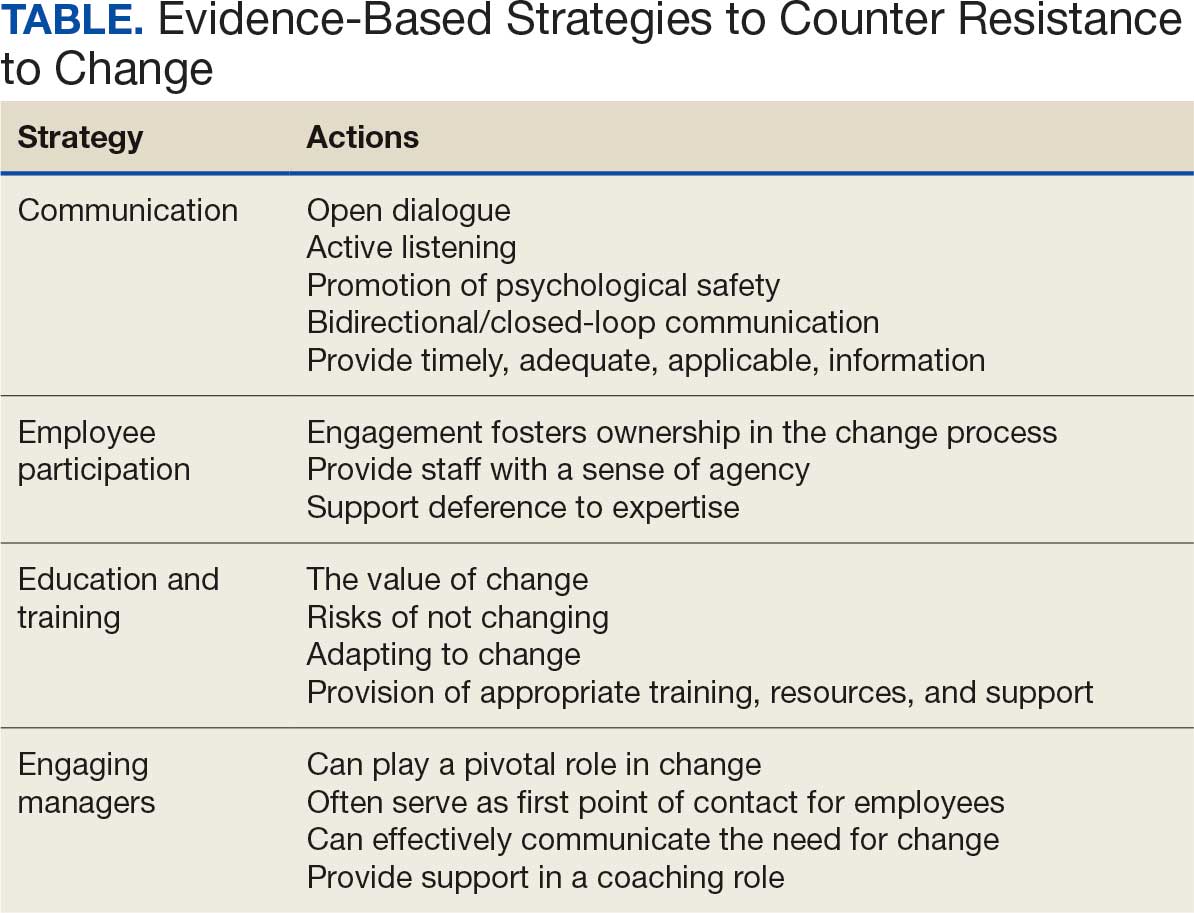
CONCLUSIONS
Implementing change in health care organizations can be challenging, especially on the journey to high reliability. RtC is the result of factors at the individual, interpersonal, and organizational levels that leaders must address to increase chances for success. Organizational changes in health care are more likely to succeed when staff understand why the change is needed through open and continuous communication, can influence the change by sharing their own perspectives, and have the knowledge, skills, and resources to prepare for and participate in the process.
- Merchant NB, O’Neal J, Dealing-Perez C, et al. A high-reliability organization mindset. Am J Med Qual. 2022;37:504-510. doi:10.1097/JMQ.0000000000000086
- Veazie S, Peterson K, Bourne D, et al. Implementing high-reliability organization principles into practice: a rapid evidence review. J Patient Saf. 2022;18:e320-e328. doi:10.1097/PTS.0000000000000768
- Murray JS, Baghdadi A, Dannenberg W, et al. The role of high reliability organization foundational practices in building a culture of safety. Fed Pract. 2024;41:214-221. doi:10.12788/fp.0486
- Ford J, Isaacks DB, Anderson T. Creating, executing and sustaining a high-reliability organization in health care. The Learning Organization: An International Journal. 2024;31:817-833. doi:10.1108/TLO-03-2023-0048
- Cox GR, Starr LM. VHA’s movement for change: implementing high-reliability principles and practices. J Healthc Manag. 2023;68:151-157. doi:10.1097/JHM-D-00056
- Myers CG, Sutcliffe KM. High reliability organising in healthcare: still a long way left to go. BMJ Qual Saf. 2022;31:845-848. doi:10.1136/bmjqs-2021-014141
- Nilsen P, Seing I, Ericsson C, et al. Characteristics of successful changes in health care organizations: an interview study with physicians, registered nurses and assistant nurses. BMC Health Serv Res. 2020;20:147. doi:10.1186/s12913-020-4999-8
- Cheraghi R, Ebrahimi H, Kheibar N, et al. Reasons for resistance to change in nursing: an integrative review. BMC Nurs. 2023;22:310. doi:10/1186/s12912-023-01460-0
- Warrick DD. Revisiting resistance to change and how to manage it: what has been learned and what organizations need to do. Bus Horiz. 2023;66:433-441. doi:10.1016/j.bushor.2022.09.001
- Sverdlik N, Oreg S. Beyond the individual-level conceptualization of dispositional resistance to change: multilevel effects on the response to organizational change. J Organ Behav. 2023;44:1066-1077. doi:10.1002/job.2678
- Khaw KW, Alnoor A, Al-Abrrow H, et al. Reactions towards organizational change: a systematic literature review. Curr Psychol. 2022;13:1-24. doi:10.1007/s12144-022-03070-6
- Pomare C, Churruca K, Long JC, et al. Organisational change in hospitals: a qualitative case-study of staff perspectives. BMC Health Serv Res. 2019;19:840. doi:10.1186/s12913-019-4704-y
- DuBose BM, Mayo AM. RtC: a concept analysis. Nurs Forum. 2020;55:631-636. doi:10.1111/nuf.12479
- Sahay S, Goldthwaite C. Participatory practices during organizational change: rethinking participation and resistance. Manag Commun Q. 2024;38(2):279-306. doi:10.1177/08933189231187883
- Damawan AH, Azizah S. Resistance to change: causes and strategies as an organizational challenge. ASSEHR. 2020;395(2020):49-53. doi:10.2991/assehr.k.200120.010
- Wong Q, Lacombe M, Keller R, et al. Leading change with ADKAR. Nurs Manage. 2019;50:28-35. doi:10.1097/01.NUMA.0000554341.70508.75
To improve safety performance, many health care organizations have embarked on the journey to becoming high reliability organizations (HROs). HROs operate in complex, high-risk, constantly changing environments and avoid catastrophic events despite the inherent risks.1 HROs maintain high levels of safety and reliability by adhering to core principles, foundational practices, rigorous processes, a strong organizational culture, and continuous learning and process improvement.1-3
Becoming an HRO requires understanding what makes systems safer for patients and staff at all levels by taking ownership of 5 principles: (1) sensitivity to operations (increased awareness of the current status of systems); (2) reluctance to simplify (avoiding oversimplification of the cause[s] of problems); (3) preoccupation with failure (anticipating risks that might be symptomatic of a larger problem); (4) deference to expertise (relying on the most qualified individuals to make decisions); and (5) commitment to resilience (planning for potential failure and being prepared to respond).1,2,4 In addition to these, the Veterans Health Administration has identified 3 pillars of HROs: leadership commitment (safety and reliability are central to leadership vision, decision-making, and action-oriented behaviors), safety culture (across the organization, safety values are key to preventing harm and learning from mistakes), and continuous process improvement (promoting constant learning and improvement with evidence-based tools and methodologies).5
Implementing these principles is not enough to achieve high reliability. This transition requires significant change, which can be met with resistance. Without attending to organizational change, implementation of HRO principles can be superficial, scattered, and isolated.6 Large organizations often struggle with change as it conflicts with the fundamental human need for stability and security.7 Consequently, the journey to becoming an HRO requires an understanding of the reasons for resistance to change (RtC) as well as evidence-based strategies.
REASONS FOR RESISTANCE TO CHANGE
RtC is the informal and covert behavior of an individual or group to a particular change. RtC is commonly recognized as the failure of employees to do anything requested by managers and is a main reason change initiatives fail.8 While some staff see change as opportunities for learning and growth, others resist based on uncertainty about how the changes will impact their current work situation, or fear, frustration, confusion, and distrust.8,9 Resistance can overtly manifest with some staff publicly expressing their discontent in public without offering solutions, or covertly by ignoring the change or avoiding participation in any aspect of the change process. Both forms of RtC are equally detrimental.8
Frequent changes in organizations can also cause cynicism. Employees will view the change as something initially popular, but will only last until another change comes along.8,9 Resistance can result in the failure to achieve desired objectives, wasted time, effort, and resources, decreased momentum, and loss of confidence and trust in leaders to effectively manage the change process.9 To understand RtC, 3 main factors must be considered: individual, interpersonal, and organizational.
Individual
An individual’s personality can be an important indicator for how they will respond to change. Some individuals welcome and thrive on change while others resist in preference for the status quo.8,10 Individuals will also resist change if they believe their position, power, or prestige within the organization are in jeopardy or that the change is contrary to current personal or organizational values, principles, and objectives.8-12 Resistance can also be the result of uncertainty about what the change means, lack of information regarding the change, or questioning motives for the change.9
Interpersonal
Another influence on RtC is the interpersonal factors of employees. The personal satisfaction individuals receive from their work and the type of interactions they experience with colleagues can impact RtC. When communication with colleagues is lacking before and during change implementation, negative reactions to the change can fuel resistance.11 Cross-functional and bidirectional communication is vital; its absence can leave staff feeling inadequately informed and less supportive of the change.8 Employees’ understanding of changes through communication between other members of the organization is critical to success.11
Organizational
How organizational leaders introduce change affects the extent to which staff respond.10 RtC can emerge if staff feel change is imposed on them. Change is better received when people are actively engaged in the process and adopt a sense of ownership that will ultimately affect them and their role within the organization.12,13 Organizations are also better equipped to address potential RtC when leadership is respected and have a genuine concern for the overall well-being of staff members. Organizational leaders who mainly focus on the bottom line and have little regard for staff are more likely to be perceived as untrustworthy, which contributes to RtC.9,13 Lack of proper education and guidance from organizational leaders, as well as poor communication, can lead to RtC.8,13
MANAGING RESISTANCE TO CHANGE
RtC can be a significant factor in the success or failure of the change process. Poorly managed change can exponentially increase resistance, necessitating a multifaceted approach to managing RtC, while well-managed change can result in a high success rate. Evidence-based strategies to counter RtC focus on communication, employee participation, education and training, and engaging managers.8
Communication
Open and effective communication is critical to managing RtC, as uncertainty often exaggerates the negative aspects of change. Effective communication involves active listening, with leadership and management addressing employee concerns in a clear and concise manner. A psychologically safe culture for open dialogue is essential when addressing RtC.9,14,15 Psychological safety empowers staff to speak up, ask questions, and offer ideas, forming a solid basis for open and effective communication and participation. Leaders and managers should create opportunities for open dialogue for all members of the organization throughout the process. This can be accomplished with one-on-one meetings, open forums, town hall meetings, electronic mail, newsletters, and social media. Topics should cover the reasons for change, details of what is changing, the individual, organizational, and patient risks of not changing, as well as the benefits of changing.9 Encouraging staff to ask questions and provide feedback to promote bidirectional and closed-loop communication is essential to avoid misunderstandings.9,15 While open communication is essential, leaders must carefully plan what information to share, how much to share, and how to avoid information overload. Information about the change should be timely, adequate, applicable, and informative.15 The HRO practice of leader rounding for high reliability can be instrumental to ensure effective, bidirectional communication and collaboration among all disciplines across a health care organization through improving leadership visibility during times of change and enhancing interactions and communication with staff.3
Employee Participation
Involving staff in the change process significantly reduces RtC. Engagement fosters ownership in the change process, increasing the likelihood employees will support and even champion it. Health care professionals welcome opportunities to be involved in helping with aspects of organizational change, especially when invited to participate in the change early in the process and throughout the course of change.7,14,15
Leaders should encourage staff to provide feedback to understand the impact the change is having on them and their roles and responsibilities within the organization. This exemplifies the HRO principle of deference to expertise as the employee often has the most in-depth knowledge of their work setting. Employee perspectives can significantly influence the success of change initatives.7,14 Participation is impactful in providing employees with a sense of agency facilitating acceptance and improving desire to adopt the change.14
Tiered safety huddles and visual management systems (VMSs) also can engage staff. Tiered safety huddles provide a forum for transparent communication, increasing situational awareness, and improving a health care organization’s ability to appropriately respond to staff questions, suggestions, and concerns. VMSs display the status and progress toward organizational goals during the change process, and are highly effective in creating environments where staff feel empowered to voice concerns related to the change process.3
Education and Training
Educating employees on the value of change is crucial to overcome RtC. RtC often stems from employees not feeling prepared to adapt or adopt new processes. Health care professionals who do not receive information about change are less likely to support it.7,12,15 Staff are more likely to accept change when they understand why it is needed and how it impacts the organization’s long-term mission.11,15 Timely, compelling, and informative education on how to adapt to the change will promote more positive appraisal of the change and reduce RtC.8,15 Employees must feel confident they will receive the appropriate training, resources, and support to successfully adapt to the change. This requires leaders and managers taking time to clarify expectations, conduct a gap analysis to identify the skills and knowledge needed to support the planned change, and provide sufficient educational opportunities to fill those gaps.8 For example, the US Department of Veterans Affairs offers classes to employees on the Prosci ADKAR (Awareness, Desire, Knowledge, Ability, and Reinforcement) Model. This training provides individuals with the information and skills needed for change to be successful.16
Safety forums can be influential and allow leadership to educate staff on updates related to change processes and promote bidirectional communication.3 In safety forums, staff have an opportunity to ask questions, especially as they relate to learning about available resources to become more informed about the organizational changes.
Engaging Managers
Managers are pivotal to the successful implementation of organizational change.8 They serve as the bridge between senior leadership and frontline employees and are positioned to influence the adoption and success of change initiatives. Often the first point of contact for employees, managers can effectively communicate the need for change, and act as the liaison to align it with individual employee motivations. Since they are often the first to encounter resistance among employees, managers serve as advocates through the process. Through a coaching role, managers can help employees develop the knowledge and ability to be successful and thrive in the new environment. The Table summarizes the evidence-based strategies.
CONCLUSIONS
Implementing change in health care organizations can be challenging, especially on the journey to high reliability. RtC is the result of factors at the individual, interpersonal, and organizational levels that leaders must address to increase chances for success. Organizational changes in health care are more likely to succeed when staff understand why the change is needed through open and continuous communication, can influence the change by sharing their own perspectives, and have the knowledge, skills, and resources to prepare for and participate in the process.
- Merchant NB, O’Neal J, Dealing-Perez C, et al. A high-reliability organization mindset. Am J Med Qual. 2022;37:504-510. doi:10.1097/JMQ.0000000000000086
- Veazie S, Peterson K, Bourne D, et al. Implementing high-reliability organization principles into practice: a rapid evidence review. J Patient Saf. 2022;18:e320-e328. doi:10.1097/PTS.0000000000000768
- Murray JS, Baghdadi A, Dannenberg W, et al. The role of high reliability organization foundational practices in building a culture of safety. Fed Pract. 2024;41:214-221. doi:10.12788/fp.0486
- Ford J, Isaacks DB, Anderson T. Creating, executing and sustaining a high-reliability organization in health care. The Learning Organization: An International Journal. 2024;31:817-833. doi:10.1108/TLO-03-2023-0048
- Cox GR, Starr LM. VHA’s movement for change: implementing high-reliability principles and practices. J Healthc Manag. 2023;68:151-157. doi:10.1097/JHM-D-00056
- Myers CG, Sutcliffe KM. High reliability organising in healthcare: still a long way left to go. BMJ Qual Saf. 2022;31:845-848. doi:10.1136/bmjqs-2021-014141
- Nilsen P, Seing I, Ericsson C, et al. Characteristics of successful changes in health care organizations: an interview study with physicians, registered nurses and assistant nurses. BMC Health Serv Res. 2020;20:147. doi:10.1186/s12913-020-4999-8
- Cheraghi R, Ebrahimi H, Kheibar N, et al. Reasons for resistance to change in nursing: an integrative review. BMC Nurs. 2023;22:310. doi:10/1186/s12912-023-01460-0
- Warrick DD. Revisiting resistance to change and how to manage it: what has been learned and what organizations need to do. Bus Horiz. 2023;66:433-441. doi:10.1016/j.bushor.2022.09.001
- Sverdlik N, Oreg S. Beyond the individual-level conceptualization of dispositional resistance to change: multilevel effects on the response to organizational change. J Organ Behav. 2023;44:1066-1077. doi:10.1002/job.2678
- Khaw KW, Alnoor A, Al-Abrrow H, et al. Reactions towards organizational change: a systematic literature review. Curr Psychol. 2022;13:1-24. doi:10.1007/s12144-022-03070-6
- Pomare C, Churruca K, Long JC, et al. Organisational change in hospitals: a qualitative case-study of staff perspectives. BMC Health Serv Res. 2019;19:840. doi:10.1186/s12913-019-4704-y
- DuBose BM, Mayo AM. RtC: a concept analysis. Nurs Forum. 2020;55:631-636. doi:10.1111/nuf.12479
- Sahay S, Goldthwaite C. Participatory practices during organizational change: rethinking participation and resistance. Manag Commun Q. 2024;38(2):279-306. doi:10.1177/08933189231187883
- Damawan AH, Azizah S. Resistance to change: causes and strategies as an organizational challenge. ASSEHR. 2020;395(2020):49-53. doi:10.2991/assehr.k.200120.010
- Wong Q, Lacombe M, Keller R, et al. Leading change with ADKAR. Nurs Manage. 2019;50:28-35. doi:10.1097/01.NUMA.0000554341.70508.75
Managing Resistance to Change Along the Journey to High Reliability
Managing Resistance to Change Along the Journey to High Reliability

Development and Validation of an Administrative Algorithm to Identify Veterans With Epilepsy
Development and Validation of an Administrative Algorithm to Identify Veterans With Epilepsy
Epilepsy affects about 4.5 million people in the United States and 150,000 new individuals are diagnosed each year.1,2 In 2019, epilepsy-attributable health care spending for noninstitutionalized people was around $5.4 billion and total epilepsy-attributable and epilepsy or seizure health care-related costs totaled $54 billion.3
Accurate surveillance of epilepsy in large health care systems can potentially improve health care delivery and resource allocation. A 2012 Institute of Medicine (IOM) report identified 13 recommendations to guide public health action on epilepsy, including validation of standard definitions for case ascertainment, identification of epilepsy through screening programs or protocols, and expansion of surveillance to better understand disease burden.4
A systematic review of validation studies concluded that it is reasonable to use administrative data to identify people with epilepsy in epidemiologic research. Combining The International Classification of Diseases (ICD) codes for epilepsy (ICD-10, G40-41; ICD-9, 345) with antiseizure medications (ASMs) could provide high positive predictive values (PPVs) and combining symptoms codes for convulsions (ICD-10, R56; ICD-9, 780.3, 780.39) with ASMs could lead to high sensitivity.5 However, identifying individuals with epilepsy from administrative data in large managed health care organizations is challenging.6 The IOM report noted that large managed health care organizations presented varying incidence and prevalence estimates due to differing methodology, geographic area, demographics, and definitions of epilepsy.
The Veterans Health Administration (VHA) is the largest integrated US health care system, providing care to > 9.1 million veterans.7 To improve the health and well-being of veterans with epilepsy (VWEs), a network of sites was established in 2008 called the US Department of Veterans Affairs (VA) Epilepsy Centers of Excellence (ECoE). Subsequent to the creation of the ECoE, efforts were made to identify VWEs within VHA databases.8,9 Prior to fiscal year (FY) 2016, the ECoE adopted a modified version of a well-established epilepsy diagnostic algorithm developed by Holden et al for large managed care organizations.10 The original algorithm identified patients by cross-matching ASMs with ICD-9 codes for an index year. But it failed to capture a considerable number of stable patients with epilepsy in the VHA due to incomplete documentation, and had false positives due to inclusion of patients identified from diagnostic clinics. The modified algorithm the ECoE used prior to FY 2016 considered additional prior years and excluded encounters from diagnostic clinics. The result was an improvement in the sensitivity and specificity of the algorithm. Researchers evaluating 500 patients with epilepsy estimated that the modified algorithm had a PPV of 82.0% (95% CI, 78.6%-85.4%).11
After implementation of ICD-10 codes in the VHA in FY 2016, the task of reliably and efficiently identifying VWE led to a 3-tier algorithm. This article presents a validation of the different tiers of this algorithm after the implementation of ICD-10 diagnosis codes and summarizes the surveillance data collected over the years within the VHA showing the trends of epilepsy.
Methods
The VHA National Neurology office commissioned a Neurology Cube dashboard in FY 2021 in collaboration with VHA Support Service Center (VSSC) for reporting and surveillance of VWEs as a quality improvement initiative. The Neurology Cube uses a 3-tier system for identifying VWE in the VHA databases. VSSC programmers extract data from the VHA Corporate Data Warehouse (CDW) and utilize Microsoft SQL Server and Microsoft Power BI for Neurology Cube reports. The 3-tier system identifies VWE and divides them into distinct groups. The first tier identifies VWE with the highest degree of confidence; Tiers 2 and 3 represent identification with successively lesser degrees of confidence (Figure 1).
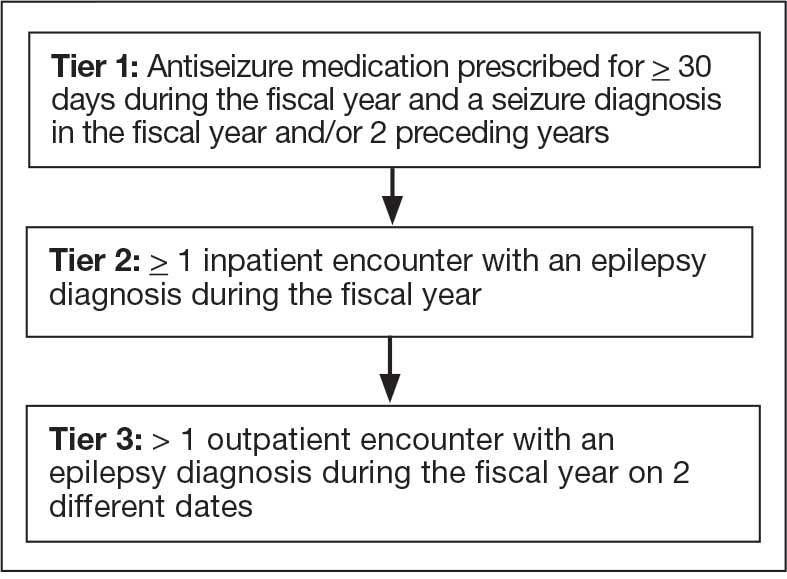
Tier 1
Definition. For a given index year and the preceding 2 years, any of following diagnosis codes on ≥ 1 clinical encounter are considered: 345.xx (epilepsy in ICD-9), 780.3x (other convulsions in ICD-9), G40.xxx (epilepsy in ICD-10), R40.4 (transient alteration of awareness), R56.1 (posttraumatic seizures), or R56.9 (unspecified convulsions). To reduce false positive rates, EEG clinic visits, which may include long-term monitoring, are excluded. Patients identified with ICD codes are then evaluated for an ASM prescription for ≥ 30 days during the index year. ASMs are listed in Appendix 1.
Validation. The development and validation of ICD-9 diagnosis codes crossmatched with an ASM prescription in the VHA has been published elsewhere.11 In FY 2017, after implementation of ICD-10 diagnostic codes, Tier 1 development and validation was performed in 2 phases. Even though Tier 1 study phases were conducted and completed during FY 2017, the patients for Tier 1 were identified from evaluation of FY 2016 data (October 1, 2015, to September 30, 2016). After the pilot analysis, the Tier 1 definition was implemented, and a chart review of 625 randomized patients was conducted at 5 sites for validation. Adequate preliminary data was not available to perform a sample size estimation for this study. Therefore, a practical target of 125 patients was set for Tier 1 from each site to obtain a final sample size of 625 patients. This second phase validated that the crossmatch of ICD-10 diagnosis codes with ASMs had a high PPV for identifying VWE.
Tiers 2 and 3
Definitions. For an index year, Tier 2 includes patients with ≥ 1 inpatient encounter documentation of either ICD-9 345.xx or ICD-10 G40.xxx, excluding EEG clinics. Tier 3 Includes patients who have had ≥ 2 outpatient encounters with diagnosis codes 345.xx or G40.xxx on 2 separate days, excluding EEG clinics. Tiers 2 and 3 do not require ASM prescriptions; this helps to identify VWEs who may be getting their medications outside of VHA or those who have received a new diagnosis.
Validations. Tiers 2 and 3 were included in the epilepsy identification algorithm in FY 2021 after validation was performed on a sample of 8 patients in each tier. Five patients were subsequently identified as having epilepsy in Tier 2 and 6 patients were identified in Tier 3. A more comprehensive validation of Tiers 2 and 3 was performed during FY 2022 that included patients at 5 sites seen during FY 2019 to FY 2022. Since yearly trends showed only about 8% of total patients were identified as having epilepsy through Tiers 2 and 3 we sought ≥ 20 patients per tier for the 5 sites for a total of 200 patients to ensure representation across the VHA. The final count was 126 patients for Tier 2 and 174 patients for Tier 3 (n = 300).
Gold Standard Criteria for Epilepsy Diagnosis
We used the International League Against Epilepsy (ILAE) definition of epilepsy for the validation of the 3 algorithm tiers. ILAE defines epilepsy as ≥ 2 unprovoked (or reflex) seizures occurring > 24 hours apart or 1 unprovoked (or reflex) seizure and a probability of further seizures similar to the general recurrence risk (≥ 60%) after 2 unprovoked seizures, occurring over the next 10 years.12
A standard protocol was provided to evaluators to identify patients using the VHA Computerized Patient Record System (Appendix 1). After review, evaluators categorized each patient in 1 of 4 ways: (1) Yes, definite: The patient’s health care practitioner (HCP) believes the patient has epilepsy and is treating with medication; (2) Yes, uncertain: The HCP has enough suspicion of epilepsy that a medication is prescribed, but uncertainty is expressed of the diagnosis; (3) No, definite: The HCP does not believe the patient has epilepsy and is therefore not treating with medication for seizure; (4) No, uncertain: The HCP is not treating with medication for epilepsy, because the diagnostic suspicion is not high enough, but there is suspicion for epilepsy.
As a quality improvement operational project, the Epilepsy National Program Office approved this validation project and determined that institutional review board approval was not required.
Statistical Analysis
Counts and percentages were computed for categories of epilepsy status. PPV of each tier was estimated with asymptotic 95% CIs.
Results
ICD-10 codes for 480 patients were evaluated in Tier 1 phase 1; 13.8% were documented with G40.xxx, 27.9% with R56.1, 34.4% with R56.9, and 24.0% with R40.4 (Appendix 2). In total, 68.1% fulfilled the criteria of epilepsy, 19.2% did not, and 12.7% were uncertain). From the validation of Tier 1 phase 2 (n = 625), the PPV of the algorithm for patients presumed to have epilepsy (definite and uncertain) was 85.1% (95% CI, 82.1%-87.8%) (Table).
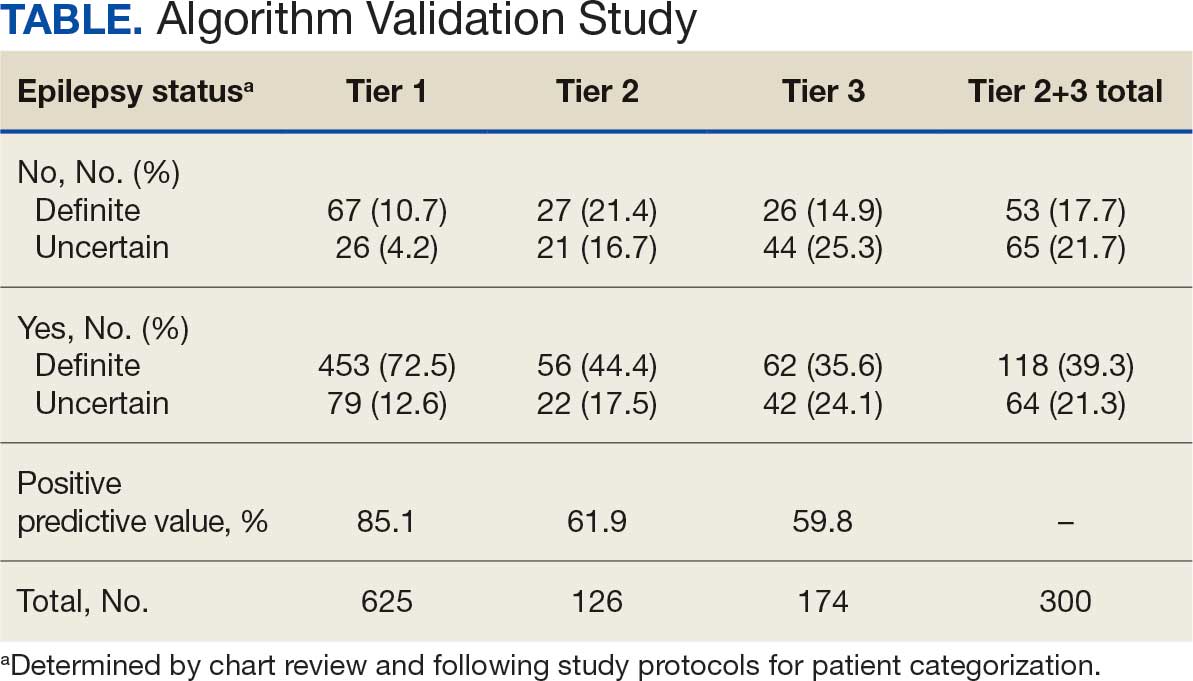
Of 300 patients evaluated, 126 (42.0%) were evaluated for Tier 2 with a PPV of 61.9% (95% CI, 53.4%-70.4%), and 174 (58.0%) patients were evaluated for Tier 3 with a PPV of 59.8% (95% CI, 52.5%-67.1%. The PPV of the algorithm for patients presumed to have epilepsy (definite and uncertain) were combined to calculate the PPV. Estimates of VHA VWE counts were computed for each tier from FY 2014 to FY 2023 using the VSSC Neurology Cube (Figure 2). For all years, > 92% patients were classified using the Tier 1 definition.
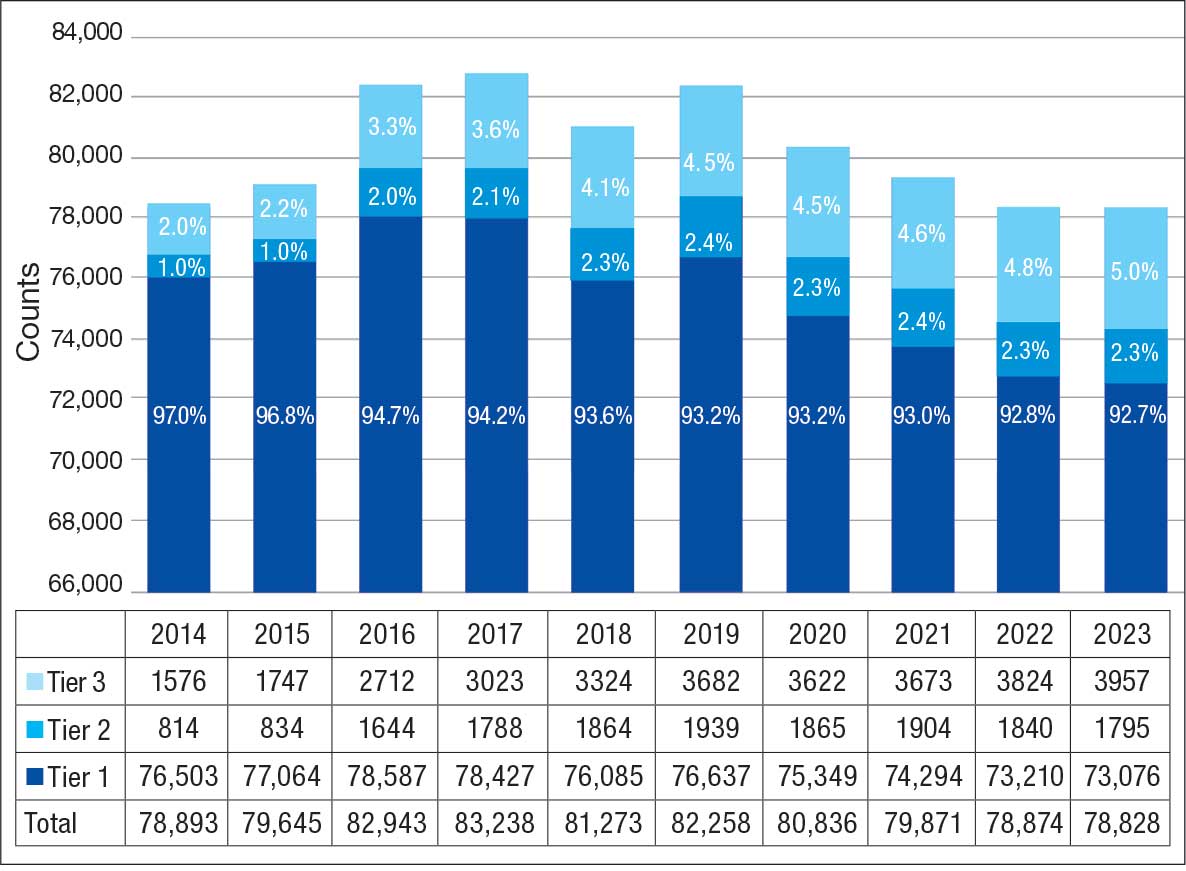
Discussion
The development and validation of the 3-tier diagnostic algorithm represents an important advancement in the surveillance and management of epilepsy among veterans within the VHA. The validation of this algorithm also demonstrates its practical utility in a large, integrated health care system.
Specific challenges were encountered when attempting to use pre-existing algorithms; these challenges included differences in the usage patterns of diagnostic codes and the patterns of ASM use within the VHA. These challenges prompted the need for a tailored approach, which led to the development of this algorithm. The inclusion of additional ICD-10 codes led to further revisions and subsequent validation. While many of the basic concepts of the algorithm, including ICD codes and ASMs, could work in other institutions, it would be wise for health care organizations to develop their own algorithms because of certain variables, including organizational size, patient demographics, common comorbidities, and the specific configurations of electronic health records and administrative data systems.
Studies have shown that ICD-10 codes for epilepsy (G40.* and/or R56.9) perform well in identifying epilepsy whether they are assigned by neurologists (sensitivity, 97.7%; specificity, 44.1%; PPV, 96.2%; negative predictive value, 57.7%), or in emergency department or hospital discharges (PPV, 75.5%).13,14 The pilot study of the algorithm’s Tier 1 development (phase 1) evaluated whether the selected ICD-10 diagnostic codes accurately included the VWE population within the VHA and revealed that while most codes (eg, epilepsy [G40.xxx]; posttraumatic seizures [R56.1]; and unspecified convulsions [R56.9]), had a low false positive rate (< 16%), the R40.4 code (transient alteration of awareness) had a higher false positivity of 42%. While this is not surprising given the broad spectrum of conditions that can manifest as transient alteration of awareness, it underscores the inherent challenges in diagnosing epilepsy using diagnosis codes.
In phase 2, the Tier 1 algorithm was validated as effective for identifying VWE in the VHA system, as its PPV was determined to be high (85%). In comparison, Tiers 2 and 3, whose criteria did not require data on VHA prescribed ASM use, had lower tiers of epilepsy predictability (PPV about 60% for both). This was thought to be acceptable because Tiers 2 and 3 represent a smaller population of the identified VWEs (about 8%). These VWEs may otherwise have been missed, partly because veterans are not required to get ASMs from the VHA.
Upon VHA implementation in FY 2021, this diagnostic algorithm exhibited significant clinical utility when integrated within the VSSC Neurology Cube. It facilitated an efficient approach to identifying VWEs using readily available databases. This led to better tracking of real-time epilepsy cases, which facilitated improving current resource allocation and targeted intervention strategies such as identification of drug-resistant epilepsy patients, optimizing strategies for telehealth and patient outreach for awareness of epilepsy care resources within VHA. Meanwhile, data acquired by the algorithm over the decade since its development (FY 2014 to FY 2023) contributed to more accurate epidemiologic information and identification of historic trends. Development of the algorithm represents one of the ways ECoEs have led to improved care for VWEs. ECoEs have been shown to improve health care for veterans in several metrics.15
A strength of this study is the rigorous multitiered validation process to confirm the diagnostic accuracy of ICD-10 codes against the gold standard ILAE definition of epilepsy to identify “definite” epilepsy cases within the VHA. The use of specific ICD codes further enhances the precision of epilepsy diagnoses. The inclusion of ASMs, which are sometimes prescribed for conditions other than epilepsy, could potentially inflate false positive rates.16
This study focused exclusively on the identification and validation of definite epilepsy cases within the VHA VSSC database, employing more stringent diagnostic criteria to ensure the highest level of certainty in ascertaining epilepsy. It is important to note there is a separate category of probable epilepsy, which involves a broader set of diagnostic criteria. While not covered in this study, probable epilepsy would be subject to future research and validation, which could provide insights into a wider spectrum of epilepsy diagnoses. Such future research could help refine the algorithm’s applicability and accuracy and potentially lead to more comprehensive surveillance and management strategies in clinical practice.
This study highlights the inherent challenges in leveraging administrative data for disease identification, particularly for conditions such as epilepsy, where diagnostic clarity can be complex. However, other conditions such as multiple sclerosis have noted similar success with the use of VHA administrative data for categorizing disease.17
Limitations
The algorithm discussed in this article is, in and of itself, generalizable. However, the validation process was unique to the VHA patient population, limiting the generalizability of the findings. Documentation practices and HCP attitudes within the VHA may differ from those in other health care settings. Identifying people with epilepsy can be challenging because of changing definitions of epilepsy over time. In addition to clinical evaluation, EEG and magnetic resonance imaging results, response to ASM treatment, and video-EEG monitoring of habitual events all can help establish the diagnosis. Therefore, studies may vary in how inclusive or exclusive the criteria are. ASMs such as gabapentin, pregabalin, carbamazepine, lamotrigine, topiramate, and valproate are used to treat other conditions, including headaches, generalized pain, and mood disorders. Consequently, including these ASMs in the Tier 1 definition may have increased the false positive rate. Additional research is needed to evaluate whether excluding these ASMs from the algorithm based on specific criteria (eg, dose of ASM used) can further refine the algorithm to identify patients with epilepsy.
Further refinement of this algorithm may also occur as technology changes. Future electronic health records may allow better tracking of different epilepsy factors, the integration of additional diagnostic criteria, and the use of natural language processing or other forms of artificial intelligence.
Conclusions
This study presents a significant step forward in epilepsy surveillance within the VHA. The algorithm offers a robust tool for identifying VWEs with good PPVs, facilitating better resource allocation and targeted care. Despite its limitations, this research lays a foundation for future advancements in the management and understanding of epilepsy within large health care systems. Since this VHA algorithm is based on ASMs and ICD diagnosis codes from patient records, other large managed health care systems also may be able to adapt this algorithm to their data specifications.
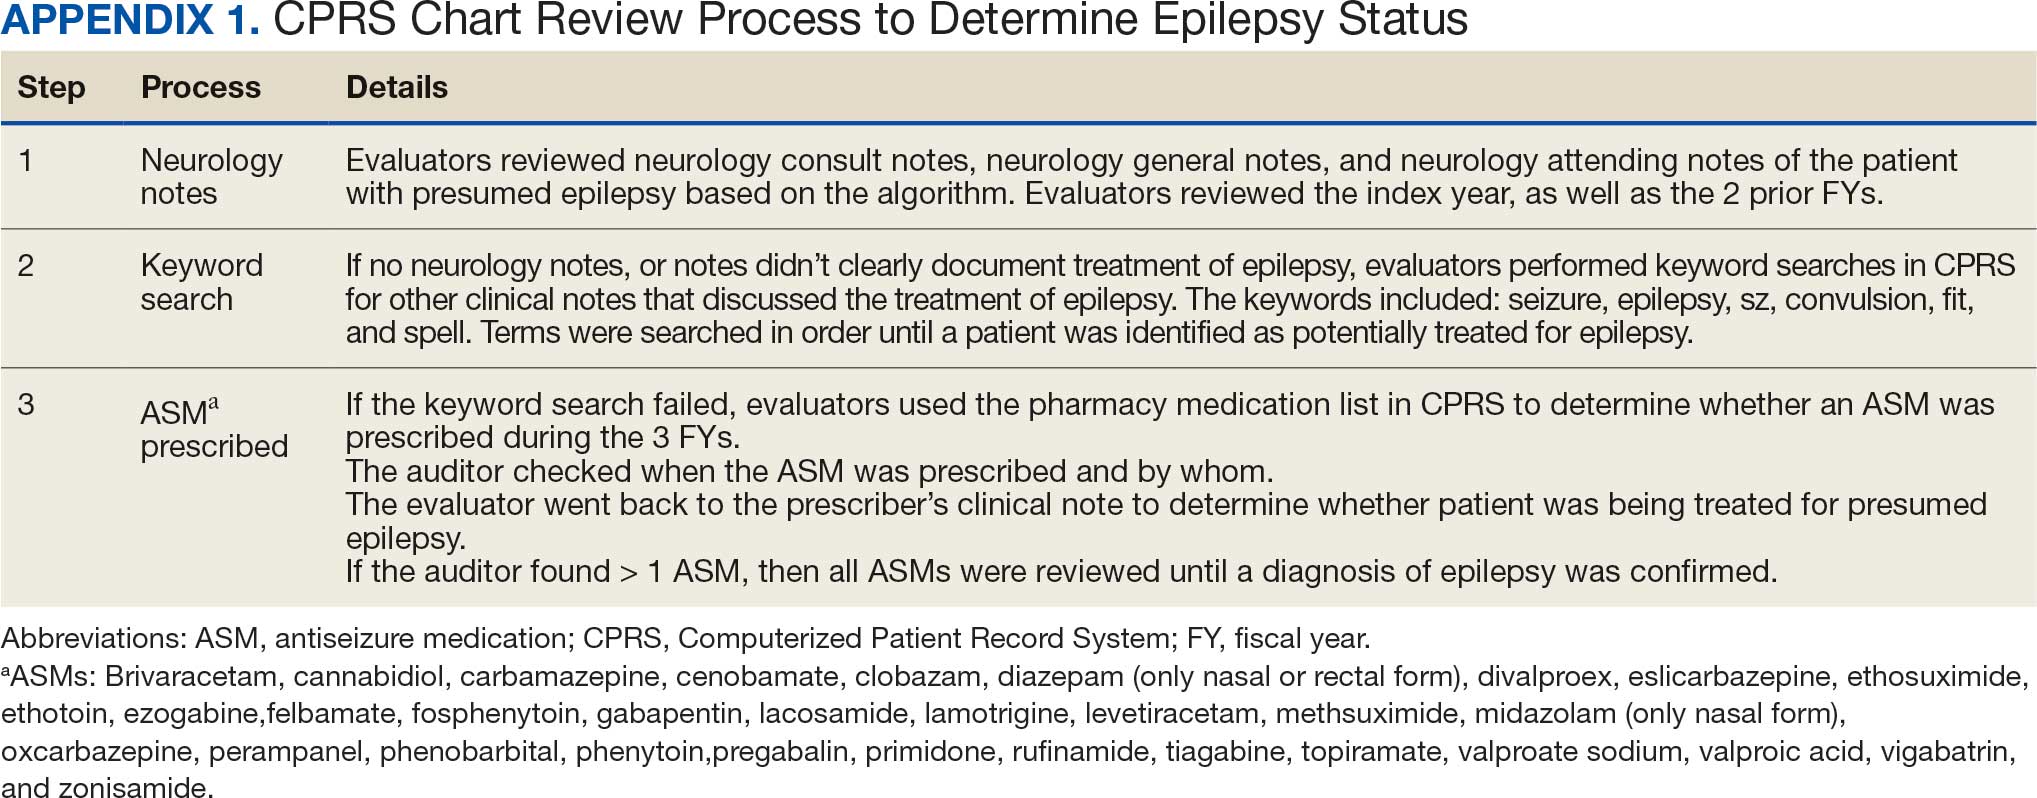
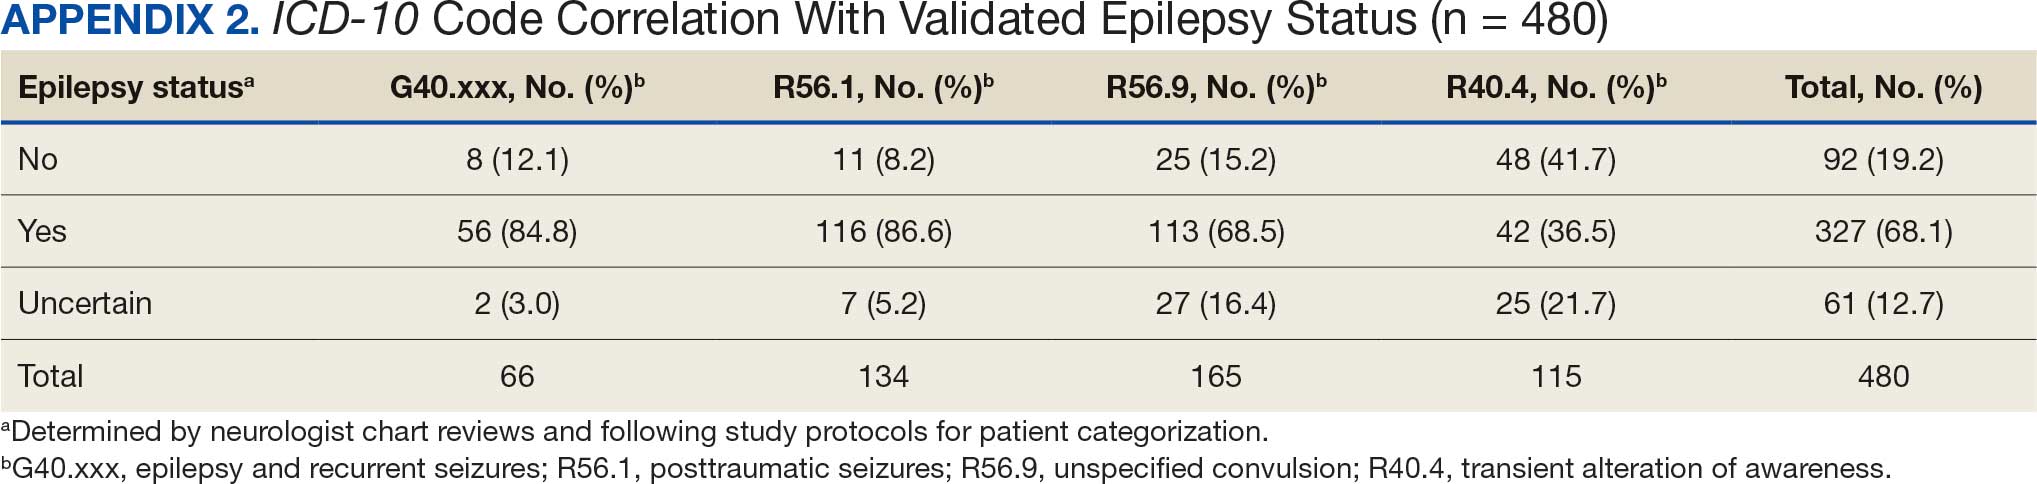
- Kobau R, Luncheon C, Greenlund K. Active epilepsy prevalence among U.S. adults is 1.1% and differs by educational level-National Health Interview Survey, United States, 2021. Epilepsy Behav. 2023;142:109180. doi:10.1016/j.yebeh.2023.109180
- GBD 2017 US Neurological Disorders Collaborators, Feigin VL, Vos T, et al. Burden of neurological disorders across the US from 1990-2017: a global burden of disease study. JAMA Neurol. 2021;78:165-176. doi:10.1001/jamaneurol.2020.4152
- Moura LMVR, Karakis I, Zack MM, et al. Drivers of US health care spending for persons with seizures and/or epilepsies, 2010-2018. Epilepsia. 2022;63:2144-2154. doi:10.1111/epi.17305
- Institute of Medicine. Epilepsy Across the Spectrum: Promoting Health and Understanding. The National Academies Press; 2012. Accessed November 11, 2025. www.nap.edu/catalog/13379
- Mbizvo GK, Bennett KH, Schnier C, Simpson CR, Duncan SE, Chin RFM. The accuracy of using administrative healthcare data to identify epilepsy cases: A systematic review of validation studies. Epilepsia. 2020;61:1319-1335. doi:10.1111/epi.16547
- Montouris GD. How will primary care physicians, specialists, and managed care treat epilepsy in the new millennium? Neurology. 2000;55:S42-S44.
- US Department of Veterans Affairs. Veterans Health Administration: About VHA. Accessed November 11, 2025. https://www.va.gov/health/aboutvha.asp
- Veterans’ Mental Health and Other Care Improvements Act of 2008, S 2162, 110th Cong (2008). Accessed November 11, 2025. https://www.congress.gov/bill/110th-congress/senate-bill/2162
- Rehman R, Kelly PR, Husain AM, Tran TT. Characteristics of Veterans diagnosed with seizures within Veterans Health Administration. J Rehabil Res Dev. 2015;52(7):751-762. doi:10.1682/JRRD.2014.10.0241
- Holden EW, Grossman E, Nguyen HT, et al. Developing a computer algorithm to identify epilepsy cases in managed care organizations. Dis Manag. 2005;8:1-14. doi:10.1089/dis.2005.8.1
- Rehman R, Everhart A, Frontera AT, et al. Implementation of an established algorithm and modifications for the identification of epilepsy patients in the Veterans Health Administration. Epilepsy Res. 2016;127:284-290. doi:10.1016/j.eplepsyres.2016.09.012
- Fisher RS, Acevedo C, Arzimanoglou A, et al. ILAE official report: a practical clinical definition of epilepsy. Epilepsia. 2014;55:475-482. doi:10.1111/epi.12550
- Smith JR, Jones FJS, Fureman BE, et al. Accuracy of ICD-10-CM claims-based definitions for epilepsy and seizure type. Epilepsy Res. 2020;166:106414. doi:10.1016/j.eplepsyres.2020.106414
- Jetté N, Reid AY, Quan H, et al. How accurate is ICD coding for epilepsy? Epilepsia. 2010;51:62-69. doi:10.1111/j.1528-1167.2009.02201.x
- Kelly P, Chinta R, Privitera G. Do centers of excellence reduce health care costs? Evidence from the US Veterans Health Administration Centers for Epilepsy. Glob Bus Organ Excell. 2015;34:18-29.
- Haneef Z, Rehman R, Husain AM. Association between standardized mortality ratio and utilization of care in US veterans with drug-resistant epilepsy compared with all US veterans and the US general population. JAMA Neurol. 2022;79:879-887. doi:10.1001/jamaneurol.2022.2290
- Culpepper WJ, Marrie RA, Langer-Gould A, et al. Validation of an algorithm for identifying MS cases in administrative health claims datasets. Neurology. 2019;92:e1016-e1028 doi:10.1212/WNL.0000000000007043
Epilepsy affects about 4.5 million people in the United States and 150,000 new individuals are diagnosed each year.1,2 In 2019, epilepsy-attributable health care spending for noninstitutionalized people was around $5.4 billion and total epilepsy-attributable and epilepsy or seizure health care-related costs totaled $54 billion.3
Accurate surveillance of epilepsy in large health care systems can potentially improve health care delivery and resource allocation. A 2012 Institute of Medicine (IOM) report identified 13 recommendations to guide public health action on epilepsy, including validation of standard definitions for case ascertainment, identification of epilepsy through screening programs or protocols, and expansion of surveillance to better understand disease burden.4
A systematic review of validation studies concluded that it is reasonable to use administrative data to identify people with epilepsy in epidemiologic research. Combining The International Classification of Diseases (ICD) codes for epilepsy (ICD-10, G40-41; ICD-9, 345) with antiseizure medications (ASMs) could provide high positive predictive values (PPVs) and combining symptoms codes for convulsions (ICD-10, R56; ICD-9, 780.3, 780.39) with ASMs could lead to high sensitivity.5 However, identifying individuals with epilepsy from administrative data in large managed health care organizations is challenging.6 The IOM report noted that large managed health care organizations presented varying incidence and prevalence estimates due to differing methodology, geographic area, demographics, and definitions of epilepsy.
The Veterans Health Administration (VHA) is the largest integrated US health care system, providing care to > 9.1 million veterans.7 To improve the health and well-being of veterans with epilepsy (VWEs), a network of sites was established in 2008 called the US Department of Veterans Affairs (VA) Epilepsy Centers of Excellence (ECoE). Subsequent to the creation of the ECoE, efforts were made to identify VWEs within VHA databases.8,9 Prior to fiscal year (FY) 2016, the ECoE adopted a modified version of a well-established epilepsy diagnostic algorithm developed by Holden et al for large managed care organizations.10 The original algorithm identified patients by cross-matching ASMs with ICD-9 codes for an index year. But it failed to capture a considerable number of stable patients with epilepsy in the VHA due to incomplete documentation, and had false positives due to inclusion of patients identified from diagnostic clinics. The modified algorithm the ECoE used prior to FY 2016 considered additional prior years and excluded encounters from diagnostic clinics. The result was an improvement in the sensitivity and specificity of the algorithm. Researchers evaluating 500 patients with epilepsy estimated that the modified algorithm had a PPV of 82.0% (95% CI, 78.6%-85.4%).11
After implementation of ICD-10 codes in the VHA in FY 2016, the task of reliably and efficiently identifying VWE led to a 3-tier algorithm. This article presents a validation of the different tiers of this algorithm after the implementation of ICD-10 diagnosis codes and summarizes the surveillance data collected over the years within the VHA showing the trends of epilepsy.
Methods
The VHA National Neurology office commissioned a Neurology Cube dashboard in FY 2021 in collaboration with VHA Support Service Center (VSSC) for reporting and surveillance of VWEs as a quality improvement initiative. The Neurology Cube uses a 3-tier system for identifying VWE in the VHA databases. VSSC programmers extract data from the VHA Corporate Data Warehouse (CDW) and utilize Microsoft SQL Server and Microsoft Power BI for Neurology Cube reports. The 3-tier system identifies VWE and divides them into distinct groups. The first tier identifies VWE with the highest degree of confidence; Tiers 2 and 3 represent identification with successively lesser degrees of confidence (Figure 1).
Tier 1
Definition. For a given index year and the preceding 2 years, any of following diagnosis codes on ≥ 1 clinical encounter are considered: 345.xx (epilepsy in ICD-9), 780.3x (other convulsions in ICD-9), G40.xxx (epilepsy in ICD-10), R40.4 (transient alteration of awareness), R56.1 (posttraumatic seizures), or R56.9 (unspecified convulsions). To reduce false positive rates, EEG clinic visits, which may include long-term monitoring, are excluded. Patients identified with ICD codes are then evaluated for an ASM prescription for ≥ 30 days during the index year. ASMs are listed in Appendix 1.
Validation. The development and validation of ICD-9 diagnosis codes crossmatched with an ASM prescription in the VHA has been published elsewhere.11 In FY 2017, after implementation of ICD-10 diagnostic codes, Tier 1 development and validation was performed in 2 phases. Even though Tier 1 study phases were conducted and completed during FY 2017, the patients for Tier 1 were identified from evaluation of FY 2016 data (October 1, 2015, to September 30, 2016). After the pilot analysis, the Tier 1 definition was implemented, and a chart review of 625 randomized patients was conducted at 5 sites for validation. Adequate preliminary data was not available to perform a sample size estimation for this study. Therefore, a practical target of 125 patients was set for Tier 1 from each site to obtain a final sample size of 625 patients. This second phase validated that the crossmatch of ICD-10 diagnosis codes with ASMs had a high PPV for identifying VWE.
Tiers 2 and 3
Definitions. For an index year, Tier 2 includes patients with ≥ 1 inpatient encounter documentation of either ICD-9 345.xx or ICD-10 G40.xxx, excluding EEG clinics. Tier 3 Includes patients who have had ≥ 2 outpatient encounters with diagnosis codes 345.xx or G40.xxx on 2 separate days, excluding EEG clinics. Tiers 2 and 3 do not require ASM prescriptions; this helps to identify VWEs who may be getting their medications outside of VHA or those who have received a new diagnosis.
Validations. Tiers 2 and 3 were included in the epilepsy identification algorithm in FY 2021 after validation was performed on a sample of 8 patients in each tier. Five patients were subsequently identified as having epilepsy in Tier 2 and 6 patients were identified in Tier 3. A more comprehensive validation of Tiers 2 and 3 was performed during FY 2022 that included patients at 5 sites seen during FY 2019 to FY 2022. Since yearly trends showed only about 8% of total patients were identified as having epilepsy through Tiers 2 and 3 we sought ≥ 20 patients per tier for the 5 sites for a total of 200 patients to ensure representation across the VHA. The final count was 126 patients for Tier 2 and 174 patients for Tier 3 (n = 300).
Gold Standard Criteria for Epilepsy Diagnosis
We used the International League Against Epilepsy (ILAE) definition of epilepsy for the validation of the 3 algorithm tiers. ILAE defines epilepsy as ≥ 2 unprovoked (or reflex) seizures occurring > 24 hours apart or 1 unprovoked (or reflex) seizure and a probability of further seizures similar to the general recurrence risk (≥ 60%) after 2 unprovoked seizures, occurring over the next 10 years.12
A standard protocol was provided to evaluators to identify patients using the VHA Computerized Patient Record System (Appendix 1). After review, evaluators categorized each patient in 1 of 4 ways: (1) Yes, definite: The patient’s health care practitioner (HCP) believes the patient has epilepsy and is treating with medication; (2) Yes, uncertain: The HCP has enough suspicion of epilepsy that a medication is prescribed, but uncertainty is expressed of the diagnosis; (3) No, definite: The HCP does not believe the patient has epilepsy and is therefore not treating with medication for seizure; (4) No, uncertain: The HCP is not treating with medication for epilepsy, because the diagnostic suspicion is not high enough, but there is suspicion for epilepsy.
As a quality improvement operational project, the Epilepsy National Program Office approved this validation project and determined that institutional review board approval was not required.
Statistical Analysis
Counts and percentages were computed for categories of epilepsy status. PPV of each tier was estimated with asymptotic 95% CIs.
Results
ICD-10 codes for 480 patients were evaluated in Tier 1 phase 1; 13.8% were documented with G40.xxx, 27.9% with R56.1, 34.4% with R56.9, and 24.0% with R40.4 (Appendix 2). In total, 68.1% fulfilled the criteria of epilepsy, 19.2% did not, and 12.7% were uncertain). From the validation of Tier 1 phase 2 (n = 625), the PPV of the algorithm for patients presumed to have epilepsy (definite and uncertain) was 85.1% (95% CI, 82.1%-87.8%) (Table).
Of 300 patients evaluated, 126 (42.0%) were evaluated for Tier 2 with a PPV of 61.9% (95% CI, 53.4%-70.4%), and 174 (58.0%) patients were evaluated for Tier 3 with a PPV of 59.8% (95% CI, 52.5%-67.1%. The PPV of the algorithm for patients presumed to have epilepsy (definite and uncertain) were combined to calculate the PPV. Estimates of VHA VWE counts were computed for each tier from FY 2014 to FY 2023 using the VSSC Neurology Cube (Figure 2). For all years, > 92% patients were classified using the Tier 1 definition.
Discussion
The development and validation of the 3-tier diagnostic algorithm represents an important advancement in the surveillance and management of epilepsy among veterans within the VHA. The validation of this algorithm also demonstrates its practical utility in a large, integrated health care system.
Specific challenges were encountered when attempting to use pre-existing algorithms; these challenges included differences in the usage patterns of diagnostic codes and the patterns of ASM use within the VHA. These challenges prompted the need for a tailored approach, which led to the development of this algorithm. The inclusion of additional ICD-10 codes led to further revisions and subsequent validation. While many of the basic concepts of the algorithm, including ICD codes and ASMs, could work in other institutions, it would be wise for health care organizations to develop their own algorithms because of certain variables, including organizational size, patient demographics, common comorbidities, and the specific configurations of electronic health records and administrative data systems.
Studies have shown that ICD-10 codes for epilepsy (G40.* and/or R56.9) perform well in identifying epilepsy whether they are assigned by neurologists (sensitivity, 97.7%; specificity, 44.1%; PPV, 96.2%; negative predictive value, 57.7%), or in emergency department or hospital discharges (PPV, 75.5%).13,14 The pilot study of the algorithm’s Tier 1 development (phase 1) evaluated whether the selected ICD-10 diagnostic codes accurately included the VWE population within the VHA and revealed that while most codes (eg, epilepsy [G40.xxx]; posttraumatic seizures [R56.1]; and unspecified convulsions [R56.9]), had a low false positive rate (< 16%), the R40.4 code (transient alteration of awareness) had a higher false positivity of 42%. While this is not surprising given the broad spectrum of conditions that can manifest as transient alteration of awareness, it underscores the inherent challenges in diagnosing epilepsy using diagnosis codes.
In phase 2, the Tier 1 algorithm was validated as effective for identifying VWE in the VHA system, as its PPV was determined to be high (85%). In comparison, Tiers 2 and 3, whose criteria did not require data on VHA prescribed ASM use, had lower tiers of epilepsy predictability (PPV about 60% for both). This was thought to be acceptable because Tiers 2 and 3 represent a smaller population of the identified VWEs (about 8%). These VWEs may otherwise have been missed, partly because veterans are not required to get ASMs from the VHA.
Upon VHA implementation in FY 2021, this diagnostic algorithm exhibited significant clinical utility when integrated within the VSSC Neurology Cube. It facilitated an efficient approach to identifying VWEs using readily available databases. This led to better tracking of real-time epilepsy cases, which facilitated improving current resource allocation and targeted intervention strategies such as identification of drug-resistant epilepsy patients, optimizing strategies for telehealth and patient outreach for awareness of epilepsy care resources within VHA. Meanwhile, data acquired by the algorithm over the decade since its development (FY 2014 to FY 2023) contributed to more accurate epidemiologic information and identification of historic trends. Development of the algorithm represents one of the ways ECoEs have led to improved care for VWEs. ECoEs have been shown to improve health care for veterans in several metrics.15
A strength of this study is the rigorous multitiered validation process to confirm the diagnostic accuracy of ICD-10 codes against the gold standard ILAE definition of epilepsy to identify “definite” epilepsy cases within the VHA. The use of specific ICD codes further enhances the precision of epilepsy diagnoses. The inclusion of ASMs, which are sometimes prescribed for conditions other than epilepsy, could potentially inflate false positive rates.16
This study focused exclusively on the identification and validation of definite epilepsy cases within the VHA VSSC database, employing more stringent diagnostic criteria to ensure the highest level of certainty in ascertaining epilepsy. It is important to note there is a separate category of probable epilepsy, which involves a broader set of diagnostic criteria. While not covered in this study, probable epilepsy would be subject to future research and validation, which could provide insights into a wider spectrum of epilepsy diagnoses. Such future research could help refine the algorithm’s applicability and accuracy and potentially lead to more comprehensive surveillance and management strategies in clinical practice.
This study highlights the inherent challenges in leveraging administrative data for disease identification, particularly for conditions such as epilepsy, where diagnostic clarity can be complex. However, other conditions such as multiple sclerosis have noted similar success with the use of VHA administrative data for categorizing disease.17
Limitations
The algorithm discussed in this article is, in and of itself, generalizable. However, the validation process was unique to the VHA patient population, limiting the generalizability of the findings. Documentation practices and HCP attitudes within the VHA may differ from those in other health care settings. Identifying people with epilepsy can be challenging because of changing definitions of epilepsy over time. In addition to clinical evaluation, EEG and magnetic resonance imaging results, response to ASM treatment, and video-EEG monitoring of habitual events all can help establish the diagnosis. Therefore, studies may vary in how inclusive or exclusive the criteria are. ASMs such as gabapentin, pregabalin, carbamazepine, lamotrigine, topiramate, and valproate are used to treat other conditions, including headaches, generalized pain, and mood disorders. Consequently, including these ASMs in the Tier 1 definition may have increased the false positive rate. Additional research is needed to evaluate whether excluding these ASMs from the algorithm based on specific criteria (eg, dose of ASM used) can further refine the algorithm to identify patients with epilepsy.
Further refinement of this algorithm may also occur as technology changes. Future electronic health records may allow better tracking of different epilepsy factors, the integration of additional diagnostic criteria, and the use of natural language processing or other forms of artificial intelligence.
Conclusions
This study presents a significant step forward in epilepsy surveillance within the VHA. The algorithm offers a robust tool for identifying VWEs with good PPVs, facilitating better resource allocation and targeted care. Despite its limitations, this research lays a foundation for future advancements in the management and understanding of epilepsy within large health care systems. Since this VHA algorithm is based on ASMs and ICD diagnosis codes from patient records, other large managed health care systems also may be able to adapt this algorithm to their data specifications.
- Kobau R, Luncheon C, Greenlund K. Active epilepsy prevalence among U.S. adults is 1.1% and differs by educational level-National Health Interview Survey, United States, 2021. Epilepsy Behav. 2023;142:109180. doi:10.1016/j.yebeh.2023.109180
- GBD 2017 US Neurological Disorders Collaborators, Feigin VL, Vos T, et al. Burden of neurological disorders across the US from 1990-2017: a global burden of disease study. JAMA Neurol. 2021;78:165-176. doi:10.1001/jamaneurol.2020.4152
- Moura LMVR, Karakis I, Zack MM, et al. Drivers of US health care spending for persons with seizures and/or epilepsies, 2010-2018. Epilepsia. 2022;63:2144-2154. doi:10.1111/epi.17305
- Institute of Medicine. Epilepsy Across the Spectrum: Promoting Health and Understanding. The National Academies Press; 2012. Accessed November 11, 2025. www.nap.edu/catalog/13379
- Mbizvo GK, Bennett KH, Schnier C, Simpson CR, Duncan SE, Chin RFM. The accuracy of using administrative healthcare data to identify epilepsy cases: A systematic review of validation studies. Epilepsia. 2020;61:1319-1335. doi:10.1111/epi.16547
- Montouris GD. How will primary care physicians, specialists, and managed care treat epilepsy in the new millennium? Neurology. 2000;55:S42-S44.
- US Department of Veterans Affairs. Veterans Health Administration: About VHA. Accessed November 11, 2025. https://www.va.gov/health/aboutvha.asp
- Veterans’ Mental Health and Other Care Improvements Act of 2008, S 2162, 110th Cong (2008). Accessed November 11, 2025. https://www.congress.gov/bill/110th-congress/senate-bill/2162
- Rehman R, Kelly PR, Husain AM, Tran TT. Characteristics of Veterans diagnosed with seizures within Veterans Health Administration. J Rehabil Res Dev. 2015;52(7):751-762. doi:10.1682/JRRD.2014.10.0241
- Holden EW, Grossman E, Nguyen HT, et al. Developing a computer algorithm to identify epilepsy cases in managed care organizations. Dis Manag. 2005;8:1-14. doi:10.1089/dis.2005.8.1
- Rehman R, Everhart A, Frontera AT, et al. Implementation of an established algorithm and modifications for the identification of epilepsy patients in the Veterans Health Administration. Epilepsy Res. 2016;127:284-290. doi:10.1016/j.eplepsyres.2016.09.012
- Fisher RS, Acevedo C, Arzimanoglou A, et al. ILAE official report: a practical clinical definition of epilepsy. Epilepsia. 2014;55:475-482. doi:10.1111/epi.12550
- Smith JR, Jones FJS, Fureman BE, et al. Accuracy of ICD-10-CM claims-based definitions for epilepsy and seizure type. Epilepsy Res. 2020;166:106414. doi:10.1016/j.eplepsyres.2020.106414
- Jetté N, Reid AY, Quan H, et al. How accurate is ICD coding for epilepsy? Epilepsia. 2010;51:62-69. doi:10.1111/j.1528-1167.2009.02201.x
- Kelly P, Chinta R, Privitera G. Do centers of excellence reduce health care costs? Evidence from the US Veterans Health Administration Centers for Epilepsy. Glob Bus Organ Excell. 2015;34:18-29.
- Haneef Z, Rehman R, Husain AM. Association between standardized mortality ratio and utilization of care in US veterans with drug-resistant epilepsy compared with all US veterans and the US general population. JAMA Neurol. 2022;79:879-887. doi:10.1001/jamaneurol.2022.2290
- Culpepper WJ, Marrie RA, Langer-Gould A, et al. Validation of an algorithm for identifying MS cases in administrative health claims datasets. Neurology. 2019;92:e1016-e1028 doi:10.1212/WNL.0000000000007043
Development and Validation of an Administrative Algorithm to Identify Veterans With Epilepsy
Development and Validation of an Administrative Algorithm to Identify Veterans With Epilepsy

Effects of Lumbar Fusion and Dual-Mobility Liners on Dislocation Rates Following Total Hip Arthroplasty in a Veteran Population
Effects of Lumbar Fusion and Dual-Mobility Liners on Dislocation Rates Following Total Hip Arthroplasty in a Veteran Population
Total hip arthroplasty (THA) is among the most common elective orthopedic procedures performed annually in the United States, with an estimated 635,000 to 909,000 THAs expected each year by 2030.1 Consequently, complication rates and revision surgeries related to THA have been increasing, along with the financial burden on the health care system.2-4 Optimizing outcomes for patients undergoing THA and identifying risk factors for treatment failure have become areas of focus.
Over the last decade, there has been a renewed interest in the effect of previous lumbar spine fusion (LSF) surgery on THA outcomes. Studies have explored the rates of complications, postoperative mobility, and THA implant impingement.5-8 However, the outcome receiving the most attention in recent literature is the rate and effect of dislocation in patients with lumbar fusion surgery. Large Medicare database analyses have discovered an association with increased rates of dislocations in patients with lumbar fusion surgeries compared with those without.9,10 Prosthetic hip dislocation is an expensive complication of THA and is projected to have greater impact through 2035 due to a growing number of THA procedures.11 Identifying risk factors associated with hip dislocation is paramount to mitigating its effect on patients who have undergone THA.
Recent research has found increased rates of THA dislocation and revision surgery in patients with LSF, with some studies showing previous LSF as the strongest independent predictor.6-16 However, controversy surrounds this relationship, including the sequence of procedures (LSF before or after THA), the time between procedures, and involvement of the sacrum in LSF. One study found that patients had a 106% increased risk of dislocation when LSF was performed before THA compared with patients who underwent LSF 5 years after undergoing THA, while another study showed no significant difference in dislocations pre- vs post-LSF.16,17 An additional study showed no significant difference in the rate of dislocation in patients without sacral involvement in the LSF, while also showing significantly higher rates of dislocation in LSF with sacral involvement.12 The researchers also found a trend toward more dislocations in longer lumbosacral fusions. Recent studies have also examined dislocation rates with lumbar fusion in patients treated with dual-mobility liners.18-20 The consensus from these studies is that dual-mobility liners significantly decrease the rate of dislocation in primary THAs with lumbar fusion.
The present study sought to determine the rates of hip dislocations in a US Department of Veterans Affairs (VA) hospital setting. To the authors’ knowledge, no retrospective study focusing on THAs in the veteran population has been performed. This study benefits from controlling for various surgeon techniques and surgical preferences when compared to large Medicare database studies because the orthopedic surgeon (ABK) only performed the posterior approach for all patients during the study period.
The primary objective of this study was to determine whether the rates of hip dislocation would, in fact, be higher in patients with lumbar fusion surgery, as recent database studies suggest. Secondary objectives included determining whether patient characteristics, comorbidities, number of levels fused, or inclusion of the sacrum in the fusion construct influenced dislocation rates. Furthermore, VA Dayton Healthcare System (VADHS) began routine use of dual-mobility liners for lumbar fusion patients in 2018, allowing for examination of these patients.
Methods
The Wright State University and VADHS Institutional Review Board approved this study design. A retrospective review of all primary THAs at VADHS was performed to investigate the relationship between previous lumbar spine fusion and the incidence of THA revision. Manual chart review was performed for patients who underwent primary THA between January 2003, and December 2022. One surgeon performed all surgeries using only the posterior approach. Patients were not excluded if they had bilateral procedures and all eligible hips were included. Patients with a concomitant diagnosis of fracture of the femoral head or femoral neck at the time of surgery were excluded. Additionally, only patients with ≥ 12 months of follow-up data were included.
The primary outcome was dislocation within 12 months of THA; the primary independent variable was LSF prior to THA. Covariates included patient demographics (age, sex, body mass index [BMI]) and Charlson Comorbidity Index (CCI) score, with additional data collected on the number of levels fused, sacral spine involvement, revision rates, and use of dual-mobility liners. Year of surgery was also included in analyses to account for any changes that may have occurred during the study period.
Statistical Analysis
Statistical analyses were performed in SAS 9.4. Patients were grouped into 2 cohorts, depending on whether they had received LSF prior to THA. Analyses were adjusted for repeated measures to account for the small percentage of patients with bilateral procedures.
Univariate comparisons between cohorts for covariates, as well as rates of dislocation and revision, were performed using the independent samples t test for continuous variables and the Fisher exact test for dichotomous categorical variables. Significant comorbidities, as well as age, sex, BMI, liner type, LSF cohort, and surgery year, were included in a logistic regression model to determine what effect, if any, they had on the likelihood of dislocation. Variables were removed using a backward stepwise approach, starting with the nonsignificant variable effect with the lowest χ2 value, and continuing until reaching a final model where all remaining variable effects were significant. For the variables retained in the final model, odds ratios (ORs) with 95% CIs were derived, with dislocation designated as the event. Individual comorbidity subcomponents of the CCI were also analyzed for their effects on dislocation using backward stepwise logistic regression. A secondary analysis among patients with LSF tested for the influence of the number of vertebral levels fused, the presence or absence of sacral involvement in the fusion, and the use of dual-mobility liners on the likelihood of hip dislocation.
Results
The LSF cohort included 39 patients with THA and prior LSF, 3 of whom had bilateral procedures, for a total of 42 hips. The non-LSF cohort included 813 patients with THA, 112 of whom had bilateral procedures, for a total of 925 hips. The LSF and non-LSF cohorts did not differ significantly in age, sex, BMI, CCI, or revision rates (Table). The LSF cohort included a significantly higher percentage of hips receiving dual-mobility liners than did the non-LSF cohort (23.8% vs 0.6%; P < .001) and had more than twice the rate of dislocation (4 of 42 hips [9.5%] vs 35 of 925 hips [3.8%]), although this difference was not statistically significant (P = .08).
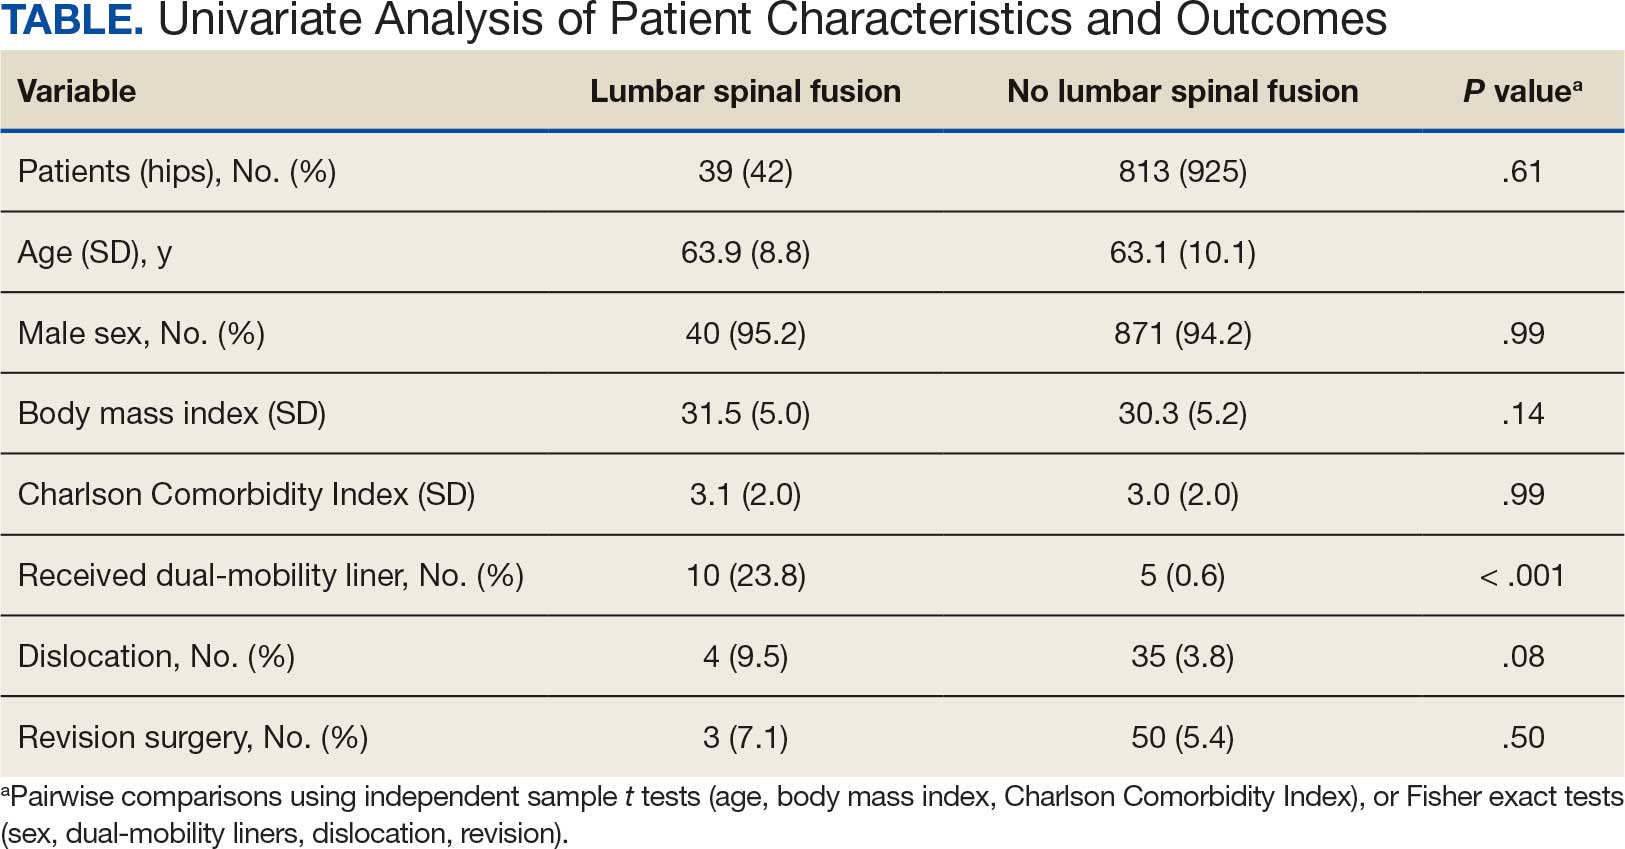
The final logistic regression model with dislocation as the outcome was statistically significant (χ2, 17.47; P < .001) and retained 2 significant predictor variables: LSF cohort (χ2, 4.63; P = .03), and sex (χ2, 18.27; P < .001). Females were more likely than males to experience dislocation (OR, 5.84; 95% CI, 2.60-13.13; P < .001) as were patients who had LSF prior to THA (OR, 3.42; 95% CI, 1.12-10.47; P = .03) (Figure). None of the CCI subcomponent comorbidities significantly affected the probability of dislocation (myocardial infarction, P = .46; congestive heart failure, P = .47; peripheral vascular disease, P = .97; stroke, P = .51; dementia, P = .99; chronic obstructive pulmonary disease, P = .95; connective tissue disease, P = .25; peptic ulcer, P = .41; liver disease, P = .30; diabetes, P = .06; hemiplegia, P = .99; chronic kidney disease, P = .82; solid tumor, P = .90; leukemia, P = .99; lymphoma, P = .99; AIDS, P = .99). Within the LSF cohort, neither the number of levels fused (P = .83) nor sacral involvement (P = .42), significantly affected the probability of hip dislocation. None of the patients in either cohort who received dual-mobility liners subsequently dislocated their hips, nor did any of them require revision surgery.
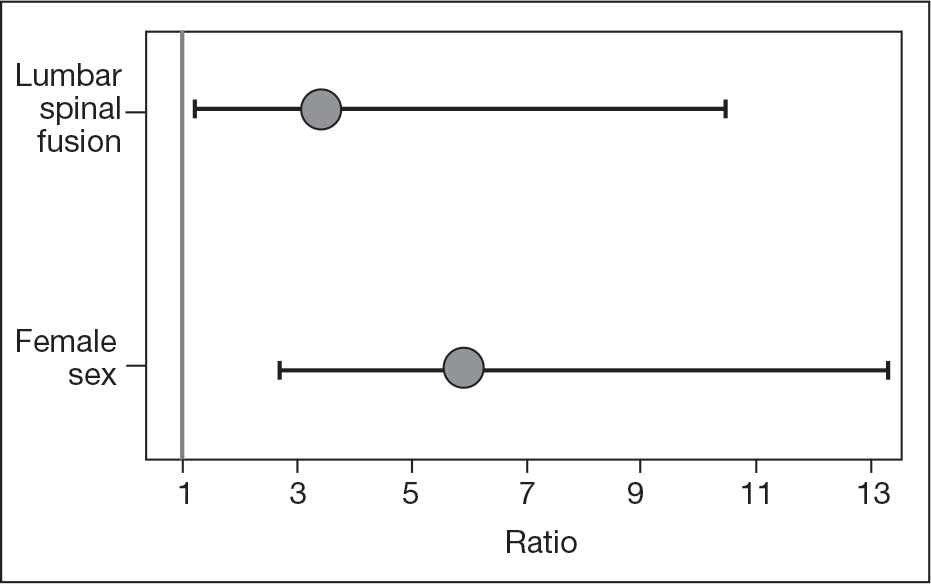
Discussion
Spinopelvic biomechanics have been an area of increasing interest and research. Spinal fusion has been shown to alter the mobility of the pelvis and has been associated with decreased stability of THA implants.21 For example, in the setting of a fused spine, the lack of compensatory changes in pelvic tilt or acetabular anteversion when adjusting to a seated or standing position may predispose patients to impingement because the acetabular component is not properly positioned. Dual-mobility constructs mitigate this risk by providing an additional articulation, which increases jump distance and range of motion prior to impingement, thereby enhancing stability.
The use of dual-mobility liners in patients with LSF has also been examined.18-20 These studies demonstrate a reduced risk of postoperative THA dislocation in patients with previous LSF. The rate of postoperative complications and revisions for LSF patients with dual-mobility liners was also found to be similar to that of THAs without dual-mobility in patients without prior LSF. This study focused on a veteran population to demonstrate the efficacy of dual-mobility liners in patients with LSF. The results indicate that LSF prior to THA and female sex were predictors for prosthetic hip dislocations in the 12-month postoperative period in this patient population, which aligns with the current literature.
The dislocation rate in the LSF-THA group (9.5%) was higher than the dislocation rate in the control group (3.8%). Although not statistically significant in the univariate analysis, LSF was shown to be a significant risk factor after controlling for patient sex. Other studies have found the dislocation rate to be 3% to 7%, which is lower than the dislocation rate observed in this study.8,10,16
The reasons for this higher rate of dislocation are not entirely clear. A veteran population has poorer overall health than the general population, which may contribute to the higher than previously reported dislocation rates.22 These results can be applied to the management of veterans seeking THA.
There have been conflicting reports regarding the impact a patient’s sex has on THA outcomes in the general population.23-26 This study found that female patients had higher rates of dislocation within 1 year of THA than male patients. This difference, which could be due to differences in baseline anatomic hip morphology between the sexes; females tend to have smaller femoral head sizes and less offset compared with males.27,28 However, this finding could have been confounded by the small number of female veterans in the study cohort.
A type 2 diabetes mellitus (T2DM) diagnosis, which is a component of CCI, trended toward increased risk of prosthetic hip dislocation. Multiple studies have also discussed the increased risk of postoperative infections and revisions following THA in patients with T2DM.29-31 One study found T2DM to be an independent risk factor for immediate in-hospital postoperative complications following hip arthroplasty.32
Another factor that may influence postoperative dislocation risk is surgical approach. The posterior approach has historically been associated with higher rates of instability when compared to anterior or lateral THA.33 Researchers have also looked at the role that surgical approach plays in patients with prior LSF. Huebschmann et al confirmed that not only is LSF a significant risk factor for dislocation following THA, but anterior and laterally based surgical approaches may mitigate this risk.34
Limitations
As a retrospective cohort study, the reliability of the data hinges on complete documentation. Documentation of all encounters for dislocations was obtained from the VA Computerized Patient Record System, which may have led to some dislocation events being missed. However, as long as there was adequate postoperative follow-up, it was assumed all events outside the VA were included. Another limitation of this study was that male patients greatly outnumbered female patients, and this fact could limit the generalizability of findings to the population as a whole.
Conclusions
This study in a veteran population found that prior LSF and female sex were significant predictors for postoperative dislocation within 1 year of THA surgery. Additionally, the use of a dual-mobility liner was found to be protective against postoperative dislocation events. These data allow clinicians to better counsel veterans on the risk factors associated with postoperative dislocation and strategies to mitigate this risk.
- Sloan M, Premkumar A, Sheth NP. Projected volume of primary total joint arthroplasty in the U.S., 2014 to 2030. J Bone Joint Surg Am. 2018;100:1455-1460. doi:10.2106/JBJS.17.01617
- Bozic KJ, Kurtz SM, Lau E, et al. The epidemiology of revision total hip arthroplasty in the United States. J Bone Joint Surg Am. 2009;91:128-133. doi:10.2106/JBJS.H.00155
- Kurtz SM, Ong KL, Schmier J, et al. Future clinical and economic impact of revision total hip and knee arthroplasty. J Bone Joint Surg Am. 2007;89:144-151. doi:10.2106/JBJS.G.00587
- Kurtz SM, Ong KL, Schmier J, et al. Primary and revision arthroplasty surgery caseloads in the United States from 1990 to 2004. J Arthroplasty. 2009;24:195-203. doi:10.1016/j.arth.2007.11.015
- Yamato Y, Furuhashi H, Hasegawa T, et al. Simulation of implant impingement after spinal corrective fusion surgery in patients with previous total hip arthroplasty: a retrospective case series. Spine (Phila Pa 1976). 2021;46:512-519. doi:10.1097/BRS.0000000000003836
- Mudrick CA, Melvin JS, Springer BD. Late posterior hip instability after lumbar spinopelvic fusion. Arthroplast Today. 2015;1:25-29. doi:10.1016/j.artd.2015.05.002
- Diebo BG, Beyer GA, Grieco PW, et al. Complications in patients undergoing spinal fusion after THA. Clin Orthop Relat Res. 2018;476:412-417.doi:10.1007/s11999.0000000000000009 8.
- Sing DC, Barry JJ, Aguilar TU, et al. Prior lumbar spinal arthrodesis increases risk of prosthetic-related complication in total hip arthroplasty. J Arthroplasty. 2016;31:227-232.e1. doi:10.1016/j.arth.2016.02.069
- King CA, Landy DC, Martell JM, et al. Time to dislocation analysis of lumbar spine fusion following total hip arthroplasty: breaking up a happy home. J Arthroplasty. 2018;33:3768-3772. doi:10.1016/j.arth.2018.08.029
- Buckland AJ, Puvanesarajah V, Vigdorchik J, et al. Dislocation of a primary total hip arthroplasty is more common in patients with a lumbar spinal fusion. Bone Joint J. 2017;99-B:585-591.doi:10.1302/0301-620X.99B5.BJJ-2016-0657.R1
- Pirruccio K, Premkumar A, Sheth NP. The burden of prosthetic hip dislocations in the United States is projected to significantly increase by 2035. Hip Int. 2021;31:714-721. doi:10.1177/1120700020923619
- Salib CG, Reina N, Perry KI, et al. Lumbar fusion involving the sacrum increases dislocation risk in primary total hip arthroplasty. Bone Joint J. 2019;101-B:198-206. doi:10.1302/0301-620X.101B2.BJJ-2018-0754.R1
- An VVG, Phan K, Sivakumar BS, et al. Prior lumbar spinal fusion is associated with an increased risk of dislocation and revision in total hip arthroplasty: a meta-analysis. J Arthroplasty. 2018;33:297-300. doi:10.1016/j.arth.2017.08.040
- Klemt C, Padmanabha A, Tirumala V, et al. Lumbar spine fusion before revision total hip arthroplasty is associated with increased dislocation rates. J Am Acad Orthop Surg. 2021;29:e860-e868. doi:10.5435/JAAOS-D-20-00824
- Gausden EB, Parhar HS, Popper JE, et al. Risk factors for early dislocation following primary elective total hip arthroplasty. J Arthroplasty. 2018;33:1567-1571. doi:10.1016/j.arth.2017.12.034
- Malkani AL, Himschoot KJ, Ong KL, et al. Does timing of primary total hip arthroplasty prior to or after lumbar spine fusion have an effect on dislocation and revision rates?. J Arthroplasty. 2019;34:907-911. doi:10.1016/j.arth.2019.01.009
- Parilla FW, Shah RR, Gordon AC, et al. Does it matter: total hip arthroplasty or lumbar spinal fusion first? Preoperative sagittal spinopelvic measurements guide patient-specific surgical strategies in patients requiring both. J Arthroplasty. 2019;34:2652-2662. doi:10.1016/j.arth.2019.05.053
- Chalmers BP, Syku M, Sculco TP, et al. Dual-mobility constructs in primary total hip arthroplasty in high-risk patients with spinal fusions: our institutional experience. Arthroplast Today. 2020;6:749-754. doi:10.1016/j.artd.2020.07.024
- Nessler JM, Malkani AL, Sachdeva S, et al. Use of dual mobility cups in patients undergoing primary total hip arthroplasty with prior lumbar spine fusion. Int Orthop. 2020;44:857-862. doi:10.1007/s00264-020-04507-y
- Nessler JM, Malkani AL, Yep PJ, et al. Dislocation rates of primary total hip arthroplasty in patients with prior lumbar spine fusion and lumbar degenerative disk disease with and without utilization of dual mobility cups: an American Joint Replacement Registry study. J Am Acad Orthop Surg. 2023;31:e271-e277. doi:10.5435/JAAOS-D-22-00767
- Phan D, Bederman SS, Schwarzkopf R. The influence of sagittal spinal deformity on anteversion of the acetabular component in total hip arthroplasty. Bone Joint J. 2015;97-B:1017-1023. doi:10.1302/0301-620X.97B8.35700
- Agha Z, Lofgren RP, VanRuiswyk JV, et al. Are patients at Veterans Affairs medical centers sicker? A comparative analysis of health status and medical resource use. Arch Intern Med. 2000;160:3252-3257. doi:10.1001/archinte.160.21.325223.
- Basques BA, Bell JA, Fillingham YA, et al. Gender differences for hip and knee arthroplasty: complications and healthcare utilization. J Arthroplasty. 2019;34:1593-1597.e1. doi:10.1016/j.arth.2019.03.064
- Kim YH, Choi Y, Kim JS. Influence of patient-, design-, and surgery-related factors on rate of dislocation after primary cementless total hip arthroplasty. J Arthroplasty. 2009;24:1258-1263. doi:10.1016/j.arth.2009.03.017
- Chen A, Paxton L, Zheng X, et al. Association of sex with risk of 2-year revision among patients undergoing total hip arthroplasty. JAMA Netw Open. 2021;4:e2110687. doi:10.1001/jamanetworkopen.2021.10687
- Inacio MCS, Ake CF, Paxton EW, et al. Sex and risk of hip implant failure: assessing total hip arthroplasty outcomes in the United States. JAMA Intern Med. 2013;173:435-441. doi:10.1001/jamainternmed.2013.3271
- Karlson EW, Daltroy LH, Liang MH, et al. Gender differences in patient preferences may underlie differential utilization of elective surgery. Am J Med. 1997;102:524-530. doi:10.1016/s0002-9343(97)00050-8
- Kostamo T, Bourne RB, Whittaker JP, et al. No difference in gender-specific hip replacement outcomes. Clin Orthop Relat Res. 2009;467:135-140. doi:10.1007/s11999-008-0466-2
- Papagelopoulos PJ, Idusuyi OB, Wallrichs SL, et al. Long term outcome and survivorship analysis of primary total knee arthroplasty in patients with diabetes mellitus. Clin Orthop Relat Res. 1996;(330):124-132. doi:10.1097/00003086-199609000-00015
- Fitzgerald RH Jr, Nolan DR, Ilstrup DM, et al. Deep wound sepsis following total hip arthroplasty. J Bone Joint Surg Am. 1977;59:847-855.
- Blom AW, Brown J, Taylor AH, et al. Infection after total knee arthroplasty. J Bone Joint Surg Br. 2004;86:688-691. doi:10.1302/0301-620x.86b5.14887
- Jain NB, Guller U, Pietrobon R, et al. Comorbidities increase complication rates in patients having arthroplasty. Clin Orthop Relat Res. 2005;435:232-238. doi:10.1097/01.blo.0000156479.97488.a2
- Docter S, Philpott HT, Godkin L, et al. Comparison of intra and post-operative complication rates among surgical approaches in Total Hip Arthroplasty: A systematic review and meta-analysis. J Orthop. 2020;20:310-325. doi:10.1016/j.jor.2020.05.008
- Huebschmann NA, Lawrence KW, Robin JX, et al. Does surgical approach affect dislocation rate after total hip arthroplasty in patients who have prior lumbar spinal fusion? A retrospective analysis of 16,223 cases. J Arthroplasty. 2024;39:S306-S313. doi:10.1016/j.arth.2024.03.068
Total hip arthroplasty (THA) is among the most common elective orthopedic procedures performed annually in the United States, with an estimated 635,000 to 909,000 THAs expected each year by 2030.1 Consequently, complication rates and revision surgeries related to THA have been increasing, along with the financial burden on the health care system.2-4 Optimizing outcomes for patients undergoing THA and identifying risk factors for treatment failure have become areas of focus.
Over the last decade, there has been a renewed interest in the effect of previous lumbar spine fusion (LSF) surgery on THA outcomes. Studies have explored the rates of complications, postoperative mobility, and THA implant impingement.5-8 However, the outcome receiving the most attention in recent literature is the rate and effect of dislocation in patients with lumbar fusion surgery. Large Medicare database analyses have discovered an association with increased rates of dislocations in patients with lumbar fusion surgeries compared with those without.9,10 Prosthetic hip dislocation is an expensive complication of THA and is projected to have greater impact through 2035 due to a growing number of THA procedures.11 Identifying risk factors associated with hip dislocation is paramount to mitigating its effect on patients who have undergone THA.
Recent research has found increased rates of THA dislocation and revision surgery in patients with LSF, with some studies showing previous LSF as the strongest independent predictor.6-16 However, controversy surrounds this relationship, including the sequence of procedures (LSF before or after THA), the time between procedures, and involvement of the sacrum in LSF. One study found that patients had a 106% increased risk of dislocation when LSF was performed before THA compared with patients who underwent LSF 5 years after undergoing THA, while another study showed no significant difference in dislocations pre- vs post-LSF.16,17 An additional study showed no significant difference in the rate of dislocation in patients without sacral involvement in the LSF, while also showing significantly higher rates of dislocation in LSF with sacral involvement.12 The researchers also found a trend toward more dislocations in longer lumbosacral fusions. Recent studies have also examined dislocation rates with lumbar fusion in patients treated with dual-mobility liners.18-20 The consensus from these studies is that dual-mobility liners significantly decrease the rate of dislocation in primary THAs with lumbar fusion.
The present study sought to determine the rates of hip dislocations in a US Department of Veterans Affairs (VA) hospital setting. To the authors’ knowledge, no retrospective study focusing on THAs in the veteran population has been performed. This study benefits from controlling for various surgeon techniques and surgical preferences when compared to large Medicare database studies because the orthopedic surgeon (ABK) only performed the posterior approach for all patients during the study period.
The primary objective of this study was to determine whether the rates of hip dislocation would, in fact, be higher in patients with lumbar fusion surgery, as recent database studies suggest. Secondary objectives included determining whether patient characteristics, comorbidities, number of levels fused, or inclusion of the sacrum in the fusion construct influenced dislocation rates. Furthermore, VA Dayton Healthcare System (VADHS) began routine use of dual-mobility liners for lumbar fusion patients in 2018, allowing for examination of these patients.
Methods
The Wright State University and VADHS Institutional Review Board approved this study design. A retrospective review of all primary THAs at VADHS was performed to investigate the relationship between previous lumbar spine fusion and the incidence of THA revision. Manual chart review was performed for patients who underwent primary THA between January 2003, and December 2022. One surgeon performed all surgeries using only the posterior approach. Patients were not excluded if they had bilateral procedures and all eligible hips were included. Patients with a concomitant diagnosis of fracture of the femoral head or femoral neck at the time of surgery were excluded. Additionally, only patients with ≥ 12 months of follow-up data were included.
The primary outcome was dislocation within 12 months of THA; the primary independent variable was LSF prior to THA. Covariates included patient demographics (age, sex, body mass index [BMI]) and Charlson Comorbidity Index (CCI) score, with additional data collected on the number of levels fused, sacral spine involvement, revision rates, and use of dual-mobility liners. Year of surgery was also included in analyses to account for any changes that may have occurred during the study period.
Statistical Analysis
Statistical analyses were performed in SAS 9.4. Patients were grouped into 2 cohorts, depending on whether they had received LSF prior to THA. Analyses were adjusted for repeated measures to account for the small percentage of patients with bilateral procedures.
Univariate comparisons between cohorts for covariates, as well as rates of dislocation and revision, were performed using the independent samples t test for continuous variables and the Fisher exact test for dichotomous categorical variables. Significant comorbidities, as well as age, sex, BMI, liner type, LSF cohort, and surgery year, were included in a logistic regression model to determine what effect, if any, they had on the likelihood of dislocation. Variables were removed using a backward stepwise approach, starting with the nonsignificant variable effect with the lowest χ2 value, and continuing until reaching a final model where all remaining variable effects were significant. For the variables retained in the final model, odds ratios (ORs) with 95% CIs were derived, with dislocation designated as the event. Individual comorbidity subcomponents of the CCI were also analyzed for their effects on dislocation using backward stepwise logistic regression. A secondary analysis among patients with LSF tested for the influence of the number of vertebral levels fused, the presence or absence of sacral involvement in the fusion, and the use of dual-mobility liners on the likelihood of hip dislocation.
Results
The LSF cohort included 39 patients with THA and prior LSF, 3 of whom had bilateral procedures, for a total of 42 hips. The non-LSF cohort included 813 patients with THA, 112 of whom had bilateral procedures, for a total of 925 hips. The LSF and non-LSF cohorts did not differ significantly in age, sex, BMI, CCI, or revision rates (Table). The LSF cohort included a significantly higher percentage of hips receiving dual-mobility liners than did the non-LSF cohort (23.8% vs 0.6%; P < .001) and had more than twice the rate of dislocation (4 of 42 hips [9.5%] vs 35 of 925 hips [3.8%]), although this difference was not statistically significant (P = .08).
The final logistic regression model with dislocation as the outcome was statistically significant (χ2, 17.47; P < .001) and retained 2 significant predictor variables: LSF cohort (χ2, 4.63; P = .03), and sex (χ2, 18.27; P < .001). Females were more likely than males to experience dislocation (OR, 5.84; 95% CI, 2.60-13.13; P < .001) as were patients who had LSF prior to THA (OR, 3.42; 95% CI, 1.12-10.47; P = .03) (Figure). None of the CCI subcomponent comorbidities significantly affected the probability of dislocation (myocardial infarction, P = .46; congestive heart failure, P = .47; peripheral vascular disease, P = .97; stroke, P = .51; dementia, P = .99; chronic obstructive pulmonary disease, P = .95; connective tissue disease, P = .25; peptic ulcer, P = .41; liver disease, P = .30; diabetes, P = .06; hemiplegia, P = .99; chronic kidney disease, P = .82; solid tumor, P = .90; leukemia, P = .99; lymphoma, P = .99; AIDS, P = .99). Within the LSF cohort, neither the number of levels fused (P = .83) nor sacral involvement (P = .42), significantly affected the probability of hip dislocation. None of the patients in either cohort who received dual-mobility liners subsequently dislocated their hips, nor did any of them require revision surgery.
Discussion
Spinopelvic biomechanics have been an area of increasing interest and research. Spinal fusion has been shown to alter the mobility of the pelvis and has been associated with decreased stability of THA implants.21 For example, in the setting of a fused spine, the lack of compensatory changes in pelvic tilt or acetabular anteversion when adjusting to a seated or standing position may predispose patients to impingement because the acetabular component is not properly positioned. Dual-mobility constructs mitigate this risk by providing an additional articulation, which increases jump distance and range of motion prior to impingement, thereby enhancing stability.
The use of dual-mobility liners in patients with LSF has also been examined.18-20 These studies demonstrate a reduced risk of postoperative THA dislocation in patients with previous LSF. The rate of postoperative complications and revisions for LSF patients with dual-mobility liners was also found to be similar to that of THAs without dual-mobility in patients without prior LSF. This study focused on a veteran population to demonstrate the efficacy of dual-mobility liners in patients with LSF. The results indicate that LSF prior to THA and female sex were predictors for prosthetic hip dislocations in the 12-month postoperative period in this patient population, which aligns with the current literature.
The dislocation rate in the LSF-THA group (9.5%) was higher than the dislocation rate in the control group (3.8%). Although not statistically significant in the univariate analysis, LSF was shown to be a significant risk factor after controlling for patient sex. Other studies have found the dislocation rate to be 3% to 7%, which is lower than the dislocation rate observed in this study.8,10,16
The reasons for this higher rate of dislocation are not entirely clear. A veteran population has poorer overall health than the general population, which may contribute to the higher than previously reported dislocation rates.22 These results can be applied to the management of veterans seeking THA.
There have been conflicting reports regarding the impact a patient’s sex has on THA outcomes in the general population.23-26 This study found that female patients had higher rates of dislocation within 1 year of THA than male patients. This difference, which could be due to differences in baseline anatomic hip morphology between the sexes; females tend to have smaller femoral head sizes and less offset compared with males.27,28 However, this finding could have been confounded by the small number of female veterans in the study cohort.
A type 2 diabetes mellitus (T2DM) diagnosis, which is a component of CCI, trended toward increased risk of prosthetic hip dislocation. Multiple studies have also discussed the increased risk of postoperative infections and revisions following THA in patients with T2DM.29-31 One study found T2DM to be an independent risk factor for immediate in-hospital postoperative complications following hip arthroplasty.32
Another factor that may influence postoperative dislocation risk is surgical approach. The posterior approach has historically been associated with higher rates of instability when compared to anterior or lateral THA.33 Researchers have also looked at the role that surgical approach plays in patients with prior LSF. Huebschmann et al confirmed that not only is LSF a significant risk factor for dislocation following THA, but anterior and laterally based surgical approaches may mitigate this risk.34
Limitations
As a retrospective cohort study, the reliability of the data hinges on complete documentation. Documentation of all encounters for dislocations was obtained from the VA Computerized Patient Record System, which may have led to some dislocation events being missed. However, as long as there was adequate postoperative follow-up, it was assumed all events outside the VA were included. Another limitation of this study was that male patients greatly outnumbered female patients, and this fact could limit the generalizability of findings to the population as a whole.
Conclusions
This study in a veteran population found that prior LSF and female sex were significant predictors for postoperative dislocation within 1 year of THA surgery. Additionally, the use of a dual-mobility liner was found to be protective against postoperative dislocation events. These data allow clinicians to better counsel veterans on the risk factors associated with postoperative dislocation and strategies to mitigate this risk.
- Sloan M, Premkumar A, Sheth NP. Projected volume of primary total joint arthroplasty in the U.S., 2014 to 2030. J Bone Joint Surg Am. 2018;100:1455-1460. doi:10.2106/JBJS.17.01617
- Bozic KJ, Kurtz SM, Lau E, et al. The epidemiology of revision total hip arthroplasty in the United States. J Bone Joint Surg Am. 2009;91:128-133. doi:10.2106/JBJS.H.00155
- Kurtz SM, Ong KL, Schmier J, et al. Future clinical and economic impact of revision total hip and knee arthroplasty. J Bone Joint Surg Am. 2007;89:144-151. doi:10.2106/JBJS.G.00587
- Kurtz SM, Ong KL, Schmier J, et al. Primary and revision arthroplasty surgery caseloads in the United States from 1990 to 2004. J Arthroplasty. 2009;24:195-203. doi:10.1016/j.arth.2007.11.015
- Yamato Y, Furuhashi H, Hasegawa T, et al. Simulation of implant impingement after spinal corrective fusion surgery in patients with previous total hip arthroplasty: a retrospective case series. Spine (Phila Pa 1976). 2021;46:512-519. doi:10.1097/BRS.0000000000003836
- Mudrick CA, Melvin JS, Springer BD. Late posterior hip instability after lumbar spinopelvic fusion. Arthroplast Today. 2015;1:25-29. doi:10.1016/j.artd.2015.05.002
- Diebo BG, Beyer GA, Grieco PW, et al. Complications in patients undergoing spinal fusion after THA. Clin Orthop Relat Res. 2018;476:412-417.doi:10.1007/s11999.0000000000000009 8.
- Sing DC, Barry JJ, Aguilar TU, et al. Prior lumbar spinal arthrodesis increases risk of prosthetic-related complication in total hip arthroplasty. J Arthroplasty. 2016;31:227-232.e1. doi:10.1016/j.arth.2016.02.069
- King CA, Landy DC, Martell JM, et al. Time to dislocation analysis of lumbar spine fusion following total hip arthroplasty: breaking up a happy home. J Arthroplasty. 2018;33:3768-3772. doi:10.1016/j.arth.2018.08.029
- Buckland AJ, Puvanesarajah V, Vigdorchik J, et al. Dislocation of a primary total hip arthroplasty is more common in patients with a lumbar spinal fusion. Bone Joint J. 2017;99-B:585-591.doi:10.1302/0301-620X.99B5.BJJ-2016-0657.R1
- Pirruccio K, Premkumar A, Sheth NP. The burden of prosthetic hip dislocations in the United States is projected to significantly increase by 2035. Hip Int. 2021;31:714-721. doi:10.1177/1120700020923619
- Salib CG, Reina N, Perry KI, et al. Lumbar fusion involving the sacrum increases dislocation risk in primary total hip arthroplasty. Bone Joint J. 2019;101-B:198-206. doi:10.1302/0301-620X.101B2.BJJ-2018-0754.R1
- An VVG, Phan K, Sivakumar BS, et al. Prior lumbar spinal fusion is associated with an increased risk of dislocation and revision in total hip arthroplasty: a meta-analysis. J Arthroplasty. 2018;33:297-300. doi:10.1016/j.arth.2017.08.040
- Klemt C, Padmanabha A, Tirumala V, et al. Lumbar spine fusion before revision total hip arthroplasty is associated with increased dislocation rates. J Am Acad Orthop Surg. 2021;29:e860-e868. doi:10.5435/JAAOS-D-20-00824
- Gausden EB, Parhar HS, Popper JE, et al. Risk factors for early dislocation following primary elective total hip arthroplasty. J Arthroplasty. 2018;33:1567-1571. doi:10.1016/j.arth.2017.12.034
- Malkani AL, Himschoot KJ, Ong KL, et al. Does timing of primary total hip arthroplasty prior to or after lumbar spine fusion have an effect on dislocation and revision rates?. J Arthroplasty. 2019;34:907-911. doi:10.1016/j.arth.2019.01.009
- Parilla FW, Shah RR, Gordon AC, et al. Does it matter: total hip arthroplasty or lumbar spinal fusion first? Preoperative sagittal spinopelvic measurements guide patient-specific surgical strategies in patients requiring both. J Arthroplasty. 2019;34:2652-2662. doi:10.1016/j.arth.2019.05.053
- Chalmers BP, Syku M, Sculco TP, et al. Dual-mobility constructs in primary total hip arthroplasty in high-risk patients with spinal fusions: our institutional experience. Arthroplast Today. 2020;6:749-754. doi:10.1016/j.artd.2020.07.024
- Nessler JM, Malkani AL, Sachdeva S, et al. Use of dual mobility cups in patients undergoing primary total hip arthroplasty with prior lumbar spine fusion. Int Orthop. 2020;44:857-862. doi:10.1007/s00264-020-04507-y
- Nessler JM, Malkani AL, Yep PJ, et al. Dislocation rates of primary total hip arthroplasty in patients with prior lumbar spine fusion and lumbar degenerative disk disease with and without utilization of dual mobility cups: an American Joint Replacement Registry study. J Am Acad Orthop Surg. 2023;31:e271-e277. doi:10.5435/JAAOS-D-22-00767
- Phan D, Bederman SS, Schwarzkopf R. The influence of sagittal spinal deformity on anteversion of the acetabular component in total hip arthroplasty. Bone Joint J. 2015;97-B:1017-1023. doi:10.1302/0301-620X.97B8.35700
- Agha Z, Lofgren RP, VanRuiswyk JV, et al. Are patients at Veterans Affairs medical centers sicker? A comparative analysis of health status and medical resource use. Arch Intern Med. 2000;160:3252-3257. doi:10.1001/archinte.160.21.325223.
- Basques BA, Bell JA, Fillingham YA, et al. Gender differences for hip and knee arthroplasty: complications and healthcare utilization. J Arthroplasty. 2019;34:1593-1597.e1. doi:10.1016/j.arth.2019.03.064
- Kim YH, Choi Y, Kim JS. Influence of patient-, design-, and surgery-related factors on rate of dislocation after primary cementless total hip arthroplasty. J Arthroplasty. 2009;24:1258-1263. doi:10.1016/j.arth.2009.03.017
- Chen A, Paxton L, Zheng X, et al. Association of sex with risk of 2-year revision among patients undergoing total hip arthroplasty. JAMA Netw Open. 2021;4:e2110687. doi:10.1001/jamanetworkopen.2021.10687
- Inacio MCS, Ake CF, Paxton EW, et al. Sex and risk of hip implant failure: assessing total hip arthroplasty outcomes in the United States. JAMA Intern Med. 2013;173:435-441. doi:10.1001/jamainternmed.2013.3271
- Karlson EW, Daltroy LH, Liang MH, et al. Gender differences in patient preferences may underlie differential utilization of elective surgery. Am J Med. 1997;102:524-530. doi:10.1016/s0002-9343(97)00050-8
- Kostamo T, Bourne RB, Whittaker JP, et al. No difference in gender-specific hip replacement outcomes. Clin Orthop Relat Res. 2009;467:135-140. doi:10.1007/s11999-008-0466-2
- Papagelopoulos PJ, Idusuyi OB, Wallrichs SL, et al. Long term outcome and survivorship analysis of primary total knee arthroplasty in patients with diabetes mellitus. Clin Orthop Relat Res. 1996;(330):124-132. doi:10.1097/00003086-199609000-00015
- Fitzgerald RH Jr, Nolan DR, Ilstrup DM, et al. Deep wound sepsis following total hip arthroplasty. J Bone Joint Surg Am. 1977;59:847-855.
- Blom AW, Brown J, Taylor AH, et al. Infection after total knee arthroplasty. J Bone Joint Surg Br. 2004;86:688-691. doi:10.1302/0301-620x.86b5.14887
- Jain NB, Guller U, Pietrobon R, et al. Comorbidities increase complication rates in patients having arthroplasty. Clin Orthop Relat Res. 2005;435:232-238. doi:10.1097/01.blo.0000156479.97488.a2
- Docter S, Philpott HT, Godkin L, et al. Comparison of intra and post-operative complication rates among surgical approaches in Total Hip Arthroplasty: A systematic review and meta-analysis. J Orthop. 2020;20:310-325. doi:10.1016/j.jor.2020.05.008
- Huebschmann NA, Lawrence KW, Robin JX, et al. Does surgical approach affect dislocation rate after total hip arthroplasty in patients who have prior lumbar spinal fusion? A retrospective analysis of 16,223 cases. J Arthroplasty. 2024;39:S306-S313. doi:10.1016/j.arth.2024.03.068
Effects of Lumbar Fusion and Dual-Mobility Liners on Dislocation Rates Following Total Hip Arthroplasty in a Veteran Population
Effects of Lumbar Fusion and Dual-Mobility Liners on Dislocation Rates Following Total Hip Arthroplasty in a Veteran Population