User login
Third Universal MI Definition Unveiled
MUNICH – A new universal definition of myocardial infarction has been unveiled, sparked by the development of ever more sensitive cardiac biomarker assays and imaging techniques.
These assays, including the new high-sensitivity cardiac troponin (cTn) assays available throughout Europe and awaiting approval in the United States, have created confusion in the diagnosis of myocardial infarction because they detect small cTn elevations associated with many other clinical conditions such as heart failure, arrhythmias, and pulmonary embolism that are not MIs, but rather myocardial injury with necrosis.

"I think there has been a little bit of a problem in the past where we’ve had too many infarctions [diagnosed] ... where there is some damage or injury to the myocardial cells," said document task force cochair Dr. Kristian Thygeysen, who presented the third universal MI definition at the annual meeting of the European Society of Cardiology (ESC).
The expert consensus document, developed by the ESC, American College of Cardiology (ACC), American Heart Association (AHA), and World Heart Federation (WHF), maintains the pathological definition of acute MI as myocardial cell death due to prolonged myocardial ischemia, but goes on to refine the definition of MI in five settings, including the controversial area of MIs associated with revascularization procedures.

MI in the PCI Setting
An MI related to percutaneous coronary intervention (PCI) is defined as an elevation of cTn values more than five times the 99th percentile upper reference limit (URL) in the first 48 hours after a procedure in patients with normal baseline troponin values, or a rise of cTn values of more than 20% in patients with elevated baseline levels that are stable or falling.
It also requires one of the following events: symptoms suggestive of myocardial ischemia, new ischemic ECG changes, angiographic findings consistent with a procedural complication, or imaging evidence of new loss of viable myocardium or new regional wall motion abnormality.
In the previous 2007 document, the troponin threshold had been more than three times the 99th percentile, and was raised based on new prognostic information from long-term follow-up of patients undergoing PCI showing that there is unavoidable injury associated with the procedure, document task force codirector Dr. Joseph Alpert said during the presentation.
CABG-Related MI
Similarly, the 2012 version raises the troponin threshold for MI related to coronary artery bypass graft surgery from five times the 99th percentile URL in the 2007 document to 10 times the 99th percentile in patients with normal cTn baseline values.
It also requires one of the following: new pathological Q waves or new left bundle branch block (LBBB), angiographically documented new graft or new native coronary artery occlusion, or imaging evidence of new loss of viable myocardium or new regional wall motion abnormality.
Once again, the decision to raise the troponin threshold was made because there is unavoidable injury to the heart during CABG from needle sticks, handling of the heart, and the myocardial preservation procedure, said Dr. Alpert, a professor of medicine at the University of Arizona, Tucson.
Many Sources of Heart Injury
"The problem that every clinician – not just cardiologists, but internists and surgeons – is having with these troponin tests, and particularly with the high-sensitivity test, is that it turns out we’re finding that there are lots and lots of people having heart injuries," he said in an interview. "We’ve known for decades that it’s not uncommon for a very sick patient to have liver injuries, but now we’re saying, ‘My goodness, they’re having heart injuries, and these injuries are not MIs, or at least we have no evidence there is ischemia.’ "
The updated guideline points out that novel procedures such as transcatheter aortic valve implantation or mitral clip may also cause myocardial injury with necrosis, and that "it is likely that, similarly to CABG, the more marked the elevation of the biomarker values, the worse the prognosis – but data on that are not available.&qu
Although high-sensitivity troponin assays are not yet approved in the United States, it is only a matter of time before they are and the financial battle heats up over the distinction between myocardial injury and MI, according to Dr. Alpert. The reason is that there is currently no reimbursement code for patients with myocardial injury, who require substantial time and resources that currently are not being reimbursed.
"We’re pushing to get that code, because when you have an elevated troponin it means something, and it always means something not good," he said in the interview.
Cardiac troponin (I or T) is the preferred biomarker for the definition of acute MI, although less sensitive biomarkers such as the creatine kinase-MB (CKMB) mass can still be used when cardiac troponin is not available, said Dr. Thygesen, with the department of cardiological medicine, Aarhus (Denmark) University.
The criteria for an acute MI include detection of a rise and/or fall of cardiac biomarker values exceeding the 99th percentile URL, plus at least one of the following:
• Symptoms of ischemia.
• New or presumably new significant ST-segment/T wave changes or new LBBB.
• Development of pathological Q waves in the ECG.
• Imaging evidence of new loss of viable myocardium or new regional wall motion abnormality.
• Identification of an intracoronary thrombus by angiography or autopsy.
The new MI definition is expected to become the gold standard for diagnosis and to be adopted by the U.S. Food and Drug Administration for use in clinical trial protocols accepted by the agency. This is significant because it will help standardize the way MI is defined in clinical trials, making comparisons between studies more meaningful, Dr. Thygesen observed.
The expert consensus document, as well as pocket versions, are available on the websites of the ESC, ACC, AHA, and World Heart Federation.
The document is also being copublished in five journals: the Journal of the American College of Cardiology, European Heart Journal, Circulation, Global Heart, and Nature Reviews of Cardiology.
Dr. Thygesen reported no conflicts of interest. Dr. Alpert reported consulting for several pharmaceutical firms as well as the North American Center for Continuing Medical Education.
MUNICH – A new universal definition of myocardial infarction has been unveiled, sparked by the development of ever more sensitive cardiac biomarker assays and imaging techniques.
These assays, including the new high-sensitivity cardiac troponin (cTn) assays available throughout Europe and awaiting approval in the United States, have created confusion in the diagnosis of myocardial infarction because they detect small cTn elevations associated with many other clinical conditions such as heart failure, arrhythmias, and pulmonary embolism that are not MIs, but rather myocardial injury with necrosis.
"I think there has been a little bit of a problem in the past where we’ve had too many infarctions [diagnosed] ... where there is some damage or injury to the myocardial cells," said document task force cochair Dr. Kristian Thygeysen, who presented the third universal MI definition at the annual meeting of the European Society of Cardiology (ESC).
The expert consensus document, developed by the ESC, American College of Cardiology (ACC), American Heart Association (AHA), and World Heart Federation (WHF), maintains the pathological definition of acute MI as myocardial cell death due to prolonged myocardial ischemia, but goes on to refine the definition of MI in five settings, including the controversial area of MIs associated with revascularization procedures.
MI in the PCI Setting
An MI related to percutaneous coronary intervention (PCI) is defined as an elevation of cTn values more than five times the 99th percentile upper reference limit (URL) in the first 48 hours after a procedure in patients with normal baseline troponin values, or a rise of cTn values of more than 20% in patients with elevated baseline levels that are stable or falling.
It also requires one of the following events: symptoms suggestive of myocardial ischemia, new ischemic ECG changes, angiographic findings consistent with a procedural complication, or imaging evidence of new loss of viable myocardium or new regional wall motion abnormality.
In the previous 2007 document, the troponin threshold had been more than three times the 99th percentile, and was raised based on new prognostic information from long-term follow-up of patients undergoing PCI showing that there is unavoidable injury associated with the procedure, document task force codirector Dr. Joseph Alpert said during the presentation.
CABG-Related MI
Similarly, the 2012 version raises the troponin threshold for MI related to coronary artery bypass graft surgery from five times the 99th percentile URL in the 2007 document to 10 times the 99th percentile in patients with normal cTn baseline values.
It also requires one of the following: new pathological Q waves or new left bundle branch block (LBBB), angiographically documented new graft or new native coronary artery occlusion, or imaging evidence of new loss of viable myocardium or new regional wall motion abnormality.
Once again, the decision to raise the troponin threshold was made because there is unavoidable injury to the heart during CABG from needle sticks, handling of the heart, and the myocardial preservation procedure, said Dr. Alpert, a professor of medicine at the University of Arizona, Tucson.
Many Sources of Heart Injury
"The problem that every clinician – not just cardiologists, but internists and surgeons – is having with these troponin tests, and particularly with the high-sensitivity test, is that it turns out we’re finding that there are lots and lots of people having heart injuries," he said in an interview. "We’ve known for decades that it’s not uncommon for a very sick patient to have liver injuries, but now we’re saying, ‘My goodness, they’re having heart injuries, and these injuries are not MIs, or at least we have no evidence there is ischemia.’ "
The updated guideline points out that novel procedures such as transcatheter aortic valve implantation or mitral clip may also cause myocardial injury with necrosis, and that "it is likely that, similarly to CABG, the more marked the elevation of the biomarker values, the worse the prognosis – but data on that are not available.&qu
Although high-sensitivity troponin assays are not yet approved in the United States, it is only a matter of time before they are and the financial battle heats up over the distinction between myocardial injury and MI, according to Dr. Alpert. The reason is that there is currently no reimbursement code for patients with myocardial injury, who require substantial time and resources that currently are not being reimbursed.
"We’re pushing to get that code, because when you have an elevated troponin it means something, and it always means something not good," he said in the interview.
Cardiac troponin (I or T) is the preferred biomarker for the definition of acute MI, although less sensitive biomarkers such as the creatine kinase-MB (CKMB) mass can still be used when cardiac troponin is not available, said Dr. Thygesen, with the department of cardiological medicine, Aarhus (Denmark) University.
The criteria for an acute MI include detection of a rise and/or fall of cardiac biomarker values exceeding the 99th percentile URL, plus at least one of the following:
• Symptoms of ischemia.
• New or presumably new significant ST-segment/T wave changes or new LBBB.
• Development of pathological Q waves in the ECG.
• Imaging evidence of new loss of viable myocardium or new regional wall motion abnormality.
• Identification of an intracoronary thrombus by angiography or autopsy.
The new MI definition is expected to become the gold standard for diagnosis and to be adopted by the U.S. Food and Drug Administration for use in clinical trial protocols accepted by the agency. This is significant because it will help standardize the way MI is defined in clinical trials, making comparisons between studies more meaningful, Dr. Thygesen observed.
The expert consensus document, as well as pocket versions, are available on the websites of the ESC, ACC, AHA, and World Heart Federation.
The document is also being copublished in five journals: the Journal of the American College of Cardiology, European Heart Journal, Circulation, Global Heart, and Nature Reviews of Cardiology.
Dr. Thygesen reported no conflicts of interest. Dr. Alpert reported consulting for several pharmaceutical firms as well as the North American Center for Continuing Medical Education.
AT THE ANNUAL MEETING OF THE EUROPEAN SOCIETY OF CARDIOLOGY

ESC Guidelines Tackle TAVI
MUNICH – Transcatheter aortic valve implantation should not be performed in patients at intermediate risk for surgery, according to new European guidelines on the management of valvular heart disease.
"We strongly stress that today, TAVI should not be performed in patients at intermediate risk," said task force chair Dr. Alec Vahanian of the department of cardiology at Bichat Hospital, Paris.
This is the first time that TAVI has been addressed in the guidelines, a joint collaboration between the European Society of Cardiology and the European Association for Cardio-Thoracic Surgery.

The use of TAVI has mushroomed in recent years among high-risk patients with severe aortic stenosis and in those who are not candidates for surgery, but also has been performed in patients at lower risk.
The new guidelines update those issued in 2010, and were prompted by new evidence on risk stratification, diagnostic methods, therapeutic options, and the importance of the collaborative approach between cardiologists and cardiac surgeons, Dr. Vahanian said at the annual congress of the European Society of Cardiology.
"The key message – the core of the document – is to stress teamwork," he said.
The guidelines state that TAVI should be undertaken only with a multidisciplinary "heart team" including cardiologists, cardiac surgeons, and other specialists, if necessary, and only in hospitals with cardiac surgery on-site.
The indications for TAVI, based on results of the randomized PARTNER trial and large European registries, include patients with severe, symptomatic aortic stenosis (AS) who are not suitable for aortic valve replacement (AVR) as assessed by a heart team, and who are likely to gain improvement in their quality of life and are expected to live more than 1 year.
TAVI also should be considered in high-risk patients with severe symptomatic AS who may still be suitable for surgery, but in whom TAVI is favored by a heart team based on the individual risk profile and anatomic suitability, Dr. Vahanian said.
He reported a virtual laundry list of absolute and relative contraindications to TAVI, including an inadequate annulus size, defined as less than 10 mm or greater than 29 mm; thrombus in the left ventricle; active endocarditis; plaques with mobile thrombi in the ascending aorta or arch; inadequate vascular access for a transfemoral/subclavian approach; and a very low left ventricular ejection fraction of less than 20%.
Dr. Vahanian said AVR remains suitable for patients with severe symptomatic AS, including those undergoing coronary artery bypass surgery or surgery of the ascending aorta or another valve, as well as those who are suitable for TAVI, but in whom surgery is favored by a heart team. He observed that there was a great deal of debate among the task force members regarding surgery in symptomatic patients with low flow, low- gradient (defined as less than 40 mm Hg) aortic stenosis, and a normal ejection fraction.
"We have to be extremely cautious and treat only the patient while symptomatic and we are absolutely sure, if we can be sure, that the aortic disease is severe," he remarked.
Disclosures were not provided. The Organizing Committee assumed responsibility for ensuring that all potential conflicts of interest relevant to the program are declared to the participants.
MUNICH – Transcatheter aortic valve implantation should not be performed in patients at intermediate risk for surgery, according to new European guidelines on the management of valvular heart disease.
"We strongly stress that today, TAVI should not be performed in patients at intermediate risk," said task force chair Dr. Alec Vahanian of the department of cardiology at Bichat Hospital, Paris.
This is the first time that TAVI has been addressed in the guidelines, a joint collaboration between the European Society of Cardiology and the European Association for Cardio-Thoracic Surgery.
The use of TAVI has mushroomed in recent years among high-risk patients with severe aortic stenosis and in those who are not candidates for surgery, but also has been performed in patients at lower risk.
The new guidelines update those issued in 2010, and were prompted by new evidence on risk stratification, diagnostic methods, therapeutic options, and the importance of the collaborative approach between cardiologists and cardiac surgeons, Dr. Vahanian said at the annual congress of the European Society of Cardiology.
"The key message – the core of the document – is to stress teamwork," he said.
The guidelines state that TAVI should be undertaken only with a multidisciplinary "heart team" including cardiologists, cardiac surgeons, and other specialists, if necessary, and only in hospitals with cardiac surgery on-site.
The indications for TAVI, based on results of the randomized PARTNER trial and large European registries, include patients with severe, symptomatic aortic stenosis (AS) who are not suitable for aortic valve replacement (AVR) as assessed by a heart team, and who are likely to gain improvement in their quality of life and are expected to live more than 1 year.
TAVI also should be considered in high-risk patients with severe symptomatic AS who may still be suitable for surgery, but in whom TAVI is favored by a heart team based on the individual risk profile and anatomic suitability, Dr. Vahanian said.
He reported a virtual laundry list of absolute and relative contraindications to TAVI, including an inadequate annulus size, defined as less than 10 mm or greater than 29 mm; thrombus in the left ventricle; active endocarditis; plaques with mobile thrombi in the ascending aorta or arch; inadequate vascular access for a transfemoral/subclavian approach; and a very low left ventricular ejection fraction of less than 20%.
Dr. Vahanian said AVR remains suitable for patients with severe symptomatic AS, including those undergoing coronary artery bypass surgery or surgery of the ascending aorta or another valve, as well as those who are suitable for TAVI, but in whom surgery is favored by a heart team. He observed that there was a great deal of debate among the task force members regarding surgery in symptomatic patients with low flow, low- gradient (defined as less than 40 mm Hg) aortic stenosis, and a normal ejection fraction.
"We have to be extremely cautious and treat only the patient while symptomatic and we are absolutely sure, if we can be sure, that the aortic disease is severe," he remarked.
Disclosures were not provided. The Organizing Committee assumed responsibility for ensuring that all potential conflicts of interest relevant to the program are declared to the participants.
AT THE ANNUAL CONGRESS OF THE EUROPEAN SOCIETY OF CARDIOLOGY

Racemic Epinephrine May Be Better Option for Bronchiolitic Preemies
COVINGTON, KY. – Racemic epinephrine may be more effective in premature than in full-term infants who are hospitalized for bronchiolitis, a chart review suggests.
The positive response rate to inhaled racemic epinephrine was significantly higher at 54.3% among premature infants, compared with 28% among full-term infants (P = .003).
In contrast, there was no significant difference in documented positive response rates to albuterol (Proventil, Ventolin, Volmax, Vospire) among premature and full-term infants (43.4% vs. 38%; P = .18), Dr. Russell J. McCulloh reported in a poster at the Pediatric Hospital Medicine 2012 meeting.
He said that few studies have examined the effectiveness of commonly used bronchiolitis therapies in children with a history of premature birth, even though these children are commonly affected by bronchiolitis and are at higher risk of severe outcomes and prolonged stay.
The chart review included 1,222 infants with and without a history of premature birth who were admitted for bronchiolitis to two academic medical centers. Of these, 229 (19%) were premature.
At baseline, preemies were significantly older than full-term infants (6.6 months vs. 5.4 months) and less likely to have day care exposure (15.3% vs. 24%), but more likely to have a history of wheeze (18% vs. 14%).
Premature patients had a significantly longer mean length of stay of 3.8 days compared with 2.5 days among full-term infants, although this did not differ significantly based on systemic steroid use (31% vs. 27.6%; P = .3), noted Dr. McCulloh of the pediatrics division at Rhode Island Hospital, Providence.
Premature infants were significantly more likely than full-term infants to require an ICU stay (23% vs. 11%), and they trended toward more pneumonia diagnosed (9.3% vs. 6%) and IV hydration (63% vs. 58.4%).
Full-term infants had more fever documented (45% vs. 36%) and urinary tract infections diagnosed (2.4% vs. 0%).
In logistic regression analyses, premature birth was independently associated with improved responsiveness to epinephrine (odds ratio, 1.89), Dr. McCulloh reported at the meeting, which was sponsored by the Society of Hospital Medicine, the American Academy of Pediatrics, and the Academic Pediatric Association.
Dr. McCulloh reported having no conflicts of interest.
AT THE PEDIATRIC HOSPITAL MEDICINE 2012 MEETING
Major Finding: The positive response rate to inhaled racemic epinephrine was 54.3% among premature infants and 28% among full-term infants.
Data Source: The data were from a chart review of 1,222 premature and full-term infants who were admitted with bronchiolitis to two children’s hospitals.
Disclosures: Dr. McCulloh reported having no conflicts of interest.
EEG Monitoring at Core of Status Epilepticus
COVINGTON, KY. – Early electroencephalogram monitoring is playing an increasingly critical role in the recognition and management of status epilepticus, the most common neurologic emergency of childhood.
EEG is important for a definitive diagnosis of nonconvulsive status epilepticus (SE), particularly in children who have been in a convulsive state and in those with encephalopathy of unknown etiology or a seizure history, Dr. Rajit K. Basu of Cincinnati Children’s Hospital Medical Center said at the Pediatric Hospital Medicine 2012 meeting.
This view is formed in part by a recent study at his institution, in which video EEG monitoring revealed that more than one-third of children admitted for encephalopathy (35%) were in nonconvulsive status epilepticus. Almost all had convulsive seizures prior to presenting (92%) and more than half were being cared for on the floor (Pediatrics 2012;129:e748-55).
Similarly, an earlier study reported that up to 22% of children who had prolonged EEG monitoring after convulsive SE were found to be in nonconvulsive SE (Neurology 2010;74:636-42).
"These are the kids that I think really fall through the cracks for us – the ones that got a bunch of meds in the ER and are admitted to the floor for observation because they’re ‘sleepy’ or need to ‘wake up,’ " Dr. Basu said. "But you don’t know actually that they’ve recovered, and every minute that you let them go – every minute that you don’t know they’re in nonconvulsive status – is a problem."
He acknowledged that not every institution has the capacity for emergency EEG monitoring but said the idea is for clinicians to think about an EEG at 7 or 8 a.m. rather than 2 p.m.
The International League Against Epilepsy (ILAE) defined status epilepticus in 1993 as more than 30 minutes of continuous epileptic activity without complete recovery of consciousness, although more recent definitions have shortened the duration to 20, 15, or even 5 minutes of continuous seizure activity.
Essential to the management of SE is an understanding of the inciting disease and that seizures are neurotoxic, said Dr. Basu, lead for the hospital working group on management of refractory SE.
"Seizures are not a benign thing, even if you stop them," he said. "They’re a pre-status state. Your brain is on fire and that fire needs to be put out."
Multiple diagnostic algorithms for SE exist, including one by the ILAE that is expected to be revised soon, but most are center specific or user specific. The common thread, however, is that time matters, both for treatment response and outcomes.

"If you don’t act quickly, the outcome on the backside is severe," Dr. Basu said. "Even if they don’t die, which some kids unfortunately do, there is an increased incidence of epilepsy syndrome and poor neurologic recovery."
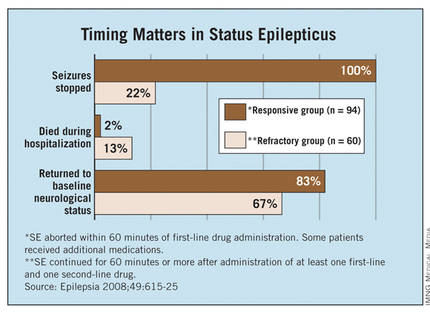
Indeed, the Mayo Clinic reported (Epilepsia 2008;49:615-25) that seizures stopped in 100% of children with SE receiving an additional second-line therapy within less than 60 minutes of the first drug, compared with only 22% of those receiving additional second-line therapy later in the clinical course. (Patients were allowed two second-line therapies before third-line treatment.)
Children in that study’s refractory SE group were significantly less likely than those treated more aggressively to return to baseline neurological status and more likely to die during hospitalization (see graph), and they had a twofold higher risk of developing a new neurological deficit or epilepsy at 4-year follow-up. (Researchers defined the refractory group as "clinical or electrographic seizures lasting longer than 60 minutes despite treatment with at least one first-line AED and one second-line AED.")
"The point is that if you follow some kind of time algorithm and deliver meds early and aggressively, you can get ahead of this and may stop status from developing," Dr. Basu said.
A continuing challenge is predicting which child presenting with SE will progress to refractory SE and likely end up in the ICU on burst suppression. To this end, Cincinnati Children’s recently launched the PARSE (Pediatric Acute Refractory Status Epilepticus) Initiative to derive a predictive model that may actually trigger a change in the "tempo" of SE management, he said.
Until predictive modeling becomes a reality, in-hospital and at-home seizure plans are being created. The London-Innsbruck Colloquium on Acute Seizures and Status Epilepticus has penned several SE protocols, with a recent review (Curr. Opin. Neurol. 2011;24:165-70) detailing treatment advances since the first colloquium was held in 2007.
Hospitals are also developing at-home seizure plans that may be tailored to individual at-risk patients, featuring a red, yellow, and green light system similar to that used in at-home asthma action plans. Parents may understand the idea of giving rectal diazepam (Valium, Valrelease) at home, but such remote plans can help address questions such as when a second therapy should be delivered, the correct dosing of benzodiazepines, or when to come to the hospital, Dr. Basu said at the meeting, which was sponsored by the Society of Hospital Medicine, the American Academy of Pediatrics, and the Academic Pediatric Association.
Dr. Basu reported no relevant conflicts of interest.
EEG, nonconvulsive status epilepticus in children, seizures, Dr. Rajit K. Basu, Pediatric Hospital Medicine, convulsive seizures, prolonged EEG monitoring, The International League Against Epilepsy, ILAE,
COVINGTON, KY. – Early electroencephalogram monitoring is playing an increasingly critical role in the recognition and management of status epilepticus, the most common neurologic emergency of childhood.
EEG is important for a definitive diagnosis of nonconvulsive status epilepticus (SE), particularly in children who have been in a convulsive state and in those with encephalopathy of unknown etiology or a seizure history, Dr. Rajit K. Basu of Cincinnati Children’s Hospital Medical Center said at the Pediatric Hospital Medicine 2012 meeting.
This view is formed in part by a recent study at his institution, in which video EEG monitoring revealed that more than one-third of children admitted for encephalopathy (35%) were in nonconvulsive status epilepticus. Almost all had convulsive seizures prior to presenting (92%) and more than half were being cared for on the floor (Pediatrics 2012;129:e748-55).
Similarly, an earlier study reported that up to 22% of children who had prolonged EEG monitoring after convulsive SE were found to be in nonconvulsive SE (Neurology 2010;74:636-42).
"These are the kids that I think really fall through the cracks for us – the ones that got a bunch of meds in the ER and are admitted to the floor for observation because they’re ‘sleepy’ or need to ‘wake up,’ " Dr. Basu said. "But you don’t know actually that they’ve recovered, and every minute that you let them go – every minute that you don’t know they’re in nonconvulsive status – is a problem."
He acknowledged that not every institution has the capacity for emergency EEG monitoring but said the idea is for clinicians to think about an EEG at 7 or 8 a.m. rather than 2 p.m.
The International League Against Epilepsy (ILAE) defined status epilepticus in 1993 as more than 30 minutes of continuous epileptic activity without complete recovery of consciousness, although more recent definitions have shortened the duration to 20, 15, or even 5 minutes of continuous seizure activity.
Essential to the management of SE is an understanding of the inciting disease and that seizures are neurotoxic, said Dr. Basu, lead for the hospital working group on management of refractory SE.
"Seizures are not a benign thing, even if you stop them," he said. "They’re a pre-status state. Your brain is on fire and that fire needs to be put out."
Multiple diagnostic algorithms for SE exist, including one by the ILAE that is expected to be revised soon, but most are center specific or user specific. The common thread, however, is that time matters, both for treatment response and outcomes.
"If you don’t act quickly, the outcome on the backside is severe," Dr. Basu said. "Even if they don’t die, which some kids unfortunately do, there is an increased incidence of epilepsy syndrome and poor neurologic recovery."
Indeed, the Mayo Clinic reported (Epilepsia 2008;49:615-25) that seizures stopped in 100% of children with SE receiving an additional second-line therapy within less than 60 minutes of the first drug, compared with only 22% of those receiving additional second-line therapy later in the clinical course. (Patients were allowed two second-line therapies before third-line treatment.)
Children in that study’s refractory SE group were significantly less likely than those treated more aggressively to return to baseline neurological status and more likely to die during hospitalization (see graph), and they had a twofold higher risk of developing a new neurological deficit or epilepsy at 4-year follow-up. (Researchers defined the refractory group as "clinical or electrographic seizures lasting longer than 60 minutes despite treatment with at least one first-line AED and one second-line AED.")
"The point is that if you follow some kind of time algorithm and deliver meds early and aggressively, you can get ahead of this and may stop status from developing," Dr. Basu said.
A continuing challenge is predicting which child presenting with SE will progress to refractory SE and likely end up in the ICU on burst suppression. To this end, Cincinnati Children’s recently launched the PARSE (Pediatric Acute Refractory Status Epilepticus) Initiative to derive a predictive model that may actually trigger a change in the "tempo" of SE management, he said.
Until predictive modeling becomes a reality, in-hospital and at-home seizure plans are being created. The London-Innsbruck Colloquium on Acute Seizures and Status Epilepticus has penned several SE protocols, with a recent review (Curr. Opin. Neurol. 2011;24:165-70) detailing treatment advances since the first colloquium was held in 2007.
Hospitals are also developing at-home seizure plans that may be tailored to individual at-risk patients, featuring a red, yellow, and green light system similar to that used in at-home asthma action plans. Parents may understand the idea of giving rectal diazepam (Valium, Valrelease) at home, but such remote plans can help address questions such as when a second therapy should be delivered, the correct dosing of benzodiazepines, or when to come to the hospital, Dr. Basu said at the meeting, which was sponsored by the Society of Hospital Medicine, the American Academy of Pediatrics, and the Academic Pediatric Association.
Dr. Basu reported no relevant conflicts of interest.
EEG, nonconvulsive status epilepticus in children, seizures, Dr. Rajit K. Basu, Pediatric Hospital Medicine, convulsive seizures, prolonged EEG monitoring, The International League Against Epilepsy, ILAE,
EEG, nonconvulsive status epilepticus in children, seizures, Dr. Rajit K. Basu, Pediatric Hospital Medicine, convulsive seizures, prolonged EEG monitoring, The International League Against Epilepsy, ILAE,
EXPERT ANALYSIS FROM THE PEDIATRIC HOSPITAL MEDICINE 2012 MEETING

No Easy Answers as Quality Measures for Pediatric Readmissions Loom
COVINGTON, KY. – A healthy 2-year-old is admitted for incision and drainage of a MRSA thigh abscess and is given intravenous clindamycin during a 1-day hospital stay before being discharged home with a prescription for oral clindamycin.
The child refuses to take the clindamycin at home, and is readmitted 3 days later with a new abscess on her arm that requires a 2-day hospital stay.
Was this readmission preventable?
Some attendees at the Pediatric Hospital Medicine 2012 meeting thought it was out of the hospital’s hands, while others suggested the hospital was at fault because clindamycin is such an unpalatable medication that an oral dose should have been given at the hospital, along with instructions for how to make it more palatable at home.
The scenario is part of the ongoing Vanderbilt Readmissions Project, which seeks to identify patient and hospitalization characteristics of 15-day readmissions in children, create a 5-point "preventability scale" for early pediatric readmissions that can be applied by multiple reviewers, and institute measures to decrease potentially preventable readmissions.

What the investigators have found so far is that, even after reviewing the same clinical information for 200 pediatric readmissions, a panel of four knowledgeable pediatricians gave exactly the same ratings in 37.5% of cases, Dr. James C. Gay said. There was 94% agreement on planned readmissions (47/50 cases), but only 19% agreement on unplanned readmissions (28/150).
"Further studies are needed to develop concrete rules for assessing preventability that can be applied reproducibly by multiple reviewers in multiple types of readmissions," he said.
The Vanderbilt findings have financial implications for hospitals, as the federal government has already taken to heart the issue of preventable readmissions following the sentinel article reporting that 19.6% of Medicare beneficiaries were readmitted within 30 days at a cost of $17.4 billion in 2004 (N. Engl. J. Med. 2009;360:1418-28). Many of these readmissions were thought to be avoidable by improvements in care and the discharge planning processes during the initial hospitalization.
The Affordable Care Act has also taken up the issue, and beginning Oct. 1, 2012, prospective payment system (PPS) hospitals will experience decreased Medicare payments for three index admissions – myocardial infarction, heart failure, and pneumonia – with "higher than expected" 30-day readmissions, coauthor Dr. Paul Hain explained at the meeting, which was sponsored by the Society of Hospital Medicine, the American Academy of Pediatrics, and the Academic Pediatric Association.
The Centers for Medicare and Medicaid Services (CMS) will calculate hospitals’ actual readmissions, excluding planned readmissions and readmissions unrelated to the index admission, and then compare these to hospitals’ expected readmission rates. Hospitals with "higher than expected" rates will be required to pay back the payments they’ve received for readmissions deemed to be excessive.
Beginning in 2015, the CMS may expand the list of conditions to include chronic obstructive pulmonary disease and several cardiac and vascular surgical procedures, he said. Similar penalties are likely to befall children’s hospitals, as rules that start in Medicare trickle down to Medicaid in 3-5 years.
Part of the problem is that researchers have yet to identify what can reliably drive down adult or pediatric readmissions or even determine whether the readmission interval should be 3, 7, 15, 60, 90, 365, or 30 days, as the CMS uses.

"We looked at 30 days, and the noise that comes in is incredible," said Dr. Hain, now with Children’s Medical Center, Dallas. Ultimately, the researchers chose 15 days for their analyses because of the intuitively greater relationship to events in the index hospitalization.
Based on 4-year data from Monroe Carell Jr. Children’s Hospital at Vanderbilt in Nashville, Tenn., the 15-day readmission rate among non-newborns was 9.6% in 2007, 9.6% in 2008, 8.8% in 2009, and 8.9% in 2010; and among newborns, the rates were 2.5%, 3.2%, 2.5%, and 3.0%, respectively.
The first real global study of pediatric readmissions reported that 16.7% of patients between 2 and 18 years old at 38 U.S. children’s hospitals were readmitted within 365 days, and that readmissions were strongly associated with any complex chronic condition, female gender, older age, black race, public insurance coverage, longer length of stay during the initial admission, and number of previous admissions (Pediatrics 2009;123:286-93).
One year later, the same group reported that the likelihood of readmission among children aged 2-18 years actually increased as a states’ health system performance ranking improved (J. Pediatr. 2010;157:98-102.e1), observed Dr. Gay of the Children’s Hospital at Vanderbilt.
Similarly vexing results have been observed among adults. The Mayo Clinic in Rochester, Minn., recently reported that general medicine patients with a documented follow-up appointment were slightly more likely to have a hospital readmission, make an emergency department visit, or die within 180 days after discharge than those without an appointment (Arch. Intern. Med. 2010;170:955-60).
In the Vanderbilt cohort, the final expert consensus was that 40 early readmissions (20%) were more likely preventable (ratings 4 and 5). Nearly half of these were central venous catheter infections or ventriculo-peritoneal shunt malfunctions in children with serious chronic illnesses.
Extrapolating these results, about 1.7% of all hospital admissions would have a significant degree of preventability, Dr. Gay said. In absolute terms, about 250 admissions per year, or less than one admission per day, would be preventable at the Children’s Hospital at Vanderbilt.
"With 80% of readmissions planned or likely not preventable, it seems unreasonable to believe that pediatric readmissions are associated with substandard inpatient care, calling into question the validity of an all-cause readmission rate as a quality measure," he said. "If the responsibility for pediatric readmissions is placed on the hospital, then realistic benchmarks should be established."
Dr. Gay said more data is also needed from across the country, with some of that information trickling in from the recent Pediatric Academic Societies meeting. Various investigators reported that there was no relationship between length of stay and pediatric readmissions; 30-day readmission rates were low at 2%-8% in the top 10 APR-DRG (All Patient Refined Diagnosis Related Groups) hospitals; and significant variability exists in readmission rates across hospitals for 10 of the top 30 APR-DRG index admissions.
"This may be where we need to hone our efforts," Dr. Gay said. "If there’s variability, there may be a reason for that variability that we can have an impact on."
Dr. Gay reported funding support for medical consulting for the National Association of Children’s Hospitals and Related Institutions. Dr. Hain reported no conflicts of interest.
COVINGTON, KY. – A healthy 2-year-old is admitted for incision and drainage of a MRSA thigh abscess and is given intravenous clindamycin during a 1-day hospital stay before being discharged home with a prescription for oral clindamycin.
The child refuses to take the clindamycin at home, and is readmitted 3 days later with a new abscess on her arm that requires a 2-day hospital stay.
Was this readmission preventable?
Some attendees at the Pediatric Hospital Medicine 2012 meeting thought it was out of the hospital’s hands, while others suggested the hospital was at fault because clindamycin is such an unpalatable medication that an oral dose should have been given at the hospital, along with instructions for how to make it more palatable at home.
The scenario is part of the ongoing Vanderbilt Readmissions Project, which seeks to identify patient and hospitalization characteristics of 15-day readmissions in children, create a 5-point "preventability scale" for early pediatric readmissions that can be applied by multiple reviewers, and institute measures to decrease potentially preventable readmissions.
What the investigators have found so far is that, even after reviewing the same clinical information for 200 pediatric readmissions, a panel of four knowledgeable pediatricians gave exactly the same ratings in 37.5% of cases, Dr. James C. Gay said. There was 94% agreement on planned readmissions (47/50 cases), but only 19% agreement on unplanned readmissions (28/150).
"Further studies are needed to develop concrete rules for assessing preventability that can be applied reproducibly by multiple reviewers in multiple types of readmissions," he said.
The Vanderbilt findings have financial implications for hospitals, as the federal government has already taken to heart the issue of preventable readmissions following the sentinel article reporting that 19.6% of Medicare beneficiaries were readmitted within 30 days at a cost of $17.4 billion in 2004 (N. Engl. J. Med. 2009;360:1418-28). Many of these readmissions were thought to be avoidable by improvements in care and the discharge planning processes during the initial hospitalization.
The Affordable Care Act has also taken up the issue, and beginning Oct. 1, 2012, prospective payment system (PPS) hospitals will experience decreased Medicare payments for three index admissions – myocardial infarction, heart failure, and pneumonia – with "higher than expected" 30-day readmissions, coauthor Dr. Paul Hain explained at the meeting, which was sponsored by the Society of Hospital Medicine, the American Academy of Pediatrics, and the Academic Pediatric Association.
The Centers for Medicare and Medicaid Services (CMS) will calculate hospitals’ actual readmissions, excluding planned readmissions and readmissions unrelated to the index admission, and then compare these to hospitals’ expected readmission rates. Hospitals with "higher than expected" rates will be required to pay back the payments they’ve received for readmissions deemed to be excessive.
Beginning in 2015, the CMS may expand the list of conditions to include chronic obstructive pulmonary disease and several cardiac and vascular surgical procedures, he said. Similar penalties are likely to befall children’s hospitals, as rules that start in Medicare trickle down to Medicaid in 3-5 years.
Part of the problem is that researchers have yet to identify what can reliably drive down adult or pediatric readmissions or even determine whether the readmission interval should be 3, 7, 15, 60, 90, 365, or 30 days, as the CMS uses.
"We looked at 30 days, and the noise that comes in is incredible," said Dr. Hain, now with Children’s Medical Center, Dallas. Ultimately, the researchers chose 15 days for their analyses because of the intuitively greater relationship to events in the index hospitalization.
Based on 4-year data from Monroe Carell Jr. Children’s Hospital at Vanderbilt in Nashville, Tenn., the 15-day readmission rate among non-newborns was 9.6% in 2007, 9.6% in 2008, 8.8% in 2009, and 8.9% in 2010; and among newborns, the rates were 2.5%, 3.2%, 2.5%, and 3.0%, respectively.
The first real global study of pediatric readmissions reported that 16.7% of patients between 2 and 18 years old at 38 U.S. children’s hospitals were readmitted within 365 days, and that readmissions were strongly associated with any complex chronic condition, female gender, older age, black race, public insurance coverage, longer length of stay during the initial admission, and number of previous admissions (Pediatrics 2009;123:286-93).
One year later, the same group reported that the likelihood of readmission among children aged 2-18 years actually increased as a states’ health system performance ranking improved (J. Pediatr. 2010;157:98-102.e1), observed Dr. Gay of the Children’s Hospital at Vanderbilt.
Similarly vexing results have been observed among adults. The Mayo Clinic in Rochester, Minn., recently reported that general medicine patients with a documented follow-up appointment were slightly more likely to have a hospital readmission, make an emergency department visit, or die within 180 days after discharge than those without an appointment (Arch. Intern. Med. 2010;170:955-60).
In the Vanderbilt cohort, the final expert consensus was that 40 early readmissions (20%) were more likely preventable (ratings 4 and 5). Nearly half of these were central venous catheter infections or ventriculo-peritoneal shunt malfunctions in children with serious chronic illnesses.
Extrapolating these results, about 1.7% of all hospital admissions would have a significant degree of preventability, Dr. Gay said. In absolute terms, about 250 admissions per year, or less than one admission per day, would be preventable at the Children’s Hospital at Vanderbilt.
"With 80% of readmissions planned or likely not preventable, it seems unreasonable to believe that pediatric readmissions are associated with substandard inpatient care, calling into question the validity of an all-cause readmission rate as a quality measure," he said. "If the responsibility for pediatric readmissions is placed on the hospital, then realistic benchmarks should be established."
Dr. Gay said more data is also needed from across the country, with some of that information trickling in from the recent Pediatric Academic Societies meeting. Various investigators reported that there was no relationship between length of stay and pediatric readmissions; 30-day readmission rates were low at 2%-8% in the top 10 APR-DRG (All Patient Refined Diagnosis Related Groups) hospitals; and significant variability exists in readmission rates across hospitals for 10 of the top 30 APR-DRG index admissions.
"This may be where we need to hone our efforts," Dr. Gay said. "If there’s variability, there may be a reason for that variability that we can have an impact on."
Dr. Gay reported funding support for medical consulting for the National Association of Children’s Hospitals and Related Institutions. Dr. Hain reported no conflicts of interest.
AT THE PEDIATRIC HOSPITAL MEDICINE 2012 MEETING

Think Urine When Testing for Concurrent Infection in Pediatric Bronchiolitis
COVINGTON, KY. – Providers continue to rely on blood cultures to detect serious bacterial infections in children with bronchiolitis, even though urinary tract infections are the most common culprit, a chart review shows.
"Even though there is outstanding evidence in the literature that cultures are unnecessary in the vast majority of infants with clinical bronchiolitis, this practice is common, has a cost, and false-positive results can result in prolonged length of stay and exposure to antibiotics that is unnecessary," according to researcher Dr. Brian Alverson.
Dr. Alverson of Hasbro Children’s Hospital in Providence, R.I., said the chart review supports other studies that show that the rate of UTI positivity is approximately the same as reported rates of benign transient bacteriuria in infants. Indeed, the incidence of UTI in the analysis was only 2.9% among patients who underwent urine testing, and the rates of meningitis and bacteremia were zero.
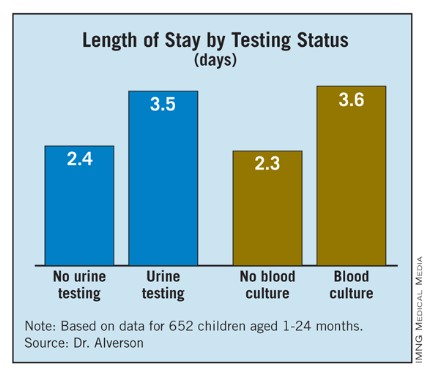
The study comprised 652 children, aged 1-24 months, with a discharge diagnosis of bronchiolitis. Of those, 26% had a blood culture obtained and 18.4% had a urinalysis or urine culture. Of patients undergoing blood cultures, 55% also had a urinalysis or urine culture.
"People who are going to look for infections aren’t looking in the right place," the study’s lead author, Dr. Jamie Librizzi, said at Pediatric Hospital Medicine 2012.

The findings are noteworthy since children in the analysis were discharged during 2007-2008 – after the American Academy of Pediatrics bronchiolitis practice guidelines recommending that clinicians should diagnose bronchiolitis and assess disease severity on the basis of history and physical examination.
The 2006 guidelines (Pediatrics 2006;118:1774-93) state that "the clinical utility of diagnostic testing in infants with suspected bronchiolitis is not well supported by evidence" and that "the occurrence of serious bacterial infections (SBIs) such as urinary tract infections (UTIs), sepsis, and meningitis is very low."
Despite the cohort being drawn from Hasbro Children’s Hospital and University of Missouri Children’s Hospital in Columbia, the misdirected testing could be explained by a knowledge gap and a wide variation in providers including residents, emergency department physicians, and referring community physicians, Dr. Librizzi said.
"Even though we know these guidelines are out there, the practices maybe still haven’t caught up to the evidence," she said. " ... It’s also hard when a kid comes in febrile, not looking great, to sit back and be assured that the numbers are really low for a concurrent infection."

"It’s a good reminder that we still have work to do educating our emergency departments," Dr. Paul Hain, now with Children’s Medical Center, Dallas, commented in a separate interview. "A lot of kids are seen in adult EDs, and folks who are not familiar with children are mostly scared of adult bacteremia and think that blood cultures are what they need, even though bronchiolitis is a special subset."
Children who were evaluated for an SBI received significantly more antibiotics and had significantly longer hospital stays, said Dr. Librizzi, formerly with Hasbro and now a hospitalist fellow at Children’s National Medical Center in Washington.
Length of stay (LOS) was 3.6 days for patients with blood cultures and 2.3 days for those without blood cultures, and 3.5 days for patients undergoing urine testing alone vs. 2.4 days for those without urine testing More than half (56.6%) of patients who underwent testing for an SBI received antibiotics, compared with 24% who did not.
Specifically, the percent of children receiving antibiotics was 17.5% among children with no urine testing (48/445); 48.6% for those with urine testing (51/105); 14% for those without blood cultures (58/411); and 51% for those with blood cultures (71/139), Dr. Librizzi said.
LOS for patients without an SBI who were on antibiotics was significantly longer than for patients off antibiotics (3.7 days vs. 2.5 days).
All of the children in the study were deemed to have bronchiolitis based on the note of the ED physician, or the ward’s physician for direct admissions. Their mean age was 5.6 months, 19% were premature infants, and 57% were male.
Patients were considered positive for a UTI if cultures grew more than 10,000 colony-forming U/mL of a single organism, or in the absence of culture results, if urinalysis was positive for leukocyte esterase and/or nitrites with evidence of pyuria (more than five white blood cells/high-power field).
Patients were considered bacteremic if blood cultures were positive for a pathogen not deemed a contaminant in more than one set, the authors reported in a poster at the meeting, sponsored by the Society of Hospital Medicine, American Academy of Pediatrics, and Academic Pediatric Association.
The authors and Dr. Hain reported no conflicts of interest. Printing of the poster was funded by a Thrasher Research Fund Early Career Award.
The ABIM Foundation has embarked on a "Choosing Wisely" campaign to identify five tests and procedures in each field of medicine whose necessity should be questioned. Blood cultures and urine testing are key candidates in the field of pediatrics.
|

Researchers Dr. M. Olivia Titus and Dr. Seth W. Wright (Pediatrics 2003;112:282-84) could barely justify urine testing in the febrile 4-week-old with respiratory syncytial virus (RSV), much less blood taking cultures. The widespread use of those tests in infants with clinical bronchiolitis who are older that 8 weeks of age, as is well documented in this new study, appears to be wasteful, even harmful.
Dr. Kevin Powell is with the department of pediatrics at St. Louis University and a pediatric hospitalist at SSM Cardinal Glennon Children’s Medical Center in St. Louis. He reports having no relevant conflicts of interest.
The ABIM Foundation has embarked on a "Choosing Wisely" campaign to identify five tests and procedures in each field of medicine whose necessity should be questioned. Blood cultures and urine testing are key candidates in the field of pediatrics.
|
Researchers Dr. M. Olivia Titus and Dr. Seth W. Wright (Pediatrics 2003;112:282-84) could barely justify urine testing in the febrile 4-week-old with respiratory syncytial virus (RSV), much less blood taking cultures. The widespread use of those tests in infants with clinical bronchiolitis who are older that 8 weeks of age, as is well documented in this new study, appears to be wasteful, even harmful.
Dr. Kevin Powell is with the department of pediatrics at St. Louis University and a pediatric hospitalist at SSM Cardinal Glennon Children’s Medical Center in St. Louis. He reports having no relevant conflicts of interest.
COVINGTON, KY. – Providers continue to rely on blood cultures to detect serious bacterial infections in children with bronchiolitis, even though urinary tract infections are the most common culprit, a chart review shows.
"Even though there is outstanding evidence in the literature that cultures are unnecessary in the vast majority of infants with clinical bronchiolitis, this practice is common, has a cost, and false-positive results can result in prolonged length of stay and exposure to antibiotics that is unnecessary," according to researcher Dr. Brian Alverson.
Dr. Alverson of Hasbro Children’s Hospital in Providence, R.I., said the chart review supports other studies that show that the rate of UTI positivity is approximately the same as reported rates of benign transient bacteriuria in infants. Indeed, the incidence of UTI in the analysis was only 2.9% among patients who underwent urine testing, and the rates of meningitis and bacteremia were zero.
The study comprised 652 children, aged 1-24 months, with a discharge diagnosis of bronchiolitis. Of those, 26% had a blood culture obtained and 18.4% had a urinalysis or urine culture. Of patients undergoing blood cultures, 55% also had a urinalysis or urine culture.
"People who are going to look for infections aren’t looking in the right place," the study’s lead author, Dr. Jamie Librizzi, said at Pediatric Hospital Medicine 2012.
The findings are noteworthy since children in the analysis were discharged during 2007-2008 – after the American Academy of Pediatrics bronchiolitis practice guidelines recommending that clinicians should diagnose bronchiolitis and assess disease severity on the basis of history and physical examination.
The 2006 guidelines (Pediatrics 2006;118:1774-93) state that "the clinical utility of diagnostic testing in infants with suspected bronchiolitis is not well supported by evidence" and that "the occurrence of serious bacterial infections (SBIs) such as urinary tract infections (UTIs), sepsis, and meningitis is very low."
Despite the cohort being drawn from Hasbro Children’s Hospital and University of Missouri Children’s Hospital in Columbia, the misdirected testing could be explained by a knowledge gap and a wide variation in providers including residents, emergency department physicians, and referring community physicians, Dr. Librizzi said.
"Even though we know these guidelines are out there, the practices maybe still haven’t caught up to the evidence," she said. " ... It’s also hard when a kid comes in febrile, not looking great, to sit back and be assured that the numbers are really low for a concurrent infection."
"It’s a good reminder that we still have work to do educating our emergency departments," Dr. Paul Hain, now with Children’s Medical Center, Dallas, commented in a separate interview. "A lot of kids are seen in adult EDs, and folks who are not familiar with children are mostly scared of adult bacteremia and think that blood cultures are what they need, even though bronchiolitis is a special subset."
Children who were evaluated for an SBI received significantly more antibiotics and had significantly longer hospital stays, said Dr. Librizzi, formerly with Hasbro and now a hospitalist fellow at Children’s National Medical Center in Washington.
Length of stay (LOS) was 3.6 days for patients with blood cultures and 2.3 days for those without blood cultures, and 3.5 days for patients undergoing urine testing alone vs. 2.4 days for those without urine testing More than half (56.6%) of patients who underwent testing for an SBI received antibiotics, compared with 24% who did not.
Specifically, the percent of children receiving antibiotics was 17.5% among children with no urine testing (48/445); 48.6% for those with urine testing (51/105); 14% for those without blood cultures (58/411); and 51% for those with blood cultures (71/139), Dr. Librizzi said.
LOS for patients without an SBI who were on antibiotics was significantly longer than for patients off antibiotics (3.7 days vs. 2.5 days).
All of the children in the study were deemed to have bronchiolitis based on the note of the ED physician, or the ward’s physician for direct admissions. Their mean age was 5.6 months, 19% were premature infants, and 57% were male.
Patients were considered positive for a UTI if cultures grew more than 10,000 colony-forming U/mL of a single organism, or in the absence of culture results, if urinalysis was positive for leukocyte esterase and/or nitrites with evidence of pyuria (more than five white blood cells/high-power field).
Patients were considered bacteremic if blood cultures were positive for a pathogen not deemed a contaminant in more than one set, the authors reported in a poster at the meeting, sponsored by the Society of Hospital Medicine, American Academy of Pediatrics, and Academic Pediatric Association.
The authors and Dr. Hain reported no conflicts of interest. Printing of the poster was funded by a Thrasher Research Fund Early Career Award.
AT THE PEDIATRIC HOSPITAL MEDICINE 2012 MEETING
Major Finding: Obtaining a blood or urine culture increased the length of stay by more than 1 full day (3.6 days vs. 2.3 days for patients with and without blood cultures, respectively; 3.5 vs. 2.4 days for patients with and without urine testing alone, respectively).
Data Source: Retrospective chart review of 652 hospitalized patients, aged 1-24 months.
Disclosures: The authors and Dr. Hain reported no conflicts of interest. Printing of the poster was funded by a Thrasher Research Fund Early Career Award.

Tinkering With Elective Repeat Cesarean Timing Proves Tricky
MINNEAPOLIS – Shifting the timing of elective repeat cesareans to late term may have the unintended consequence of increasing the proportion of women needing an emergency cesarean section, results of a new study suggest.
Moreover, these emergency deliveries were associated with a twofold increased risk of adverse maternal and neonatal outcomes after adjustment for confounders, Jennifer Hutcheon, Ph.D., said at the annual meeting of the Society for Pediatric and Perinatal Epidemiologic Research.

Previous studies have established that elective repeat cesarean sections performed at early-term gestation, 37-38 weeks, have higher rates of neonatal respiratory complications than late-term deliveries at 39-41 weeks.
The American College of Obstetricians and Gynecologists (ACOG) discourages elective cesarean delivery before 39 weeks of gestation unless there is evidence of fetal lung maturity.
A recent report from the United States and a report from the Netherlands, however, indicate that 35%-55% of elective repeat cesarean deliveries are performed before 39 weeks, said Dr. Hutcheon, an epidemiologist in obstetrics and gynecology at the University of British Columbia, Vancouver.
"A better understanding of potential risks and their mechanisms is needed in order to make sure we implement preventive measures," she said.
To explore this, the researchers used the birth records of 9,206 low-risk women undergoing a planned repeat cesarean delivery in the British Columbia Perinatal Database Registry for 2008-2011, and calculated the correlation between institutional rates of early-term delivery and rates of emergency cesarean delivery for each of the 13 major obstetrical centers in British Columbia. Early term was defined as 37 weeks, 0 days, to 38 weeks, 6 days.
Adverse maternal outcome was defined as any occurrence of maternal mortality, cardiac arrest, obstetric shock, postpartum hemorrhage requiring transfusion or hysterectomy, mechanical ventilation through endotracheal tube, or severe medical morbidity. Adverse neonatal outcome was defined as any in-hospital newborn death, neonatal seizures, or respiratory morbidity requiring positive-pressure ventilation.
The analysis excluded women with suspected intrauterine growth restriction, multiples, congenital anomalies, diabetes, hypertension, or cardiac or renal disease.
In British Columbia, 55% of the elective repeat C-section deliveries were done before 39 weeks, Dr. Hutcheon said. There was considerable variation between institutions, with some centers performing only 35% of cases before 39 weeks and others 72%.
Overall, 15% of repeat cesarean deliveries in the province were performed under emergency timing. Once again, rates ranged between 35% and 72% at the different institutions.
There was a strong negative correlation between institutional rates of early-term delivery and emergency cesareans (r = –0.86; P less than .001), she said. For example, the institution with 72% of its elective repeat cesareans delivered before 39 weeks had fewer than 10% of women needing an emergency cesarean. On the other hand, the institution doing only 35% of elective cesareans before 39 weeks had one in three women going into labor and requiring emergency cesarean delivery.
In a univariate analysis, emergency cesarean delivery was associated with a significantly increased risk of adverse maternal outcome (odds ratio 2.1) and adverse neonatal outcome (OR 2.3), and a modest, nonsignificant increase in obstetrical wound infection (OR 1.4) and use of general anesthesia (OR 1.7), Dr. Hutcheon said.
In a multivariate analysis that adjusted for maternal age, body mass index, number of previous cesareans, and institutional obstetrical volume, the odds ratios were 2.1, 2.5, 1.2, and 1.8, for adverse maternal outcome, adverse neonatal outcome, obstetrical wound infection, and use of general anesthesia, respectively. All differences were significant except for obstetrical wound infection.
Dr. Hutcheon acknowledged that identifying the planned mode of delivery was challenging, and that some of the cesareans performed for an indication of "repeat" or "maternal request/VBAC [vaginal birth after cesarean] declined" may actually have been attempted vaginal deliveries.
To get a handle on this, the investigators looked at the time between hospital admission and when the delivery was actually performed. What they found was that the median interval was less than 3 hours, and was less than 4 hours for all of the cases with adverse outcomes.
"This is certainly more suggestive of a planned cesarean delivery rather than a failed VBAC attempt, where we would expect that interval to be quite a bit longer, although we can’t be sure," she said.
During a discussion of the results, an attendee asked whether it’s possible from the data to identify a "gestational sweet spot" that would reduce the risk of an emergency cesarean and yet be late enough to minimize the risk of adverse neonatal outcomes. Dr. Hutcheon said that is not possible from their data, and that this requires weighing two competing risks.
"You’re weighing a baby in the NICU [neonatal intensive care unit] and the potential for maternal complications, and those risks may be weighed differently by different people," she said, adding that this risk also varies depending on whether the delivery is at an academic center or a community hospital.
Finally, another attendee said the finding that institutions with high rates of repeat cesareans before 39 weeks are doing fewer emergency cesarean deliveries implies that obstetricians should be performing more cesareans before 39 weeks.
Dr. Hutcheon said, "I’m not trying to make the case that we should be doing more early-term elective cesarean deliveries. I think the point is more that we need to be more aware that if we’re introducing policies to try to shift the timing of delivery, this is going to be a side effect. And we need to plan for it better ... and to evaluate our policies to see if there are any adverse effects."
Perinatal Services BC sponsored the study. Dr. Hutcheon and her coauthors reported no conflicts.
MINNEAPOLIS – Shifting the timing of elective repeat cesareans to late term may have the unintended consequence of increasing the proportion of women needing an emergency cesarean section, results of a new study suggest.
Moreover, these emergency deliveries were associated with a twofold increased risk of adverse maternal and neonatal outcomes after adjustment for confounders, Jennifer Hutcheon, Ph.D., said at the annual meeting of the Society for Pediatric and Perinatal Epidemiologic Research.
Previous studies have established that elective repeat cesarean sections performed at early-term gestation, 37-38 weeks, have higher rates of neonatal respiratory complications than late-term deliveries at 39-41 weeks.
The American College of Obstetricians and Gynecologists (ACOG) discourages elective cesarean delivery before 39 weeks of gestation unless there is evidence of fetal lung maturity.
A recent report from the United States and a report from the Netherlands, however, indicate that 35%-55% of elective repeat cesarean deliveries are performed before 39 weeks, said Dr. Hutcheon, an epidemiologist in obstetrics and gynecology at the University of British Columbia, Vancouver.
"A better understanding of potential risks and their mechanisms is needed in order to make sure we implement preventive measures," she said.
To explore this, the researchers used the birth records of 9,206 low-risk women undergoing a planned repeat cesarean delivery in the British Columbia Perinatal Database Registry for 2008-2011, and calculated the correlation between institutional rates of early-term delivery and rates of emergency cesarean delivery for each of the 13 major obstetrical centers in British Columbia. Early term was defined as 37 weeks, 0 days, to 38 weeks, 6 days.
Adverse maternal outcome was defined as any occurrence of maternal mortality, cardiac arrest, obstetric shock, postpartum hemorrhage requiring transfusion or hysterectomy, mechanical ventilation through endotracheal tube, or severe medical morbidity. Adverse neonatal outcome was defined as any in-hospital newborn death, neonatal seizures, or respiratory morbidity requiring positive-pressure ventilation.
The analysis excluded women with suspected intrauterine growth restriction, multiples, congenital anomalies, diabetes, hypertension, or cardiac or renal disease.
In British Columbia, 55% of the elective repeat C-section deliveries were done before 39 weeks, Dr. Hutcheon said. There was considerable variation between institutions, with some centers performing only 35% of cases before 39 weeks and others 72%.
Overall, 15% of repeat cesarean deliveries in the province were performed under emergency timing. Once again, rates ranged between 35% and 72% at the different institutions.
There was a strong negative correlation between institutional rates of early-term delivery and emergency cesareans (r = –0.86; P less than .001), she said. For example, the institution with 72% of its elective repeat cesareans delivered before 39 weeks had fewer than 10% of women needing an emergency cesarean. On the other hand, the institution doing only 35% of elective cesareans before 39 weeks had one in three women going into labor and requiring emergency cesarean delivery.
In a univariate analysis, emergency cesarean delivery was associated with a significantly increased risk of adverse maternal outcome (odds ratio 2.1) and adverse neonatal outcome (OR 2.3), and a modest, nonsignificant increase in obstetrical wound infection (OR 1.4) and use of general anesthesia (OR 1.7), Dr. Hutcheon said.
In a multivariate analysis that adjusted for maternal age, body mass index, number of previous cesareans, and institutional obstetrical volume, the odds ratios were 2.1, 2.5, 1.2, and 1.8, for adverse maternal outcome, adverse neonatal outcome, obstetrical wound infection, and use of general anesthesia, respectively. All differences were significant except for obstetrical wound infection.
Dr. Hutcheon acknowledged that identifying the planned mode of delivery was challenging, and that some of the cesareans performed for an indication of "repeat" or "maternal request/VBAC [vaginal birth after cesarean] declined" may actually have been attempted vaginal deliveries.
To get a handle on this, the investigators looked at the time between hospital admission and when the delivery was actually performed. What they found was that the median interval was less than 3 hours, and was less than 4 hours for all of the cases with adverse outcomes.
"This is certainly more suggestive of a planned cesarean delivery rather than a failed VBAC attempt, where we would expect that interval to be quite a bit longer, although we can’t be sure," she said.
During a discussion of the results, an attendee asked whether it’s possible from the data to identify a "gestational sweet spot" that would reduce the risk of an emergency cesarean and yet be late enough to minimize the risk of adverse neonatal outcomes. Dr. Hutcheon said that is not possible from their data, and that this requires weighing two competing risks.
"You’re weighing a baby in the NICU [neonatal intensive care unit] and the potential for maternal complications, and those risks may be weighed differently by different people," she said, adding that this risk also varies depending on whether the delivery is at an academic center or a community hospital.
Finally, another attendee said the finding that institutions with high rates of repeat cesareans before 39 weeks are doing fewer emergency cesarean deliveries implies that obstetricians should be performing more cesareans before 39 weeks.
Dr. Hutcheon said, "I’m not trying to make the case that we should be doing more early-term elective cesarean deliveries. I think the point is more that we need to be more aware that if we’re introducing policies to try to shift the timing of delivery, this is going to be a side effect. And we need to plan for it better ... and to evaluate our policies to see if there are any adverse effects."
Perinatal Services BC sponsored the study. Dr. Hutcheon and her coauthors reported no conflicts.
AT THE ANNUAL MEETING OF THE SOCIETY FOR PEDIATRIC AND PERINATAL EPIDEMIOLOGIC RESEARCH

Having Interpreters Down the Hall Improved Discharge Times
COVINGTON, KY. – Basing an interpreter directly inside inpatient units shaved roughly 30 minutes off a nearly 1-hour delay in discharge times for patients from Spanish-speaking families at Childrens Hospital Los Angeles.
"We have a thousand discharges per month and 60%-70% require a translator, so it made a big difference," Dr. Ara Balkian, chief medical director of inpatient operations and associate chair of inpatient pediatrics, said at the Pediatric Hospital Medicine 2012 meeting.

Prior to the intervention, interpreters were centralized in a single office away from the units and were deployed as requests were submitted. In the fourth quarter of 2010, however, a Spanish-language interpreter was stationed on one of the medical-surgical floors for 4-6 hours per day during peak weekday discharge times to assist with discharge instructions.
Between the third quarters of 2009 and 2010, there was a statistically significant difference of 41 minutes in mean discharge times between English- and Spanish-speaking families, he said. The average time between the discharge order and the patient’s actually being discharged was 2 hours 25 minutes for English-speaking families and 3 hours 6 minutes for Spanish-speaking families.
During the intervention period, the difference decreased to 23 minutes in the fourth quarter of 2010 and to 27 minutes in the first quarter of 2011, and was no longer significant, he said.
As for why times lagged for Spanish-speaking families compared with English speakers, Dr. Balkian said the investigators hypothesize that many discharge components – such as instructions, or the interpretation of pharmacy directions – all require more time to convert to the parent’s or guardian’s primary language. The findings were based on the preferred language of the adults, even if the child spoke perfect English, Dr. Balkian explained.
He said it’s possible that interpreters were spending more time educating Spanish-speaking families, who according to previously published studies may have disparities in health literacy, compared with English speakers. In addition, the use of the unit-based interpreters during discharge and rounds identified more errors in the medication reconciliation and discharge instructions of Spanish-speaking patients. This may have been the result of miscommunication with non–Spanish-speaking providers while the components of the discharge were being prepared.
As fate would have it, funding for the project dried up and the interpreters were pulled off the units in the second quarter of 2011. Once again, the disparity in discharge times between Spanish speakers and English speakers increased significantly, this time to 48 minutes, Dr. Balkian said. The team also required more translators with increased hours on the units to meet the discharge demands in a consistent way.

Based on the results and longer response times resulting from the centralized interpreter office’s move to a location farther away from the inpatient units, funding has been restored and interpreters are again based in the units.
"Anecdotally, the nurses and interpreters do believe the discharge times have improved for Spanish-speaking patients," he said.
The investigators are currently collecting data on discharge times since the second quarter of 2011, and may expand the scope of their research to other non–English-speaking patients.
In a separate study presented at the meeting, interventions to improve awareness of, access to, and accountability for interpreter usage doubled the use of interpreters in a medical unit, compared with the rest of the hospital, to about three interpreter encounters per limited English-proficiency patient-day.
Interventions included staff education, inclusion of language needs in the emergency department admissions request, instructions in how to access face-to-face interpreter services, placement of interpreter phones in all rooms at all time, and providing for documentation of interpreter usage for attending notes.
Increased interpreter usage has been sustained, compared with other inpatient units, although multiple clinical encounters still occur without interpreters, reported Dr. Padmaja Pavuluri, a pediatric hospitalist at Children’s National Medical Center in Washington, D.C.
Dr. Balkian and Dr. Pavuluri reported having no relevant conflicts of interest.
COVINGTON, KY. – Basing an interpreter directly inside inpatient units shaved roughly 30 minutes off a nearly 1-hour delay in discharge times for patients from Spanish-speaking families at Childrens Hospital Los Angeles.
"We have a thousand discharges per month and 60%-70% require a translator, so it made a big difference," Dr. Ara Balkian, chief medical director of inpatient operations and associate chair of inpatient pediatrics, said at the Pediatric Hospital Medicine 2012 meeting.
Prior to the intervention, interpreters were centralized in a single office away from the units and were deployed as requests were submitted. In the fourth quarter of 2010, however, a Spanish-language interpreter was stationed on one of the medical-surgical floors for 4-6 hours per day during peak weekday discharge times to assist with discharge instructions.
Between the third quarters of 2009 and 2010, there was a statistically significant difference of 41 minutes in mean discharge times between English- and Spanish-speaking families, he said. The average time between the discharge order and the patient’s actually being discharged was 2 hours 25 minutes for English-speaking families and 3 hours 6 minutes for Spanish-speaking families.
During the intervention period, the difference decreased to 23 minutes in the fourth quarter of 2010 and to 27 minutes in the first quarter of 2011, and was no longer significant, he said.
As for why times lagged for Spanish-speaking families compared with English speakers, Dr. Balkian said the investigators hypothesize that many discharge components – such as instructions, or the interpretation of pharmacy directions – all require more time to convert to the parent’s or guardian’s primary language. The findings were based on the preferred language of the adults, even if the child spoke perfect English, Dr. Balkian explained.
He said it’s possible that interpreters were spending more time educating Spanish-speaking families, who according to previously published studies may have disparities in health literacy, compared with English speakers. In addition, the use of the unit-based interpreters during discharge and rounds identified more errors in the medication reconciliation and discharge instructions of Spanish-speaking patients. This may have been the result of miscommunication with non–Spanish-speaking providers while the components of the discharge were being prepared.
As fate would have it, funding for the project dried up and the interpreters were pulled off the units in the second quarter of 2011. Once again, the disparity in discharge times between Spanish speakers and English speakers increased significantly, this time to 48 minutes, Dr. Balkian said. The team also required more translators with increased hours on the units to meet the discharge demands in a consistent way.
Based on the results and longer response times resulting from the centralized interpreter office’s move to a location farther away from the inpatient units, funding has been restored and interpreters are again based in the units.
"Anecdotally, the nurses and interpreters do believe the discharge times have improved for Spanish-speaking patients," he said.
The investigators are currently collecting data on discharge times since the second quarter of 2011, and may expand the scope of their research to other non–English-speaking patients.
In a separate study presented at the meeting, interventions to improve awareness of, access to, and accountability for interpreter usage doubled the use of interpreters in a medical unit, compared with the rest of the hospital, to about three interpreter encounters per limited English-proficiency patient-day.
Interventions included staff education, inclusion of language needs in the emergency department admissions request, instructions in how to access face-to-face interpreter services, placement of interpreter phones in all rooms at all time, and providing for documentation of interpreter usage for attending notes.
Increased interpreter usage has been sustained, compared with other inpatient units, although multiple clinical encounters still occur without interpreters, reported Dr. Padmaja Pavuluri, a pediatric hospitalist at Children’s National Medical Center in Washington, D.C.
Dr. Balkian and Dr. Pavuluri reported having no relevant conflicts of interest.
AT THE PEDIATRIC HOSPITAL MEDICINE 2012 MEETING
Major Finding: The difference in discharge time delays between patients from Spanish- and English-speaking families decreased from a mean 41 minutes (when interpreters were based in a central office) to 23 minutes in 2010 and to 27 minutes in 2011 (when interpreters were based on the inpatient unit).
Data Source: This was an intervention study of interpreter services for Spanish-speaking families.
Disclosures: Dr. Balkian and Dr. Pavuluri disclosed no relevant conflicts of interest.

Pregnancy-Related Cancers: Rise Is Largely Unrelated to Delayed Childbearing
MINNEAPOLIS – Pregnancy-associated cancers are increasing, although the phenomenon of delayed childbirth is only partially responsible, researchers suggest.
From 1994 to 2008, the crude incidence of pregnancy-associated cancer increased from 112 to 192 per 100,000 pregnancies (P less than .001) in an analysis of 787,907 Australian women.
During the same period, the number of Australian mothers aged 35 years or more nearly doubled from 13% to 24%, including an increase from 2% to 4% of mothers over age 40, Christine L. Roberts, Ph.D., said at the annual meeting of the Society for Pediatric and Perinatal Epidemiologic Research.

After the cancer rate was standardized to the age of the 1994 population, however, only 14% of the increase in cancer was explained by increasing maternal age, said Dr. Roberts of the University of Sydney, New South Wales, Australia.
"Improved diagnostic techniques, detection, and interracial health services likely contribute to the unexplained portion," she said. "The increasing incidence of cancer confirmed a clinical impression that obstetricians were seeing women with cancer more frequently, although of course it remains uncommon."
The growing number of women postponing childbearing has raised concerns that the incidence of pregnancy-associated cancer would rise. The incidence is generally reported to be about 1 in 1,000 pregnancies, but estimates based largely on cancer reports have been imprecise, Dr. Roberts said.
The investigators obtained cancer and maternal information from linked cancer registry, birth, and hospital records for 1.31 million pregnancies and 1.33 million infants among 781,907 women in Australia.
During the study period, 1,798 women had a new cancer diagnosis: 499 during pregnancy and 1,299 within 12 months of delivery. This equates to 137.3 cancers per 100,000 pregnancies, Dr. Roberts said.
There were 42 cancer deaths, or 3.2 deaths per 100,000 pregnancies.
The highest proportion of cancers (14.5%) was diagnosed in the first 2 months post partum, lending support to the rationale that women and physicians may incorrectly attribute cancer-related symptoms to the physiologic changes of pregnancy and may be reluctant to use radiographs or invasive procedures during pregnancy, she observed.
The cancers were predominantly melanoma (599) or breast cancer (377), followed by thyroid/endocrine (228) and lymphohematopoietic (151) cancers.
Melanoma was twice as likely to be observed in pregnant women as in women of similar reproductive age (observed to expected ratio, 2.2), according to the authors, led by Dr. Yuen Yi (Cathy) Lee of the New South Wales Ministry of Health in North Sydney, Australia.
In prior studies, breast and thyroid cancer were the most common pregnancy-related cancers in California in the 1990s (Am. J. Obstet. Gynecol. 2003;189:1128-35), whereas more recently, melanoma and cervical cancer were the most common cancers during pregnancy in Norway (J. Clin. Oncol. 2009;27:45-51), Dr. Roberts noted.
In logistic regression analysis adjusted for age, country of birth, socioeconomic status, rural residence, parity, plurality, previous cancer, and assisted reproductive technology, significant risk factors for a pregnancy-associated cancer were previous cancer diagnosis (adjusted odds ratio, 3.8), multiple pregnancy (OR, 1.5), age 30-34 years (OR, 2.1), age 35-39 years (OR, 3.0), and age 40 years or older (OR, 3.6).
Women with a cancer diagnosis had a significantly higher risk of thromboembolic events (OR, 10.2), sepsis (OR, 4.3), and life-threatening maternal morbidity (OR, 6.9) after adjustment for maternal age, socioeconomic status, plurality, parity, previous preterm birth, diabetes, and hypertension.
A novel finding was that cancer during pregnancy also was associated with large-for-gestational age infants (OR, 1.5), said Dr. Roberts, who pointed out that large-for-gestational age is also a risk factor for pediatric cancer.
"Elevated levels of maternal hormone angiogenic factors during pregnancy may influence both infant size and tumor growth," she speculated.
Dr. Roberts said there is an Australian national policy on cervical screening recommending that Pap smears be offered to every woman presenting for antenatal care who has not had cervical screening within the past 2 years; however, this was introduced in 2008 at the end of the study period. "We are not aware of other policies for screening during pregnancy," she added.
Full details of the study are expected to be published in the coming weeks (BJOG 2012 [doi: 10.111/j.1471-0528.2012.03475.x]).
The authors report no conflicts of interest.
postponing childbearing, pregnancy-associated cancer,
MINNEAPOLIS – Pregnancy-associated cancers are increasing, although the phenomenon of delayed childbirth is only partially responsible, researchers suggest.
From 1994 to 2008, the crude incidence of pregnancy-associated cancer increased from 112 to 192 per 100,000 pregnancies (P less than .001) in an analysis of 787,907 Australian women.
During the same period, the number of Australian mothers aged 35 years or more nearly doubled from 13% to 24%, including an increase from 2% to 4% of mothers over age 40, Christine L. Roberts, Ph.D., said at the annual meeting of the Society for Pediatric and Perinatal Epidemiologic Research.
After the cancer rate was standardized to the age of the 1994 population, however, only 14% of the increase in cancer was explained by increasing maternal age, said Dr. Roberts of the University of Sydney, New South Wales, Australia.
"Improved diagnostic techniques, detection, and interracial health services likely contribute to the unexplained portion," she said. "The increasing incidence of cancer confirmed a clinical impression that obstetricians were seeing women with cancer more frequently, although of course it remains uncommon."
The growing number of women postponing childbearing has raised concerns that the incidence of pregnancy-associated cancer would rise. The incidence is generally reported to be about 1 in 1,000 pregnancies, but estimates based largely on cancer reports have been imprecise, Dr. Roberts said.
The investigators obtained cancer and maternal information from linked cancer registry, birth, and hospital records for 1.31 million pregnancies and 1.33 million infants among 781,907 women in Australia.
During the study period, 1,798 women had a new cancer diagnosis: 499 during pregnancy and 1,299 within 12 months of delivery. This equates to 137.3 cancers per 100,000 pregnancies, Dr. Roberts said.
There were 42 cancer deaths, or 3.2 deaths per 100,000 pregnancies.
The highest proportion of cancers (14.5%) was diagnosed in the first 2 months post partum, lending support to the rationale that women and physicians may incorrectly attribute cancer-related symptoms to the physiologic changes of pregnancy and may be reluctant to use radiographs or invasive procedures during pregnancy, she observed.
The cancers were predominantly melanoma (599) or breast cancer (377), followed by thyroid/endocrine (228) and lymphohematopoietic (151) cancers.
Melanoma was twice as likely to be observed in pregnant women as in women of similar reproductive age (observed to expected ratio, 2.2), according to the authors, led by Dr. Yuen Yi (Cathy) Lee of the New South Wales Ministry of Health in North Sydney, Australia.
In prior studies, breast and thyroid cancer were the most common pregnancy-related cancers in California in the 1990s (Am. J. Obstet. Gynecol. 2003;189:1128-35), whereas more recently, melanoma and cervical cancer were the most common cancers during pregnancy in Norway (J. Clin. Oncol. 2009;27:45-51), Dr. Roberts noted.
In logistic regression analysis adjusted for age, country of birth, socioeconomic status, rural residence, parity, plurality, previous cancer, and assisted reproductive technology, significant risk factors for a pregnancy-associated cancer were previous cancer diagnosis (adjusted odds ratio, 3.8), multiple pregnancy (OR, 1.5), age 30-34 years (OR, 2.1), age 35-39 years (OR, 3.0), and age 40 years or older (OR, 3.6).
Women with a cancer diagnosis had a significantly higher risk of thromboembolic events (OR, 10.2), sepsis (OR, 4.3), and life-threatening maternal morbidity (OR, 6.9) after adjustment for maternal age, socioeconomic status, plurality, parity, previous preterm birth, diabetes, and hypertension.
A novel finding was that cancer during pregnancy also was associated with large-for-gestational age infants (OR, 1.5), said Dr. Roberts, who pointed out that large-for-gestational age is also a risk factor for pediatric cancer.
"Elevated levels of maternal hormone angiogenic factors during pregnancy may influence both infant size and tumor growth," she speculated.
Dr. Roberts said there is an Australian national policy on cervical screening recommending that Pap smears be offered to every woman presenting for antenatal care who has not had cervical screening within the past 2 years; however, this was introduced in 2008 at the end of the study period. "We are not aware of other policies for screening during pregnancy," she added.
Full details of the study are expected to be published in the coming weeks (BJOG 2012 [doi: 10.111/j.1471-0528.2012.03475.x]).
The authors report no conflicts of interest.
postponing childbearing, pregnancy-associated cancer,
postponing childbearing, pregnancy-associated cancer,
AT THE ANNUAL MEETING OF THE SOCIETY FOR PEDIATRIC AND PERINATAL EPIDEMIOLOGIC RESEARCH

FDG-PET Performs Poorly in Lung Cancer Diagnosis
CHICAGO – The diagnostic accuracy of FDG-PET in lung cancer performed below levels described in previous reports and varied widely among U.S. centers in a secondary analysis of a large phase III clinical trial.
"FDG-PET performed poorly for diagnosing non–small cell lung cancer in a national sample of clinical stage 1 patients," Dr. Eric L. Grogan said at the annnual meeting of the of the American Society of Clinical Oncology.
The current National Comprehensive Cancer Network guidelines recommend the use of fluorodeoxyglucose positron emission tomography (FDG-PET) for the diagnosis of NSCLC based on studies showing a high degree of accuracy for this diagnostic tool, notably a sensitivity of 94% and a median specificity of 83% in a meta-analysis of 40 studies (JAMA 2001;285:914-24).
Others have reported, however, that FDG-PET performs poorly at single institutions in regions of endemic fungal lung diseases (Ann. Thor. Surg. 2011;92:428-32 and Lung Cancer 2002;36:297-301), observed Dr. Grogan, of Vanderbilt-Ingram Cancer Center in Nashville, Tenn.
Among 682 patients in the American College of Surgeons Oncology Group (ACOSOG) Z4031 trial, the overall accuracy of FDG-PET was 73%, the sensitivity 82%, and the specificity only 31%.
The series is the largest to date evaluating the accuracy of FDG-PET in patients with known or suspected clinical stage 1 NSCLC. In addition, it is generalizable to clinical practice because multiple FDG-PET scanners were used and the scans were performed in community and academic centers and interpreted by multiple radiologists, Dr. Grogan said.
"Results of PET scans in this population should be interpreted cautiously, and reasons for the poor test performance should be explored in other studies," he said.
Discussant Dr. Tetsuya Mitsudomi, who is the chief of thoracic surgery at Aichi Cancer Center Hospital in Nagoya, Japan, said FDG-PET shows reasonable sensitivity, but very low specificity compared with previous studies.
"I think this reflects the real world," he said. "So, the lung cancer diagnosis cannot be made on the basis of PET positivity alone."
Investigators at 51 sites in 39 cities enrolled 969 patients with known or clinically suspicious stage 1 lesions between 2004 and 2006 to evaluate the value of proteomic analysis in diagnosing NSCLC (the results were presented at ASCO 2010). FDG-PET scans were available for 682 patients. All underwent surgical resection. Analyses were performed for all patients and for sites with more than 25 patients.
PET avidity was determined by the radiologist’s description of lesion activity or by the reported maximum standard uptake value (SUV). Avidity was classified in four categories: category 1 was no avidity/not cancer (SUV = 0), category 2 was low avidity/not likely cancer (SUV 0 to less than 2.5), category 3 was avidity/possibly cancer (SUV 2.5 to less than 5.0), and category 4 was high avidity/likely cancer (SUV 5.0 or more).
Among the 682 patients, there were 566 cancers and 116 benign cases. In all, 82% of the cancerous lesions were PET avid, and "surprisingly, 69% of the benign lesions were avid," Dr. Grogan said.
Patients with cancer were significantly older (67 vs. 61 years; P less than .001) and had larger lesions (26 mm vs. 20 mm; P less than .001).
The positive predictive value of FDG-PET was 85% and negative predictive value 26%. This translates into 80 false positives and 101 false negatives. The majority of false positives were found to be granulomas (69%), he observed. Eleven of the false negatives were 10 mm or less.
Not surprising, FDG-PET accuracy improved with lesion size, Dr. Grogan said. The accuracy was less than 50% for lesions less than 20 mm, but greater than 80% for lesions larger than 30 mm. "Above 30 mm, the accuracy did not seem to improve," he observed.
In the eight cities that had more than 25 patients, the sensitivity varied significantly, from a low of 67% in Los Angeles to a high of 91% in Durham, N.C. (P = .03), Dr. Grogan said, without explanation. Specificity ranged from 15% in Birmingham, Ala., to 46% in Philadelphia, but this did not reach statistical significance because of the small number of benign cases at each institution (P = .72).
Dr. Mitsudomi said he could not explain the reason for the heterogeneity, especially in terms of the specificity, between centers.
"It’s not possible to remove all the false positives if you use FDG, but newer tracers are being developed and they may increase the specificity rate," he added.
Dr. Grogan reported no disclosures. Dr. Mitsudomi reported having a consulting/advisory role with Boehringer Ingelheim, Kyowa Hakko Kirin, Lilly, and Pfizer, and receiving honoraria from AstraZeneca, Chugai Pharma, Lilly, and Roche.☐
Major Finding: The overall accuracy of FDG-PET was 73%, the sensitivity 82%, and the specificity only 31%.
Data Source: Secondary analysis of 682 patients with FDG-PET scans in the ACOSOG Z4031 trial of 969 patients with a clinically suspicious stage I lung lesion.
Disclosures: Dr. Grogan reported no disclosures. Dr. Mitsudomi reported having a consulting/advisory role with Boehringer Ingelheim, Kyowa Hakko Kirin, Lilly, and Pfizer, and receiving honoraria from AstraZeneca, Chugai Pharma, Lilly, and Roche.