User login
Calculations of an academic hospitalist
The term “academic hospitalist” has come to mean more than a mere affiliation to an academic medical center (AMC). Academic hospitalists perform various clinical roles like staffing house staff teams, covering nonteaching services, critical care services, procedure teams, night services, medical consultation, and comanagement services.

Over the last decade, academic hospitalists have successfully managed many nonclinical roles in areas like research, medical unit leadership, faculty development, faculty affairs, quality, safety, informatics, utilization review, clinical documentation, throughput, group management, hospital administration, and educational leadership. The role of an academic hospital is as clear as a chocolate martini these days. Here we present some recent trends in academic hospital medicine.
Compensation
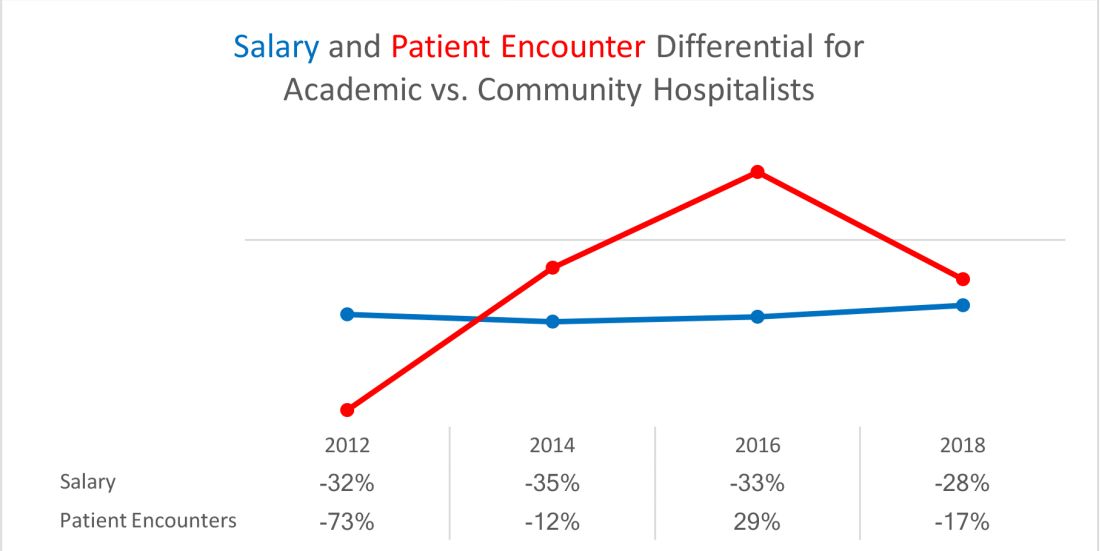
From SHM’s State of Hospital Medicine report (SoHM)2014 to 2018 data, the median compensation for U.S. academic hospitalists has risen by an average of 5.15% every year, although increases vary by rank.1 From 2016 to 2018, clinical instructors saw the most significant growth, 11.23% per year, suggesting a need to remain competitive for junior hospitalists. Compensation also varies by geographic area, with the Southern region reporting the highest compensation. Over the last decade, academic hospitalists received, on average, a 28%-35% lower salary, compared with community hospitalists.
Patient population and census
Lower patient encounters and compensation of the academic hospitalists poses the chicken or the egg dilemma. In the 2018 SoHM report, academic hospitalists had an average of 17% fewer encounters. Of note, AMC patients tend to have higher complexity, as measured by the Case Mix Index (CMI – the average diagnosis-related group weight of a hospital).2 A higher CMI is a surrogate marker for the diagnostic diversity, clinical complexity, and resource needs of the patient population in the hospital.
Productivity and financial metrics
The financial bottom line is a critical aspect, and as a report in the Journal of Hospital Medicine described, all health care executives look at business metrics while making decisions.3 Below are some significant academic and community comparisons from SoHM 2018.
- Collections, encounters, and wRVUs (work relative value units) were highly correlated. All of them were lower for academic hospitalists, corroborating the fact that they see a smaller number of patients. Clinical full-time equivalents (cFTE) is a vernacular of how much of the faculty time is devoted to clinical activities. The academic data from SoHM achieves the same target, as it is standardized to 100% billable clinical activity, so the fact that many academic hospitalists do not work a full-time clinical schedule is not a factor in their lower production.
- Charges had a smaller gap likely because of sicker patients in AMCs. The higher acuity difference can also explain 12% higher wRVU/encounter for academic hospitalists.
- The wRVU/encounter ratio can indicate a few patterns: high acuity of patients in AMCs, higher levels of evaluation and management documentation, or both. As the encounters and charges have the same percentage differences, we would place our bets on the former.
- Compensation per encounter and compensation per wRVU showed that academic hospitalists do get a slight advantage.
CMI and wRVUs
Although the SoHM does not capture information on patient acuity or CMI, we speculate that the relationship between CMI and wRVUs may be more or less linear at lower levels of acuity. However, once level III E/M billing is achieved (assuming there is no critical care provided), wRVUs/encounter plateau, even as acuity continues to increase. This plateau effect may be seen more often in high-acuity AMC settings than in community hospitals.
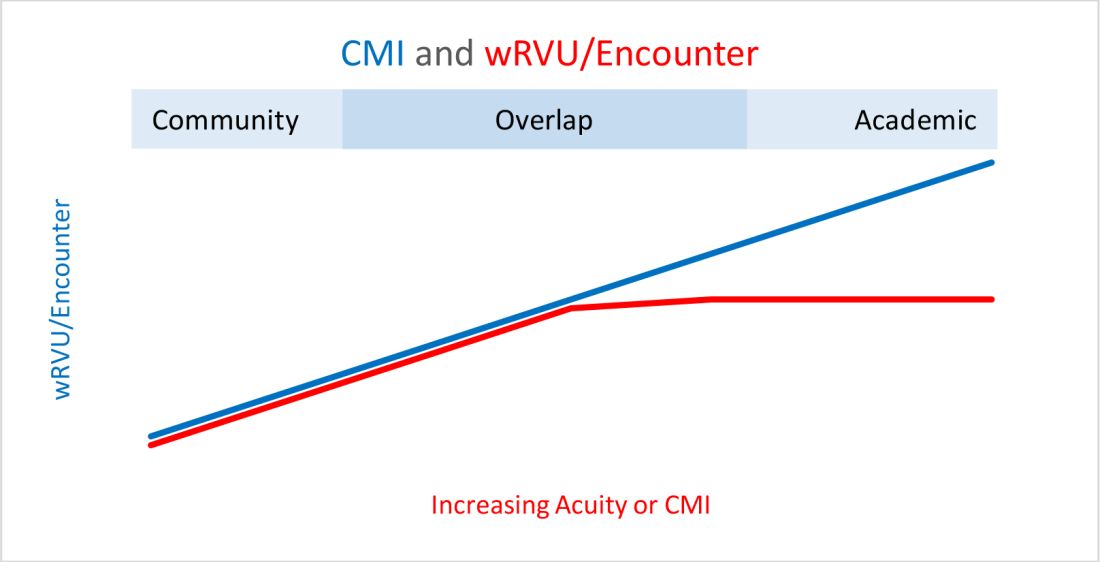
So, in our opinion, compensation models based solely on wRVU production would not do justice for hospitalists in AMC settings since these models would fail to capture the extra work involved with very-high-acuity patients. SoHM 2018 shows the financial support per wRVU for AMC is $45.81, and for the community is $41.28, an 11% difference. We think the higher financial support per wRVU for academic practices may be related to the lost wRVU potential of caring for very-high-acuity patients.
Conclusion
In an academic setting, hospitalists are reforming the field of hospital medicine and defining the ways we could deliver care. They are the pillars of collaboration, education, research, innovation, quality, and safety. It would be increasingly crucial for academic hospitalist leaders to use comparative metrics from SoHM to advocate for their group. The bottom line can be explained by the title of the qualitative study in JHM referenced above: “Collaboration, not calculation.”3

Dr. Chadha is division chief for the division of hospital medicine at the University of Kentucky Healthcare, Lexington. He actively leads efforts of recruiting, scheduling, practice analysis, and operation of the group. He is a first-time member of the practice analysis committee. Ms. Dede is division administrator for the division of hospital medicine at the University of Kentucky Healthcare. She prepares and manages budgets, liaisons with the downstream revenue teams, and contributes to the building of academic compensation models. She is serving in the practice administrators committee for the second year and is currently vice chair of the Executive Council for the Practice Administrators special interest group.
References
1. State of Hospital Medicine Report. https://www.hospitalmedicine.org/practice-management/shms-state-of-hospital-medicine/
2. Deloitte Center for Health Solutions. Academic Medical Centers: Joining forces with community providers for broad benefits and positive outcomes. 2015. https://www2.deloitte.com/us/en/pages/life-sciences-and-health-care/articles/academic-medical-centers-consolidation.html
3. White AA et al. Collaboration, not calculation: A qualitative study of how hospital executives value hospital medicine groups. J Hosp Med. 2019;14(10):662‐7.
The term “academic hospitalist” has come to mean more than a mere affiliation to an academic medical center (AMC). Academic hospitalists perform various clinical roles like staffing house staff teams, covering nonteaching services, critical care services, procedure teams, night services, medical consultation, and comanagement services.
Over the last decade, academic hospitalists have successfully managed many nonclinical roles in areas like research, medical unit leadership, faculty development, faculty affairs, quality, safety, informatics, utilization review, clinical documentation, throughput, group management, hospital administration, and educational leadership. The role of an academic hospital is as clear as a chocolate martini these days. Here we present some recent trends in academic hospital medicine.
Compensation
From SHM’s State of Hospital Medicine report (SoHM)2014 to 2018 data, the median compensation for U.S. academic hospitalists has risen by an average of 5.15% every year, although increases vary by rank.1 From 2016 to 2018, clinical instructors saw the most significant growth, 11.23% per year, suggesting a need to remain competitive for junior hospitalists. Compensation also varies by geographic area, with the Southern region reporting the highest compensation. Over the last decade, academic hospitalists received, on average, a 28%-35% lower salary, compared with community hospitalists.
Patient population and census
Lower patient encounters and compensation of the academic hospitalists poses the chicken or the egg dilemma. In the 2018 SoHM report, academic hospitalists had an average of 17% fewer encounters. Of note, AMC patients tend to have higher complexity, as measured by the Case Mix Index (CMI – the average diagnosis-related group weight of a hospital).2 A higher CMI is a surrogate marker for the diagnostic diversity, clinical complexity, and resource needs of the patient population in the hospital.
Productivity and financial metrics
The financial bottom line is a critical aspect, and as a report in the Journal of Hospital Medicine described, all health care executives look at business metrics while making decisions.3 Below are some significant academic and community comparisons from SoHM 2018.
- Collections, encounters, and wRVUs (work relative value units) were highly correlated. All of them were lower for academic hospitalists, corroborating the fact that they see a smaller number of patients. Clinical full-time equivalents (cFTE) is a vernacular of how much of the faculty time is devoted to clinical activities. The academic data from SoHM achieves the same target, as it is standardized to 100% billable clinical activity, so the fact that many academic hospitalists do not work a full-time clinical schedule is not a factor in their lower production.
- Charges had a smaller gap likely because of sicker patients in AMCs. The higher acuity difference can also explain 12% higher wRVU/encounter for academic hospitalists.
- The wRVU/encounter ratio can indicate a few patterns: high acuity of patients in AMCs, higher levels of evaluation and management documentation, or both. As the encounters and charges have the same percentage differences, we would place our bets on the former.
- Compensation per encounter and compensation per wRVU showed that academic hospitalists do get a slight advantage.
CMI and wRVUs
Although the SoHM does not capture information on patient acuity or CMI, we speculate that the relationship between CMI and wRVUs may be more or less linear at lower levels of acuity. However, once level III E/M billing is achieved (assuming there is no critical care provided), wRVUs/encounter plateau, even as acuity continues to increase. This plateau effect may be seen more often in high-acuity AMC settings than in community hospitals.
So, in our opinion, compensation models based solely on wRVU production would not do justice for hospitalists in AMC settings since these models would fail to capture the extra work involved with very-high-acuity patients. SoHM 2018 shows the financial support per wRVU for AMC is $45.81, and for the community is $41.28, an 11% difference. We think the higher financial support per wRVU for academic practices may be related to the lost wRVU potential of caring for very-high-acuity patients.
Conclusion
In an academic setting, hospitalists are reforming the field of hospital medicine and defining the ways we could deliver care. They are the pillars of collaboration, education, research, innovation, quality, and safety. It would be increasingly crucial for academic hospitalist leaders to use comparative metrics from SoHM to advocate for their group. The bottom line can be explained by the title of the qualitative study in JHM referenced above: “Collaboration, not calculation.”3
Dr. Chadha is division chief for the division of hospital medicine at the University of Kentucky Healthcare, Lexington. He actively leads efforts of recruiting, scheduling, practice analysis, and operation of the group. He is a first-time member of the practice analysis committee. Ms. Dede is division administrator for the division of hospital medicine at the University of Kentucky Healthcare. She prepares and manages budgets, liaisons with the downstream revenue teams, and contributes to the building of academic compensation models. She is serving in the practice administrators committee for the second year and is currently vice chair of the Executive Council for the Practice Administrators special interest group.
References
1. State of Hospital Medicine Report. https://www.hospitalmedicine.org/practice-management/shms-state-of-hospital-medicine/
2. Deloitte Center for Health Solutions. Academic Medical Centers: Joining forces with community providers for broad benefits and positive outcomes. 2015. https://www2.deloitte.com/us/en/pages/life-sciences-and-health-care/articles/academic-medical-centers-consolidation.html
3. White AA et al. Collaboration, not calculation: A qualitative study of how hospital executives value hospital medicine groups. J Hosp Med. 2019;14(10):662‐7.
The term “academic hospitalist” has come to mean more than a mere affiliation to an academic medical center (AMC). Academic hospitalists perform various clinical roles like staffing house staff teams, covering nonteaching services, critical care services, procedure teams, night services, medical consultation, and comanagement services.
Over the last decade, academic hospitalists have successfully managed many nonclinical roles in areas like research, medical unit leadership, faculty development, faculty affairs, quality, safety, informatics, utilization review, clinical documentation, throughput, group management, hospital administration, and educational leadership. The role of an academic hospital is as clear as a chocolate martini these days. Here we present some recent trends in academic hospital medicine.
Compensation
From SHM’s State of Hospital Medicine report (SoHM)2014 to 2018 data, the median compensation for U.S. academic hospitalists has risen by an average of 5.15% every year, although increases vary by rank.1 From 2016 to 2018, clinical instructors saw the most significant growth, 11.23% per year, suggesting a need to remain competitive for junior hospitalists. Compensation also varies by geographic area, with the Southern region reporting the highest compensation. Over the last decade, academic hospitalists received, on average, a 28%-35% lower salary, compared with community hospitalists.
Patient population and census
Lower patient encounters and compensation of the academic hospitalists poses the chicken or the egg dilemma. In the 2018 SoHM report, academic hospitalists had an average of 17% fewer encounters. Of note, AMC patients tend to have higher complexity, as measured by the Case Mix Index (CMI – the average diagnosis-related group weight of a hospital).2 A higher CMI is a surrogate marker for the diagnostic diversity, clinical complexity, and resource needs of the patient population in the hospital.
Productivity and financial metrics
The financial bottom line is a critical aspect, and as a report in the Journal of Hospital Medicine described, all health care executives look at business metrics while making decisions.3 Below are some significant academic and community comparisons from SoHM 2018.
- Collections, encounters, and wRVUs (work relative value units) were highly correlated. All of them were lower for academic hospitalists, corroborating the fact that they see a smaller number of patients. Clinical full-time equivalents (cFTE) is a vernacular of how much of the faculty time is devoted to clinical activities. The academic data from SoHM achieves the same target, as it is standardized to 100% billable clinical activity, so the fact that many academic hospitalists do not work a full-time clinical schedule is not a factor in their lower production.
- Charges had a smaller gap likely because of sicker patients in AMCs. The higher acuity difference can also explain 12% higher wRVU/encounter for academic hospitalists.
- The wRVU/encounter ratio can indicate a few patterns: high acuity of patients in AMCs, higher levels of evaluation and management documentation, or both. As the encounters and charges have the same percentage differences, we would place our bets on the former.
- Compensation per encounter and compensation per wRVU showed that academic hospitalists do get a slight advantage.
CMI and wRVUs
Although the SoHM does not capture information on patient acuity or CMI, we speculate that the relationship between CMI and wRVUs may be more or less linear at lower levels of acuity. However, once level III E/M billing is achieved (assuming there is no critical care provided), wRVUs/encounter plateau, even as acuity continues to increase. This plateau effect may be seen more often in high-acuity AMC settings than in community hospitals.
So, in our opinion, compensation models based solely on wRVU production would not do justice for hospitalists in AMC settings since these models would fail to capture the extra work involved with very-high-acuity patients. SoHM 2018 shows the financial support per wRVU for AMC is $45.81, and for the community is $41.28, an 11% difference. We think the higher financial support per wRVU for academic practices may be related to the lost wRVU potential of caring for very-high-acuity patients.
Conclusion
In an academic setting, hospitalists are reforming the field of hospital medicine and defining the ways we could deliver care. They are the pillars of collaboration, education, research, innovation, quality, and safety. It would be increasingly crucial for academic hospitalist leaders to use comparative metrics from SoHM to advocate for their group. The bottom line can be explained by the title of the qualitative study in JHM referenced above: “Collaboration, not calculation.”3
Dr. Chadha is division chief for the division of hospital medicine at the University of Kentucky Healthcare, Lexington. He actively leads efforts of recruiting, scheduling, practice analysis, and operation of the group. He is a first-time member of the practice analysis committee. Ms. Dede is division administrator for the division of hospital medicine at the University of Kentucky Healthcare. She prepares and manages budgets, liaisons with the downstream revenue teams, and contributes to the building of academic compensation models. She is serving in the practice administrators committee for the second year and is currently vice chair of the Executive Council for the Practice Administrators special interest group.
References
1. State of Hospital Medicine Report. https://www.hospitalmedicine.org/practice-management/shms-state-of-hospital-medicine/
2. Deloitte Center for Health Solutions. Academic Medical Centers: Joining forces with community providers for broad benefits and positive outcomes. 2015. https://www2.deloitte.com/us/en/pages/life-sciences-and-health-care/articles/academic-medical-centers-consolidation.html
3. White AA et al. Collaboration, not calculation: A qualitative study of how hospital executives value hospital medicine groups. J Hosp Med. 2019;14(10):662‐7.
Relapsing MS: Lower disability progression in long-term users of fingolimod
Key clinical point: Long-term exposure to fingolimod is associated with lower disability progression in patients with relapsing multiple sclerosis (MS).
Major finding: The high (≥8 years) vs. low (<8 years) exposure groups showed a smaller increase in the mean Expanded Disability Status Scale (+0.55 vs. +1.21) and lower frequencies of disability progression (34.7% vs. 56.1%; P less than .01) and wheelchair use (4.9% vs. 16.9%; P less than .0276) at 10 years.
Study details: ACROSS was a cross-sectional follow-up study of patients with relapsing MS enrolled in a phase 2 proof-of-concept study. Disability outcomes were assessed in patients grouped as per fingolimod exposure: high exposure (n=104) and low exposure (n=71).
Disclosures: The study was funded by Novartis Pharma AG, Basel, Switzerland. Amin Azmon and Davorka Tomic are employees of Novartis. The other authors reported relationships with multiple pharmaceutical companies.
Citation: Derfuss T et al. Mult Scler J Exp Transl Clin. 2020 Mar 30. doi: 10.1177/2055217320907951.
Key clinical point: Long-term exposure to fingolimod is associated with lower disability progression in patients with relapsing multiple sclerosis (MS).
Major finding: The high (≥8 years) vs. low (<8 years) exposure groups showed a smaller increase in the mean Expanded Disability Status Scale (+0.55 vs. +1.21) and lower frequencies of disability progression (34.7% vs. 56.1%; P less than .01) and wheelchair use (4.9% vs. 16.9%; P less than .0276) at 10 years.
Study details: ACROSS was a cross-sectional follow-up study of patients with relapsing MS enrolled in a phase 2 proof-of-concept study. Disability outcomes were assessed in patients grouped as per fingolimod exposure: high exposure (n=104) and low exposure (n=71).
Disclosures: The study was funded by Novartis Pharma AG, Basel, Switzerland. Amin Azmon and Davorka Tomic are employees of Novartis. The other authors reported relationships with multiple pharmaceutical companies.
Citation: Derfuss T et al. Mult Scler J Exp Transl Clin. 2020 Mar 30. doi: 10.1177/2055217320907951.
Key clinical point: Long-term exposure to fingolimod is associated with lower disability progression in patients with relapsing multiple sclerosis (MS).
Major finding: The high (≥8 years) vs. low (<8 years) exposure groups showed a smaller increase in the mean Expanded Disability Status Scale (+0.55 vs. +1.21) and lower frequencies of disability progression (34.7% vs. 56.1%; P less than .01) and wheelchair use (4.9% vs. 16.9%; P less than .0276) at 10 years.
Study details: ACROSS was a cross-sectional follow-up study of patients with relapsing MS enrolled in a phase 2 proof-of-concept study. Disability outcomes were assessed in patients grouped as per fingolimod exposure: high exposure (n=104) and low exposure (n=71).
Disclosures: The study was funded by Novartis Pharma AG, Basel, Switzerland. Amin Azmon and Davorka Tomic are employees of Novartis. The other authors reported relationships with multiple pharmaceutical companies.
Citation: Derfuss T et al. Mult Scler J Exp Transl Clin. 2020 Mar 30. doi: 10.1177/2055217320907951.
Obesity tied to accelerated retinal atrophy in MS
Key clinical point: Elevated body mass index (BMI) is independently associated with an accelerated rate of ganglion cell+inner plexiform layer (GCIPL) atrophy in patients with multiple sclerosis (MS).
Major findings: Obese (n=146; BMI, ≥30 kg/m2) vs. normal weight (n=214; BMI, 18.5-24.9 kg/m2) patients showed accelerated rate of GCIPL atrophy (−0.57%/year vs. −0.42%/year; P = .012). Atrophy rates were not significantly different between overweight (n=153; BMI, 25-29.9 kg/m2) and normal weight patients (−0.47%/year vs. −0.42%/year; P = .41). GCIPL atrophy rate accelerated by −0.011% per year with each 1 kg/m2 higher BMI (P =.003).
Study details: This observational study included 522 patients with MS from Johns Hopkins MS Center who were followed with retinal imaging for a median of 4.4 years.
Disclosures: The study was funded by the National MS Society, Race to Erase MS, and NIH/NINDS. The presenting author had no disclosures. One coauthor reported receiving support from the Race to Erase MS foundation.
Citation: Filippatou AG et al. Mult Scler. 2020 Apr 16. doi: 10.1177/1352458519900942.
Key clinical point: Elevated body mass index (BMI) is independently associated with an accelerated rate of ganglion cell+inner plexiform layer (GCIPL) atrophy in patients with multiple sclerosis (MS).
Major findings: Obese (n=146; BMI, ≥30 kg/m2) vs. normal weight (n=214; BMI, 18.5-24.9 kg/m2) patients showed accelerated rate of GCIPL atrophy (−0.57%/year vs. −0.42%/year; P = .012). Atrophy rates were not significantly different between overweight (n=153; BMI, 25-29.9 kg/m2) and normal weight patients (−0.47%/year vs. −0.42%/year; P = .41). GCIPL atrophy rate accelerated by −0.011% per year with each 1 kg/m2 higher BMI (P =.003).
Study details: This observational study included 522 patients with MS from Johns Hopkins MS Center who were followed with retinal imaging for a median of 4.4 years.
Disclosures: The study was funded by the National MS Society, Race to Erase MS, and NIH/NINDS. The presenting author had no disclosures. One coauthor reported receiving support from the Race to Erase MS foundation.
Citation: Filippatou AG et al. Mult Scler. 2020 Apr 16. doi: 10.1177/1352458519900942.
Key clinical point: Elevated body mass index (BMI) is independently associated with an accelerated rate of ganglion cell+inner plexiform layer (GCIPL) atrophy in patients with multiple sclerosis (MS).
Major findings: Obese (n=146; BMI, ≥30 kg/m2) vs. normal weight (n=214; BMI, 18.5-24.9 kg/m2) patients showed accelerated rate of GCIPL atrophy (−0.57%/year vs. −0.42%/year; P = .012). Atrophy rates were not significantly different between overweight (n=153; BMI, 25-29.9 kg/m2) and normal weight patients (−0.47%/year vs. −0.42%/year; P = .41). GCIPL atrophy rate accelerated by −0.011% per year with each 1 kg/m2 higher BMI (P =.003).
Study details: This observational study included 522 patients with MS from Johns Hopkins MS Center who were followed with retinal imaging for a median of 4.4 years.
Disclosures: The study was funded by the National MS Society, Race to Erase MS, and NIH/NINDS. The presenting author had no disclosures. One coauthor reported receiving support from the Race to Erase MS foundation.
Citation: Filippatou AG et al. Mult Scler. 2020 Apr 16. doi: 10.1177/1352458519900942.
Low fish consumption linked to small increased MS risk
Key clinical point: Low fish consumption is associated with an increased risk of developing multiple sclerosis (MS); vitamin D does not mediate this association.
Major finding: Regardless of sun exposure habits, MS risk was higher with low fish consumption, including both lean and fatty fish (odds ratio, 1.2; 95% confidence interval, 1.1-1.4). The mediation analysis revealed that the effect mediated by vitamin D deficiency on this association was very small. A significant interaction was noted between DRB1*15:01 allele and both low sun exposure and low fish consumption.
Study details: The data come from 2 Swedish population-based case-control studies (6,914 patients with MS and 6,590 control participants).
Disclosures: The study was supported by grants from the Swedish Medical Research Council, the Swedish Research Council for Health, Working Life and Welfare, the Swedish Brain Foundation, and the Swedish Society for Medical Research. Dr Olsson reported receiving grants from the Swedish Research Council, the Knut and Alice Wallenberg Foundation, and the Swedish Brain Foundation. Dr Alfredsson reported receiving grants from the Swedish Research Council, the Swedish
Research Council for Health Working Life and Welfare, and the Swedish Brain Foundation.
Citation: Hedström AK et al. Neurol Neuroimmunol Neuroinflamm. 2020 Apr 10. doi: 10.1212/NXI.0000000000000717.
Key clinical point: Low fish consumption is associated with an increased risk of developing multiple sclerosis (MS); vitamin D does not mediate this association.
Major finding: Regardless of sun exposure habits, MS risk was higher with low fish consumption, including both lean and fatty fish (odds ratio, 1.2; 95% confidence interval, 1.1-1.4). The mediation analysis revealed that the effect mediated by vitamin D deficiency on this association was very small. A significant interaction was noted between DRB1*15:01 allele and both low sun exposure and low fish consumption.
Study details: The data come from 2 Swedish population-based case-control studies (6,914 patients with MS and 6,590 control participants).
Disclosures: The study was supported by grants from the Swedish Medical Research Council, the Swedish Research Council for Health, Working Life and Welfare, the Swedish Brain Foundation, and the Swedish Society for Medical Research. Dr Olsson reported receiving grants from the Swedish Research Council, the Knut and Alice Wallenberg Foundation, and the Swedish Brain Foundation. Dr Alfredsson reported receiving grants from the Swedish Research Council, the Swedish
Research Council for Health Working Life and Welfare, and the Swedish Brain Foundation.
Citation: Hedström AK et al. Neurol Neuroimmunol Neuroinflamm. 2020 Apr 10. doi: 10.1212/NXI.0000000000000717.
Key clinical point: Low fish consumption is associated with an increased risk of developing multiple sclerosis (MS); vitamin D does not mediate this association.
Major finding: Regardless of sun exposure habits, MS risk was higher with low fish consumption, including both lean and fatty fish (odds ratio, 1.2; 95% confidence interval, 1.1-1.4). The mediation analysis revealed that the effect mediated by vitamin D deficiency on this association was very small. A significant interaction was noted between DRB1*15:01 allele and both low sun exposure and low fish consumption.
Study details: The data come from 2 Swedish population-based case-control studies (6,914 patients with MS and 6,590 control participants).
Disclosures: The study was supported by grants from the Swedish Medical Research Council, the Swedish Research Council for Health, Working Life and Welfare, the Swedish Brain Foundation, and the Swedish Society for Medical Research. Dr Olsson reported receiving grants from the Swedish Research Council, the Knut and Alice Wallenberg Foundation, and the Swedish Brain Foundation. Dr Alfredsson reported receiving grants from the Swedish Research Council, the Swedish
Research Council for Health Working Life and Welfare, and the Swedish Brain Foundation.
Citation: Hedström AK et al. Neurol Neuroimmunol Neuroinflamm. 2020 Apr 10. doi: 10.1212/NXI.0000000000000717.
Dental amalgam fillings show no association with MS
Key clinical point: Mercury-containing dental amalgam fillings (AMF) are not associated with the risk of developing multiple sclerosis (MS).
Major finding: The risk of MS with AMF did not differ significantly between patients and control participants (adjusted odds ratio [aOR], 0.823; 95% confidence interval [CI], 0.648-1.046). MS was not associated with AMF irrespective of gender (women: aOR, 0.743; 95% CI, 0.552-1.000; men: aOR, 1.006; 95% CI, 0.670-1.509).
Study details: The data come from a Taiwanese population-based case-control study of 612 participants with MS and 612 matched participants without MS.
Disclosures: No study sponsor was identified. The authors declared no conflicts of interest.
Citation: Tseng CF et al. Int J Environ Res Public Health. 2020 Apr 12. doi: 10.3390/ijerph17082637.
Key clinical point: Mercury-containing dental amalgam fillings (AMF) are not associated with the risk of developing multiple sclerosis (MS).
Major finding: The risk of MS with AMF did not differ significantly between patients and control participants (adjusted odds ratio [aOR], 0.823; 95% confidence interval [CI], 0.648-1.046). MS was not associated with AMF irrespective of gender (women: aOR, 0.743; 95% CI, 0.552-1.000; men: aOR, 1.006; 95% CI, 0.670-1.509).
Study details: The data come from a Taiwanese population-based case-control study of 612 participants with MS and 612 matched participants without MS.
Disclosures: No study sponsor was identified. The authors declared no conflicts of interest.
Citation: Tseng CF et al. Int J Environ Res Public Health. 2020 Apr 12. doi: 10.3390/ijerph17082637.
Key clinical point: Mercury-containing dental amalgam fillings (AMF) are not associated with the risk of developing multiple sclerosis (MS).
Major finding: The risk of MS with AMF did not differ significantly between patients and control participants (adjusted odds ratio [aOR], 0.823; 95% confidence interval [CI], 0.648-1.046). MS was not associated with AMF irrespective of gender (women: aOR, 0.743; 95% CI, 0.552-1.000; men: aOR, 1.006; 95% CI, 0.670-1.509).
Study details: The data come from a Taiwanese population-based case-control study of 612 participants with MS and 612 matched participants without MS.
Disclosures: No study sponsor was identified. The authors declared no conflicts of interest.
Citation: Tseng CF et al. Int J Environ Res Public Health. 2020 Apr 12. doi: 10.3390/ijerph17082637.
Medical societies advise on vitamin D in midst of COVID-19
Six medical societies from across the globe are emphasizing the importance of individuals obtaining the daily recommended dose of vitamin D, especially given the impact of the COVID-19 pandemic on outdoor time.
The statement, “Joint Guidance on Vitamin D in the Era of COVID-19,” is supported by the American Society for Bone and Mineral Research, the Endocrine Society, and the American Association of Clinical Endocrinologists, among others.
They felt the need to clarify the recommendations for clinicians. Central to the guidance is the recommendation to directly expose the skin to sunlight for 15-30 minutes per day, while taking care to avoid sunburn.
The statement noted that “vitamin D is very safe when taken at reasonable dosages and is important for musculoskeletal health. Levels are likely to decline as individuals reduce outside activity (sun exposure) during the pandemic.”
It added that “most older and younger adults can safely take 400-1000 IU daily to keep vitamin D levels within the optimal range as recommended by [the US] Institute of Medicine guidelines.”
The statement also noted that the scientific evidence clearly supports the benefits that vitamin D (in combination with calcium intake) plays in building a strong skeleton and preventing bone loss.
Other societies supporting the statement are the European Calcified Tissue Society, the National Osteoporosis Foundation, and the International Osteoporosis Foundation.
What role for vitamin D in COVID-19?
Over recent months, the role of vitamin D in relation to prevention of COVID-19 has been the subject of intense debate. Now, these societies have joined forces and endorsed evidence-based guidance to clarify the issue around obtaining the daily recommended dosage of vitamin D.
During the pandemic, orders to stay at home meant individuals were likely to spend less time outdoors and have less opportunity to draw their vitamin D directly from sunlight, which is its main source, other than a limited number of foods or as a dietary supplement, the societies explained.
However, they acknowledged that the role of vitamin D in COVID-19 remains unclear.
“The current data do not provide any evidence that vitamin D supplementation will help prevent or treat COVID-19 infection; however, our guidance does not preclude further study of the potential effects of vitamin D on COVID-19,” the joint statement said.
Research to date suggests that vitamin D may play a role in enhancing the immune response, and given prior work demonstrating a role for the activated form of vitamin D – 1,25(OH)2D – in immune responses, “further research into vitamin D supplementation in COVID-19 disease is warranted,” it added. “Trials to date have been observational and there have been no randomized, controlled trials from which firm conclusions about causal relationships can be drawn. Observational studies suggest associations between low vitamin D concentrations and higher rates of COVID-19 infection.”
Medscape Medical News previously reported on the existing observational data regarding vitamin D in COVID-19. A recent rapid evidence review by the National Institute for Health and Care Excellence failed to find any evidence that vitamin D supplementation reduces the risk or severity of COVID-19.
A version of this article originally appeared on Medscape.com.
Six medical societies from across the globe are emphasizing the importance of individuals obtaining the daily recommended dose of vitamin D, especially given the impact of the COVID-19 pandemic on outdoor time.
The statement, “Joint Guidance on Vitamin D in the Era of COVID-19,” is supported by the American Society for Bone and Mineral Research, the Endocrine Society, and the American Association of Clinical Endocrinologists, among others.
They felt the need to clarify the recommendations for clinicians. Central to the guidance is the recommendation to directly expose the skin to sunlight for 15-30 minutes per day, while taking care to avoid sunburn.
The statement noted that “vitamin D is very safe when taken at reasonable dosages and is important for musculoskeletal health. Levels are likely to decline as individuals reduce outside activity (sun exposure) during the pandemic.”
It added that “most older and younger adults can safely take 400-1000 IU daily to keep vitamin D levels within the optimal range as recommended by [the US] Institute of Medicine guidelines.”
The statement also noted that the scientific evidence clearly supports the benefits that vitamin D (in combination with calcium intake) plays in building a strong skeleton and preventing bone loss.
Other societies supporting the statement are the European Calcified Tissue Society, the National Osteoporosis Foundation, and the International Osteoporosis Foundation.
What role for vitamin D in COVID-19?
Over recent months, the role of vitamin D in relation to prevention of COVID-19 has been the subject of intense debate. Now, these societies have joined forces and endorsed evidence-based guidance to clarify the issue around obtaining the daily recommended dosage of vitamin D.
During the pandemic, orders to stay at home meant individuals were likely to spend less time outdoors and have less opportunity to draw their vitamin D directly from sunlight, which is its main source, other than a limited number of foods or as a dietary supplement, the societies explained.
However, they acknowledged that the role of vitamin D in COVID-19 remains unclear.
“The current data do not provide any evidence that vitamin D supplementation will help prevent or treat COVID-19 infection; however, our guidance does not preclude further study of the potential effects of vitamin D on COVID-19,” the joint statement said.
Research to date suggests that vitamin D may play a role in enhancing the immune response, and given prior work demonstrating a role for the activated form of vitamin D – 1,25(OH)2D – in immune responses, “further research into vitamin D supplementation in COVID-19 disease is warranted,” it added. “Trials to date have been observational and there have been no randomized, controlled trials from which firm conclusions about causal relationships can be drawn. Observational studies suggest associations between low vitamin D concentrations and higher rates of COVID-19 infection.”
Medscape Medical News previously reported on the existing observational data regarding vitamin D in COVID-19. A recent rapid evidence review by the National Institute for Health and Care Excellence failed to find any evidence that vitamin D supplementation reduces the risk or severity of COVID-19.
A version of this article originally appeared on Medscape.com.
Six medical societies from across the globe are emphasizing the importance of individuals obtaining the daily recommended dose of vitamin D, especially given the impact of the COVID-19 pandemic on outdoor time.
The statement, “Joint Guidance on Vitamin D in the Era of COVID-19,” is supported by the American Society for Bone and Mineral Research, the Endocrine Society, and the American Association of Clinical Endocrinologists, among others.
They felt the need to clarify the recommendations for clinicians. Central to the guidance is the recommendation to directly expose the skin to sunlight for 15-30 minutes per day, while taking care to avoid sunburn.
The statement noted that “vitamin D is very safe when taken at reasonable dosages and is important for musculoskeletal health. Levels are likely to decline as individuals reduce outside activity (sun exposure) during the pandemic.”
It added that “most older and younger adults can safely take 400-1000 IU daily to keep vitamin D levels within the optimal range as recommended by [the US] Institute of Medicine guidelines.”
The statement also noted that the scientific evidence clearly supports the benefits that vitamin D (in combination with calcium intake) plays in building a strong skeleton and preventing bone loss.
Other societies supporting the statement are the European Calcified Tissue Society, the National Osteoporosis Foundation, and the International Osteoporosis Foundation.
What role for vitamin D in COVID-19?
Over recent months, the role of vitamin D in relation to prevention of COVID-19 has been the subject of intense debate. Now, these societies have joined forces and endorsed evidence-based guidance to clarify the issue around obtaining the daily recommended dosage of vitamin D.
During the pandemic, orders to stay at home meant individuals were likely to spend less time outdoors and have less opportunity to draw their vitamin D directly from sunlight, which is its main source, other than a limited number of foods or as a dietary supplement, the societies explained.
However, they acknowledged that the role of vitamin D in COVID-19 remains unclear.
“The current data do not provide any evidence that vitamin D supplementation will help prevent or treat COVID-19 infection; however, our guidance does not preclude further study of the potential effects of vitamin D on COVID-19,” the joint statement said.
Research to date suggests that vitamin D may play a role in enhancing the immune response, and given prior work demonstrating a role for the activated form of vitamin D – 1,25(OH)2D – in immune responses, “further research into vitamin D supplementation in COVID-19 disease is warranted,” it added. “Trials to date have been observational and there have been no randomized, controlled trials from which firm conclusions about causal relationships can be drawn. Observational studies suggest associations between low vitamin D concentrations and higher rates of COVID-19 infection.”
Medscape Medical News previously reported on the existing observational data regarding vitamin D in COVID-19. A recent rapid evidence review by the National Institute for Health and Care Excellence failed to find any evidence that vitamin D supplementation reduces the risk or severity of COVID-19.
A version of this article originally appeared on Medscape.com.
A Treatment Option for Patients with Metastatic Squamous NSCLC Who Progressed After Platinum-Based Chemotherapy

In this supplement to Federal Practitioner,
Dr. Raja Mudad, MD, discusses:
- The burden of squamous non-small cell lung cancer among active United States military and veterans
- Available treatment options for advanced metastatic squamous NSCLC
- Clinical trial data surrounding a treatment for patients with metastatic squamous NSCLC who have progressed after platinum-based chemotherapy, that can be used as early as second-line
(06/20) PC-US-115598
In this supplement to Federal Practitioner,
Dr. Raja Mudad, MD, discusses:
- The burden of squamous non-small cell lung cancer among active United States military and veterans
- Available treatment options for advanced metastatic squamous NSCLC
- Clinical trial data surrounding a treatment for patients with metastatic squamous NSCLC who have progressed after platinum-based chemotherapy, that can be used as early as second-line
(06/20) PC-US-115598
In this supplement to Federal Practitioner,
Dr. Raja Mudad, MD, discusses:
- The burden of squamous non-small cell lung cancer among active United States military and veterans
- Available treatment options for advanced metastatic squamous NSCLC
- Clinical trial data surrounding a treatment for patients with metastatic squamous NSCLC who have progressed after platinum-based chemotherapy, that can be used as early as second-line
(06/20) PC-US-115598
AI markers can predict progression, survival in prostate cancer
An AI-based Gleason score – derived from 7,267 digitized biopsy slides, pathology reports, and clinical data from patient electronic medical records – was calculated for each of 599 prostate cancer patients.
The AI scores were compared with pathologists’ Gleason scores, which were obtained from pathology reports for each of the patients.
The two scores were “highly correlated,” according to investigators. The area under the curve (AUC) for the 7-year mortality rate was 0.667 for the AI-based scores and 0.659 for the pathologists’ scores.
The investigators also found that markers extracted using AI-based algorithms could predict disease progression in patients with low- and higher-grade disease.
Daphna Laifenfeld, PhD, chief scientific officer of Ibex Medical Analytics in Tel Aviv, reported these results in a poster at the AACR virtual meeting II. Ibex Medical Analytics is the company that developed the AI-based algorithms and Gleason score (the Ibex score).
In addition to comparing the Ibex Gleason scores with pathologists’ scores, Dr. Laifenfeld and colleagues sought to “develop AI markers – computational features extracted from slides using AI-based algorithms – that can predict disease progression in low-, and separately, higher-grade patients.”
Information extracted using the algorithms included Gleason scores; perineural invasion; and other characteristics such as inflammation, high-grade prostatic intraepithelial neoplasia, and atrophy.
“We used data ... to address each aim, analyzing hundreds of patients in each comparison, and employed logistic regression to develop the predictive models,” Dr. Laifenfeld said.
Of the 357 patients evaluated, 180 had low-grade disease, defined by a prebiopsy prostate-specific antigen (PSA) level less than 10 ng/mL (Gleason group 1), and 177 patients had higher-grade disease (Gleason group 2 or higher).
Gleason group 1 patients were considered to have progressed if they developed higher-grade cancer, underwent prostatectomy, or if their cancer had metastasized. Gleason group 2 and above patients were considered to have progressed if their cancer metastasized or if they had a postprostatectomy PSA level greater than 4 ng/ml.
In Gleason group 1 patients, combining multiple features from the pathology report with prebiopsy PSA levels was shown to predict disease progression better than prebiopsy PSA levels alone (AUC, 0.687).
“Importantly, AI markers that combine features automatically extracted by Ibex with prebiopsy PSA levels are even better associated with progression (AUC, 0.748),” Dr. Laifenfeld said.
Similarly, in the Gleason group 2 and above patients, the AI markers that combine Ibex-extracted features with prebiopsy PSA levels were also highly associated with progression (AUC, 0.862 vs. AUC, 0.77 for the non–Ibex-based approach) and can be used for patient stratification, Dr. Laifenfeld said.
“For each patient, we can predict whether or not their disease will progress,” she said. “[T]his type of stratification can then be used to support clinical disease management decisions, and [it can be used] in the course of drug development for patient stratification and trial enrichment strategies.”
Dr. Laifenfeld and some coinvestigators are employed by Ibex Medical Analytics.
SOURCE: Laifenfeld D et al. AACR 2020, Abstract 867.
An AI-based Gleason score – derived from 7,267 digitized biopsy slides, pathology reports, and clinical data from patient electronic medical records – was calculated for each of 599 prostate cancer patients.
The AI scores were compared with pathologists’ Gleason scores, which were obtained from pathology reports for each of the patients.
The two scores were “highly correlated,” according to investigators. The area under the curve (AUC) for the 7-year mortality rate was 0.667 for the AI-based scores and 0.659 for the pathologists’ scores.
The investigators also found that markers extracted using AI-based algorithms could predict disease progression in patients with low- and higher-grade disease.
Daphna Laifenfeld, PhD, chief scientific officer of Ibex Medical Analytics in Tel Aviv, reported these results in a poster at the AACR virtual meeting II. Ibex Medical Analytics is the company that developed the AI-based algorithms and Gleason score (the Ibex score).
In addition to comparing the Ibex Gleason scores with pathologists’ scores, Dr. Laifenfeld and colleagues sought to “develop AI markers – computational features extracted from slides using AI-based algorithms – that can predict disease progression in low-, and separately, higher-grade patients.”
Information extracted using the algorithms included Gleason scores; perineural invasion; and other characteristics such as inflammation, high-grade prostatic intraepithelial neoplasia, and atrophy.
“We used data ... to address each aim, analyzing hundreds of patients in each comparison, and employed logistic regression to develop the predictive models,” Dr. Laifenfeld said.
Of the 357 patients evaluated, 180 had low-grade disease, defined by a prebiopsy prostate-specific antigen (PSA) level less than 10 ng/mL (Gleason group 1), and 177 patients had higher-grade disease (Gleason group 2 or higher).
Gleason group 1 patients were considered to have progressed if they developed higher-grade cancer, underwent prostatectomy, or if their cancer had metastasized. Gleason group 2 and above patients were considered to have progressed if their cancer metastasized or if they had a postprostatectomy PSA level greater than 4 ng/ml.
In Gleason group 1 patients, combining multiple features from the pathology report with prebiopsy PSA levels was shown to predict disease progression better than prebiopsy PSA levels alone (AUC, 0.687).
“Importantly, AI markers that combine features automatically extracted by Ibex with prebiopsy PSA levels are even better associated with progression (AUC, 0.748),” Dr. Laifenfeld said.
Similarly, in the Gleason group 2 and above patients, the AI markers that combine Ibex-extracted features with prebiopsy PSA levels were also highly associated with progression (AUC, 0.862 vs. AUC, 0.77 for the non–Ibex-based approach) and can be used for patient stratification, Dr. Laifenfeld said.
“For each patient, we can predict whether or not their disease will progress,” she said. “[T]his type of stratification can then be used to support clinical disease management decisions, and [it can be used] in the course of drug development for patient stratification and trial enrichment strategies.”
Dr. Laifenfeld and some coinvestigators are employed by Ibex Medical Analytics.
SOURCE: Laifenfeld D et al. AACR 2020, Abstract 867.
An AI-based Gleason score – derived from 7,267 digitized biopsy slides, pathology reports, and clinical data from patient electronic medical records – was calculated for each of 599 prostate cancer patients.
The AI scores were compared with pathologists’ Gleason scores, which were obtained from pathology reports for each of the patients.
The two scores were “highly correlated,” according to investigators. The area under the curve (AUC) for the 7-year mortality rate was 0.667 for the AI-based scores and 0.659 for the pathologists’ scores.
The investigators also found that markers extracted using AI-based algorithms could predict disease progression in patients with low- and higher-grade disease.
Daphna Laifenfeld, PhD, chief scientific officer of Ibex Medical Analytics in Tel Aviv, reported these results in a poster at the AACR virtual meeting II. Ibex Medical Analytics is the company that developed the AI-based algorithms and Gleason score (the Ibex score).
In addition to comparing the Ibex Gleason scores with pathologists’ scores, Dr. Laifenfeld and colleagues sought to “develop AI markers – computational features extracted from slides using AI-based algorithms – that can predict disease progression in low-, and separately, higher-grade patients.”
Information extracted using the algorithms included Gleason scores; perineural invasion; and other characteristics such as inflammation, high-grade prostatic intraepithelial neoplasia, and atrophy.
“We used data ... to address each aim, analyzing hundreds of patients in each comparison, and employed logistic regression to develop the predictive models,” Dr. Laifenfeld said.
Of the 357 patients evaluated, 180 had low-grade disease, defined by a prebiopsy prostate-specific antigen (PSA) level less than 10 ng/mL (Gleason group 1), and 177 patients had higher-grade disease (Gleason group 2 or higher).
Gleason group 1 patients were considered to have progressed if they developed higher-grade cancer, underwent prostatectomy, or if their cancer had metastasized. Gleason group 2 and above patients were considered to have progressed if their cancer metastasized or if they had a postprostatectomy PSA level greater than 4 ng/ml.
In Gleason group 1 patients, combining multiple features from the pathology report with prebiopsy PSA levels was shown to predict disease progression better than prebiopsy PSA levels alone (AUC, 0.687).
“Importantly, AI markers that combine features automatically extracted by Ibex with prebiopsy PSA levels are even better associated with progression (AUC, 0.748),” Dr. Laifenfeld said.
Similarly, in the Gleason group 2 and above patients, the AI markers that combine Ibex-extracted features with prebiopsy PSA levels were also highly associated with progression (AUC, 0.862 vs. AUC, 0.77 for the non–Ibex-based approach) and can be used for patient stratification, Dr. Laifenfeld said.
“For each patient, we can predict whether or not their disease will progress,” she said. “[T]his type of stratification can then be used to support clinical disease management decisions, and [it can be used] in the course of drug development for patient stratification and trial enrichment strategies.”
Dr. Laifenfeld and some coinvestigators are employed by Ibex Medical Analytics.
SOURCE: Laifenfeld D et al. AACR 2020, Abstract 867.
FROM AACR 2020
Hyperglycemia predicts COVID-19 death even without diabetes
new research indicates.
The findings, from a retrospective analysis of 605 patients with COVID-19 seen at two hospitals in Wuhan, China, were published online July 10 in Diabetologia by Sufei Wang, of the department of respiratory and critical care medicine, Union Hospital, Tongji Medical College, Huazhong University of Science and Technology, and colleagues.
Several previous studies have demonstrated a link between hyperglycemia and worse outcomes in COVID-19, and at least one diabetes diagnosis, but this is the first to focus specifically on that group of patients.
Wang and colleagues found that a fasting blood glucose of 7.0 mmol/L (126 mg/dL) or greater on admission – present in 45.6% of those without a prior diabetes diagnosis – was an independent predictor of 28-day mortality.
Although A1c data weren’t analyzed, the population is believed to include both individuals with preexisting but undiagnosed diabetes and those without diabetes who have acute stress hyperglycemia.
“Glycemic testing and control should be recommended for all COVID-19 patients even if they do not have preexisting diabetes, as most COVID-19 patients are prone to glucose metabolic disorders,” they emphasized.
“Addressing elevated fasting blood glucose at an early stage can help clinicians better manage the condition and lower the mortality risk of COVID-19 patients,” Wang and colleagues noted.
Hyperglycemia predicts COVID-19 death, complications
The study involved consecutive patients with COVID-19 and definitive 28-day outcome and fasting blood glucose measurement on admission to two Wuhan-area hospitals between Jan. 24 to Feb. 10, 2020. A total of 605 patients did not have a previous diabetes diagnosis. They were a median age of 59 years and 53.2% were men.
Just over half, 54.4%, had a fasting blood glucose below 6.1 mmol/L (110.0 mg/dL). The rest had dysglycemia: 16.5% had a fasting blood glucose of 6.1-6.9 mmol/L (110-125 mg/dL), considered the prediabetes range, and 29.1% had a fasting blood glucose of 7 mmol/L (126 mg/dL) or above, the cutoff for diabetes.
“These results indicate that our study included both undiagnosed diabetic patients and nondiabetic patients with hyperglycemia caused by an acute blood glucose disorder,” the authors noted.
Over 28 days of hospitalization, 18.8% (114) of the patients died and 39.2% developed one or more in-hospital complications.
The authors used the CRB-65 score, which assigns 1 point for each of four indicators – confusion, respiratory rate >30 breaths/min, systolic blood pressure ≤90 mm Hg or diastolic blood pressure ≤60 mm Hg, and age ≥65 years – to assess pneumonia severity.
Just over half, 55.2%, had a CRB-65 score of 0, 43.1% had a score of 1-2, and 1.7% had a score of 3-4.
In multivariable analysis, significant independent predictors of 28-day mortality were age (hazard ratio, 1.02), male sex (HR, 1.75), CRB-65 score 1-2 (HR, 2.68), CRB-65 score 3-4 (HR, 5.25), and fasting blood glucose ≥7.0 mmol/L (HR, 2.30).
Compared with patients with normal glucose (<6.1 mmol/L), 28-day mortality was twice as high (HR, 2.06) for those with a fasting blood glucose of 6.1-6.9 mmol/L and more than threefold higher for ≥7.0 mmol/L (HR, 3.54).
Pneumonia severity also predicted 28-day mortality, with hazard ratios of 4.35 and 13.80 for patients with CRB-65 scores of 1-2 and 3-4, respectively, compared with 0.
Inhospital complications, including acute respiratory distress syndrome or acute cardiac, kidney, or liver injury or cerebrovascular accident, occurred in 14.2%, 7.9%, and 17.0% of those in the lowest to highest fasting blood glucose groups.
Complications were more than twice as common in patients with a fasting blood glucose of 6.1-6.9 mmol/L (HR, 2.61) and four times more common (HR, 3.99) among those with a fasting blood glucose ≥7.0 mmol/L, compared with those with normoglycemia.
The study was supported by the National Natural Science Foundation of China and Major Projects of the National Science and Technology. The authors have reported no relevant financial relationships.
This article first appeared on Medscape.com.
new research indicates.
The findings, from a retrospective analysis of 605 patients with COVID-19 seen at two hospitals in Wuhan, China, were published online July 10 in Diabetologia by Sufei Wang, of the department of respiratory and critical care medicine, Union Hospital, Tongji Medical College, Huazhong University of Science and Technology, and colleagues.
Several previous studies have demonstrated a link between hyperglycemia and worse outcomes in COVID-19, and at least one diabetes diagnosis, but this is the first to focus specifically on that group of patients.
Wang and colleagues found that a fasting blood glucose of 7.0 mmol/L (126 mg/dL) or greater on admission – present in 45.6% of those without a prior diabetes diagnosis – was an independent predictor of 28-day mortality.
Although A1c data weren’t analyzed, the population is believed to include both individuals with preexisting but undiagnosed diabetes and those without diabetes who have acute stress hyperglycemia.
“Glycemic testing and control should be recommended for all COVID-19 patients even if they do not have preexisting diabetes, as most COVID-19 patients are prone to glucose metabolic disorders,” they emphasized.
“Addressing elevated fasting blood glucose at an early stage can help clinicians better manage the condition and lower the mortality risk of COVID-19 patients,” Wang and colleagues noted.
Hyperglycemia predicts COVID-19 death, complications
The study involved consecutive patients with COVID-19 and definitive 28-day outcome and fasting blood glucose measurement on admission to two Wuhan-area hospitals between Jan. 24 to Feb. 10, 2020. A total of 605 patients did not have a previous diabetes diagnosis. They were a median age of 59 years and 53.2% were men.
Just over half, 54.4%, had a fasting blood glucose below 6.1 mmol/L (110.0 mg/dL). The rest had dysglycemia: 16.5% had a fasting blood glucose of 6.1-6.9 mmol/L (110-125 mg/dL), considered the prediabetes range, and 29.1% had a fasting blood glucose of 7 mmol/L (126 mg/dL) or above, the cutoff for diabetes.
“These results indicate that our study included both undiagnosed diabetic patients and nondiabetic patients with hyperglycemia caused by an acute blood glucose disorder,” the authors noted.
Over 28 days of hospitalization, 18.8% (114) of the patients died and 39.2% developed one or more in-hospital complications.
The authors used the CRB-65 score, which assigns 1 point for each of four indicators – confusion, respiratory rate >30 breaths/min, systolic blood pressure ≤90 mm Hg or diastolic blood pressure ≤60 mm Hg, and age ≥65 years – to assess pneumonia severity.
Just over half, 55.2%, had a CRB-65 score of 0, 43.1% had a score of 1-2, and 1.7% had a score of 3-4.
In multivariable analysis, significant independent predictors of 28-day mortality were age (hazard ratio, 1.02), male sex (HR, 1.75), CRB-65 score 1-2 (HR, 2.68), CRB-65 score 3-4 (HR, 5.25), and fasting blood glucose ≥7.0 mmol/L (HR, 2.30).
Compared with patients with normal glucose (<6.1 mmol/L), 28-day mortality was twice as high (HR, 2.06) for those with a fasting blood glucose of 6.1-6.9 mmol/L and more than threefold higher for ≥7.0 mmol/L (HR, 3.54).
Pneumonia severity also predicted 28-day mortality, with hazard ratios of 4.35 and 13.80 for patients with CRB-65 scores of 1-2 and 3-4, respectively, compared with 0.
Inhospital complications, including acute respiratory distress syndrome or acute cardiac, kidney, or liver injury or cerebrovascular accident, occurred in 14.2%, 7.9%, and 17.0% of those in the lowest to highest fasting blood glucose groups.
Complications were more than twice as common in patients with a fasting blood glucose of 6.1-6.9 mmol/L (HR, 2.61) and four times more common (HR, 3.99) among those with a fasting blood glucose ≥7.0 mmol/L, compared with those with normoglycemia.
The study was supported by the National Natural Science Foundation of China and Major Projects of the National Science and Technology. The authors have reported no relevant financial relationships.
This article first appeared on Medscape.com.
new research indicates.
The findings, from a retrospective analysis of 605 patients with COVID-19 seen at two hospitals in Wuhan, China, were published online July 10 in Diabetologia by Sufei Wang, of the department of respiratory and critical care medicine, Union Hospital, Tongji Medical College, Huazhong University of Science and Technology, and colleagues.
Several previous studies have demonstrated a link between hyperglycemia and worse outcomes in COVID-19, and at least one diabetes diagnosis, but this is the first to focus specifically on that group of patients.
Wang and colleagues found that a fasting blood glucose of 7.0 mmol/L (126 mg/dL) or greater on admission – present in 45.6% of those without a prior diabetes diagnosis – was an independent predictor of 28-day mortality.
Although A1c data weren’t analyzed, the population is believed to include both individuals with preexisting but undiagnosed diabetes and those without diabetes who have acute stress hyperglycemia.
“Glycemic testing and control should be recommended for all COVID-19 patients even if they do not have preexisting diabetes, as most COVID-19 patients are prone to glucose metabolic disorders,” they emphasized.
“Addressing elevated fasting blood glucose at an early stage can help clinicians better manage the condition and lower the mortality risk of COVID-19 patients,” Wang and colleagues noted.
Hyperglycemia predicts COVID-19 death, complications
The study involved consecutive patients with COVID-19 and definitive 28-day outcome and fasting blood glucose measurement on admission to two Wuhan-area hospitals between Jan. 24 to Feb. 10, 2020. A total of 605 patients did not have a previous diabetes diagnosis. They were a median age of 59 years and 53.2% were men.
Just over half, 54.4%, had a fasting blood glucose below 6.1 mmol/L (110.0 mg/dL). The rest had dysglycemia: 16.5% had a fasting blood glucose of 6.1-6.9 mmol/L (110-125 mg/dL), considered the prediabetes range, and 29.1% had a fasting blood glucose of 7 mmol/L (126 mg/dL) or above, the cutoff for diabetes.
“These results indicate that our study included both undiagnosed diabetic patients and nondiabetic patients with hyperglycemia caused by an acute blood glucose disorder,” the authors noted.
Over 28 days of hospitalization, 18.8% (114) of the patients died and 39.2% developed one or more in-hospital complications.
The authors used the CRB-65 score, which assigns 1 point for each of four indicators – confusion, respiratory rate >30 breaths/min, systolic blood pressure ≤90 mm Hg or diastolic blood pressure ≤60 mm Hg, and age ≥65 years – to assess pneumonia severity.
Just over half, 55.2%, had a CRB-65 score of 0, 43.1% had a score of 1-2, and 1.7% had a score of 3-4.
In multivariable analysis, significant independent predictors of 28-day mortality were age (hazard ratio, 1.02), male sex (HR, 1.75), CRB-65 score 1-2 (HR, 2.68), CRB-65 score 3-4 (HR, 5.25), and fasting blood glucose ≥7.0 mmol/L (HR, 2.30).
Compared with patients with normal glucose (<6.1 mmol/L), 28-day mortality was twice as high (HR, 2.06) for those with a fasting blood glucose of 6.1-6.9 mmol/L and more than threefold higher for ≥7.0 mmol/L (HR, 3.54).
Pneumonia severity also predicted 28-day mortality, with hazard ratios of 4.35 and 13.80 for patients with CRB-65 scores of 1-2 and 3-4, respectively, compared with 0.
Inhospital complications, including acute respiratory distress syndrome or acute cardiac, kidney, or liver injury or cerebrovascular accident, occurred in 14.2%, 7.9%, and 17.0% of those in the lowest to highest fasting blood glucose groups.
Complications were more than twice as common in patients with a fasting blood glucose of 6.1-6.9 mmol/L (HR, 2.61) and four times more common (HR, 3.99) among those with a fasting blood glucose ≥7.0 mmol/L, compared with those with normoglycemia.
The study was supported by the National Natural Science Foundation of China and Major Projects of the National Science and Technology. The authors have reported no relevant financial relationships.
This article first appeared on Medscape.com.
Does obesity reduce drug efficacy in breast cancer?
Obesity has been shown to have an impact on the risk of developing breast cancer and on prognosis. A new study suggests that it may also have an effect on treatment.
A high body mass index (BMI) at the time of breast cancer diagnosis could reduce the efficacy of taxane-based adjuvant chemotherapy, worsening survival outcomes, the study suggests.
That study investigated docetaxel (Taxotere), which is a “lipophilic drug, suggesting that fat present in the body could absorb part of the drug before it can reach the tumor,” commented lead author Christine Desmedt, PhD, of the Laboratory for Translational Breast Cancer Research, Department of Oncology, Leuven, Belgium.
“These results also make us wonder whether other chemotherapy drugs from the same family, like paclitaxel (Taxol), will show the same effect,” she said in a statement.
If follow-up research confirms that the findings are related solely to the pharmacologic characteristics of docetaxel, the results may also apply to its use in other types of cancer, including prostate cancer and lung cancer, she added.
The finding that taxane chemotherapy was less effective in overweight patients “is a provocative observation,” commented Harold Burstein, MD, PhD, an oncologist and clinical investigator at Dana-Farber Cancer Institute and Brigham and Women’s Hospital in Boston, Massachusetts.
“It should be explored in other trials that looked at adding taxanes to standard chemotherapy,” he told Medscape Medical News.
Worse outcomes in patients with high BMI
The study, published online in the Journal of Clinical Oncology, was a retrospective reanalysis of data from the phase 3 BIG 2-98 trial.
It shows that overweight and obese patients treated with a chemotherapy regimen based on docetaxel had significantly worse disease-free survival (DFS) and overall survival (OS) compared with lean patients treated with the same chemotherapy regimen.
Conversely, for patients treated with an adjuvant chemotherapy regimen that did not include docetaxel, there was no difference in DFS, OS, or in the rates of distant metastases in regard to BMI.
The finding “highlights a differential response to docetaxel according to BMI, which calls for a body composition–based re-evaluation of the risk-benefit ratio of the use of taxanes in breast cancer,” say the researchers. “These results now must be confirmed in additional series.”
The findings call into question results from earlier randomized clinical trials that did not evaluate the efficacy of most cancer drugs on the basis of patient adiposity, the researchers say.
Desmedt emphasized that more research is needed “before changes in treatment can be implemented.”
Experts approached by Medscape Medical News for comment agreed.
“It is important to remember that breast cancer patients needing chemotherapy should still receive the usual chemotherapy regimens, including taxanes, regardless of their weight or habitus,” commented Burstein, who is also professor of medicine at Harvard University.
These data highlight a persistent disparity in breast cancer outcomes, he told Medscape Medical News. Previous studies have shown that overweight patients often have less favorable outcomes. “There are many contributors to poor health outcomes in people with higher BMI, including concurrent health issues such as diabetes and/or hypertension, and unfortunately, the clear link between socioeconomic status and obesity,” he added.
Megan Kruse, MD, of the department of hematology and medical oncology at the Cleveland Clinic, said she “would not make changes in my treatment recommendations based on this study alone.”
Kruse was surprised that when the analysis was restricted to patients who received a relative dose intensity ≥85% for docetaxel, the same reduced rates of DFS and OS were seen as in patients with a high BMI.
“One may have suspected, based on the overall results, that patients with inferior survival outcomes actually received less chemotherapy due to [the] tendency to cap doses of chemotherapy in patients with high BMIs,” she explained.
“Since this analysis keeps dose intensity in mind, the association between BMI and survival outcomes is stronger in my mind. It does not, however, rule out that there are other confounding factors,” Kruse told Medscape Medical News.
Whether the results can be replicated in other retrospective clinical trials remains to be seen, she commented. Noting that the investigators plan to develop a prospective pharmacokinetics study across the BMI spectrum, Kruse added: “This will be of great interest as we plan curative-intent chemotherapy trials moving forward.”
Study details
For the current study, the investigators analyzed data from all 2,887 breast cancer patients enrolled in the adjuvant BIG 2-98 trial. They compared the survival outcomes of those who received docetaxel-based chemotherapy with those who received non-docetaxel-based chemotherapy in relation to their BMI. Patients with a BMI of 18.5 to 25 kg/m were classified as lean; patients with a BMI of 25-30 were classified as overweight; and those with a BMI ≥30 were classified as obese.
The researchers also assessed a second-order interaction on the basis of treatment, BMI, and estrogen receptor (ER) status.
The results showed that in the overweight women, compared with lean women, the adjusted hazard ratios (HRs) for DFS and OS were 1.12 (95% CI, 98 – 1.50; P = .21) and 1.27 (95% CI,101 – 1.60; P = .04), respectively. For obese vs lean patients, the HRs for DFS and OS were 1.32 (95% CI, 108 – 162; P = .007) and 1.63 (95% CI, 1.27 – 2.09; P < .001), respectively.
The survival outcomes were similar when only those patients who received a relative dose intensity ≥85% for docetaxel were considered. However, when ER-negative and ER-positive tumors were considered separately, the researchers found evidence of a joint modifying role of BMI and ER status on treatment effect for DFS (adjusted P =.06) and OS (adjusted P = .04).
“[I]t appears that the benefit for docetaxel-based versus nondocetaxel-based treatment could be limited to lean and overweight patients with ER-positive tumors and, possibly, to lean patients with ER-negative tumors…,” Desmedt and colleagues comment.
It may even be possible that docetaxel-based treatment could be detrimental for overweight patients with ER-negative tumors, they note, but warn that these results should be interpreted with caution.
The investigators note that, worldwide, the proportion of women with increased adiposity has been increasing for decades. In Europe, it is estimated that more than 50% of women are overweight and obese. In the United States, almost 64% of women have a BMI >25 kg/mg2.
Previous studies have shown that, in postmenopausal women, a high BMI is associated with a higher risk of developing breast cancer and that, in women who do develop breast cancer, the prognosis is worse. In addition, a recent study demonstrated that increased adiposity can raise the risk for breast cancer in postmenopausal women whose BMI is in the normal range.
The study was funded in part by Fondation Cancer Luxemburg and Associazione Italiana per la Ricerca sul Cancro AIRC. Desmedt has disclosed no relevant financial relationships. A number of study coauthors reported relationships with industry.
This story first appeared on Medscape.com.
Obesity has been shown to have an impact on the risk of developing breast cancer and on prognosis. A new study suggests that it may also have an effect on treatment.
A high body mass index (BMI) at the time of breast cancer diagnosis could reduce the efficacy of taxane-based adjuvant chemotherapy, worsening survival outcomes, the study suggests.
That study investigated docetaxel (Taxotere), which is a “lipophilic drug, suggesting that fat present in the body could absorb part of the drug before it can reach the tumor,” commented lead author Christine Desmedt, PhD, of the Laboratory for Translational Breast Cancer Research, Department of Oncology, Leuven, Belgium.
“These results also make us wonder whether other chemotherapy drugs from the same family, like paclitaxel (Taxol), will show the same effect,” she said in a statement.
If follow-up research confirms that the findings are related solely to the pharmacologic characteristics of docetaxel, the results may also apply to its use in other types of cancer, including prostate cancer and lung cancer, she added.
The finding that taxane chemotherapy was less effective in overweight patients “is a provocative observation,” commented Harold Burstein, MD, PhD, an oncologist and clinical investigator at Dana-Farber Cancer Institute and Brigham and Women’s Hospital in Boston, Massachusetts.
“It should be explored in other trials that looked at adding taxanes to standard chemotherapy,” he told Medscape Medical News.
Worse outcomes in patients with high BMI
The study, published online in the Journal of Clinical Oncology, was a retrospective reanalysis of data from the phase 3 BIG 2-98 trial.
It shows that overweight and obese patients treated with a chemotherapy regimen based on docetaxel had significantly worse disease-free survival (DFS) and overall survival (OS) compared with lean patients treated with the same chemotherapy regimen.
Conversely, for patients treated with an adjuvant chemotherapy regimen that did not include docetaxel, there was no difference in DFS, OS, or in the rates of distant metastases in regard to BMI.
The finding “highlights a differential response to docetaxel according to BMI, which calls for a body composition–based re-evaluation of the risk-benefit ratio of the use of taxanes in breast cancer,” say the researchers. “These results now must be confirmed in additional series.”
The findings call into question results from earlier randomized clinical trials that did not evaluate the efficacy of most cancer drugs on the basis of patient adiposity, the researchers say.
Desmedt emphasized that more research is needed “before changes in treatment can be implemented.”
Experts approached by Medscape Medical News for comment agreed.
“It is important to remember that breast cancer patients needing chemotherapy should still receive the usual chemotherapy regimens, including taxanes, regardless of their weight or habitus,” commented Burstein, who is also professor of medicine at Harvard University.
These data highlight a persistent disparity in breast cancer outcomes, he told Medscape Medical News. Previous studies have shown that overweight patients often have less favorable outcomes. “There are many contributors to poor health outcomes in people with higher BMI, including concurrent health issues such as diabetes and/or hypertension, and unfortunately, the clear link between socioeconomic status and obesity,” he added.
Megan Kruse, MD, of the department of hematology and medical oncology at the Cleveland Clinic, said she “would not make changes in my treatment recommendations based on this study alone.”
Kruse was surprised that when the analysis was restricted to patients who received a relative dose intensity ≥85% for docetaxel, the same reduced rates of DFS and OS were seen as in patients with a high BMI.
“One may have suspected, based on the overall results, that patients with inferior survival outcomes actually received less chemotherapy due to [the] tendency to cap doses of chemotherapy in patients with high BMIs,” she explained.
“Since this analysis keeps dose intensity in mind, the association between BMI and survival outcomes is stronger in my mind. It does not, however, rule out that there are other confounding factors,” Kruse told Medscape Medical News.
Whether the results can be replicated in other retrospective clinical trials remains to be seen, she commented. Noting that the investigators plan to develop a prospective pharmacokinetics study across the BMI spectrum, Kruse added: “This will be of great interest as we plan curative-intent chemotherapy trials moving forward.”
Study details
For the current study, the investigators analyzed data from all 2,887 breast cancer patients enrolled in the adjuvant BIG 2-98 trial. They compared the survival outcomes of those who received docetaxel-based chemotherapy with those who received non-docetaxel-based chemotherapy in relation to their BMI. Patients with a BMI of 18.5 to 25 kg/m were classified as lean; patients with a BMI of 25-30 were classified as overweight; and those with a BMI ≥30 were classified as obese.
The researchers also assessed a second-order interaction on the basis of treatment, BMI, and estrogen receptor (ER) status.
The results showed that in the overweight women, compared with lean women, the adjusted hazard ratios (HRs) for DFS and OS were 1.12 (95% CI, 98 – 1.50; P = .21) and 1.27 (95% CI,101 – 1.60; P = .04), respectively. For obese vs lean patients, the HRs for DFS and OS were 1.32 (95% CI, 108 – 162; P = .007) and 1.63 (95% CI, 1.27 – 2.09; P < .001), respectively.
The survival outcomes were similar when only those patients who received a relative dose intensity ≥85% for docetaxel were considered. However, when ER-negative and ER-positive tumors were considered separately, the researchers found evidence of a joint modifying role of BMI and ER status on treatment effect for DFS (adjusted P =.06) and OS (adjusted P = .04).
“[I]t appears that the benefit for docetaxel-based versus nondocetaxel-based treatment could be limited to lean and overweight patients with ER-positive tumors and, possibly, to lean patients with ER-negative tumors…,” Desmedt and colleagues comment.
It may even be possible that docetaxel-based treatment could be detrimental for overweight patients with ER-negative tumors, they note, but warn that these results should be interpreted with caution.
The investigators note that, worldwide, the proportion of women with increased adiposity has been increasing for decades. In Europe, it is estimated that more than 50% of women are overweight and obese. In the United States, almost 64% of women have a BMI >25 kg/mg2.
Previous studies have shown that, in postmenopausal women, a high BMI is associated with a higher risk of developing breast cancer and that, in women who do develop breast cancer, the prognosis is worse. In addition, a recent study demonstrated that increased adiposity can raise the risk for breast cancer in postmenopausal women whose BMI is in the normal range.
The study was funded in part by Fondation Cancer Luxemburg and Associazione Italiana per la Ricerca sul Cancro AIRC. Desmedt has disclosed no relevant financial relationships. A number of study coauthors reported relationships with industry.
This story first appeared on Medscape.com.
Obesity has been shown to have an impact on the risk of developing breast cancer and on prognosis. A new study suggests that it may also have an effect on treatment.
A high body mass index (BMI) at the time of breast cancer diagnosis could reduce the efficacy of taxane-based adjuvant chemotherapy, worsening survival outcomes, the study suggests.
That study investigated docetaxel (Taxotere), which is a “lipophilic drug, suggesting that fat present in the body could absorb part of the drug before it can reach the tumor,” commented lead author Christine Desmedt, PhD, of the Laboratory for Translational Breast Cancer Research, Department of Oncology, Leuven, Belgium.
“These results also make us wonder whether other chemotherapy drugs from the same family, like paclitaxel (Taxol), will show the same effect,” she said in a statement.
If follow-up research confirms that the findings are related solely to the pharmacologic characteristics of docetaxel, the results may also apply to its use in other types of cancer, including prostate cancer and lung cancer, she added.
The finding that taxane chemotherapy was less effective in overweight patients “is a provocative observation,” commented Harold Burstein, MD, PhD, an oncologist and clinical investigator at Dana-Farber Cancer Institute and Brigham and Women’s Hospital in Boston, Massachusetts.
“It should be explored in other trials that looked at adding taxanes to standard chemotherapy,” he told Medscape Medical News.
Worse outcomes in patients with high BMI
The study, published online in the Journal of Clinical Oncology, was a retrospective reanalysis of data from the phase 3 BIG 2-98 trial.
It shows that overweight and obese patients treated with a chemotherapy regimen based on docetaxel had significantly worse disease-free survival (DFS) and overall survival (OS) compared with lean patients treated with the same chemotherapy regimen.
Conversely, for patients treated with an adjuvant chemotherapy regimen that did not include docetaxel, there was no difference in DFS, OS, or in the rates of distant metastases in regard to BMI.
The finding “highlights a differential response to docetaxel according to BMI, which calls for a body composition–based re-evaluation of the risk-benefit ratio of the use of taxanes in breast cancer,” say the researchers. “These results now must be confirmed in additional series.”
The findings call into question results from earlier randomized clinical trials that did not evaluate the efficacy of most cancer drugs on the basis of patient adiposity, the researchers say.
Desmedt emphasized that more research is needed “before changes in treatment can be implemented.”
Experts approached by Medscape Medical News for comment agreed.
“It is important to remember that breast cancer patients needing chemotherapy should still receive the usual chemotherapy regimens, including taxanes, regardless of their weight or habitus,” commented Burstein, who is also professor of medicine at Harvard University.
These data highlight a persistent disparity in breast cancer outcomes, he told Medscape Medical News. Previous studies have shown that overweight patients often have less favorable outcomes. “There are many contributors to poor health outcomes in people with higher BMI, including concurrent health issues such as diabetes and/or hypertension, and unfortunately, the clear link between socioeconomic status and obesity,” he added.
Megan Kruse, MD, of the department of hematology and medical oncology at the Cleveland Clinic, said she “would not make changes in my treatment recommendations based on this study alone.”
Kruse was surprised that when the analysis was restricted to patients who received a relative dose intensity ≥85% for docetaxel, the same reduced rates of DFS and OS were seen as in patients with a high BMI.
“One may have suspected, based on the overall results, that patients with inferior survival outcomes actually received less chemotherapy due to [the] tendency to cap doses of chemotherapy in patients with high BMIs,” she explained.
“Since this analysis keeps dose intensity in mind, the association between BMI and survival outcomes is stronger in my mind. It does not, however, rule out that there are other confounding factors,” Kruse told Medscape Medical News.
Whether the results can be replicated in other retrospective clinical trials remains to be seen, she commented. Noting that the investigators plan to develop a prospective pharmacokinetics study across the BMI spectrum, Kruse added: “This will be of great interest as we plan curative-intent chemotherapy trials moving forward.”
Study details
For the current study, the investigators analyzed data from all 2,887 breast cancer patients enrolled in the adjuvant BIG 2-98 trial. They compared the survival outcomes of those who received docetaxel-based chemotherapy with those who received non-docetaxel-based chemotherapy in relation to their BMI. Patients with a BMI of 18.5 to 25 kg/m were classified as lean; patients with a BMI of 25-30 were classified as overweight; and those with a BMI ≥30 were classified as obese.
The researchers also assessed a second-order interaction on the basis of treatment, BMI, and estrogen receptor (ER) status.
The results showed that in the overweight women, compared with lean women, the adjusted hazard ratios (HRs) for DFS and OS were 1.12 (95% CI, 98 – 1.50; P = .21) and 1.27 (95% CI,101 – 1.60; P = .04), respectively. For obese vs lean patients, the HRs for DFS and OS were 1.32 (95% CI, 108 – 162; P = .007) and 1.63 (95% CI, 1.27 – 2.09; P < .001), respectively.
The survival outcomes were similar when only those patients who received a relative dose intensity ≥85% for docetaxel were considered. However, when ER-negative and ER-positive tumors were considered separately, the researchers found evidence of a joint modifying role of BMI and ER status on treatment effect for DFS (adjusted P =.06) and OS (adjusted P = .04).
“[I]t appears that the benefit for docetaxel-based versus nondocetaxel-based treatment could be limited to lean and overweight patients with ER-positive tumors and, possibly, to lean patients with ER-negative tumors…,” Desmedt and colleagues comment.
It may even be possible that docetaxel-based treatment could be detrimental for overweight patients with ER-negative tumors, they note, but warn that these results should be interpreted with caution.
The investigators note that, worldwide, the proportion of women with increased adiposity has been increasing for decades. In Europe, it is estimated that more than 50% of women are overweight and obese. In the United States, almost 64% of women have a BMI >25 kg/mg2.
Previous studies have shown that, in postmenopausal women, a high BMI is associated with a higher risk of developing breast cancer and that, in women who do develop breast cancer, the prognosis is worse. In addition, a recent study demonstrated that increased adiposity can raise the risk for breast cancer in postmenopausal women whose BMI is in the normal range.
The study was funded in part by Fondation Cancer Luxemburg and Associazione Italiana per la Ricerca sul Cancro AIRC. Desmedt has disclosed no relevant financial relationships. A number of study coauthors reported relationships with industry.
This story first appeared on Medscape.com.