User login
Study validates OSA phenotypes in Latinos
Three previously described clinical phenotypes of obstructive sleep apnea (OSA) have been validated in a large and diverse Hispanic/Latino community-based population for the first time, according to findings presented at the virtual annual meeting of the Associated Professional Sleep Societies.
The three OSA symptom profiles present in this population – labeled “minimally symptomatic,” “disturbed sleep,” and “daytime sleepiness” – are consistent with recent findings from the Sleep Apnea Global Interdisciplinary Consortium, which were published in Sleep, but there are notable differences in the prevalence of these clusters, with the minimally symptomatic cluster much more prevalent than in prior research, reported Kevin Gonzalez, of the University of California, San Diego.
“Other biopsychosocial factors may be contributing to OSA phenotypes among Hispanics and Latinos,” Mr. Gonzalez said in his presentation. Prior research to characterize the heterogeneity of sleep apnea has not included a diverse Latino population, he emphasized.
The adults studied were aged 18-74 years and participants in the multisite Hispanic Community Health Study/Study of Latinos (HCHS/SOL), a comprehensive study of Hispanic/Latino health and disease in the United States. Their respiratory events were measured overnight in HCHS/SOL sleep reading centers with an ARES Unicorder 5.2, B-Alert. Sleep patterns and risk factors were assessed using the Sleep Heart Health Study Sleep Habits Questionnaire and the Epworth Sleepiness Scale.
Participants meeting the criteria for moderate to severe OSA (with an Apnea Hypopnea Index of 15 or above) were included in the analysis (n = 1,623). Their average age was 52.4 ± 13.9 years, and 34.1% were female.
To identify phenotype clusters, investigators performed a latent class analysis using 15 common OSA symptoms and a survey weighted to adjust for selection bias. The three clusters offering the “best” fit for the data aligned with the previously reported phenotypes and identified daytime sleepiness in 15.3%, disturbed sleep (insomnia-like symptoms) in 37.7%, and minimally symptomatic (a low symptom profile) in 46.9%.
These phenotypes were reported in the European Respiratory Journal in 2014 in a cluster analysis of data from a sleep apnea cohort in Iceland and later replicated in the analysis of data from the Sleep Apnea Global Interdisciplinary Consortium published in Sleep in 2018. The consortium study also added two additional phenotypes, labeled “upper airway symptoms dominant” and “sleepiness dominant.”
The prevalence of a “minimally symptomatic group” in the new analysis of the Hispanics/Latinos in the United States is much higher than reported in these prior studies, at least partly, the investigators believed, because the “prior studies were clinical samples, and the people who were minimally symptomatic didn’t get to the sleep centers,” Mr. Gonzalez said in an interview after the meeting.
Patients with a phenotype of daytime sleepiness – the most common phenotype in prior research – constituted only a minority in the Hispanic/Latino population, he said.
Alberto Ramos, MD, of the University of Miami and the principal investigator, said in an interview that the research team is currently analyzing “if and how these different [phenotypic] clusters could affect the incidence of comorbidities” recorded in the HCHS/SOL study, such as hypertension, diabetes, cardiovascular disease, and cognitive decline.
For now, he said, the findings suggest that OSA may be especially underrecognized in Hispanics and Latinos and that there is more research to be done to better identify and stratify patients with varying symptomatology for more personalized treatment and for clinical trial selection. “Maybe we should expand our criteria ... broaden our [recognition] of the presentation of sleep apnea and the symptoms associated with it, not only in Hispanics but maybe in the general population,” Dr. Ramos said.

In commenting on the study, Krishna M. Sundar, MD, FCCP, director of the Sleep-Wake Center at the University of Utah, Salt Lake City, said that insomnia and daytime sleepiness are “key associations with obstructive sleep apnea and may predict different outcomes with untreated OSA.” Such heterogeneity is “only beginning to be appreciated,” he said. “The expression of OSA with these symptoms points to how OSA impacts quality of life” and how symptomatology in addition to Apnea Hypopnea Index “may be an important determinant of treatment benefit and compliance.”
The investigators reported no relevant disclosures. Dr. Sundar said that he is cofounder of Hypnoscure, software for population management of sleep apnea, but with no monies received.
Three previously described clinical phenotypes of obstructive sleep apnea (OSA) have been validated in a large and diverse Hispanic/Latino community-based population for the first time, according to findings presented at the virtual annual meeting of the Associated Professional Sleep Societies.
The three OSA symptom profiles present in this population – labeled “minimally symptomatic,” “disturbed sleep,” and “daytime sleepiness” – are consistent with recent findings from the Sleep Apnea Global Interdisciplinary Consortium, which were published in Sleep, but there are notable differences in the prevalence of these clusters, with the minimally symptomatic cluster much more prevalent than in prior research, reported Kevin Gonzalez, of the University of California, San Diego.
“Other biopsychosocial factors may be contributing to OSA phenotypes among Hispanics and Latinos,” Mr. Gonzalez said in his presentation. Prior research to characterize the heterogeneity of sleep apnea has not included a diverse Latino population, he emphasized.
The adults studied were aged 18-74 years and participants in the multisite Hispanic Community Health Study/Study of Latinos (HCHS/SOL), a comprehensive study of Hispanic/Latino health and disease in the United States. Their respiratory events were measured overnight in HCHS/SOL sleep reading centers with an ARES Unicorder 5.2, B-Alert. Sleep patterns and risk factors were assessed using the Sleep Heart Health Study Sleep Habits Questionnaire and the Epworth Sleepiness Scale.
Participants meeting the criteria for moderate to severe OSA (with an Apnea Hypopnea Index of 15 or above) were included in the analysis (n = 1,623). Their average age was 52.4 ± 13.9 years, and 34.1% were female.
To identify phenotype clusters, investigators performed a latent class analysis using 15 common OSA symptoms and a survey weighted to adjust for selection bias. The three clusters offering the “best” fit for the data aligned with the previously reported phenotypes and identified daytime sleepiness in 15.3%, disturbed sleep (insomnia-like symptoms) in 37.7%, and minimally symptomatic (a low symptom profile) in 46.9%.
These phenotypes were reported in the European Respiratory Journal in 2014 in a cluster analysis of data from a sleep apnea cohort in Iceland and later replicated in the analysis of data from the Sleep Apnea Global Interdisciplinary Consortium published in Sleep in 2018. The consortium study also added two additional phenotypes, labeled “upper airway symptoms dominant” and “sleepiness dominant.”
The prevalence of a “minimally symptomatic group” in the new analysis of the Hispanics/Latinos in the United States is much higher than reported in these prior studies, at least partly, the investigators believed, because the “prior studies were clinical samples, and the people who were minimally symptomatic didn’t get to the sleep centers,” Mr. Gonzalez said in an interview after the meeting.
Patients with a phenotype of daytime sleepiness – the most common phenotype in prior research – constituted only a minority in the Hispanic/Latino population, he said.
Alberto Ramos, MD, of the University of Miami and the principal investigator, said in an interview that the research team is currently analyzing “if and how these different [phenotypic] clusters could affect the incidence of comorbidities” recorded in the HCHS/SOL study, such as hypertension, diabetes, cardiovascular disease, and cognitive decline.
For now, he said, the findings suggest that OSA may be especially underrecognized in Hispanics and Latinos and that there is more research to be done to better identify and stratify patients with varying symptomatology for more personalized treatment and for clinical trial selection. “Maybe we should expand our criteria ... broaden our [recognition] of the presentation of sleep apnea and the symptoms associated with it, not only in Hispanics but maybe in the general population,” Dr. Ramos said.
In commenting on the study, Krishna M. Sundar, MD, FCCP, director of the Sleep-Wake Center at the University of Utah, Salt Lake City, said that insomnia and daytime sleepiness are “key associations with obstructive sleep apnea and may predict different outcomes with untreated OSA.” Such heterogeneity is “only beginning to be appreciated,” he said. “The expression of OSA with these symptoms points to how OSA impacts quality of life” and how symptomatology in addition to Apnea Hypopnea Index “may be an important determinant of treatment benefit and compliance.”
The investigators reported no relevant disclosures. Dr. Sundar said that he is cofounder of Hypnoscure, software for population management of sleep apnea, but with no monies received.
Three previously described clinical phenotypes of obstructive sleep apnea (OSA) have been validated in a large and diverse Hispanic/Latino community-based population for the first time, according to findings presented at the virtual annual meeting of the Associated Professional Sleep Societies.
The three OSA symptom profiles present in this population – labeled “minimally symptomatic,” “disturbed sleep,” and “daytime sleepiness” – are consistent with recent findings from the Sleep Apnea Global Interdisciplinary Consortium, which were published in Sleep, but there are notable differences in the prevalence of these clusters, with the minimally symptomatic cluster much more prevalent than in prior research, reported Kevin Gonzalez, of the University of California, San Diego.
“Other biopsychosocial factors may be contributing to OSA phenotypes among Hispanics and Latinos,” Mr. Gonzalez said in his presentation. Prior research to characterize the heterogeneity of sleep apnea has not included a diverse Latino population, he emphasized.
The adults studied were aged 18-74 years and participants in the multisite Hispanic Community Health Study/Study of Latinos (HCHS/SOL), a comprehensive study of Hispanic/Latino health and disease in the United States. Their respiratory events were measured overnight in HCHS/SOL sleep reading centers with an ARES Unicorder 5.2, B-Alert. Sleep patterns and risk factors were assessed using the Sleep Heart Health Study Sleep Habits Questionnaire and the Epworth Sleepiness Scale.
Participants meeting the criteria for moderate to severe OSA (with an Apnea Hypopnea Index of 15 or above) were included in the analysis (n = 1,623). Their average age was 52.4 ± 13.9 years, and 34.1% were female.
To identify phenotype clusters, investigators performed a latent class analysis using 15 common OSA symptoms and a survey weighted to adjust for selection bias. The three clusters offering the “best” fit for the data aligned with the previously reported phenotypes and identified daytime sleepiness in 15.3%, disturbed sleep (insomnia-like symptoms) in 37.7%, and minimally symptomatic (a low symptom profile) in 46.9%.
These phenotypes were reported in the European Respiratory Journal in 2014 in a cluster analysis of data from a sleep apnea cohort in Iceland and later replicated in the analysis of data from the Sleep Apnea Global Interdisciplinary Consortium published in Sleep in 2018. The consortium study also added two additional phenotypes, labeled “upper airway symptoms dominant” and “sleepiness dominant.”
The prevalence of a “minimally symptomatic group” in the new analysis of the Hispanics/Latinos in the United States is much higher than reported in these prior studies, at least partly, the investigators believed, because the “prior studies were clinical samples, and the people who were minimally symptomatic didn’t get to the sleep centers,” Mr. Gonzalez said in an interview after the meeting.
Patients with a phenotype of daytime sleepiness – the most common phenotype in prior research – constituted only a minority in the Hispanic/Latino population, he said.
Alberto Ramos, MD, of the University of Miami and the principal investigator, said in an interview that the research team is currently analyzing “if and how these different [phenotypic] clusters could affect the incidence of comorbidities” recorded in the HCHS/SOL study, such as hypertension, diabetes, cardiovascular disease, and cognitive decline.
For now, he said, the findings suggest that OSA may be especially underrecognized in Hispanics and Latinos and that there is more research to be done to better identify and stratify patients with varying symptomatology for more personalized treatment and for clinical trial selection. “Maybe we should expand our criteria ... broaden our [recognition] of the presentation of sleep apnea and the symptoms associated with it, not only in Hispanics but maybe in the general population,” Dr. Ramos said.
In commenting on the study, Krishna M. Sundar, MD, FCCP, director of the Sleep-Wake Center at the University of Utah, Salt Lake City, said that insomnia and daytime sleepiness are “key associations with obstructive sleep apnea and may predict different outcomes with untreated OSA.” Such heterogeneity is “only beginning to be appreciated,” he said. “The expression of OSA with these symptoms points to how OSA impacts quality of life” and how symptomatology in addition to Apnea Hypopnea Index “may be an important determinant of treatment benefit and compliance.”
The investigators reported no relevant disclosures. Dr. Sundar said that he is cofounder of Hypnoscure, software for population management of sleep apnea, but with no monies received.
REPORTING FROM SLEEP 2020
Type 2 diabetes drugs and their use are top of EASD agenda
This year’s virtual meeting of the European Association for the Study of Diabetes (EASD) offers new data and insights regarding the use of newer glucose-lowering agents for treating people with, and without, diabetes, as well as updates on diabetes technology, a symposium on COVID-19, and much more.
The meeting takes place live online September 22-25, Central European time, because it was to have been located in Vienna before the COVID-19 pandemic, which forced nearly all medical meetings to go virtual. However, as in years past, videos of all the sessions will be available to registrants for later viewing and to the public a month after the meeting ends. The registration fee is less than half the cost for previous years.
In fact, EASD was better prepared to go virtual than many other medical societies, and not just because they had more time to plan since the pandemic began, EASD president Stefano Del Prato, MD, told Medscape Medical News. “Starting in 2013 we already had a virtual congress in parallel to the face-to-face meeting. Everything at the congress was simultaneously available on streaming. That made us more confident in what we could achieve with a virtual meeting.”
Last year, the EASD meeting held in Barcelona was the first for which the number of virtual attendees equaled the number who attended in person, about 15,000 each. Another 80,000 people have accessed the video content in the year since.
“Maybe this is a unique occasion for reaching out to a really global audience,” said Del Prato, professor of endocrinology and metabolism and chief of the section of diabetes at the University of Pisa School of Medicine, Italy.
EASD Honorary Secretary Mikael Rydén, MD, PhD, the meeting’s program chair, told Medscape Medical News, “I’m really looking forward to this meeting because of the interactivity. I hope that, lacking the possibility of having a physical meeting, this is absolutely the best one can do.”
More cardiovascular and renal outcomes for SGLT2 inhibitors
The impact of the sodium-glucose cotransporter 2 (SGLT2) inhibitor drug class beyond glucose-lowering has dominated the agenda of diabetes meetings for the past 5 years, and this EASD is no exception.
Here, new data will be presented for the previously reported EMPEROR-Reduced trial of empagliflozin (Jardiance, Boehringer Ingelheim/Eli Lilly) for patients with heart failure with or without diabetes; DAPA-CKD, on renal outcomes for dapagliflozin (Farxiga, AstraZeneca); and renal results from the VERTIS CV outcome trial of ertugliflozin (Steglatro, Merck).
Regarding DAPA-CKD, Del Prato noted, “We will have a greater opportunity ... to go deeper into the results during a 1-hour session.”
A related session, a joint EASD/European Society of Cardiology (ESC) symposium on the “dawn of cardiovascular risk reduction in type 2 diabetes” will review the development of SGLT2 inhibitors and the data accumulated for the drug class over the past 5 years since the landmark EMPA-REG OUTCOME trial was first reported at EASD in 2015.
The joint symposium, Rydénsaid, will be “extremely important for clinicians. It’s a revolution in type 2 diabetes treatment, and perhaps in those without diabetes who have heart failure...It’s not about a single company, but experts involved in all the different trials of the different SGLT2 inhibitors...We’re still seeing the huge impact that the SGLT2 inhibitors have made, and the incretins as well. We’re still living in these rumbling years after these huge trials.”
Del Prato also named that symposium as a meeting highlight.
“From a clinical point of view, I think the EMPA-REG 5-year session will be of great interest. That was really a turning point not only in the field of diabetes, but also in cardiology and nephrology. I think that will be a great opportunity to see how quickly and how importantly SGLT2 inhibition has turned into a great opportunity for many people.”
Who’s “right” – diabetologists or cardiologists?
Another session likely to draw a crowd of clinicians is a debate about which guidelines are “right”: the ESC’s, which advise first-line use of an SGLT2 inhibitor or glucagon-like peptide-1 (GLP-1) agonist for patients with established CVD or those at high risk, or the more conservative EASD/American Diabetes Association’s, which still advise metformin as first-line therapy for type 2 diabetes.
Rydén, who is professor and senior consultant in endocrinology at the Karolinska University Hospital and Karolinska Institute, Sweden, commented, “The difference is in how aggressive to be in treatment and when adding drugs...I think we have slightly different ways of seeing things and how we implement them.”
Del Prato noted, “We need to clear the fog about what are the current indications for people with diabetes. There is definitely a point of contact between cardiology and diabetology. ... We like to split [the disciplines] up, but discussion is a good way to get people thinking.”
“It will be very important to address the importance of glucose control but yet also leverage a new form of treatment that will have properties above and beyond glucose-lowering capacity.”
Other big trial results: CGM after MI, semaglutide for obesity
Other major new trial results to be presented in dedicated sessions include LIBERATES (Improving Glucose Control in Patients With Diabetes Following Myocardial Infarction: The Role of a Novel Glycaemic Monitoring), and STEP program (Semaglutide for the Treatment of Obesity).
LIBERATES will compare glycemic control with the Abbott FreeStyle Libre 14-day sensor and standard fingerstick glucose monitoring versus blinded continuous glucose monitoring (CGM) for 90 days after a heart attack. It was a late addition to the meeting program, Rydén noted.
The semaglutide study is looking at weight loss associated with a higher dose of the GLP-1 agonist than is currently approved for diabetes, similar to the way in which liraglutide was developed as an obesity agent after first gaining approval for type 2 diabetes.
Regarding semaglutide, Rydén said, “I’ve heard this one is quite efficient. It will be interesting.”
Personalized medicine, COVID-19, intermittent fasting, and much more
Both Rydén and Del Prato also said they were looking forward to a joint EASD/American Diabetes Association symposium on a newly launched precision medicine initiative. The session will include talks on subclassifications of diabetes, genetics, and precision diabetes medicine in practice, as well as lessons on the latter from Greenland.
Rydén noted, “I think it’s interesting for everyone, from the primary healthcare physician to the basic scientist. We’re trying to understand why we have this huge diabetic panorama and how do we identify the subject who should have a specific treatment, or perhaps [will] develop a specific complication of diabetes.”
This field, he predicted, “will grow enormously in the next 10 years.”
Del Prato pointed out, “Diabetes is more heterogeneous than we tend to believe for both types. Better guidance for individualization of treatments could be a great opportunity. ... Ways to better genotype and phenotype the population are becoming less expensive and easier to access. It will be a different way to treat diabetes in the future.”
Other noteworthy conference sessions will address COVID-19 and diabetes, intermittent fasting, new technologies, diabetes and cancer, the role of liver surveillance in patients with diabetes, medicines that can cause diabetes, exercise in type 1 diabetes, and the burden of hypoglycemia.
There will also be opportunities for networking, Del Prato said. “You’ll be able to walk around with your own avatar. You’ll be assisted by [artificial intelligence] to build your own program based on what you’ve been following. You can participate in discussion rooms. You can walk in and out.”
“We hope people will appreciate the science and the spirit of the congress – mingling, interacting, chatting to start discussion and maybe collaboration. It will be lots of fun. I would like to invite all Medscape readers to come and register.
Rydén has reported being a consultant, speaker, and/or advisory board member for Novo Nordisk, Eli Lilly, Boehringer Ingelheim, Novartis, and AstraZeneca. Del Prato has reported being a speaker, advisory board member, and/or receiving research support from AstraZeneca, Boehringer Ingelheim, Eli Lilly, MSD, Novartis, Novo Nordisk, Sanofi, Servier, and Takeda.
This article first appeared on Medscape.com.
This year’s virtual meeting of the European Association for the Study of Diabetes (EASD) offers new data and insights regarding the use of newer glucose-lowering agents for treating people with, and without, diabetes, as well as updates on diabetes technology, a symposium on COVID-19, and much more.
The meeting takes place live online September 22-25, Central European time, because it was to have been located in Vienna before the COVID-19 pandemic, which forced nearly all medical meetings to go virtual. However, as in years past, videos of all the sessions will be available to registrants for later viewing and to the public a month after the meeting ends. The registration fee is less than half the cost for previous years.
In fact, EASD was better prepared to go virtual than many other medical societies, and not just because they had more time to plan since the pandemic began, EASD president Stefano Del Prato, MD, told Medscape Medical News. “Starting in 2013 we already had a virtual congress in parallel to the face-to-face meeting. Everything at the congress was simultaneously available on streaming. That made us more confident in what we could achieve with a virtual meeting.”
Last year, the EASD meeting held in Barcelona was the first for which the number of virtual attendees equaled the number who attended in person, about 15,000 each. Another 80,000 people have accessed the video content in the year since.
“Maybe this is a unique occasion for reaching out to a really global audience,” said Del Prato, professor of endocrinology and metabolism and chief of the section of diabetes at the University of Pisa School of Medicine, Italy.
EASD Honorary Secretary Mikael Rydén, MD, PhD, the meeting’s program chair, told Medscape Medical News, “I’m really looking forward to this meeting because of the interactivity. I hope that, lacking the possibility of having a physical meeting, this is absolutely the best one can do.”
More cardiovascular and renal outcomes for SGLT2 inhibitors
The impact of the sodium-glucose cotransporter 2 (SGLT2) inhibitor drug class beyond glucose-lowering has dominated the agenda of diabetes meetings for the past 5 years, and this EASD is no exception.
Here, new data will be presented for the previously reported EMPEROR-Reduced trial of empagliflozin (Jardiance, Boehringer Ingelheim/Eli Lilly) for patients with heart failure with or without diabetes; DAPA-CKD, on renal outcomes for dapagliflozin (Farxiga, AstraZeneca); and renal results from the VERTIS CV outcome trial of ertugliflozin (Steglatro, Merck).
Regarding DAPA-CKD, Del Prato noted, “We will have a greater opportunity ... to go deeper into the results during a 1-hour session.”
A related session, a joint EASD/European Society of Cardiology (ESC) symposium on the “dawn of cardiovascular risk reduction in type 2 diabetes” will review the development of SGLT2 inhibitors and the data accumulated for the drug class over the past 5 years since the landmark EMPA-REG OUTCOME trial was first reported at EASD in 2015.
The joint symposium, Rydénsaid, will be “extremely important for clinicians. It’s a revolution in type 2 diabetes treatment, and perhaps in those without diabetes who have heart failure...It’s not about a single company, but experts involved in all the different trials of the different SGLT2 inhibitors...We’re still seeing the huge impact that the SGLT2 inhibitors have made, and the incretins as well. We’re still living in these rumbling years after these huge trials.”
Del Prato also named that symposium as a meeting highlight.
“From a clinical point of view, I think the EMPA-REG 5-year session will be of great interest. That was really a turning point not only in the field of diabetes, but also in cardiology and nephrology. I think that will be a great opportunity to see how quickly and how importantly SGLT2 inhibition has turned into a great opportunity for many people.”
Who’s “right” – diabetologists or cardiologists?
Another session likely to draw a crowd of clinicians is a debate about which guidelines are “right”: the ESC’s, which advise first-line use of an SGLT2 inhibitor or glucagon-like peptide-1 (GLP-1) agonist for patients with established CVD or those at high risk, or the more conservative EASD/American Diabetes Association’s, which still advise metformin as first-line therapy for type 2 diabetes.
Rydén, who is professor and senior consultant in endocrinology at the Karolinska University Hospital and Karolinska Institute, Sweden, commented, “The difference is in how aggressive to be in treatment and when adding drugs...I think we have slightly different ways of seeing things and how we implement them.”
Del Prato noted, “We need to clear the fog about what are the current indications for people with diabetes. There is definitely a point of contact between cardiology and diabetology. ... We like to split [the disciplines] up, but discussion is a good way to get people thinking.”
“It will be very important to address the importance of glucose control but yet also leverage a new form of treatment that will have properties above and beyond glucose-lowering capacity.”
Other big trial results: CGM after MI, semaglutide for obesity
Other major new trial results to be presented in dedicated sessions include LIBERATES (Improving Glucose Control in Patients With Diabetes Following Myocardial Infarction: The Role of a Novel Glycaemic Monitoring), and STEP program (Semaglutide for the Treatment of Obesity).
LIBERATES will compare glycemic control with the Abbott FreeStyle Libre 14-day sensor and standard fingerstick glucose monitoring versus blinded continuous glucose monitoring (CGM) for 90 days after a heart attack. It was a late addition to the meeting program, Rydén noted.
The semaglutide study is looking at weight loss associated with a higher dose of the GLP-1 agonist than is currently approved for diabetes, similar to the way in which liraglutide was developed as an obesity agent after first gaining approval for type 2 diabetes.
Regarding semaglutide, Rydén said, “I’ve heard this one is quite efficient. It will be interesting.”
Personalized medicine, COVID-19, intermittent fasting, and much more
Both Rydén and Del Prato also said they were looking forward to a joint EASD/American Diabetes Association symposium on a newly launched precision medicine initiative. The session will include talks on subclassifications of diabetes, genetics, and precision diabetes medicine in practice, as well as lessons on the latter from Greenland.
Rydén noted, “I think it’s interesting for everyone, from the primary healthcare physician to the basic scientist. We’re trying to understand why we have this huge diabetic panorama and how do we identify the subject who should have a specific treatment, or perhaps [will] develop a specific complication of diabetes.”
This field, he predicted, “will grow enormously in the next 10 years.”
Del Prato pointed out, “Diabetes is more heterogeneous than we tend to believe for both types. Better guidance for individualization of treatments could be a great opportunity. ... Ways to better genotype and phenotype the population are becoming less expensive and easier to access. It will be a different way to treat diabetes in the future.”
Other noteworthy conference sessions will address COVID-19 and diabetes, intermittent fasting, new technologies, diabetes and cancer, the role of liver surveillance in patients with diabetes, medicines that can cause diabetes, exercise in type 1 diabetes, and the burden of hypoglycemia.
There will also be opportunities for networking, Del Prato said. “You’ll be able to walk around with your own avatar. You’ll be assisted by [artificial intelligence] to build your own program based on what you’ve been following. You can participate in discussion rooms. You can walk in and out.”
“We hope people will appreciate the science and the spirit of the congress – mingling, interacting, chatting to start discussion and maybe collaboration. It will be lots of fun. I would like to invite all Medscape readers to come and register.
Rydén has reported being a consultant, speaker, and/or advisory board member for Novo Nordisk, Eli Lilly, Boehringer Ingelheim, Novartis, and AstraZeneca. Del Prato has reported being a speaker, advisory board member, and/or receiving research support from AstraZeneca, Boehringer Ingelheim, Eli Lilly, MSD, Novartis, Novo Nordisk, Sanofi, Servier, and Takeda.
This article first appeared on Medscape.com.
This year’s virtual meeting of the European Association for the Study of Diabetes (EASD) offers new data and insights regarding the use of newer glucose-lowering agents for treating people with, and without, diabetes, as well as updates on diabetes technology, a symposium on COVID-19, and much more.
The meeting takes place live online September 22-25, Central European time, because it was to have been located in Vienna before the COVID-19 pandemic, which forced nearly all medical meetings to go virtual. However, as in years past, videos of all the sessions will be available to registrants for later viewing and to the public a month after the meeting ends. The registration fee is less than half the cost for previous years.
In fact, EASD was better prepared to go virtual than many other medical societies, and not just because they had more time to plan since the pandemic began, EASD president Stefano Del Prato, MD, told Medscape Medical News. “Starting in 2013 we already had a virtual congress in parallel to the face-to-face meeting. Everything at the congress was simultaneously available on streaming. That made us more confident in what we could achieve with a virtual meeting.”
Last year, the EASD meeting held in Barcelona was the first for which the number of virtual attendees equaled the number who attended in person, about 15,000 each. Another 80,000 people have accessed the video content in the year since.
“Maybe this is a unique occasion for reaching out to a really global audience,” said Del Prato, professor of endocrinology and metabolism and chief of the section of diabetes at the University of Pisa School of Medicine, Italy.
EASD Honorary Secretary Mikael Rydén, MD, PhD, the meeting’s program chair, told Medscape Medical News, “I’m really looking forward to this meeting because of the interactivity. I hope that, lacking the possibility of having a physical meeting, this is absolutely the best one can do.”
More cardiovascular and renal outcomes for SGLT2 inhibitors
The impact of the sodium-glucose cotransporter 2 (SGLT2) inhibitor drug class beyond glucose-lowering has dominated the agenda of diabetes meetings for the past 5 years, and this EASD is no exception.
Here, new data will be presented for the previously reported EMPEROR-Reduced trial of empagliflozin (Jardiance, Boehringer Ingelheim/Eli Lilly) for patients with heart failure with or without diabetes; DAPA-CKD, on renal outcomes for dapagliflozin (Farxiga, AstraZeneca); and renal results from the VERTIS CV outcome trial of ertugliflozin (Steglatro, Merck).
Regarding DAPA-CKD, Del Prato noted, “We will have a greater opportunity ... to go deeper into the results during a 1-hour session.”
A related session, a joint EASD/European Society of Cardiology (ESC) symposium on the “dawn of cardiovascular risk reduction in type 2 diabetes” will review the development of SGLT2 inhibitors and the data accumulated for the drug class over the past 5 years since the landmark EMPA-REG OUTCOME trial was first reported at EASD in 2015.
The joint symposium, Rydénsaid, will be “extremely important for clinicians. It’s a revolution in type 2 diabetes treatment, and perhaps in those without diabetes who have heart failure...It’s not about a single company, but experts involved in all the different trials of the different SGLT2 inhibitors...We’re still seeing the huge impact that the SGLT2 inhibitors have made, and the incretins as well. We’re still living in these rumbling years after these huge trials.”
Del Prato also named that symposium as a meeting highlight.
“From a clinical point of view, I think the EMPA-REG 5-year session will be of great interest. That was really a turning point not only in the field of diabetes, but also in cardiology and nephrology. I think that will be a great opportunity to see how quickly and how importantly SGLT2 inhibition has turned into a great opportunity for many people.”
Who’s “right” – diabetologists or cardiologists?
Another session likely to draw a crowd of clinicians is a debate about which guidelines are “right”: the ESC’s, which advise first-line use of an SGLT2 inhibitor or glucagon-like peptide-1 (GLP-1) agonist for patients with established CVD or those at high risk, or the more conservative EASD/American Diabetes Association’s, which still advise metformin as first-line therapy for type 2 diabetes.
Rydén, who is professor and senior consultant in endocrinology at the Karolinska University Hospital and Karolinska Institute, Sweden, commented, “The difference is in how aggressive to be in treatment and when adding drugs...I think we have slightly different ways of seeing things and how we implement them.”
Del Prato noted, “We need to clear the fog about what are the current indications for people with diabetes. There is definitely a point of contact between cardiology and diabetology. ... We like to split [the disciplines] up, but discussion is a good way to get people thinking.”
“It will be very important to address the importance of glucose control but yet also leverage a new form of treatment that will have properties above and beyond glucose-lowering capacity.”
Other big trial results: CGM after MI, semaglutide for obesity
Other major new trial results to be presented in dedicated sessions include LIBERATES (Improving Glucose Control in Patients With Diabetes Following Myocardial Infarction: The Role of a Novel Glycaemic Monitoring), and STEP program (Semaglutide for the Treatment of Obesity).
LIBERATES will compare glycemic control with the Abbott FreeStyle Libre 14-day sensor and standard fingerstick glucose monitoring versus blinded continuous glucose monitoring (CGM) for 90 days after a heart attack. It was a late addition to the meeting program, Rydén noted.
The semaglutide study is looking at weight loss associated with a higher dose of the GLP-1 agonist than is currently approved for diabetes, similar to the way in which liraglutide was developed as an obesity agent after first gaining approval for type 2 diabetes.
Regarding semaglutide, Rydén said, “I’ve heard this one is quite efficient. It will be interesting.”
Personalized medicine, COVID-19, intermittent fasting, and much more
Both Rydén and Del Prato also said they were looking forward to a joint EASD/American Diabetes Association symposium on a newly launched precision medicine initiative. The session will include talks on subclassifications of diabetes, genetics, and precision diabetes medicine in practice, as well as lessons on the latter from Greenland.
Rydén noted, “I think it’s interesting for everyone, from the primary healthcare physician to the basic scientist. We’re trying to understand why we have this huge diabetic panorama and how do we identify the subject who should have a specific treatment, or perhaps [will] develop a specific complication of diabetes.”
This field, he predicted, “will grow enormously in the next 10 years.”
Del Prato pointed out, “Diabetes is more heterogeneous than we tend to believe for both types. Better guidance for individualization of treatments could be a great opportunity. ... Ways to better genotype and phenotype the population are becoming less expensive and easier to access. It will be a different way to treat diabetes in the future.”
Other noteworthy conference sessions will address COVID-19 and diabetes, intermittent fasting, new technologies, diabetes and cancer, the role of liver surveillance in patients with diabetes, medicines that can cause diabetes, exercise in type 1 diabetes, and the burden of hypoglycemia.
There will also be opportunities for networking, Del Prato said. “You’ll be able to walk around with your own avatar. You’ll be assisted by [artificial intelligence] to build your own program based on what you’ve been following. You can participate in discussion rooms. You can walk in and out.”
“We hope people will appreciate the science and the spirit of the congress – mingling, interacting, chatting to start discussion and maybe collaboration. It will be lots of fun. I would like to invite all Medscape readers to come and register.
Rydén has reported being a consultant, speaker, and/or advisory board member for Novo Nordisk, Eli Lilly, Boehringer Ingelheim, Novartis, and AstraZeneca. Del Prato has reported being a speaker, advisory board member, and/or receiving research support from AstraZeneca, Boehringer Ingelheim, Eli Lilly, MSD, Novartis, Novo Nordisk, Sanofi, Servier, and Takeda.
This article first appeared on Medscape.com.
Vacuum device quickly stops postpartum hemorrhage
A novel intrauterine device that uses suction to compress the uterus to control postpartum hemorrhage has received high marks for effectiveness and ease of use, researchers say.
Calling this approach “a stroke of brilliance,” and is less risky as well.
“This device can be placed in the uterus within a minute or so and does not need any initial anesthesia and would not be associated with the delay needed for a surgical approach,” Dr. Byrne explained. Dr. Byrne, who was not involved in the study, is chair of the department of obstetrics and gynecology at Santa Clara Valley Medical Center in San Jose, Calif.
To test the efficacy and safety of the device (Jada System, Alydia Health), Mary E. D’Alton, MD, and colleagues conducted a prospective, observational treatment study in 12 U.S. medical centers. They reported their findings in an article published online Sept. 9 in Obstetrics and Gynecology.
“The Jada System (novel intrauterine vacuum-induced hemorrhage-control device) was specifically designed to offer rapid treatment by applying low-level intrauterine vacuum to facilitate the physiologic forces of uterine contractions to constrict myometrial blood vessels and achieve hemostasis,” Dr. D’Alton, from New York–Presbyterian/Columbia University Irving Medical Center in New York, and colleagues wrote.
“The device had a low rate of adverse events during this study, all of which were expected risks and resolved with treatment without serious clinical sequelae. Investigators, all first-time users of the device, found the system easy to use, which suggests that, after device education and with availability of a quick reference guide outlining steps, there is a minimal learning curve for use,” they added.
Alydia Health, the company that developed the device, funded this study and supported the research staff, who recruited participants and gathered follow-up data on them. On Sept. 9, the U.S. Food and Drug Administration granted 510(k) clearance for the device, according to a company news release.
Effective, safe
The multicenter study included 107 patients (mean age, 29.7 years) with postpartum hemorrhage or abnormal postpartum uterine bleeding, 106 of whom received any study treatment with the device attached to vacuum. More than half (57%) of the participants were White, and just fewer than one-quarter (24%) were Black.
Treatment was successful in 94% (100/106) of participants, with “definitive control of abnormal bleeding” occurring in a median of 3 minutes after attachment to vacuum.
Eight adverse events were judged to have been possibly related to the device or procedure: four cases of endometritis, and one case each of presumed endometritis, bacterial vaginosis, vaginal candidiasis, and disruption of a vaginal laceration repair. The eight adverse events were identified as potential risks, and all resolved without serious clinical consequences.
Thirty-five patients required transfusions of 1-3 U of red blood cells, and five patients required at least 4 U of red blood cells.
Uterine atony most frequent culprit
As many as 80% of postpartum hemorrhages are caused by uterine atony, according to the authors.
Dr. Byrne explained that the uterus is a muscular organ that contains many “spiral arteries” that are “squeezed” by the uterus as it tightens down after childbirth, which prevents them from bleeding excessively.
“With uterine atony, the uterus muscle doesn’t squeeze effectively, and therefore it’s not one or two arteries, it’s hundreds and hundreds of small arteries and capillaries [and] arterioles all bleeding; it’s a wide area of uterus,” he continued.
When medications alone are ineffective at controlling bleeding, tamponade is often added to put outward pressure on the inner wall of the uterus for 12-24 hours. Although tamponade is effective in approximately 87% of atony-related cases of postpartum hemorrhage, the use of outward pressure on the uterine walls “is counterintuitive if the ultimate goal is uterine contraction,” the authors wrote.
Dr. Byrne said he and his colleagues saw this device several years ago, and they felt at the time that it appeared to be “more intuitive to use vacuum to compress the uterus inward compared to the nonetheless valuable and effective Bakri balloon and other techniques that expand the uterus outward.”
The fact that there is no need for prophylactic antibiotics also sets the vacuum device apart from the Bakri balloon, use of which routinely involves administration of prophylactic antibiotics, Dr. Byrne said.
In the current study, 64% of participants were obese, which makes management of postpartum hemorrhage “really challenging” because it’s difficult to effectively massage the uterus through adipose tissue, Dr. Byrne explained. Patients with obesity “also have different hemodynamics for how effectively [injected medications will] be delivered to the uterus,” he added.
“A device like this that could be placed and works so efficiently – even with an obese patient – that’s actually very powerful,” Dr. Byrne said.
Quick placement, almost immediate improvement
The discomfort experienced during placement of the device is similar to that experienced during sweeping of the uterus, Dr. Byrne explained. “You’d want a patient comfortable, ideally with an epidural already active, but if it’s an emergency, you wouldn’t have to wait for that; you could sweep the uterus quickly, place this, initiate suction, and it would all be so quick you could usually talk a patient through it and get it done,” Dr. Byrne continued.
Almost all of the investigators (98%) said the device was easy to use, and 97% said they would recommend it.
The vacuum device is made of medical-grade silicone and consists of an oval-shaped intrauterine loop at one end and a vacuum connector at the other end that can be attached to a standard suction cannister. On the inner side of the intrauterine loop are 20 vacuum pores covered by a shield that protects uterine tissue and prevents the vacuum pores from clogging with tissue or clotted blood.
Before insertion of the vacuum device, the clinician manually sweeps the uterus to identify retained placental fragments and to assess the uterine cavity. The distal end of the device is inserted into the uterus, and a cervical seal, positioned just outside the cervical os, is filled with 60 to 120 cc of sterile fluid. The proximal end is attached to low-level vacuum at a pressure of 80 ± 10 mm Hg. The device is left in place with continued suction for at least 1 hour after bleeding is controlled, at which time the suction is disconnected and the cervical seal is emptied. The device remains in place for at least 30 minutes, during which the patient is observed closely.
“It looks like 75%-80% of cases stop bleeding within 5 minutes. ... Then you stop the pressure after an hour [and] wait at least 30 minutes. You could actually have this out of the patient’s body within 2 hours,” Dr. Byrne said.
Dr. Byrne has disclosed no such financial relationships.
A version of this article originally appeared on Medscape.com.
A novel intrauterine device that uses suction to compress the uterus to control postpartum hemorrhage has received high marks for effectiveness and ease of use, researchers say.
Calling this approach “a stroke of brilliance,” and is less risky as well.
“This device can be placed in the uterus within a minute or so and does not need any initial anesthesia and would not be associated with the delay needed for a surgical approach,” Dr. Byrne explained. Dr. Byrne, who was not involved in the study, is chair of the department of obstetrics and gynecology at Santa Clara Valley Medical Center in San Jose, Calif.
To test the efficacy and safety of the device (Jada System, Alydia Health), Mary E. D’Alton, MD, and colleagues conducted a prospective, observational treatment study in 12 U.S. medical centers. They reported their findings in an article published online Sept. 9 in Obstetrics and Gynecology.
“The Jada System (novel intrauterine vacuum-induced hemorrhage-control device) was specifically designed to offer rapid treatment by applying low-level intrauterine vacuum to facilitate the physiologic forces of uterine contractions to constrict myometrial blood vessels and achieve hemostasis,” Dr. D’Alton, from New York–Presbyterian/Columbia University Irving Medical Center in New York, and colleagues wrote.
“The device had a low rate of adverse events during this study, all of which were expected risks and resolved with treatment without serious clinical sequelae. Investigators, all first-time users of the device, found the system easy to use, which suggests that, after device education and with availability of a quick reference guide outlining steps, there is a minimal learning curve for use,” they added.
Alydia Health, the company that developed the device, funded this study and supported the research staff, who recruited participants and gathered follow-up data on them. On Sept. 9, the U.S. Food and Drug Administration granted 510(k) clearance for the device, according to a company news release.
Effective, safe
The multicenter study included 107 patients (mean age, 29.7 years) with postpartum hemorrhage or abnormal postpartum uterine bleeding, 106 of whom received any study treatment with the device attached to vacuum. More than half (57%) of the participants were White, and just fewer than one-quarter (24%) were Black.
Treatment was successful in 94% (100/106) of participants, with “definitive control of abnormal bleeding” occurring in a median of 3 minutes after attachment to vacuum.
Eight adverse events were judged to have been possibly related to the device or procedure: four cases of endometritis, and one case each of presumed endometritis, bacterial vaginosis, vaginal candidiasis, and disruption of a vaginal laceration repair. The eight adverse events were identified as potential risks, and all resolved without serious clinical consequences.
Thirty-five patients required transfusions of 1-3 U of red blood cells, and five patients required at least 4 U of red blood cells.
Uterine atony most frequent culprit
As many as 80% of postpartum hemorrhages are caused by uterine atony, according to the authors.
Dr. Byrne explained that the uterus is a muscular organ that contains many “spiral arteries” that are “squeezed” by the uterus as it tightens down after childbirth, which prevents them from bleeding excessively.
“With uterine atony, the uterus muscle doesn’t squeeze effectively, and therefore it’s not one or two arteries, it’s hundreds and hundreds of small arteries and capillaries [and] arterioles all bleeding; it’s a wide area of uterus,” he continued.
When medications alone are ineffective at controlling bleeding, tamponade is often added to put outward pressure on the inner wall of the uterus for 12-24 hours. Although tamponade is effective in approximately 87% of atony-related cases of postpartum hemorrhage, the use of outward pressure on the uterine walls “is counterintuitive if the ultimate goal is uterine contraction,” the authors wrote.
Dr. Byrne said he and his colleagues saw this device several years ago, and they felt at the time that it appeared to be “more intuitive to use vacuum to compress the uterus inward compared to the nonetheless valuable and effective Bakri balloon and other techniques that expand the uterus outward.”
The fact that there is no need for prophylactic antibiotics also sets the vacuum device apart from the Bakri balloon, use of which routinely involves administration of prophylactic antibiotics, Dr. Byrne said.
In the current study, 64% of participants were obese, which makes management of postpartum hemorrhage “really challenging” because it’s difficult to effectively massage the uterus through adipose tissue, Dr. Byrne explained. Patients with obesity “also have different hemodynamics for how effectively [injected medications will] be delivered to the uterus,” he added.
“A device like this that could be placed and works so efficiently – even with an obese patient – that’s actually very powerful,” Dr. Byrne said.
Quick placement, almost immediate improvement
The discomfort experienced during placement of the device is similar to that experienced during sweeping of the uterus, Dr. Byrne explained. “You’d want a patient comfortable, ideally with an epidural already active, but if it’s an emergency, you wouldn’t have to wait for that; you could sweep the uterus quickly, place this, initiate suction, and it would all be so quick you could usually talk a patient through it and get it done,” Dr. Byrne continued.
Almost all of the investigators (98%) said the device was easy to use, and 97% said they would recommend it.
The vacuum device is made of medical-grade silicone and consists of an oval-shaped intrauterine loop at one end and a vacuum connector at the other end that can be attached to a standard suction cannister. On the inner side of the intrauterine loop are 20 vacuum pores covered by a shield that protects uterine tissue and prevents the vacuum pores from clogging with tissue or clotted blood.
Before insertion of the vacuum device, the clinician manually sweeps the uterus to identify retained placental fragments and to assess the uterine cavity. The distal end of the device is inserted into the uterus, and a cervical seal, positioned just outside the cervical os, is filled with 60 to 120 cc of sterile fluid. The proximal end is attached to low-level vacuum at a pressure of 80 ± 10 mm Hg. The device is left in place with continued suction for at least 1 hour after bleeding is controlled, at which time the suction is disconnected and the cervical seal is emptied. The device remains in place for at least 30 minutes, during which the patient is observed closely.
“It looks like 75%-80% of cases stop bleeding within 5 minutes. ... Then you stop the pressure after an hour [and] wait at least 30 minutes. You could actually have this out of the patient’s body within 2 hours,” Dr. Byrne said.
Dr. Byrne has disclosed no such financial relationships.
A version of this article originally appeared on Medscape.com.
A novel intrauterine device that uses suction to compress the uterus to control postpartum hemorrhage has received high marks for effectiveness and ease of use, researchers say.
Calling this approach “a stroke of brilliance,” and is less risky as well.
“This device can be placed in the uterus within a minute or so and does not need any initial anesthesia and would not be associated with the delay needed for a surgical approach,” Dr. Byrne explained. Dr. Byrne, who was not involved in the study, is chair of the department of obstetrics and gynecology at Santa Clara Valley Medical Center in San Jose, Calif.
To test the efficacy and safety of the device (Jada System, Alydia Health), Mary E. D’Alton, MD, and colleagues conducted a prospective, observational treatment study in 12 U.S. medical centers. They reported their findings in an article published online Sept. 9 in Obstetrics and Gynecology.
“The Jada System (novel intrauterine vacuum-induced hemorrhage-control device) was specifically designed to offer rapid treatment by applying low-level intrauterine vacuum to facilitate the physiologic forces of uterine contractions to constrict myometrial blood vessels and achieve hemostasis,” Dr. D’Alton, from New York–Presbyterian/Columbia University Irving Medical Center in New York, and colleagues wrote.
“The device had a low rate of adverse events during this study, all of which were expected risks and resolved with treatment without serious clinical sequelae. Investigators, all first-time users of the device, found the system easy to use, which suggests that, after device education and with availability of a quick reference guide outlining steps, there is a minimal learning curve for use,” they added.
Alydia Health, the company that developed the device, funded this study and supported the research staff, who recruited participants and gathered follow-up data on them. On Sept. 9, the U.S. Food and Drug Administration granted 510(k) clearance for the device, according to a company news release.
Effective, safe
The multicenter study included 107 patients (mean age, 29.7 years) with postpartum hemorrhage or abnormal postpartum uterine bleeding, 106 of whom received any study treatment with the device attached to vacuum. More than half (57%) of the participants were White, and just fewer than one-quarter (24%) were Black.
Treatment was successful in 94% (100/106) of participants, with “definitive control of abnormal bleeding” occurring in a median of 3 minutes after attachment to vacuum.
Eight adverse events were judged to have been possibly related to the device or procedure: four cases of endometritis, and one case each of presumed endometritis, bacterial vaginosis, vaginal candidiasis, and disruption of a vaginal laceration repair. The eight adverse events were identified as potential risks, and all resolved without serious clinical consequences.
Thirty-five patients required transfusions of 1-3 U of red blood cells, and five patients required at least 4 U of red blood cells.
Uterine atony most frequent culprit
As many as 80% of postpartum hemorrhages are caused by uterine atony, according to the authors.
Dr. Byrne explained that the uterus is a muscular organ that contains many “spiral arteries” that are “squeezed” by the uterus as it tightens down after childbirth, which prevents them from bleeding excessively.
“With uterine atony, the uterus muscle doesn’t squeeze effectively, and therefore it’s not one or two arteries, it’s hundreds and hundreds of small arteries and capillaries [and] arterioles all bleeding; it’s a wide area of uterus,” he continued.
When medications alone are ineffective at controlling bleeding, tamponade is often added to put outward pressure on the inner wall of the uterus for 12-24 hours. Although tamponade is effective in approximately 87% of atony-related cases of postpartum hemorrhage, the use of outward pressure on the uterine walls “is counterintuitive if the ultimate goal is uterine contraction,” the authors wrote.
Dr. Byrne said he and his colleagues saw this device several years ago, and they felt at the time that it appeared to be “more intuitive to use vacuum to compress the uterus inward compared to the nonetheless valuable and effective Bakri balloon and other techniques that expand the uterus outward.”
The fact that there is no need for prophylactic antibiotics also sets the vacuum device apart from the Bakri balloon, use of which routinely involves administration of prophylactic antibiotics, Dr. Byrne said.
In the current study, 64% of participants were obese, which makes management of postpartum hemorrhage “really challenging” because it’s difficult to effectively massage the uterus through adipose tissue, Dr. Byrne explained. Patients with obesity “also have different hemodynamics for how effectively [injected medications will] be delivered to the uterus,” he added.
“A device like this that could be placed and works so efficiently – even with an obese patient – that’s actually very powerful,” Dr. Byrne said.
Quick placement, almost immediate improvement
The discomfort experienced during placement of the device is similar to that experienced during sweeping of the uterus, Dr. Byrne explained. “You’d want a patient comfortable, ideally with an epidural already active, but if it’s an emergency, you wouldn’t have to wait for that; you could sweep the uterus quickly, place this, initiate suction, and it would all be so quick you could usually talk a patient through it and get it done,” Dr. Byrne continued.
Almost all of the investigators (98%) said the device was easy to use, and 97% said they would recommend it.
The vacuum device is made of medical-grade silicone and consists of an oval-shaped intrauterine loop at one end and a vacuum connector at the other end that can be attached to a standard suction cannister. On the inner side of the intrauterine loop are 20 vacuum pores covered by a shield that protects uterine tissue and prevents the vacuum pores from clogging with tissue or clotted blood.
Before insertion of the vacuum device, the clinician manually sweeps the uterus to identify retained placental fragments and to assess the uterine cavity. The distal end of the device is inserted into the uterus, and a cervical seal, positioned just outside the cervical os, is filled with 60 to 120 cc of sterile fluid. The proximal end is attached to low-level vacuum at a pressure of 80 ± 10 mm Hg. The device is left in place with continued suction for at least 1 hour after bleeding is controlled, at which time the suction is disconnected and the cervical seal is emptied. The device remains in place for at least 30 minutes, during which the patient is observed closely.
“It looks like 75%-80% of cases stop bleeding within 5 minutes. ... Then you stop the pressure after an hour [and] wait at least 30 minutes. You could actually have this out of the patient’s body within 2 hours,” Dr. Byrne said.
Dr. Byrne has disclosed no such financial relationships.
A version of this article originally appeared on Medscape.com.
For BP screening, shorter rest time yields similar results
Current guidelines recommend a 5-minute rest period before a blood pressure screening measurement, but that might not be necessary for all patients.

In a prospective crossover study, average differences in blood pressure measurements obtained after 0 or 2 minutes of rest were not significantly different than readings obtained after the recommended 5 minutes of rest in adults with systolic blood pressure below 140 mm Hg.
“The average differences in BP by rest period were small, and BPs obtained after shorter rest periods were noninferior to those obtained after 5 minutes when SBP is below 140,” Tammy M. Brady, MD, PhD, Johns Hopkins University, Baltimore, said in an interview.
“This suggests shorter rest times, even 0 minutes, may be reasonable for screening when the initial SBP is below 140,” said Brady.
She presented her research at the joint scientific sessions of the American Heart Association Council on Hypertension, AHA Council on Kidney in Cardiovascular Disease, and American Society of Hypertension..
A challenging recommendation
The 5-minute rest period is “challenging” to implement in busy clinical settings, Dr. Brady said. The researchers therefore set out to determine the effect of no rest and the effect of a shorter rest period (2 minutes) on blood pressure screening.
They recruited 113 adults (mean age, 55; 64% women, 74% Black) with SBP that ranged from below 115 mm Hg to above 145 mm Hg and with diastolic BP that ranged from below 75 mm Hg to above 105 mm Hg. About one-quarter (28%) had SBP in the stage 2 hypertension range (at least 140 mm Hg).
They obtained four sets of automated BP measurements after 5, 2, or 0 minutes of rest. All participants had their BP measured after a second 5-minute rest period as their last measurement to estimate repeatability.
Overall, there was no significant difference in the average BP obtained at any of the rest periods.
After the first and second 5-minute rest period, BPs were 127.5/74.7 mm Hg and 127.0/75.6 mm Hg, respectively. After 2 and 0 minutes of rest, BPs were 126.8/73.7 mm Hg and 126.5/74.0 mm Hg.
When looking just at adults with SBP below 140 mm Hg, there was no more than an average difference of ±2 mm Hg between BPs obtained at the 5-minute resting periods, compared with the shorter resting periods.
However, in those with SBP below 140 mm Hg, BP values were significantly different (defined as more than ±2 mm Hg) with shorter rest periods, “suggesting that shorter rest periods were in fact inferior to resting for 5 minutes in these patients,” Dr. Brady said.
More efficient, economic
“Economics play a significant role in blood pressure screenings, as clinics not as well-funded may find it especially challenging to implement a uniform, 5-minute rest period before testing, which could ultimately reduce the number of patients able to be screened,” Dr. Brady added in a conference statement.
“While our study sample was small, a reasonable approach based on these findings would be to measure blood pressure after minimal to no rest, and then repeat the measurements after 5 minutes only if a patient is found to have elevated blood pressure,” she said.
Weighing in on the results, Karen A. Griffin, MD, who chairs the AHA council on hypertension, said that “reducing the rest period to screen an individual for hypertension may result in faster throughput in the clinic and confer a cost savings.”
“At the present time, in order to maintain the clinic flow, some clinics use a single, often times ‘nonrested’ BP measurement as a screen, reserving the 5-minute rest automated-office BP measurement for patients found to have an elevated screening BP,” noted Dr. Griffin, professor of medicine, Loyola University Medical Center, Maywood, Ill.
“Nevertheless, even if limiting the use of automated-office BP to those who fail the initial screening BP, a cost savings would still be realized by reducing the currently recommended 5-minute rest to 2 minutes and have the most impact in very busy, less well-funded clinics,” said Dr. Griffin.
She cautioned, however, that further studies in a larger population will be needed before making a change to current clinical practice guidelines.
The study had no specific funding. Dr. Brady and Dr. Griffin have no relevant disclosures.
A version of this article originally appeared on Medscape.com.
Current guidelines recommend a 5-minute rest period before a blood pressure screening measurement, but that might not be necessary for all patients.
In a prospective crossover study, average differences in blood pressure measurements obtained after 0 or 2 minutes of rest were not significantly different than readings obtained after the recommended 5 minutes of rest in adults with systolic blood pressure below 140 mm Hg.
“The average differences in BP by rest period were small, and BPs obtained after shorter rest periods were noninferior to those obtained after 5 minutes when SBP is below 140,” Tammy M. Brady, MD, PhD, Johns Hopkins University, Baltimore, said in an interview.
“This suggests shorter rest times, even 0 minutes, may be reasonable for screening when the initial SBP is below 140,” said Brady.
She presented her research at the joint scientific sessions of the American Heart Association Council on Hypertension, AHA Council on Kidney in Cardiovascular Disease, and American Society of Hypertension..
A challenging recommendation
The 5-minute rest period is “challenging” to implement in busy clinical settings, Dr. Brady said. The researchers therefore set out to determine the effect of no rest and the effect of a shorter rest period (2 minutes) on blood pressure screening.
They recruited 113 adults (mean age, 55; 64% women, 74% Black) with SBP that ranged from below 115 mm Hg to above 145 mm Hg and with diastolic BP that ranged from below 75 mm Hg to above 105 mm Hg. About one-quarter (28%) had SBP in the stage 2 hypertension range (at least 140 mm Hg).
They obtained four sets of automated BP measurements after 5, 2, or 0 minutes of rest. All participants had their BP measured after a second 5-minute rest period as their last measurement to estimate repeatability.
Overall, there was no significant difference in the average BP obtained at any of the rest periods.
After the first and second 5-minute rest period, BPs were 127.5/74.7 mm Hg and 127.0/75.6 mm Hg, respectively. After 2 and 0 minutes of rest, BPs were 126.8/73.7 mm Hg and 126.5/74.0 mm Hg.
When looking just at adults with SBP below 140 mm Hg, there was no more than an average difference of ±2 mm Hg between BPs obtained at the 5-minute resting periods, compared with the shorter resting periods.
However, in those with SBP below 140 mm Hg, BP values were significantly different (defined as more than ±2 mm Hg) with shorter rest periods, “suggesting that shorter rest periods were in fact inferior to resting for 5 minutes in these patients,” Dr. Brady said.
More efficient, economic
“Economics play a significant role in blood pressure screenings, as clinics not as well-funded may find it especially challenging to implement a uniform, 5-minute rest period before testing, which could ultimately reduce the number of patients able to be screened,” Dr. Brady added in a conference statement.
“While our study sample was small, a reasonable approach based on these findings would be to measure blood pressure after minimal to no rest, and then repeat the measurements after 5 minutes only if a patient is found to have elevated blood pressure,” she said.
Weighing in on the results, Karen A. Griffin, MD, who chairs the AHA council on hypertension, said that “reducing the rest period to screen an individual for hypertension may result in faster throughput in the clinic and confer a cost savings.”
“At the present time, in order to maintain the clinic flow, some clinics use a single, often times ‘nonrested’ BP measurement as a screen, reserving the 5-minute rest automated-office BP measurement for patients found to have an elevated screening BP,” noted Dr. Griffin, professor of medicine, Loyola University Medical Center, Maywood, Ill.
“Nevertheless, even if limiting the use of automated-office BP to those who fail the initial screening BP, a cost savings would still be realized by reducing the currently recommended 5-minute rest to 2 minutes and have the most impact in very busy, less well-funded clinics,” said Dr. Griffin.
She cautioned, however, that further studies in a larger population will be needed before making a change to current clinical practice guidelines.
The study had no specific funding. Dr. Brady and Dr. Griffin have no relevant disclosures.
A version of this article originally appeared on Medscape.com.
Current guidelines recommend a 5-minute rest period before a blood pressure screening measurement, but that might not be necessary for all patients.
In a prospective crossover study, average differences in blood pressure measurements obtained after 0 or 2 minutes of rest were not significantly different than readings obtained after the recommended 5 minutes of rest in adults with systolic blood pressure below 140 mm Hg.
“The average differences in BP by rest period were small, and BPs obtained after shorter rest periods were noninferior to those obtained after 5 minutes when SBP is below 140,” Tammy M. Brady, MD, PhD, Johns Hopkins University, Baltimore, said in an interview.
“This suggests shorter rest times, even 0 minutes, may be reasonable for screening when the initial SBP is below 140,” said Brady.
She presented her research at the joint scientific sessions of the American Heart Association Council on Hypertension, AHA Council on Kidney in Cardiovascular Disease, and American Society of Hypertension..
A challenging recommendation
The 5-minute rest period is “challenging” to implement in busy clinical settings, Dr. Brady said. The researchers therefore set out to determine the effect of no rest and the effect of a shorter rest period (2 minutes) on blood pressure screening.
They recruited 113 adults (mean age, 55; 64% women, 74% Black) with SBP that ranged from below 115 mm Hg to above 145 mm Hg and with diastolic BP that ranged from below 75 mm Hg to above 105 mm Hg. About one-quarter (28%) had SBP in the stage 2 hypertension range (at least 140 mm Hg).
They obtained four sets of automated BP measurements after 5, 2, or 0 minutes of rest. All participants had their BP measured after a second 5-minute rest period as their last measurement to estimate repeatability.
Overall, there was no significant difference in the average BP obtained at any of the rest periods.
After the first and second 5-minute rest period, BPs were 127.5/74.7 mm Hg and 127.0/75.6 mm Hg, respectively. After 2 and 0 minutes of rest, BPs were 126.8/73.7 mm Hg and 126.5/74.0 mm Hg.
When looking just at adults with SBP below 140 mm Hg, there was no more than an average difference of ±2 mm Hg between BPs obtained at the 5-minute resting periods, compared with the shorter resting periods.
However, in those with SBP below 140 mm Hg, BP values were significantly different (defined as more than ±2 mm Hg) with shorter rest periods, “suggesting that shorter rest periods were in fact inferior to resting for 5 minutes in these patients,” Dr. Brady said.
More efficient, economic
“Economics play a significant role in blood pressure screenings, as clinics not as well-funded may find it especially challenging to implement a uniform, 5-minute rest period before testing, which could ultimately reduce the number of patients able to be screened,” Dr. Brady added in a conference statement.
“While our study sample was small, a reasonable approach based on these findings would be to measure blood pressure after minimal to no rest, and then repeat the measurements after 5 minutes only if a patient is found to have elevated blood pressure,” she said.
Weighing in on the results, Karen A. Griffin, MD, who chairs the AHA council on hypertension, said that “reducing the rest period to screen an individual for hypertension may result in faster throughput in the clinic and confer a cost savings.”
“At the present time, in order to maintain the clinic flow, some clinics use a single, often times ‘nonrested’ BP measurement as a screen, reserving the 5-minute rest automated-office BP measurement for patients found to have an elevated screening BP,” noted Dr. Griffin, professor of medicine, Loyola University Medical Center, Maywood, Ill.
“Nevertheless, even if limiting the use of automated-office BP to those who fail the initial screening BP, a cost savings would still be realized by reducing the currently recommended 5-minute rest to 2 minutes and have the most impact in very busy, less well-funded clinics,” said Dr. Griffin.
She cautioned, however, that further studies in a larger population will be needed before making a change to current clinical practice guidelines.
The study had no specific funding. Dr. Brady and Dr. Griffin have no relevant disclosures.
A version of this article originally appeared on Medscape.com.
FROM JOINT HYPERTENSION 2020
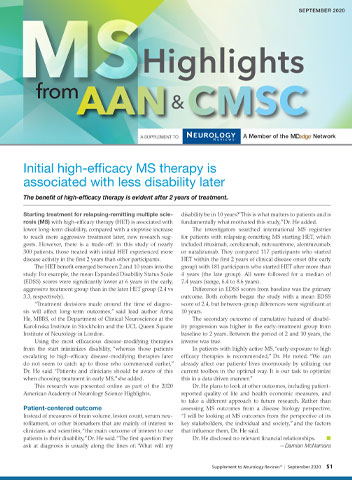
MS Highlights From the AAN & CMSC Annual Meetings
This supplement to Neurology Reviews compiles MS-related news briefs from the 2020 virtual annual meetings of the American Academy of Neurology and the Consortium of Multiple Sclerosis Centers.
Click here to read the supplement
This supplement to Neurology Reviews compiles MS-related news briefs from the 2020 virtual annual meetings of the American Academy of Neurology and the Consortium of Multiple Sclerosis Centers.
Click here to read the supplement
This supplement to Neurology Reviews compiles MS-related news briefs from the 2020 virtual annual meetings of the American Academy of Neurology and the Consortium of Multiple Sclerosis Centers.
Click here to read the supplement

2020-2021 respiratory viral season: Onset, presentations, and testing likely to differ in pandemic
Respiratory virus seasons usually follow a fairly well-known pattern. Enterovirus 68 (EV-D68) is a summer-to-early fall virus with biennial peak years. Rhinovirus (HRv) and adenovirus (Adv) occur nearly year-round but may have small upticks in the first month or so that children return to school. Early in the school year, upper respiratory infections from both HRv and Adv and viral sore throats from Adv are common, with conjunctivitis from Adv outbreaks in some years. October to November is human parainfluenza (HPiV) 1 and 2 season, often presenting as croup. Human metapneumovirus infections span October through April. In late November to December, influenza begins, usually with an A type, later transitioning to a B type in February through April. Also in December, respiratory syncytial virus (RSV) starts, characteristically with bronchiolitis presentations, peaking in February to March and tapering off in May. In late March to April, HPiV 3 also appears for 4-6 weeks.

Will 2020-2021 be different?
Summer was remarkably free of expected enterovirus activity, suggesting that the seasonal parade may differ this year. Remember that the 2019-2020 respiratory season suddenly and nearly completely stopped in March because of social distancing and lockdowns needed to address the SARS-CoV-2 pandemic.
The mild influenza season in the southern hemisphere suggests that our influenza season also could be mild. But perhaps not – most southern hemisphere countries that are surveyed for influenza activities had the most intense SARS-CoV-2 mitigations, making the observed mildness potentially related more to social mitigation than less virulent influenza strains. If so, southern hemisphere influenza data may not apply to the United States, where social distancing and masks are ignored or used inconsistently by almost half the population.

Further, the stop-and-go pattern of in-person school/college attendance adds to uncertainties for the usual orderly virus-specific seasonality. The result may be multiple stop-and-go “pop-up” or “mini” outbreaks for any given virus potentially reflected as exaggerated local or regional differences in circulation of various viruses. The erratic seasonality also would increase coinfections, which could present with more severe or different symptoms.
SARS-CoV-2’s potential interaction
Will the relatively mild presentations for most children with SARS-CoV-2 hold up in the setting of coinfections or sequential respiratory viral infections? Could SARS-CoV-2 cause worse/more prolonged symptoms or more sequelae if paired simultaneously or in tandem with a traditional respiratory virus? To date, data on the frequency and severity of SARS-CoV-2 coinfections are conflicting and sparse, but it appears that non-SARS-CoV-2 viruses can be involved in 15%-50% pediatric acute respiratory infections.1,2
However, it may not be important to know about coinfecting viruses other than influenza (can be treated) or SARS-CoV-2 (needs quarantine and contact tracing), unless symptoms are atypical or more severe than usual. For example, a young child with bronchiolitis is most likely infected with RSV, but HPiV, influenza, metapneumovirus, HRv, and even SARS-CoV-2 can cause bronchiolitis. Even so, testing outpatients for RSV or non-influenza is not routine or even clinically helpful. Supportive treatment and restriction from daycare attendance are sufficient management for outpatient ARIs whether presenting as bronchiolitis or not.
Considerations for SARS-CoV-2 testing: Outpatient bronchiolitis
If a child presents with classic bronchiolitis but has above moderate to severe symptoms, is SARS-CoV-2 a consideration? Perhaps, if SARS-CoV-2 acts similarly to non-SARS-CoV-2s.
A recent report from the 30th Multicenter Airway Research Collaboration (MARC-30) surveillance study (2007-2014) of children hospitalized with clinical bronchiolitis evaluated respiratory viruses, including RSV and the four common non-SARS coronaviruses using molecular testing.3 Among 1,880 subjects, a CoV (alpha CoV: NL63 or 229E, or beta CoV: KKU1 or OC43) was detected in 12%. Yet most had only RSV (n = 1,661); 32 had only CoV (n = 32). But note that 219 had both.
Bronchiolitis subjects with CoV were older – median 3.7 (1.4-5.8) vs. 2.8 (1.9-7.2) years – and more likely male than were RSV subjects (68% vs. 58%). OC43 was most frequent followed by equal numbers of HKU1 and NL63, while 229E was the least frequent. Medical utilization and severity did not differ among the CoVs, or between RSV+CoV vs. RSV alone, unless one considered CoV viral load as a variable. ICU use increased when the polymerase chain reaction cycle threshold result indicated a high CoV viral load.
These data suggest CoVs are not infrequent coinfectors with RSV in bronchiolitis – and that SARS-CoV-2 is the same. Therefore, a bronchiolitis presentation doesn’t necessarily take us off the hook for the need to consider SARS-CoV-2 testing, particularly in the somewhat older bronchiolitis patient with more than mild symptoms.
Considerations for SARS-CoV-2 testing: Outpatient influenza-like illness
In 2020-2021, the Centers for Disease Control and Prevention recommends considering empiric antiviral treatment for ILIs (fever plus either cough or sore throat) based upon our clinical judgement, even in non-high-risk children.4
While pediatric COVID-19 illnesses are predominantly asymptomatic or mild, a febrile ARI is also a SARS-CoV-2 compatible presentation. So, if all we use is our clinical judgment, how do we know if the febrile ARI is due to influenza or SARS-CoV-2 or both? At least one study used a highly sensitive and specific molecular influenza test to show that the accuracy of clinically diagnosing influenza in children is not much better than flipping a coin and would lead to potential antiviral overuse.5
So, it seems ideal to test for influenza when possible. Point-of-care (POC) tests are frequently used for outpatients. Eight POC Clinical Laboratory Improvement Amendments (CLIA)–waived kits, some also detecting RSV, are available but most have modest sensitivity (60%-80%) compared with lab-based molecular tests.6 That said, if supplies and kits for one of the POC tests are available to us during these SARS-CoV-2 stressed times (back orders seem more common this year), a positive influenza test in the first 48 hours of symptoms confirms the option to prescribe an antiviral. Yet how will we have confidence that the febrile ARI is not also partly due to SARS-CoV-2? Currently febrile ARIs usually are considered SARS-CoV-2 and the children are sent for SARS-CoV-2 testing. During influenza season, it seems we will need to continue to send febrile outpatients for SARS-CoV-2 testing, even if POC influenza positive, via whatever mechanisms are available as time goes on.
We expect more rapid pediatric testing modalities for SARS-CoV-2 (maybe even saliva tests) to become available over the next months. Indeed, rapid antigen tests and rapid molecular tests are being evaluated in adults and seem destined for CLIA waivers as POC tests, and even home testing kits. Pediatric approvals hopefully also will occur. So, the pathways for SARS-CoV-2 testing available now will likely change over this winter. But be aware that supplies/kits will be prioritized to locations within high need areas and bulk purchase contracts. So POC kits may remain scarce for practices, meaning a reference laboratory still could be the way to go for SARS-CoV-2 for at least the rest of 2020. Reference labs are becoming creative as well; one combined detection of influenza A, influenza B, RSV, and SARS-CoV-2 into one test, and hopes to get approval for swab collection that can be done by families at home and mailed in.
Summary
Expect variations on the traditional parade of seasonal respiratory viruses, with increased numbers of coinfections. Choosing the outpatient who needs influenza testing is the same as in past years, although we have CDC permissive recommendations to prescribe antivirals for any outpatient ILI within the first 48 hours of symptoms. Still, POC testing for influenza remains potentially valuable in the ILI patient. The choice of whether and how to test for SARS-CoV-2 given its potential to be a primary or coinfecting agent in presentations linked more closely to a traditional virus (e.g. RSV bronchiolitis) will be a test of our clinical judgement until more data and easier testing are available. Further complicating coinfection recognition is the fact that many sick visits occur by telehealth and much testing is done at drive-through SARS-CoV-2 testing facilities with no clinician exam. Unless we are liberal in SARS-CoV-2 testing, detecting SARS-CoV-2 coinfections is easier said than done given its usually mild presentation being overshadowed by any coinfecting virus.
But understanding who has SARS-CoV-2, even as a coinfection, still is essential in controlling the pandemic. We will need to be vigilant for evolving approaches to SARS-CoV-2 testing in the context of symptomatic ARI presentations, knowing this will likely remain a moving target for the foreseeable future.
Dr. Harrison is professor of pediatrics and pediatric infectious diseases at Children’s Mercy Hospital-Kansas City, Mo. Children’s Mercy Hospital receives grant funding to study two candidate RSV vaccines. The hospital also receives CDC funding under the New Vaccine Surveillance Network for multicenter surveillance of acute respiratory infections, including influenza, RSV, and parainfluenza virus. Email Dr. Harrison at pdnews@mdedge.com.
References
1. Pediatrics. 2020;146(1):e20200961.
2. JAMA. 2020 May 26;323(20):2085-6.
3. Pediatrics. 2020. doi: 10.1542/peds.2020-1267.
4. www.cdc.gov/flu/professionals/antivirals/summary-clinicians.htm.
5. J. Pediatr. 2020. doi: 10.1016/j.jpeds.2020.08.007.
6. www.cdc.gov/flu/professionals/diagnosis/table-nucleic-acid-detection.html.
Respiratory virus seasons usually follow a fairly well-known pattern. Enterovirus 68 (EV-D68) is a summer-to-early fall virus with biennial peak years. Rhinovirus (HRv) and adenovirus (Adv) occur nearly year-round but may have small upticks in the first month or so that children return to school. Early in the school year, upper respiratory infections from both HRv and Adv and viral sore throats from Adv are common, with conjunctivitis from Adv outbreaks in some years. October to November is human parainfluenza (HPiV) 1 and 2 season, often presenting as croup. Human metapneumovirus infections span October through April. In late November to December, influenza begins, usually with an A type, later transitioning to a B type in February through April. Also in December, respiratory syncytial virus (RSV) starts, characteristically with bronchiolitis presentations, peaking in February to March and tapering off in May. In late March to April, HPiV 3 also appears for 4-6 weeks.
Will 2020-2021 be different?
Summer was remarkably free of expected enterovirus activity, suggesting that the seasonal parade may differ this year. Remember that the 2019-2020 respiratory season suddenly and nearly completely stopped in March because of social distancing and lockdowns needed to address the SARS-CoV-2 pandemic.
The mild influenza season in the southern hemisphere suggests that our influenza season also could be mild. But perhaps not – most southern hemisphere countries that are surveyed for influenza activities had the most intense SARS-CoV-2 mitigations, making the observed mildness potentially related more to social mitigation than less virulent influenza strains. If so, southern hemisphere influenza data may not apply to the United States, where social distancing and masks are ignored or used inconsistently by almost half the population.
Further, the stop-and-go pattern of in-person school/college attendance adds to uncertainties for the usual orderly virus-specific seasonality. The result may be multiple stop-and-go “pop-up” or “mini” outbreaks for any given virus potentially reflected as exaggerated local or regional differences in circulation of various viruses. The erratic seasonality also would increase coinfections, which could present with more severe or different symptoms.
SARS-CoV-2’s potential interaction
Will the relatively mild presentations for most children with SARS-CoV-2 hold up in the setting of coinfections or sequential respiratory viral infections? Could SARS-CoV-2 cause worse/more prolonged symptoms or more sequelae if paired simultaneously or in tandem with a traditional respiratory virus? To date, data on the frequency and severity of SARS-CoV-2 coinfections are conflicting and sparse, but it appears that non-SARS-CoV-2 viruses can be involved in 15%-50% pediatric acute respiratory infections.1,2
However, it may not be important to know about coinfecting viruses other than influenza (can be treated) or SARS-CoV-2 (needs quarantine and contact tracing), unless symptoms are atypical or more severe than usual. For example, a young child with bronchiolitis is most likely infected with RSV, but HPiV, influenza, metapneumovirus, HRv, and even SARS-CoV-2 can cause bronchiolitis. Even so, testing outpatients for RSV or non-influenza is not routine or even clinically helpful. Supportive treatment and restriction from daycare attendance are sufficient management for outpatient ARIs whether presenting as bronchiolitis or not.
Considerations for SARS-CoV-2 testing: Outpatient bronchiolitis
If a child presents with classic bronchiolitis but has above moderate to severe symptoms, is SARS-CoV-2 a consideration? Perhaps, if SARS-CoV-2 acts similarly to non-SARS-CoV-2s.
A recent report from the 30th Multicenter Airway Research Collaboration (MARC-30) surveillance study (2007-2014) of children hospitalized with clinical bronchiolitis evaluated respiratory viruses, including RSV and the four common non-SARS coronaviruses using molecular testing.3 Among 1,880 subjects, a CoV (alpha CoV: NL63 or 229E, or beta CoV: KKU1 or OC43) was detected in 12%. Yet most had only RSV (n = 1,661); 32 had only CoV (n = 32). But note that 219 had both.
Bronchiolitis subjects with CoV were older – median 3.7 (1.4-5.8) vs. 2.8 (1.9-7.2) years – and more likely male than were RSV subjects (68% vs. 58%). OC43 was most frequent followed by equal numbers of HKU1 and NL63, while 229E was the least frequent. Medical utilization and severity did not differ among the CoVs, or between RSV+CoV vs. RSV alone, unless one considered CoV viral load as a variable. ICU use increased when the polymerase chain reaction cycle threshold result indicated a high CoV viral load.
These data suggest CoVs are not infrequent coinfectors with RSV in bronchiolitis – and that SARS-CoV-2 is the same. Therefore, a bronchiolitis presentation doesn’t necessarily take us off the hook for the need to consider SARS-CoV-2 testing, particularly in the somewhat older bronchiolitis patient with more than mild symptoms.
Considerations for SARS-CoV-2 testing: Outpatient influenza-like illness
In 2020-2021, the Centers for Disease Control and Prevention recommends considering empiric antiviral treatment for ILIs (fever plus either cough or sore throat) based upon our clinical judgement, even in non-high-risk children.4
While pediatric COVID-19 illnesses are predominantly asymptomatic or mild, a febrile ARI is also a SARS-CoV-2 compatible presentation. So, if all we use is our clinical judgment, how do we know if the febrile ARI is due to influenza or SARS-CoV-2 or both? At least one study used a highly sensitive and specific molecular influenza test to show that the accuracy of clinically diagnosing influenza in children is not much better than flipping a coin and would lead to potential antiviral overuse.5
So, it seems ideal to test for influenza when possible. Point-of-care (POC) tests are frequently used for outpatients. Eight POC Clinical Laboratory Improvement Amendments (CLIA)–waived kits, some also detecting RSV, are available but most have modest sensitivity (60%-80%) compared with lab-based molecular tests.6 That said, if supplies and kits for one of the POC tests are available to us during these SARS-CoV-2 stressed times (back orders seem more common this year), a positive influenza test in the first 48 hours of symptoms confirms the option to prescribe an antiviral. Yet how will we have confidence that the febrile ARI is not also partly due to SARS-CoV-2? Currently febrile ARIs usually are considered SARS-CoV-2 and the children are sent for SARS-CoV-2 testing. During influenza season, it seems we will need to continue to send febrile outpatients for SARS-CoV-2 testing, even if POC influenza positive, via whatever mechanisms are available as time goes on.
We expect more rapid pediatric testing modalities for SARS-CoV-2 (maybe even saliva tests) to become available over the next months. Indeed, rapid antigen tests and rapid molecular tests are being evaluated in adults and seem destined for CLIA waivers as POC tests, and even home testing kits. Pediatric approvals hopefully also will occur. So, the pathways for SARS-CoV-2 testing available now will likely change over this winter. But be aware that supplies/kits will be prioritized to locations within high need areas and bulk purchase contracts. So POC kits may remain scarce for practices, meaning a reference laboratory still could be the way to go for SARS-CoV-2 for at least the rest of 2020. Reference labs are becoming creative as well; one combined detection of influenza A, influenza B, RSV, and SARS-CoV-2 into one test, and hopes to get approval for swab collection that can be done by families at home and mailed in.
Summary
Expect variations on the traditional parade of seasonal respiratory viruses, with increased numbers of coinfections. Choosing the outpatient who needs influenza testing is the same as in past years, although we have CDC permissive recommendations to prescribe antivirals for any outpatient ILI within the first 48 hours of symptoms. Still, POC testing for influenza remains potentially valuable in the ILI patient. The choice of whether and how to test for SARS-CoV-2 given its potential to be a primary or coinfecting agent in presentations linked more closely to a traditional virus (e.g. RSV bronchiolitis) will be a test of our clinical judgement until more data and easier testing are available. Further complicating coinfection recognition is the fact that many sick visits occur by telehealth and much testing is done at drive-through SARS-CoV-2 testing facilities with no clinician exam. Unless we are liberal in SARS-CoV-2 testing, detecting SARS-CoV-2 coinfections is easier said than done given its usually mild presentation being overshadowed by any coinfecting virus.
But understanding who has SARS-CoV-2, even as a coinfection, still is essential in controlling the pandemic. We will need to be vigilant for evolving approaches to SARS-CoV-2 testing in the context of symptomatic ARI presentations, knowing this will likely remain a moving target for the foreseeable future.
Dr. Harrison is professor of pediatrics and pediatric infectious diseases at Children’s Mercy Hospital-Kansas City, Mo. Children’s Mercy Hospital receives grant funding to study two candidate RSV vaccines. The hospital also receives CDC funding under the New Vaccine Surveillance Network for multicenter surveillance of acute respiratory infections, including influenza, RSV, and parainfluenza virus. Email Dr. Harrison at pdnews@mdedge.com.
References
1. Pediatrics. 2020;146(1):e20200961.
2. JAMA. 2020 May 26;323(20):2085-6.
3. Pediatrics. 2020. doi: 10.1542/peds.2020-1267.
4. www.cdc.gov/flu/professionals/antivirals/summary-clinicians.htm.
5. J. Pediatr. 2020. doi: 10.1016/j.jpeds.2020.08.007.
6. www.cdc.gov/flu/professionals/diagnosis/table-nucleic-acid-detection.html.
Respiratory virus seasons usually follow a fairly well-known pattern. Enterovirus 68 (EV-D68) is a summer-to-early fall virus with biennial peak years. Rhinovirus (HRv) and adenovirus (Adv) occur nearly year-round but may have small upticks in the first month or so that children return to school. Early in the school year, upper respiratory infections from both HRv and Adv and viral sore throats from Adv are common, with conjunctivitis from Adv outbreaks in some years. October to November is human parainfluenza (HPiV) 1 and 2 season, often presenting as croup. Human metapneumovirus infections span October through April. In late November to December, influenza begins, usually with an A type, later transitioning to a B type in February through April. Also in December, respiratory syncytial virus (RSV) starts, characteristically with bronchiolitis presentations, peaking in February to March and tapering off in May. In late March to April, HPiV 3 also appears for 4-6 weeks.
Will 2020-2021 be different?
Summer was remarkably free of expected enterovirus activity, suggesting that the seasonal parade may differ this year. Remember that the 2019-2020 respiratory season suddenly and nearly completely stopped in March because of social distancing and lockdowns needed to address the SARS-CoV-2 pandemic.
The mild influenza season in the southern hemisphere suggests that our influenza season also could be mild. But perhaps not – most southern hemisphere countries that are surveyed for influenza activities had the most intense SARS-CoV-2 mitigations, making the observed mildness potentially related more to social mitigation than less virulent influenza strains. If so, southern hemisphere influenza data may not apply to the United States, where social distancing and masks are ignored or used inconsistently by almost half the population.
Further, the stop-and-go pattern of in-person school/college attendance adds to uncertainties for the usual orderly virus-specific seasonality. The result may be multiple stop-and-go “pop-up” or “mini” outbreaks for any given virus potentially reflected as exaggerated local or regional differences in circulation of various viruses. The erratic seasonality also would increase coinfections, which could present with more severe or different symptoms.
SARS-CoV-2’s potential interaction
Will the relatively mild presentations for most children with SARS-CoV-2 hold up in the setting of coinfections or sequential respiratory viral infections? Could SARS-CoV-2 cause worse/more prolonged symptoms or more sequelae if paired simultaneously or in tandem with a traditional respiratory virus? To date, data on the frequency and severity of SARS-CoV-2 coinfections are conflicting and sparse, but it appears that non-SARS-CoV-2 viruses can be involved in 15%-50% pediatric acute respiratory infections.1,2
However, it may not be important to know about coinfecting viruses other than influenza (can be treated) or SARS-CoV-2 (needs quarantine and contact tracing), unless symptoms are atypical or more severe than usual. For example, a young child with bronchiolitis is most likely infected with RSV, but HPiV, influenza, metapneumovirus, HRv, and even SARS-CoV-2 can cause bronchiolitis. Even so, testing outpatients for RSV or non-influenza is not routine or even clinically helpful. Supportive treatment and restriction from daycare attendance are sufficient management for outpatient ARIs whether presenting as bronchiolitis or not.
Considerations for SARS-CoV-2 testing: Outpatient bronchiolitis
If a child presents with classic bronchiolitis but has above moderate to severe symptoms, is SARS-CoV-2 a consideration? Perhaps, if SARS-CoV-2 acts similarly to non-SARS-CoV-2s.
A recent report from the 30th Multicenter Airway Research Collaboration (MARC-30) surveillance study (2007-2014) of children hospitalized with clinical bronchiolitis evaluated respiratory viruses, including RSV and the four common non-SARS coronaviruses using molecular testing.3 Among 1,880 subjects, a CoV (alpha CoV: NL63 or 229E, or beta CoV: KKU1 or OC43) was detected in 12%. Yet most had only RSV (n = 1,661); 32 had only CoV (n = 32). But note that 219 had both.
Bronchiolitis subjects with CoV were older – median 3.7 (1.4-5.8) vs. 2.8 (1.9-7.2) years – and more likely male than were RSV subjects (68% vs. 58%). OC43 was most frequent followed by equal numbers of HKU1 and NL63, while 229E was the least frequent. Medical utilization and severity did not differ among the CoVs, or between RSV+CoV vs. RSV alone, unless one considered CoV viral load as a variable. ICU use increased when the polymerase chain reaction cycle threshold result indicated a high CoV viral load.
These data suggest CoVs are not infrequent coinfectors with RSV in bronchiolitis – and that SARS-CoV-2 is the same. Therefore, a bronchiolitis presentation doesn’t necessarily take us off the hook for the need to consider SARS-CoV-2 testing, particularly in the somewhat older bronchiolitis patient with more than mild symptoms.
Considerations for SARS-CoV-2 testing: Outpatient influenza-like illness
In 2020-2021, the Centers for Disease Control and Prevention recommends considering empiric antiviral treatment for ILIs (fever plus either cough or sore throat) based upon our clinical judgement, even in non-high-risk children.4
While pediatric COVID-19 illnesses are predominantly asymptomatic or mild, a febrile ARI is also a SARS-CoV-2 compatible presentation. So, if all we use is our clinical judgment, how do we know if the febrile ARI is due to influenza or SARS-CoV-2 or both? At least one study used a highly sensitive and specific molecular influenza test to show that the accuracy of clinically diagnosing influenza in children is not much better than flipping a coin and would lead to potential antiviral overuse.5
So, it seems ideal to test for influenza when possible. Point-of-care (POC) tests are frequently used for outpatients. Eight POC Clinical Laboratory Improvement Amendments (CLIA)–waived kits, some also detecting RSV, are available but most have modest sensitivity (60%-80%) compared with lab-based molecular tests.6 That said, if supplies and kits for one of the POC tests are available to us during these SARS-CoV-2 stressed times (back orders seem more common this year), a positive influenza test in the first 48 hours of symptoms confirms the option to prescribe an antiviral. Yet how will we have confidence that the febrile ARI is not also partly due to SARS-CoV-2? Currently febrile ARIs usually are considered SARS-CoV-2 and the children are sent for SARS-CoV-2 testing. During influenza season, it seems we will need to continue to send febrile outpatients for SARS-CoV-2 testing, even if POC influenza positive, via whatever mechanisms are available as time goes on.
We expect more rapid pediatric testing modalities for SARS-CoV-2 (maybe even saliva tests) to become available over the next months. Indeed, rapid antigen tests and rapid molecular tests are being evaluated in adults and seem destined for CLIA waivers as POC tests, and even home testing kits. Pediatric approvals hopefully also will occur. So, the pathways for SARS-CoV-2 testing available now will likely change over this winter. But be aware that supplies/kits will be prioritized to locations within high need areas and bulk purchase contracts. So POC kits may remain scarce for practices, meaning a reference laboratory still could be the way to go for SARS-CoV-2 for at least the rest of 2020. Reference labs are becoming creative as well; one combined detection of influenza A, influenza B, RSV, and SARS-CoV-2 into one test, and hopes to get approval for swab collection that can be done by families at home and mailed in.
Summary
Expect variations on the traditional parade of seasonal respiratory viruses, with increased numbers of coinfections. Choosing the outpatient who needs influenza testing is the same as in past years, although we have CDC permissive recommendations to prescribe antivirals for any outpatient ILI within the first 48 hours of symptoms. Still, POC testing for influenza remains potentially valuable in the ILI patient. The choice of whether and how to test for SARS-CoV-2 given its potential to be a primary or coinfecting agent in presentations linked more closely to a traditional virus (e.g. RSV bronchiolitis) will be a test of our clinical judgement until more data and easier testing are available. Further complicating coinfection recognition is the fact that many sick visits occur by telehealth and much testing is done at drive-through SARS-CoV-2 testing facilities with no clinician exam. Unless we are liberal in SARS-CoV-2 testing, detecting SARS-CoV-2 coinfections is easier said than done given its usually mild presentation being overshadowed by any coinfecting virus.
But understanding who has SARS-CoV-2, even as a coinfection, still is essential in controlling the pandemic. We will need to be vigilant for evolving approaches to SARS-CoV-2 testing in the context of symptomatic ARI presentations, knowing this will likely remain a moving target for the foreseeable future.
Dr. Harrison is professor of pediatrics and pediatric infectious diseases at Children’s Mercy Hospital-Kansas City, Mo. Children’s Mercy Hospital receives grant funding to study two candidate RSV vaccines. The hospital also receives CDC funding under the New Vaccine Surveillance Network for multicenter surveillance of acute respiratory infections, including influenza, RSV, and parainfluenza virus. Email Dr. Harrison at pdnews@mdedge.com.
References
1. Pediatrics. 2020;146(1):e20200961.
2. JAMA. 2020 May 26;323(20):2085-6.
3. Pediatrics. 2020. doi: 10.1542/peds.2020-1267.
4. www.cdc.gov/flu/professionals/antivirals/summary-clinicians.htm.
5. J. Pediatr. 2020. doi: 10.1016/j.jpeds.2020.08.007.
6. www.cdc.gov/flu/professionals/diagnosis/table-nucleic-acid-detection.html.
Insomnia may have a role in generation of stressful life events
Insomnia disorder appears to play a causal role in the development of new stressful life events, especially “dependent” events for which individuals are at least partly responsible, said the investigators of an ongoing longitudinal study of people who have experienced involuntary job loss.
The “stress-generation hypothesis” has been applied for several decades in the context of depression. It posits that depressed individuals generate more stressful life events – events that create family conflict or disrupt careers, for instance – than individuals who are not depressed.
The new analysis of individuals with involuntary job loss suggests that the same can be said of insomnia. “Insomnia disorder is associated with fatigue, daytime sleepiness, impaired concentration, and difficulties in emotional regulation,” Iva Skobic, MSPH, MA, a PhD student at the University of Arizona, Tucson, said at the virtual annual meeting of the Associated Professional Sleep Societies.
“These may lead to impaired decision-making, interpersonal conflicts, difficulty meeting deadlines and keeping commitments, and other sources [of stressful life events],” she said. “This extension of the stress-generation hypothesis has important implications for harm reduction interventions for insomnia disorder.”
Investigators conducted a cross-lagged panel analysis using baseline and 3-month follow-up data from 137 individuals who completed a standardized, textual life event measure called the Life Events and Difficulties Schedule after having lost their jobs involuntarily. Participants were interviewed and their events were rated for severity by a consensus panel using operationalized criteria. The analysis employed linear regression controlling for covariates (age, gender, and race) and logistic regression that controlled for insomnia at baseline. Insomnia disorder was defined as meeting ICSD-2/3 criteria using the Duke Structured Interview for Sleep Disorders.
The findings: Insomnia disorder at baseline predicted the number of stressful life events (either dependent or interpersonal) generated within 3 months (beta, 0.70; standard error, 0.31; Tscore, 2.27; P = .03). Conversely, the number of stressful events at baseline did not predict insomnia (odds ratio, 0.97; 95% confidence interval, 0.73-1.29). There also was a trend toward increased generation of dependent events specifically among those with insomnia disorder.
Participants were a mean age of 42 years, and all had been in their previous place of employment for at least 6 months. Nearly 60% met the diagnostic threshold for insomnia at baseline. They were part of a larger ongoing study examining the linkages between job loss and sleep disturbances, obesity, and mental health – the Assessing Daily Activity Patterns through Occupational Transitions (ADAPT) study, supported by the National Heart, Lung, and Blood Institute.
This analysis on insomnia was completed before the COVID-19 pandemic began, but it and other analyses soon to be reported are highly relevant to the economic climate, said Patricia Haynes, PhD, principal investigator of ADAPT and a coauthor of the insomnia study, in an interview after the meeting.
Insomnia is a frequent comorbidity of depression and shares many of its symptoms, from increased fatigue to emotional dysregulation and an increased risk of maladaptive coping strategies. “Interestingly, the literature on the stress-generation hypothesis posits that these very symptoms are on the casual pathway between depression and stressful life events,” said Ms. Skobic at the meeting.
In commenting on the study, Krishna M. Sundar, MD, medical director of the Sleep-Wake Center at the University of Utah, Salt Lake City, noted that the analysis did not include any measure of the severity of insomnia. Still, he said, “finding an association [with stress generation] at [just] 3 months with the presence of insomnia disorder is quite interesting.”
There were higher rates of insomnia in the sample than depression, Dr. Haynes said, but the analysis did not control for depression or take it into account.
“We know [from prior research] that stress clearly leads to insomnia. The big [takeaway] here is that insomnia can also lead to more stress,” she said. “It’s important to think of it as a reciprocal relationship. If we can potentially treat insomnia, we may be able to stop that cycle of other stressful events that affect both [the individuals] and others as well.”
Ms. Skobic had no disclosures.
Insomnia disorder appears to play a causal role in the development of new stressful life events, especially “dependent” events for which individuals are at least partly responsible, said the investigators of an ongoing longitudinal study of people who have experienced involuntary job loss.
The “stress-generation hypothesis” has been applied for several decades in the context of depression. It posits that depressed individuals generate more stressful life events – events that create family conflict or disrupt careers, for instance – than individuals who are not depressed.
The new analysis of individuals with involuntary job loss suggests that the same can be said of insomnia. “Insomnia disorder is associated with fatigue, daytime sleepiness, impaired concentration, and difficulties in emotional regulation,” Iva Skobic, MSPH, MA, a PhD student at the University of Arizona, Tucson, said at the virtual annual meeting of the Associated Professional Sleep Societies.
“These may lead to impaired decision-making, interpersonal conflicts, difficulty meeting deadlines and keeping commitments, and other sources [of stressful life events],” she said. “This extension of the stress-generation hypothesis has important implications for harm reduction interventions for insomnia disorder.”
Investigators conducted a cross-lagged panel analysis using baseline and 3-month follow-up data from 137 individuals who completed a standardized, textual life event measure called the Life Events and Difficulties Schedule after having lost their jobs involuntarily. Participants were interviewed and their events were rated for severity by a consensus panel using operationalized criteria. The analysis employed linear regression controlling for covariates (age, gender, and race) and logistic regression that controlled for insomnia at baseline. Insomnia disorder was defined as meeting ICSD-2/3 criteria using the Duke Structured Interview for Sleep Disorders.
The findings: Insomnia disorder at baseline predicted the number of stressful life events (either dependent or interpersonal) generated within 3 months (beta, 0.70; standard error, 0.31; Tscore, 2.27; P = .03). Conversely, the number of stressful events at baseline did not predict insomnia (odds ratio, 0.97; 95% confidence interval, 0.73-1.29). There also was a trend toward increased generation of dependent events specifically among those with insomnia disorder.
Participants were a mean age of 42 years, and all had been in their previous place of employment for at least 6 months. Nearly 60% met the diagnostic threshold for insomnia at baseline. They were part of a larger ongoing study examining the linkages between job loss and sleep disturbances, obesity, and mental health – the Assessing Daily Activity Patterns through Occupational Transitions (ADAPT) study, supported by the National Heart, Lung, and Blood Institute.
This analysis on insomnia was completed before the COVID-19 pandemic began, but it and other analyses soon to be reported are highly relevant to the economic climate, said Patricia Haynes, PhD, principal investigator of ADAPT and a coauthor of the insomnia study, in an interview after the meeting.
Insomnia is a frequent comorbidity of depression and shares many of its symptoms, from increased fatigue to emotional dysregulation and an increased risk of maladaptive coping strategies. “Interestingly, the literature on the stress-generation hypothesis posits that these very symptoms are on the casual pathway between depression and stressful life events,” said Ms. Skobic at the meeting.
In commenting on the study, Krishna M. Sundar, MD, medical director of the Sleep-Wake Center at the University of Utah, Salt Lake City, noted that the analysis did not include any measure of the severity of insomnia. Still, he said, “finding an association [with stress generation] at [just] 3 months with the presence of insomnia disorder is quite interesting.”
There were higher rates of insomnia in the sample than depression, Dr. Haynes said, but the analysis did not control for depression or take it into account.
“We know [from prior research] that stress clearly leads to insomnia. The big [takeaway] here is that insomnia can also lead to more stress,” she said. “It’s important to think of it as a reciprocal relationship. If we can potentially treat insomnia, we may be able to stop that cycle of other stressful events that affect both [the individuals] and others as well.”
Ms. Skobic had no disclosures.
Insomnia disorder appears to play a causal role in the development of new stressful life events, especially “dependent” events for which individuals are at least partly responsible, said the investigators of an ongoing longitudinal study of people who have experienced involuntary job loss.
The “stress-generation hypothesis” has been applied for several decades in the context of depression. It posits that depressed individuals generate more stressful life events – events that create family conflict or disrupt careers, for instance – than individuals who are not depressed.
The new analysis of individuals with involuntary job loss suggests that the same can be said of insomnia. “Insomnia disorder is associated with fatigue, daytime sleepiness, impaired concentration, and difficulties in emotional regulation,” Iva Skobic, MSPH, MA, a PhD student at the University of Arizona, Tucson, said at the virtual annual meeting of the Associated Professional Sleep Societies.
“These may lead to impaired decision-making, interpersonal conflicts, difficulty meeting deadlines and keeping commitments, and other sources [of stressful life events],” she said. “This extension of the stress-generation hypothesis has important implications for harm reduction interventions for insomnia disorder.”
Investigators conducted a cross-lagged panel analysis using baseline and 3-month follow-up data from 137 individuals who completed a standardized, textual life event measure called the Life Events and Difficulties Schedule after having lost their jobs involuntarily. Participants were interviewed and their events were rated for severity by a consensus panel using operationalized criteria. The analysis employed linear regression controlling for covariates (age, gender, and race) and logistic regression that controlled for insomnia at baseline. Insomnia disorder was defined as meeting ICSD-2/3 criteria using the Duke Structured Interview for Sleep Disorders.
The findings: Insomnia disorder at baseline predicted the number of stressful life events (either dependent or interpersonal) generated within 3 months (beta, 0.70; standard error, 0.31; Tscore, 2.27; P = .03). Conversely, the number of stressful events at baseline did not predict insomnia (odds ratio, 0.97; 95% confidence interval, 0.73-1.29). There also was a trend toward increased generation of dependent events specifically among those with insomnia disorder.
Participants were a mean age of 42 years, and all had been in their previous place of employment for at least 6 months. Nearly 60% met the diagnostic threshold for insomnia at baseline. They were part of a larger ongoing study examining the linkages between job loss and sleep disturbances, obesity, and mental health – the Assessing Daily Activity Patterns through Occupational Transitions (ADAPT) study, supported by the National Heart, Lung, and Blood Institute.
This analysis on insomnia was completed before the COVID-19 pandemic began, but it and other analyses soon to be reported are highly relevant to the economic climate, said Patricia Haynes, PhD, principal investigator of ADAPT and a coauthor of the insomnia study, in an interview after the meeting.
Insomnia is a frequent comorbidity of depression and shares many of its symptoms, from increased fatigue to emotional dysregulation and an increased risk of maladaptive coping strategies. “Interestingly, the literature on the stress-generation hypothesis posits that these very symptoms are on the casual pathway between depression and stressful life events,” said Ms. Skobic at the meeting.
In commenting on the study, Krishna M. Sundar, MD, medical director of the Sleep-Wake Center at the University of Utah, Salt Lake City, noted that the analysis did not include any measure of the severity of insomnia. Still, he said, “finding an association [with stress generation] at [just] 3 months with the presence of insomnia disorder is quite interesting.”
There were higher rates of insomnia in the sample than depression, Dr. Haynes said, but the analysis did not control for depression or take it into account.
“We know [from prior research] that stress clearly leads to insomnia. The big [takeaway] here is that insomnia can also lead to more stress,” she said. “It’s important to think of it as a reciprocal relationship. If we can potentially treat insomnia, we may be able to stop that cycle of other stressful events that affect both [the individuals] and others as well.”
Ms. Skobic had no disclosures.
FROM SLEEP 2020
New radiomic model may improve prognostication in meningioma
, according to a study published in the European Journal of Radiology.
The model – which combines conventional magnetic resonance imaging (cMRI), apparent diffusion coefficient (ADC) maps, and susceptibility weighted imaging (SWI) – was the best performer of all models tested.
Recent studies have shown that radiomic features from cMRI or ADC maps could build “a robust model to predict the grade of meningioma by using machine learning algorithms,” wrote study author Jianping Hu, MD, PhD, of Fujian Medical University in Fujian, China, and colleagues.
With that in mind, the researchers evaluated the role of radiomic models based on cMRI, ADC maps, and/or SWI in predicting meningioma grade.
Patients and models
The team retrospectively analyzed 514 patients with meningioma who underwent preoperative MRI assessment over a 10-year period. There were 316 patients included in the final analysis, 229 with low-grade (grade I) and 87 with high-grade (grade II-III) meningioma.
Radiomic features from cMRI, ADC maps, and SWI were extracted based on total tumor volume.
Using a nested leave-one-out cross-validation method, the researchers evaluated the prediction performance of various radiomic models, including cMRI, ADC, SWI, ADC plus SWI, cMRI plus ADC, cMRI plus SWI, and cMRI plus ADC plus SWI.
To establish the final prediction model, the researchers used least absolute shrinkage and selection operator feature selection and implemented a random forest classifier that was trained with and without subsampling. The area under the receiver operating characteristic curve (AUC) was used to evaluate the prediction performance of each model.
Results
The model combining cMRI, ADC, and SWI had the best performance in predicting meningioma grade. The AUC of this model was 0.81 with subsampling and 0.84 without subsampling. The other models had an AUC range of 0.71-0.79 with subsampling and 0.75-0.80 without subsampling.
“Our results indicated that [the] multiparametric radiomic model based on cMRI, ADC map, and SWI [tended] to be the best model for the prediction of meningioma grade,” Dr. Hu and colleagues wrote.
Other recent studies have demonstrated that radiomic features from various imaging parameters, such as diffusion weighted imaging and cMRI, can establish robust prediction models for the prediction of meningioma grade, in which AUCs have ranged from 0.63 to 0.91.
While these findings are encouraging, the researchers acknowledged that these data should be interpreted with discretion as the cystic or necrotic areas of tumor were included in the analysis. In addition, the retrospective nature of the study could have introduced selection bias.
No funding sources were reported. The authors reported having no conflicts of interest.
SOURCE: Hu J et al. Eur J Radiol. 2020 Aug 28. doi: 10.1016/j.ejrad.2020.109251.
, according to a study published in the European Journal of Radiology.
The model – which combines conventional magnetic resonance imaging (cMRI), apparent diffusion coefficient (ADC) maps, and susceptibility weighted imaging (SWI) – was the best performer of all models tested.
Recent studies have shown that radiomic features from cMRI or ADC maps could build “a robust model to predict the grade of meningioma by using machine learning algorithms,” wrote study author Jianping Hu, MD, PhD, of Fujian Medical University in Fujian, China, and colleagues.
With that in mind, the researchers evaluated the role of radiomic models based on cMRI, ADC maps, and/or SWI in predicting meningioma grade.
Patients and models
The team retrospectively analyzed 514 patients with meningioma who underwent preoperative MRI assessment over a 10-year period. There were 316 patients included in the final analysis, 229 with low-grade (grade I) and 87 with high-grade (grade II-III) meningioma.
Radiomic features from cMRI, ADC maps, and SWI were extracted based on total tumor volume.
Using a nested leave-one-out cross-validation method, the researchers evaluated the prediction performance of various radiomic models, including cMRI, ADC, SWI, ADC plus SWI, cMRI plus ADC, cMRI plus SWI, and cMRI plus ADC plus SWI.
To establish the final prediction model, the researchers used least absolute shrinkage and selection operator feature selection and implemented a random forest classifier that was trained with and without subsampling. The area under the receiver operating characteristic curve (AUC) was used to evaluate the prediction performance of each model.
Results
The model combining cMRI, ADC, and SWI had the best performance in predicting meningioma grade. The AUC of this model was 0.81 with subsampling and 0.84 without subsampling. The other models had an AUC range of 0.71-0.79 with subsampling and 0.75-0.80 without subsampling.
“Our results indicated that [the] multiparametric radiomic model based on cMRI, ADC map, and SWI [tended] to be the best model for the prediction of meningioma grade,” Dr. Hu and colleagues wrote.
Other recent studies have demonstrated that radiomic features from various imaging parameters, such as diffusion weighted imaging and cMRI, can establish robust prediction models for the prediction of meningioma grade, in which AUCs have ranged from 0.63 to 0.91.
While these findings are encouraging, the researchers acknowledged that these data should be interpreted with discretion as the cystic or necrotic areas of tumor were included in the analysis. In addition, the retrospective nature of the study could have introduced selection bias.
No funding sources were reported. The authors reported having no conflicts of interest.
SOURCE: Hu J et al. Eur J Radiol. 2020 Aug 28. doi: 10.1016/j.ejrad.2020.109251.
, according to a study published in the European Journal of Radiology.
The model – which combines conventional magnetic resonance imaging (cMRI), apparent diffusion coefficient (ADC) maps, and susceptibility weighted imaging (SWI) – was the best performer of all models tested.
Recent studies have shown that radiomic features from cMRI or ADC maps could build “a robust model to predict the grade of meningioma by using machine learning algorithms,” wrote study author Jianping Hu, MD, PhD, of Fujian Medical University in Fujian, China, and colleagues.
With that in mind, the researchers evaluated the role of radiomic models based on cMRI, ADC maps, and/or SWI in predicting meningioma grade.
Patients and models
The team retrospectively analyzed 514 patients with meningioma who underwent preoperative MRI assessment over a 10-year period. There were 316 patients included in the final analysis, 229 with low-grade (grade I) and 87 with high-grade (grade II-III) meningioma.
Radiomic features from cMRI, ADC maps, and SWI were extracted based on total tumor volume.
Using a nested leave-one-out cross-validation method, the researchers evaluated the prediction performance of various radiomic models, including cMRI, ADC, SWI, ADC plus SWI, cMRI plus ADC, cMRI plus SWI, and cMRI plus ADC plus SWI.
To establish the final prediction model, the researchers used least absolute shrinkage and selection operator feature selection and implemented a random forest classifier that was trained with and without subsampling. The area under the receiver operating characteristic curve (AUC) was used to evaluate the prediction performance of each model.
Results
The model combining cMRI, ADC, and SWI had the best performance in predicting meningioma grade. The AUC of this model was 0.81 with subsampling and 0.84 without subsampling. The other models had an AUC range of 0.71-0.79 with subsampling and 0.75-0.80 without subsampling.
“Our results indicated that [the] multiparametric radiomic model based on cMRI, ADC map, and SWI [tended] to be the best model for the prediction of meningioma grade,” Dr. Hu and colleagues wrote.
Other recent studies have demonstrated that radiomic features from various imaging parameters, such as diffusion weighted imaging and cMRI, can establish robust prediction models for the prediction of meningioma grade, in which AUCs have ranged from 0.63 to 0.91.
While these findings are encouraging, the researchers acknowledged that these data should be interpreted with discretion as the cystic or necrotic areas of tumor were included in the analysis. In addition, the retrospective nature of the study could have introduced selection bias.
No funding sources were reported. The authors reported having no conflicts of interest.
SOURCE: Hu J et al. Eur J Radiol. 2020 Aug 28. doi: 10.1016/j.ejrad.2020.109251.
FROM EUROPEAN JOURNAL OF RADIOLOGY
AI algorithm on par with radiologists as mammogram reader
The algorithm – from the company Lunit, which was not involved in the study – had an area under the curve of 0.956 for detection of pathologically confirmed breast cancer.
When operating at a specificity of 96.6%, the sensitivity was 81.9% for the algorithm, 77.4% for first-reader radiologists, and 80.1% for second-reader radiologists. Combining the algorithm with first-reader radiologists identified more cases than combining first- and second-reader radiologists.
These findings were published in JAMA Oncology.
The study’s authors wrote that the algorithm results are a “considerable” achievement because, unlike the radiologists, the algorithm had no access to prior mammograms or information about hormonal medications or breast symptoms.
“We believe that the time has come to evaluate AI CAD [computer-aided detection] algorithms as independent readers in prospective clinical studies,” Mattie Salim, MD, of Karolinska Institute/Karolinska University Hospital in Stockholm, and colleagues wrote.
“The authors are to be commended for providing data that support this next critical phase of discovery,” Constance Dobbins Lehman, MD, PhD, of Massachusetts General Hospital and Harvard Medical School, both in Boston, wrote in a related editorial. She added that “it is time to move beyond simulation and reader studies and enter the critical phase of rigorous, prospective clinical evaluation.”
Study rationale and details
Routine mammograms save lives, but the workload for radiologists is high, and the quality of assessments varies widely, Dr. Salim and colleagues wrote. There are also problems with access in areas with few radiologists.
To address these issues, academic and commercial researchers have worked hard to apply AI – specifically, deep neural networks – to computer programs that read mammograms.
For this study, the investigators conducted the first third-party external validation of three competing algorithms. The three algorithms were not named in the report, but Lunit announced that its algorithm was the best-performing algorithm after the study was published. The other two algorithms did not perform as well and remain anonymous.
The investigators compared the algorithms’ assessments with the original radiology reports for 739 women who were diagnosed with breast cancer within 12 months of their mammogram and 8,066 women with negative mammograms who remained cancer free at a 2-year follow-up.
The women, aged 40-74 years, had conventional two-dimensional imaging read by two radiologists at the Karolinska University Hospital during 2008-2015. The subjects’ median age at screening was 54.5 years.
The algorithms gave a prediction score between 0 and 1 for each breast, with 1 denoting the highest level of cancer suspicion. To enable a comparison with the binary decisions of the radiologists, the output of each algorithm was dichotomized (normal or abnormal) at a cut point defined by the mean specificity of the first-reader radiologists, 96.6%.
At a specificity of 96.6%, the sensitivity was 81.9% for the Lunit algorithm, 67.0% for one anonymous algorithm (AI-2), 67.4% for the other anonymous algorithm (AI-3), 77.4% for first-reader radiologists, and 80.1% for second-reader radiologists
The investigators also ran their analysis at a cut point of 88.9% specificity. The sensitivity was 88.6% for the Lunit algorithm, 80.0% for AI-2, and 80.2% for AI-3.
“This can be compared with the Breast Cancer Surveillance Consortium benchmarks of 86.9% sensitivity at 88.9% specificity,” the authors wrote.
The most potent screening strategy was combining the Lunit algorithm with the first reader, which increased cancer detection by 8% but came at the cost of a 77% increase in abnormal assessments.
“More true-positive cases would likely be found, but a much larger proportion of false-positive examinations would have to be handled in the ensuing consensus discussion,” the authors wrote. “[A] cost-benefit analysis is required ... to determine the economic implications of adding a human reader at all.”
The team noted that the Lunit algorithm was trained on images of South Korean women from GE equipment.
“Although we do not have ethnic descriptors of our study population, the vast majority of women in Stockholm are White, and all images in our study were acquired on Hologic equipment,” the authors wrote. “In training AI algorithms for mammographic cancer detection, matching ethnic and equipment distributions between the training population and the clinical test population may not be of highest importance.”
As for why the Lunit algorithm outperformed the other two algorithms, one explanation may be that the Lunit algorithm was trained on more mammograms – 72,000 cancer and 680,000 normal images (vs. 10,000 cancer and 229,000 normal images for AI-2; 6,000 cancer and 106,000 normal images for AI-3).
As for next steps, the investigators are planning a prospective clinical study to see how AI works as an independent reviewer of mammograms in a day-to-day clinical environment, both as a third reviewer and to help select women for follow-up MRI.
The current study was funded by the Stockholm County Council. The investigators disclosed financial relationships with the Swedish Research Council, the Swedish Cancer Society, Stockholm City Council, Collective Minds Radiology, and Pfizer. Dr Lehman’s institution receives grants from GE Healthcare.
SOURCE: Salim M et al. JAMA Oncol. 2020 Aug 27. doi: 10.1001/jamaoncol.2020.3321.
The algorithm – from the company Lunit, which was not involved in the study – had an area under the curve of 0.956 for detection of pathologically confirmed breast cancer.
When operating at a specificity of 96.6%, the sensitivity was 81.9% for the algorithm, 77.4% for first-reader radiologists, and 80.1% for second-reader radiologists. Combining the algorithm with first-reader radiologists identified more cases than combining first- and second-reader radiologists.
These findings were published in JAMA Oncology.
The study’s authors wrote that the algorithm results are a “considerable” achievement because, unlike the radiologists, the algorithm had no access to prior mammograms or information about hormonal medications or breast symptoms.
“We believe that the time has come to evaluate AI CAD [computer-aided detection] algorithms as independent readers in prospective clinical studies,” Mattie Salim, MD, of Karolinska Institute/Karolinska University Hospital in Stockholm, and colleagues wrote.
“The authors are to be commended for providing data that support this next critical phase of discovery,” Constance Dobbins Lehman, MD, PhD, of Massachusetts General Hospital and Harvard Medical School, both in Boston, wrote in a related editorial. She added that “it is time to move beyond simulation and reader studies and enter the critical phase of rigorous, prospective clinical evaluation.”
Study rationale and details
Routine mammograms save lives, but the workload for radiologists is high, and the quality of assessments varies widely, Dr. Salim and colleagues wrote. There are also problems with access in areas with few radiologists.
To address these issues, academic and commercial researchers have worked hard to apply AI – specifically, deep neural networks – to computer programs that read mammograms.
For this study, the investigators conducted the first third-party external validation of three competing algorithms. The three algorithms were not named in the report, but Lunit announced that its algorithm was the best-performing algorithm after the study was published. The other two algorithms did not perform as well and remain anonymous.
The investigators compared the algorithms’ assessments with the original radiology reports for 739 women who were diagnosed with breast cancer within 12 months of their mammogram and 8,066 women with negative mammograms who remained cancer free at a 2-year follow-up.
The women, aged 40-74 years, had conventional two-dimensional imaging read by two radiologists at the Karolinska University Hospital during 2008-2015. The subjects’ median age at screening was 54.5 years.
The algorithms gave a prediction score between 0 and 1 for each breast, with 1 denoting the highest level of cancer suspicion. To enable a comparison with the binary decisions of the radiologists, the output of each algorithm was dichotomized (normal or abnormal) at a cut point defined by the mean specificity of the first-reader radiologists, 96.6%.
At a specificity of 96.6%, the sensitivity was 81.9% for the Lunit algorithm, 67.0% for one anonymous algorithm (AI-2), 67.4% for the other anonymous algorithm (AI-3), 77.4% for first-reader radiologists, and 80.1% for second-reader radiologists
The investigators also ran their analysis at a cut point of 88.9% specificity. The sensitivity was 88.6% for the Lunit algorithm, 80.0% for AI-2, and 80.2% for AI-3.
“This can be compared with the Breast Cancer Surveillance Consortium benchmarks of 86.9% sensitivity at 88.9% specificity,” the authors wrote.
The most potent screening strategy was combining the Lunit algorithm with the first reader, which increased cancer detection by 8% but came at the cost of a 77% increase in abnormal assessments.
“More true-positive cases would likely be found, but a much larger proportion of false-positive examinations would have to be handled in the ensuing consensus discussion,” the authors wrote. “[A] cost-benefit analysis is required ... to determine the economic implications of adding a human reader at all.”
The team noted that the Lunit algorithm was trained on images of South Korean women from GE equipment.
“Although we do not have ethnic descriptors of our study population, the vast majority of women in Stockholm are White, and all images in our study were acquired on Hologic equipment,” the authors wrote. “In training AI algorithms for mammographic cancer detection, matching ethnic and equipment distributions between the training population and the clinical test population may not be of highest importance.”
As for why the Lunit algorithm outperformed the other two algorithms, one explanation may be that the Lunit algorithm was trained on more mammograms – 72,000 cancer and 680,000 normal images (vs. 10,000 cancer and 229,000 normal images for AI-2; 6,000 cancer and 106,000 normal images for AI-3).
As for next steps, the investigators are planning a prospective clinical study to see how AI works as an independent reviewer of mammograms in a day-to-day clinical environment, both as a third reviewer and to help select women for follow-up MRI.
The current study was funded by the Stockholm County Council. The investigators disclosed financial relationships with the Swedish Research Council, the Swedish Cancer Society, Stockholm City Council, Collective Minds Radiology, and Pfizer. Dr Lehman’s institution receives grants from GE Healthcare.
SOURCE: Salim M et al. JAMA Oncol. 2020 Aug 27. doi: 10.1001/jamaoncol.2020.3321.
The algorithm – from the company Lunit, which was not involved in the study – had an area under the curve of 0.956 for detection of pathologically confirmed breast cancer.
When operating at a specificity of 96.6%, the sensitivity was 81.9% for the algorithm, 77.4% for first-reader radiologists, and 80.1% for second-reader radiologists. Combining the algorithm with first-reader radiologists identified more cases than combining first- and second-reader radiologists.
These findings were published in JAMA Oncology.
The study’s authors wrote that the algorithm results are a “considerable” achievement because, unlike the radiologists, the algorithm had no access to prior mammograms or information about hormonal medications or breast symptoms.
“We believe that the time has come to evaluate AI CAD [computer-aided detection] algorithms as independent readers in prospective clinical studies,” Mattie Salim, MD, of Karolinska Institute/Karolinska University Hospital in Stockholm, and colleagues wrote.
“The authors are to be commended for providing data that support this next critical phase of discovery,” Constance Dobbins Lehman, MD, PhD, of Massachusetts General Hospital and Harvard Medical School, both in Boston, wrote in a related editorial. She added that “it is time to move beyond simulation and reader studies and enter the critical phase of rigorous, prospective clinical evaluation.”
Study rationale and details
Routine mammograms save lives, but the workload for radiologists is high, and the quality of assessments varies widely, Dr. Salim and colleagues wrote. There are also problems with access in areas with few radiologists.
To address these issues, academic and commercial researchers have worked hard to apply AI – specifically, deep neural networks – to computer programs that read mammograms.
For this study, the investigators conducted the first third-party external validation of three competing algorithms. The three algorithms were not named in the report, but Lunit announced that its algorithm was the best-performing algorithm after the study was published. The other two algorithms did not perform as well and remain anonymous.
The investigators compared the algorithms’ assessments with the original radiology reports for 739 women who were diagnosed with breast cancer within 12 months of their mammogram and 8,066 women with negative mammograms who remained cancer free at a 2-year follow-up.
The women, aged 40-74 years, had conventional two-dimensional imaging read by two radiologists at the Karolinska University Hospital during 2008-2015. The subjects’ median age at screening was 54.5 years.
The algorithms gave a prediction score between 0 and 1 for each breast, with 1 denoting the highest level of cancer suspicion. To enable a comparison with the binary decisions of the radiologists, the output of each algorithm was dichotomized (normal or abnormal) at a cut point defined by the mean specificity of the first-reader radiologists, 96.6%.
At a specificity of 96.6%, the sensitivity was 81.9% for the Lunit algorithm, 67.0% for one anonymous algorithm (AI-2), 67.4% for the other anonymous algorithm (AI-3), 77.4% for first-reader radiologists, and 80.1% for second-reader radiologists
The investigators also ran their analysis at a cut point of 88.9% specificity. The sensitivity was 88.6% for the Lunit algorithm, 80.0% for AI-2, and 80.2% for AI-3.
“This can be compared with the Breast Cancer Surveillance Consortium benchmarks of 86.9% sensitivity at 88.9% specificity,” the authors wrote.
The most potent screening strategy was combining the Lunit algorithm with the first reader, which increased cancer detection by 8% but came at the cost of a 77% increase in abnormal assessments.
“More true-positive cases would likely be found, but a much larger proportion of false-positive examinations would have to be handled in the ensuing consensus discussion,” the authors wrote. “[A] cost-benefit analysis is required ... to determine the economic implications of adding a human reader at all.”
The team noted that the Lunit algorithm was trained on images of South Korean women from GE equipment.
“Although we do not have ethnic descriptors of our study population, the vast majority of women in Stockholm are White, and all images in our study were acquired on Hologic equipment,” the authors wrote. “In training AI algorithms for mammographic cancer detection, matching ethnic and equipment distributions between the training population and the clinical test population may not be of highest importance.”
As for why the Lunit algorithm outperformed the other two algorithms, one explanation may be that the Lunit algorithm was trained on more mammograms – 72,000 cancer and 680,000 normal images (vs. 10,000 cancer and 229,000 normal images for AI-2; 6,000 cancer and 106,000 normal images for AI-3).
As for next steps, the investigators are planning a prospective clinical study to see how AI works as an independent reviewer of mammograms in a day-to-day clinical environment, both as a third reviewer and to help select women for follow-up MRI.
The current study was funded by the Stockholm County Council. The investigators disclosed financial relationships with the Swedish Research Council, the Swedish Cancer Society, Stockholm City Council, Collective Minds Radiology, and Pfizer. Dr Lehman’s institution receives grants from GE Healthcare.
SOURCE: Salim M et al. JAMA Oncol. 2020 Aug 27. doi: 10.1001/jamaoncol.2020.3321.
FROM JAMA ONCOLOGY
Reassuring findings on SSRIs and diabetes risk in children
SSRIs are associated with a much lower risk of type 2 diabetes (T2D) in children and adolescents than previously reported, new research shows.
Investigators found publicly insured patients treated with SSRIs had a 13% increased risk for T2D, compared with those not treated with these agents. In addition, those taking SSRIs continuously (defined as receiving one or more prescriptions every 3 months) had a 33% increased risk of T2D.
On the other hand, privately insured youth had a much lower increased risk – a finding that may be attributable to a lower prevalence of risk factors for T2D in this group.
“We cannot exclude that children and adolescents treated with SSRIs may be at a small increased risk of developing T2D, particularly publicly insured patients, but the magnitude of association was weaker than previous thought and much smaller than other known risk factors for T2DM, such as obesity, race, and poverty,” lead investigator Jenny Sun, PhD, said in an interview.
“When weighing the known benefits and risks of SSRI treatment in children and adolescents, our findings provide reassurance that the risk of T2DM is not as substantial as initially reported,” said Dr. Sun, a postdoctoral research fellow in the department of population medicine at Harvard Medical School’s Harvard Pilgrim Health Care Institute, Boston.
The study was published online Sept. 2 in JAMA Psychiatry.
Limited evidence
Previous research suggested that SSRIs increase the risk of T2D by up to 90% in children and adolescents.
However, the investigators noted, the study reporting this finding was too small to draw conclusions about the SSRI class as a whole also did not examine specific SSRIs.
In addition, although “several studies have reported that antidepressant use may be a risk factor for T2D in adults, evidence was limited in children and adolescents,” said Dr. Sun.
“Rapid changes in growth during childhood and adolescents can alter drugs’ pharmacokinetics and pharmacodynamics, so high-quality, age-specific data are needed to inform prescribing decisions,” she said.
For the current study, the researchers analyzed claims data on almost 1.6 million patients aged 10-19 years (58.3% female; mean age, 15.1 years) from two large claims databases.
The analysis focused on those with a diagnosis warranting treatment with an SSRI, including depression, generalized or social anxiety disorder, obsessive compulsive disorder, PTSD, panic disorder, or bulimia nervosa.
The Medicaid Analytic Extract database consisted of 316,178 patients insured through Medicaid or the Children’s Health Insurance Program. The IBM MarketScan database consisted of 211,460 privately insured patients. Patients were followed up for a mean of 2.3 and 2.2 years, respectively.
Patients who initiated SSRI treatment were compared with those with a similar indication but who were not taking an SSRI. Secondary analyses compared new SSRI users with patients who recently initiated treatment with bupropion, which has no metabolic side effects, or with patients who recently initiated psychotherapy.
“In observational data, it is difficult to mimic a placebo group, often used in RCTs [randomized, controlled trials], therefore several comparator groups were explored to broaden our understanding,” said Dr. Sun.
In addition, the researchers compared the individual SSRI medications, using fluoxetine as a comparator.
A wide range of more than 100 potential confounders or “proxies of confounders,” were taken into account, including demographic characteristics, psychiatric diagnoses, metabolic conditions, concomitant medications, and use of health care services.
The researchers conducted two analyses. They included an intention-to-treat (ITT) analysis that was restricted to patients with one or more additional SSRI prescriptions during the 6 months following the index exposure assessment period.
Close monitoring required
An as-treated analysis estimated the association of continuous SSRI treatment (vs. untreated, bupropion treatment, and psychotherapy), with adherence assessed at 3-month intervals.
Initiation and continuation of SSRI treatment in publicly insured patients were both associated with a considerably higher risk of T2D, compared with untreated patients, and a steeper risk, compared with their privately insured counterparts.
For newly treated publicly insured patients initiated on SSRI treatment, the ITT adjusted hazard ratio was 1.13 (95% confidence interval, 1.04-1.22).
There was an even stronger association among continuously treated publicly insured patients, with an as-treated aHR of 1.33 (95% CI, 1.21-1.47). The authors noted that this corresponds to 6.6 additional T2D cases per 10,000 patients continuously treated for at least 2 years.
The association was weaker in privately insured patients (ITT aHR, 1.01; 95% CI, 0.84-1.23; as-treated aHR, 1.10; 95% CI, 0.88-1.36).
The secondary analyses yielded similar findings: When SSRI treatment was compared with psychotherapy, the as-treated aHR for publicly insured patients was 1.44 (95% CI, 1.25-1.65), whereas the aHR for privately insured patients was lower at 1.21 (95% CI, 0.93-1.57)
The investigators found no increased risk when SSRIs were compared with bupropion, and the within-class analysis showed that none of the SSRIs carried an increased hazard of T2D, compared with fluoxetine.
“Publicly insured patients are enrolled in Medicaid and the Children’s Health Insurance Program, whereas privately insured patients are generally covered by their parent’s employer-sponsored insurance,” said Dr. Sun.
“Publicly insured patients are of lower socioeconomic status and represent a population with greater overall medical burden, more comorbidities, and a higher prevalence of risk factors for T2D, such as obesity, at the time of treatment initiation,” she said.
She added that high-risk children and youth should be closely monitored and clinicians should also consider recommending dietary modifications and increased exercise to offset T2D risk.
Useful ‘real-world data’
William Cooper, MD, MPH, professor of pediatrics and health policy at Vanderbilt University Medical Center in Nashville, Tenn., said that the study “provides a fascinating look at risks of SSRI medications in children and adolescents.”
Dr. Cooper, who was not involved with the study, said that the authors “draw from real-world data representing two different populations and carefully consider factors which might confound the associations.”
The results, he said, “provide important benefits for patients, families, and clinicians as they weigh the risks and benefits of using SSRIs for children who need treatment for depression and anxiety disorders.
The study was supported by a training grant from the program in pharmacoepidemiology at the Harvard School of Public Health. Dr. Sun disclosed no relevant financial relationships. Dr. Cooper disclosed no relevant financial relationships.
A version of this article originally appeared on Medscape.com.
SSRIs are associated with a much lower risk of type 2 diabetes (T2D) in children and adolescents than previously reported, new research shows.
Investigators found publicly insured patients treated with SSRIs had a 13% increased risk for T2D, compared with those not treated with these agents. In addition, those taking SSRIs continuously (defined as receiving one or more prescriptions every 3 months) had a 33% increased risk of T2D.
On the other hand, privately insured youth had a much lower increased risk – a finding that may be attributable to a lower prevalence of risk factors for T2D in this group.
“We cannot exclude that children and adolescents treated with SSRIs may be at a small increased risk of developing T2D, particularly publicly insured patients, but the magnitude of association was weaker than previous thought and much smaller than other known risk factors for T2DM, such as obesity, race, and poverty,” lead investigator Jenny Sun, PhD, said in an interview.
“When weighing the known benefits and risks of SSRI treatment in children and adolescents, our findings provide reassurance that the risk of T2DM is not as substantial as initially reported,” said Dr. Sun, a postdoctoral research fellow in the department of population medicine at Harvard Medical School’s Harvard Pilgrim Health Care Institute, Boston.
The study was published online Sept. 2 in JAMA Psychiatry.
Limited evidence
Previous research suggested that SSRIs increase the risk of T2D by up to 90% in children and adolescents.
However, the investigators noted, the study reporting this finding was too small to draw conclusions about the SSRI class as a whole also did not examine specific SSRIs.
In addition, although “several studies have reported that antidepressant use may be a risk factor for T2D in adults, evidence was limited in children and adolescents,” said Dr. Sun.
“Rapid changes in growth during childhood and adolescents can alter drugs’ pharmacokinetics and pharmacodynamics, so high-quality, age-specific data are needed to inform prescribing decisions,” she said.
For the current study, the researchers analyzed claims data on almost 1.6 million patients aged 10-19 years (58.3% female; mean age, 15.1 years) from two large claims databases.
The analysis focused on those with a diagnosis warranting treatment with an SSRI, including depression, generalized or social anxiety disorder, obsessive compulsive disorder, PTSD, panic disorder, or bulimia nervosa.
The Medicaid Analytic Extract database consisted of 316,178 patients insured through Medicaid or the Children’s Health Insurance Program. The IBM MarketScan database consisted of 211,460 privately insured patients. Patients were followed up for a mean of 2.3 and 2.2 years, respectively.
Patients who initiated SSRI treatment were compared with those with a similar indication but who were not taking an SSRI. Secondary analyses compared new SSRI users with patients who recently initiated treatment with bupropion, which has no metabolic side effects, or with patients who recently initiated psychotherapy.
“In observational data, it is difficult to mimic a placebo group, often used in RCTs [randomized, controlled trials], therefore several comparator groups were explored to broaden our understanding,” said Dr. Sun.
In addition, the researchers compared the individual SSRI medications, using fluoxetine as a comparator.
A wide range of more than 100 potential confounders or “proxies of confounders,” were taken into account, including demographic characteristics, psychiatric diagnoses, metabolic conditions, concomitant medications, and use of health care services.
The researchers conducted two analyses. They included an intention-to-treat (ITT) analysis that was restricted to patients with one or more additional SSRI prescriptions during the 6 months following the index exposure assessment period.
Close monitoring required
An as-treated analysis estimated the association of continuous SSRI treatment (vs. untreated, bupropion treatment, and psychotherapy), with adherence assessed at 3-month intervals.
Initiation and continuation of SSRI treatment in publicly insured patients were both associated with a considerably higher risk of T2D, compared with untreated patients, and a steeper risk, compared with their privately insured counterparts.
For newly treated publicly insured patients initiated on SSRI treatment, the ITT adjusted hazard ratio was 1.13 (95% confidence interval, 1.04-1.22).
There was an even stronger association among continuously treated publicly insured patients, with an as-treated aHR of 1.33 (95% CI, 1.21-1.47). The authors noted that this corresponds to 6.6 additional T2D cases per 10,000 patients continuously treated for at least 2 years.
The association was weaker in privately insured patients (ITT aHR, 1.01; 95% CI, 0.84-1.23; as-treated aHR, 1.10; 95% CI, 0.88-1.36).
The secondary analyses yielded similar findings: When SSRI treatment was compared with psychotherapy, the as-treated aHR for publicly insured patients was 1.44 (95% CI, 1.25-1.65), whereas the aHR for privately insured patients was lower at 1.21 (95% CI, 0.93-1.57)
The investigators found no increased risk when SSRIs were compared with bupropion, and the within-class analysis showed that none of the SSRIs carried an increased hazard of T2D, compared with fluoxetine.
“Publicly insured patients are enrolled in Medicaid and the Children’s Health Insurance Program, whereas privately insured patients are generally covered by their parent’s employer-sponsored insurance,” said Dr. Sun.
“Publicly insured patients are of lower socioeconomic status and represent a population with greater overall medical burden, more comorbidities, and a higher prevalence of risk factors for T2D, such as obesity, at the time of treatment initiation,” she said.
She added that high-risk children and youth should be closely monitored and clinicians should also consider recommending dietary modifications and increased exercise to offset T2D risk.
Useful ‘real-world data’
William Cooper, MD, MPH, professor of pediatrics and health policy at Vanderbilt University Medical Center in Nashville, Tenn., said that the study “provides a fascinating look at risks of SSRI medications in children and adolescents.”
Dr. Cooper, who was not involved with the study, said that the authors “draw from real-world data representing two different populations and carefully consider factors which might confound the associations.”
The results, he said, “provide important benefits for patients, families, and clinicians as they weigh the risks and benefits of using SSRIs for children who need treatment for depression and anxiety disorders.
The study was supported by a training grant from the program in pharmacoepidemiology at the Harvard School of Public Health. Dr. Sun disclosed no relevant financial relationships. Dr. Cooper disclosed no relevant financial relationships.
A version of this article originally appeared on Medscape.com.
SSRIs are associated with a much lower risk of type 2 diabetes (T2D) in children and adolescents than previously reported, new research shows.
Investigators found publicly insured patients treated with SSRIs had a 13% increased risk for T2D, compared with those not treated with these agents. In addition, those taking SSRIs continuously (defined as receiving one or more prescriptions every 3 months) had a 33% increased risk of T2D.
On the other hand, privately insured youth had a much lower increased risk – a finding that may be attributable to a lower prevalence of risk factors for T2D in this group.
“We cannot exclude that children and adolescents treated with SSRIs may be at a small increased risk of developing T2D, particularly publicly insured patients, but the magnitude of association was weaker than previous thought and much smaller than other known risk factors for T2DM, such as obesity, race, and poverty,” lead investigator Jenny Sun, PhD, said in an interview.
“When weighing the known benefits and risks of SSRI treatment in children and adolescents, our findings provide reassurance that the risk of T2DM is not as substantial as initially reported,” said Dr. Sun, a postdoctoral research fellow in the department of population medicine at Harvard Medical School’s Harvard Pilgrim Health Care Institute, Boston.
The study was published online Sept. 2 in JAMA Psychiatry.
Limited evidence
Previous research suggested that SSRIs increase the risk of T2D by up to 90% in children and adolescents.
However, the investigators noted, the study reporting this finding was too small to draw conclusions about the SSRI class as a whole also did not examine specific SSRIs.
In addition, although “several studies have reported that antidepressant use may be a risk factor for T2D in adults, evidence was limited in children and adolescents,” said Dr. Sun.
“Rapid changes in growth during childhood and adolescents can alter drugs’ pharmacokinetics and pharmacodynamics, so high-quality, age-specific data are needed to inform prescribing decisions,” she said.
For the current study, the researchers analyzed claims data on almost 1.6 million patients aged 10-19 years (58.3% female; mean age, 15.1 years) from two large claims databases.
The analysis focused on those with a diagnosis warranting treatment with an SSRI, including depression, generalized or social anxiety disorder, obsessive compulsive disorder, PTSD, panic disorder, or bulimia nervosa.
The Medicaid Analytic Extract database consisted of 316,178 patients insured through Medicaid or the Children’s Health Insurance Program. The IBM MarketScan database consisted of 211,460 privately insured patients. Patients were followed up for a mean of 2.3 and 2.2 years, respectively.
Patients who initiated SSRI treatment were compared with those with a similar indication but who were not taking an SSRI. Secondary analyses compared new SSRI users with patients who recently initiated treatment with bupropion, which has no metabolic side effects, or with patients who recently initiated psychotherapy.
“In observational data, it is difficult to mimic a placebo group, often used in RCTs [randomized, controlled trials], therefore several comparator groups were explored to broaden our understanding,” said Dr. Sun.
In addition, the researchers compared the individual SSRI medications, using fluoxetine as a comparator.
A wide range of more than 100 potential confounders or “proxies of confounders,” were taken into account, including demographic characteristics, psychiatric diagnoses, metabolic conditions, concomitant medications, and use of health care services.
The researchers conducted two analyses. They included an intention-to-treat (ITT) analysis that was restricted to patients with one or more additional SSRI prescriptions during the 6 months following the index exposure assessment period.
Close monitoring required
An as-treated analysis estimated the association of continuous SSRI treatment (vs. untreated, bupropion treatment, and psychotherapy), with adherence assessed at 3-month intervals.
Initiation and continuation of SSRI treatment in publicly insured patients were both associated with a considerably higher risk of T2D, compared with untreated patients, and a steeper risk, compared with their privately insured counterparts.
For newly treated publicly insured patients initiated on SSRI treatment, the ITT adjusted hazard ratio was 1.13 (95% confidence interval, 1.04-1.22).
There was an even stronger association among continuously treated publicly insured patients, with an as-treated aHR of 1.33 (95% CI, 1.21-1.47). The authors noted that this corresponds to 6.6 additional T2D cases per 10,000 patients continuously treated for at least 2 years.
The association was weaker in privately insured patients (ITT aHR, 1.01; 95% CI, 0.84-1.23; as-treated aHR, 1.10; 95% CI, 0.88-1.36).
The secondary analyses yielded similar findings: When SSRI treatment was compared with psychotherapy, the as-treated aHR for publicly insured patients was 1.44 (95% CI, 1.25-1.65), whereas the aHR for privately insured patients was lower at 1.21 (95% CI, 0.93-1.57)
The investigators found no increased risk when SSRIs were compared with bupropion, and the within-class analysis showed that none of the SSRIs carried an increased hazard of T2D, compared with fluoxetine.
“Publicly insured patients are enrolled in Medicaid and the Children’s Health Insurance Program, whereas privately insured patients are generally covered by their parent’s employer-sponsored insurance,” said Dr. Sun.
“Publicly insured patients are of lower socioeconomic status and represent a population with greater overall medical burden, more comorbidities, and a higher prevalence of risk factors for T2D, such as obesity, at the time of treatment initiation,” she said.
She added that high-risk children and youth should be closely monitored and clinicians should also consider recommending dietary modifications and increased exercise to offset T2D risk.
Useful ‘real-world data’
William Cooper, MD, MPH, professor of pediatrics and health policy at Vanderbilt University Medical Center in Nashville, Tenn., said that the study “provides a fascinating look at risks of SSRI medications in children and adolescents.”
Dr. Cooper, who was not involved with the study, said that the authors “draw from real-world data representing two different populations and carefully consider factors which might confound the associations.”
The results, he said, “provide important benefits for patients, families, and clinicians as they weigh the risks and benefits of using SSRIs for children who need treatment for depression and anxiety disorders.
The study was supported by a training grant from the program in pharmacoepidemiology at the Harvard School of Public Health. Dr. Sun disclosed no relevant financial relationships. Dr. Cooper disclosed no relevant financial relationships.
A version of this article originally appeared on Medscape.com.