User login
Investigating Real-World Tolerance and Dose Reductions of Oncology Multikinase Inhibitors in a VA Population
Investigating Real-World Tolerance and Dose Reductions of Oncology Multikinase Inhibitors in a VA Population
The US Department of Veterans Affairs (VA) annually treats around 450,000 veterans with cancer and diagnoses an additional 56,000.1,2 Oral multikinase inhibitors (MKIs) are widely used as targeted therapies for many different malignancies. Despite the ease of oral administration, these agents are often accompanied by significant adverse effects (AEs) and drug-drug interactions.3,4 Common AEs include hypertension, cutaneous reactions, gastrointestinal disturbances, proteinuria, and fatigue. Some serious outcomes that may occur are myocardial infarction, thrombosis, nephrotic syndrome, hemorrhage, hepatotoxicity, and gastrointestinal events.5,6 Due to poor tolerability of these AEs, dose reductions, frequent therapy holds, and discontinuation of therapy may occur.
The US Food and Drug Administration recognizes dosing challenges with novel therapies and has created the Oncology Center of Excellence (OCE) Project Optimus initiative to reform dose optimization in oncology drug development. The initiative aims to shift the focus from establishing dose regimens based on the maximum tolerated doses of cytotoxic chemotherapeutics to an emphasis on maximum efficacy, safety, and tolerability, which better reflect real-world dosing.7,8
MKIs can be challenging to manage because of the frequent toxicity-related dose reductions, interruptions, and discontinuations. In a multicenter retrospective study, Schnadig et al investigated dosing characteristics of first-line sunitinib for advanced renal cell carcinoma (RCC) and found that, among 114 patients who experienced AEs while taking sunitinib, 39.5% had dose reductions, 5.3% delayed therapy, 18.4% required additional supportive medications, and 22.8% discontinued sunitinib.9 Overall survival and median progression-free survival of these patients were lower than reported by Motzer et al in a phase 3 clinical trial.10 Schnadig et al concluded that patients treated with sunitinib for RCC in the community setting required more frequent dose reductions and had less time on therapy compared with patients in clinical trials, which ultimately impacted clinical outcomes.9
At the VA North Texas Health Care System (VANTHCS), patients with cancer have difficulty tolerating MKIs and often require dose alterations and/or discontinuation because of drug intolerance rather than discontinuation due to progression. Frequent dose adjustments for toxicity management can place more strain on patients and health care resources because of additional appointments, clinician time, and emergency department visits. Escalating drug costs can also cause concern when prescription doses are unused or changed frequently.
To capture and quantify prescribing practices and dose adjustments, this study evaluated the tolerability of MKIs at VANTHCS. This analysis may also guide clinicians in the selection of starting doses as well as dose titration expectations to optimize MKI therapy.
METHODS
This single-center, retrospective chart review analyzed patients receiving oral oncology MKIs for various malignancies at VANTHCS between January 1, 2014, and October 31, 2024. Participants included adults aged ≥ 18 years with a prescription for axitinib, cabozantinib, lenvatinib, pazopanib, regorafenib, sorafenib, or sunitinib initiated by the hematology/oncology service at VANTHCS. Patients were included if they had follow-up documentation with the hematology/oncology service and/or other VANTHCS clinicians outlining their course of therapy after MKI initiation. Patients were excluded if they did not have sufficient follow-up documentation (eg, transferred care to a non-VA health care practitioner [HCP], moved to another VA health care system), were enrolled in clinical trials, or were prescribed an MKI from a Care in the Community (CITC) prescriber. Electronic health record review and data collection were performed using the VA Computerized Patient Record System and Research Electronic Data Capture. Data were collected from the time of initiation to cessation of therapy and included information regarding therapy changes, progressive disease, and date of death, when available. Data collected included age, sex, race, comorbidities, date of death, type of malignancy and subtypes, cancer stage, MKI used (ie, drug, dose, frequency, schedule, and indication), dates of medication changes (ie, start, adjustment, hold, discontinuation), concurrent antineoplastic treatments, and AEs documented at times of dose change or interruption.
The primary outcome was MKI tolerance determined using relative dose intensity (RDI) and mean and median time on therapy. Two methods are used to calculate RDI that vary in how they approach time on therapy as outlined in Hawn et al.11 This study used method 2, which accounts for holds in therapy by comparing the actual duration of treatment with the duration expected according to treatment protocol. Method 1 compares the prescribed dose with the administered dose and does not adjust for holds.11 Using method 2, the RDI in this study was calculated by dividing the total actual dose given by the total indicated dose for the malignancy being treated, which accounts for duration of treatment.

The total actual dose was the strength, frequency, and days on therapy for each time frame of treatment multiplied together. This method accounted for all dose adjustments and time periods of treatment holds, including patient self-adjustments, prescriber-directed adjustments, and nonadherence determined by HCP documentation and/or prescription data. Similarly, the indicated total dose was calculated by multiplying the indicated strength, frequency, and all days that treatment should have occurred (time from start to finish). Indicated doses were derived from the prescribing information for each malignancy with the exception of sunitinib, for which the off-label dose of 37.5 mg daily was considered a full dose.12,13 The total indicated dose for axitinib was calculated by considering the dose escalation schedule from the prescribing information.
Patients who required dose reductions due to renal/hepatic impairments or drug-drug interactions had their total indicated dose calculated using dose adjustments listed in the prescribing information. The mean RDI for each MKI agent was calculated by averaging the RDI for each prescription. The overall combined mean RDI included the means of all the MKIs reviewed to avoid skewing the results toward an MKI with more prescriptions. RDIs were also calculated for each cancer type for each agent. Additional descriptive secondary outcomes included rates of AEs and adjustments in doses.
RESULTS
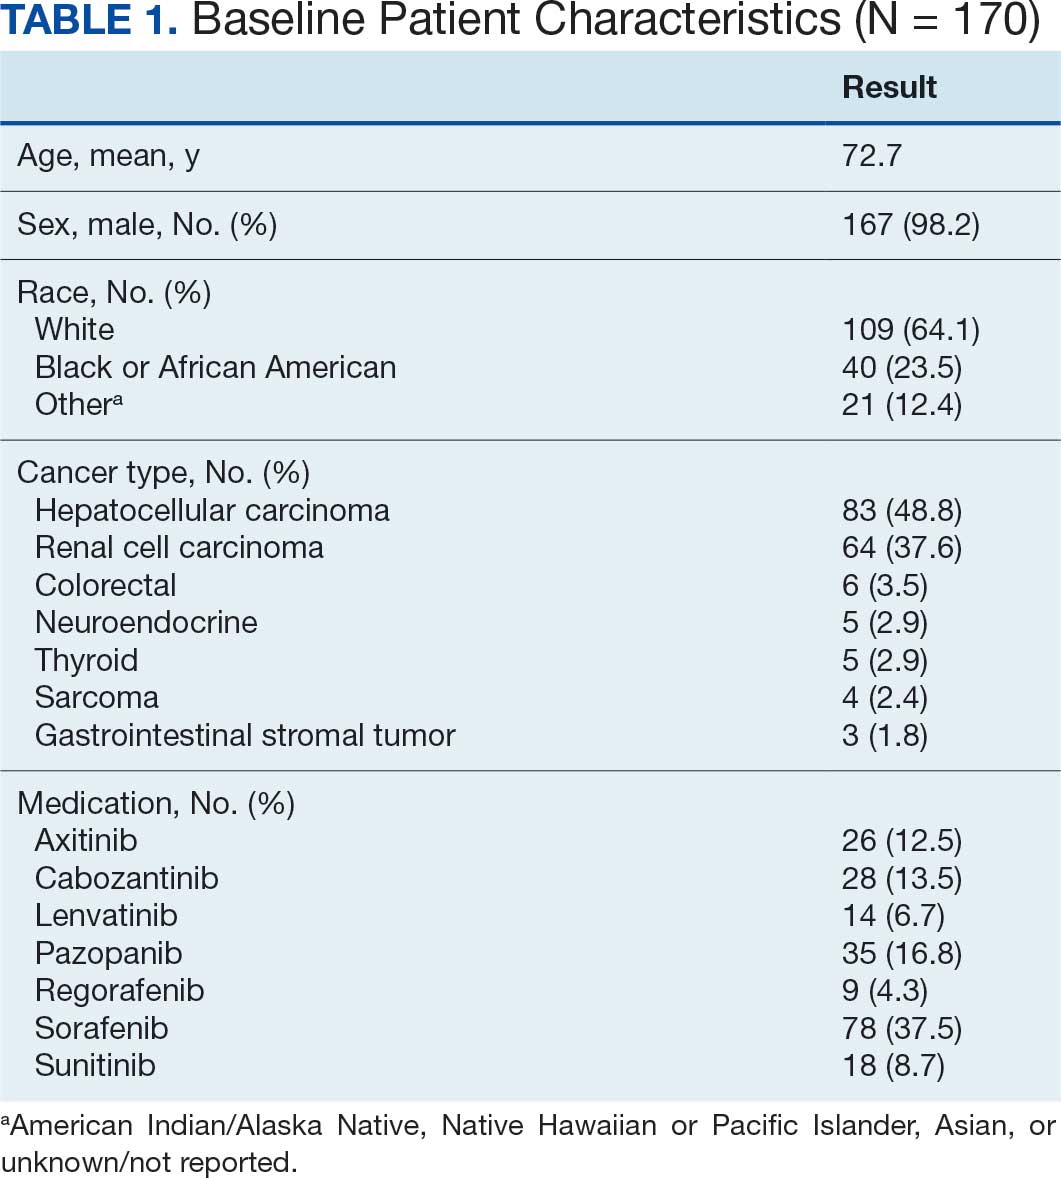
Electronic data extraction identified 278 patients with 366 MKI prescriptions, of which 108 veterans with 158 MKI prescriptions were excluded. The top reason for exclusion was patients managed through CITC. Ultimately, 170 veterans with 208 MKI prescriptions managed by the VANTHCS hematology/oncology clinic were included (Table 1). Among patients receiving MKIs, the mean age was 72.7 years, 98% were male, and 99% had metastatic disease.
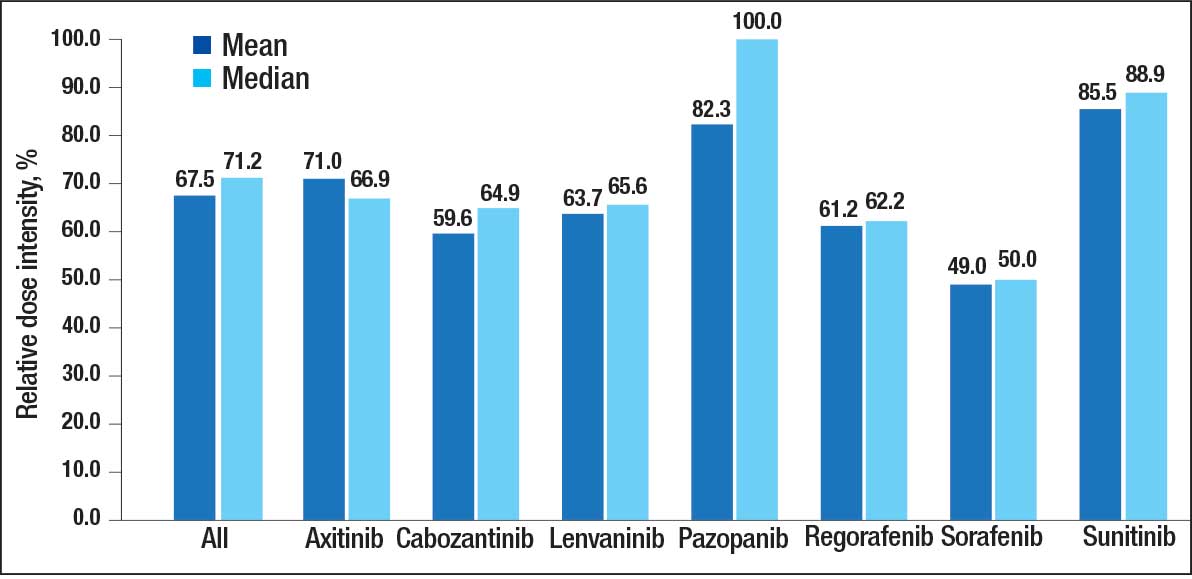
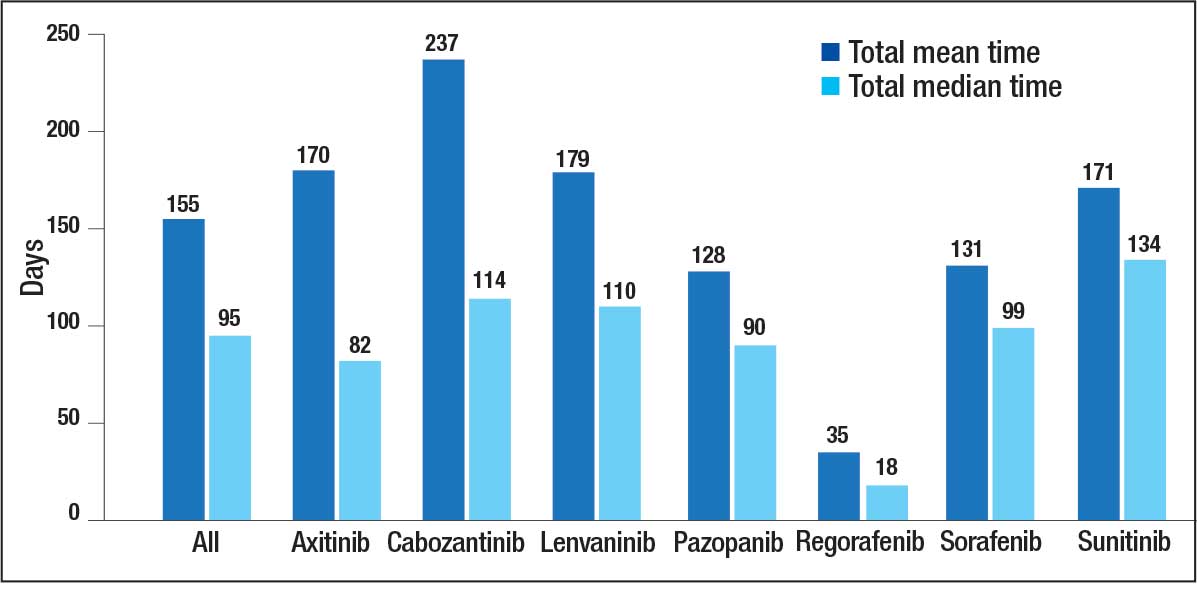
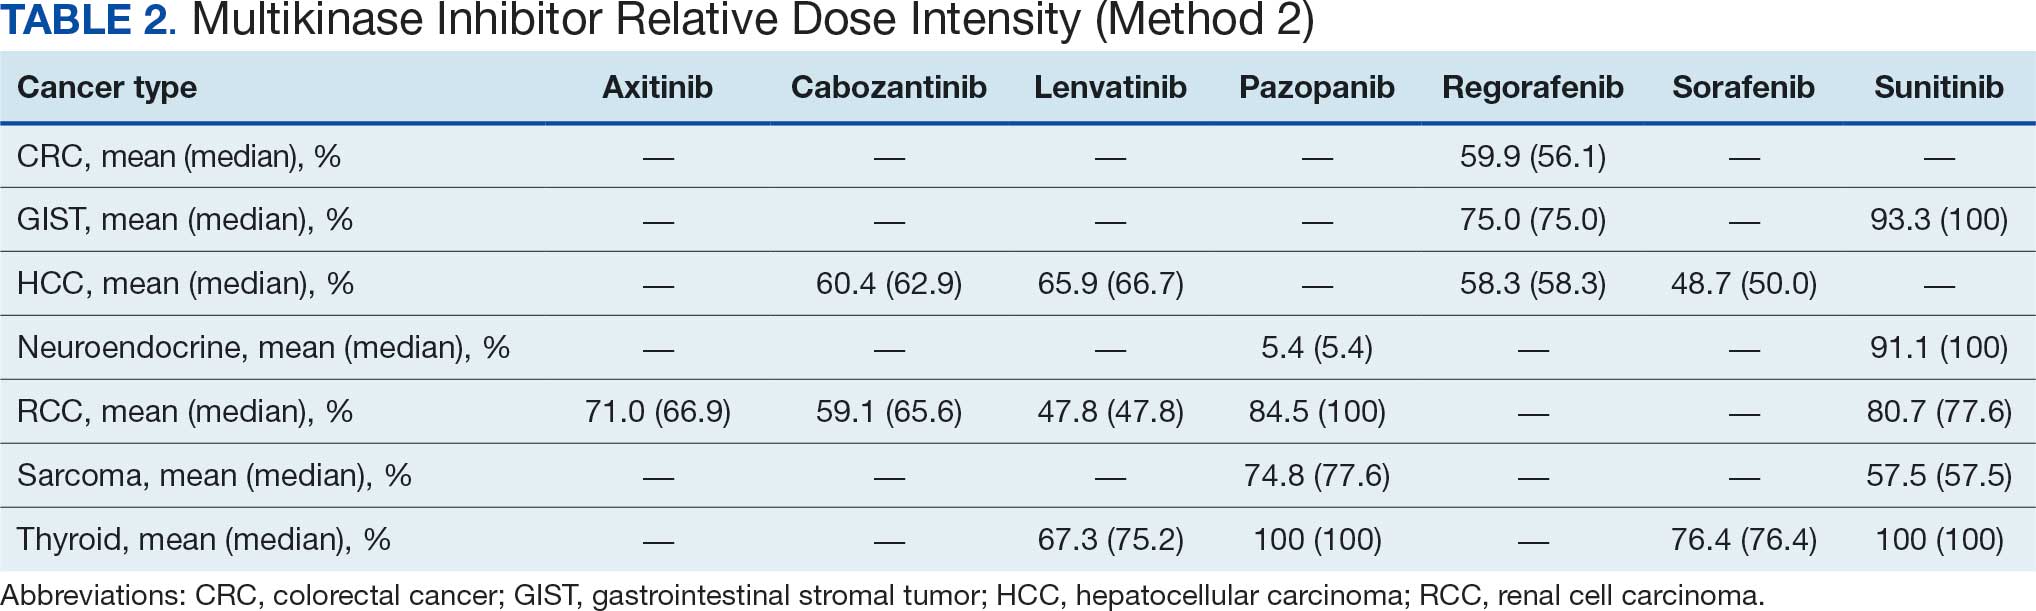
The overall combined mean MKI RDI was 67.5% using method 2 and ranged from 85.5% for sunitinib to 49.0% for sorafenib (Figure 1). Additional information regarding mean and median RDIs using method 2 is shown in Figure 1 and further subdivided by cancer type in Table 2. Median RDIs overall were similar to mean RDIs for most agents. Figure 2 indicates the mean and median time on therapy, reflecting time on therapy excluding days therapy was held. The overall combined mean and median days on therapy for all MKIs were 155 days and 95 days, respectively. Mean time on therapy depended on the agent used and ranged from 35 days (regorafenib) to 237 days (cabozantinib).
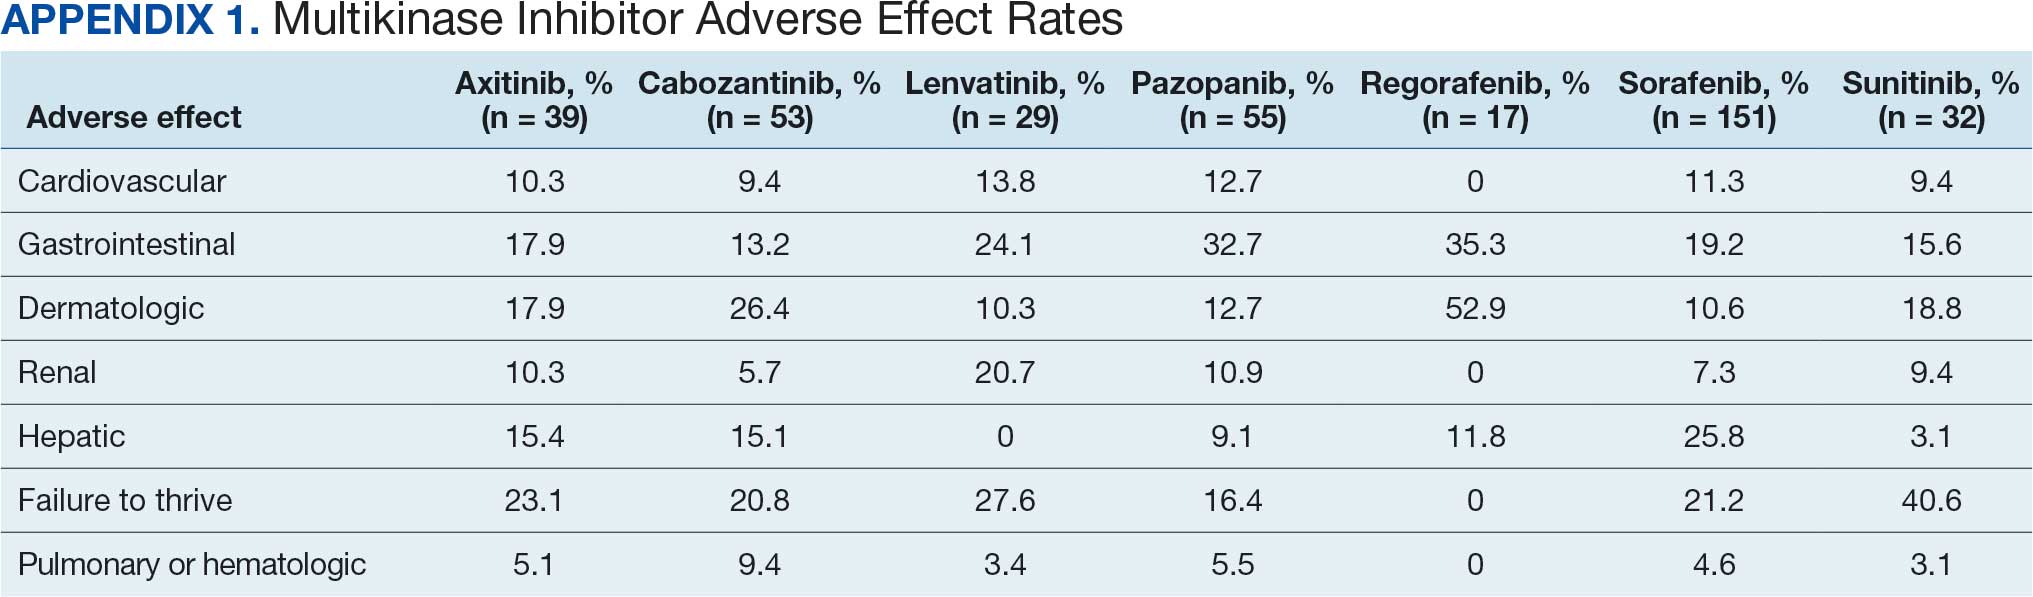
Of 208 MKI prescriptions, 127 (61.1%) were initiated at a reduced dose due to baseline concerns for tolerance such as performance status, frailty, and prior intolerance of other treatments. Eighty-one prescriptions (38.9%) were initiated at their indicated doses. Ninety prescriptions (43.3%) required dose reductions during treatment. Some MKI prescriptions had multiple dose increases and decreases, which is why RDI more accurately reflects dose adjustments. A total of 376 AEs that contributed to a dose adjustment, hold, or discontinuation occurred across all MKI prescriptions. The most common AEs were 82 failure-to-thrive events (21.8%) (fatigue, malaise, loss of appetite, reduced mobility, global decline), 79 gastrointestinal events (21.0%) (nausea, vomiting, diarrhea, abdominal pain), 62 dermatologic events (16.5%) (rash, hand-foot skin reactions, allergic response), 61 hepatic dysfunction events (16.2%) (liver enzyme elevations, hyperbilirubinemia), 40 cardiovascular events (10.6%) (hypertension, heart failure exacerbations, edema), and 33 renal dysfunction events (8.8%) (acute kidney injury, proteinuria) (Appendix 1).
DISCUSSION
The mean RDI of MKI prescriptions used in the veteran population at VANTHCS was about two-thirds of the indicated dose. These results indicate that most veterans required dose reductions and/or holds due to concerns over initial tolerance/performance status, worsening clinical condition, and/or intolerable AEs attributed to treatment. A retrospective study conducted by Denduluri et al suggested that an RDI of < 85% is a clinically meaningful reduction for traditional chemotherapy based on previous literature.14 However, it is less clear what RDI should be expected specifically for MKIs in real-world populations. The MKI phase 3 approval trials in RCC for axitinib, lenvatinib, and sunitinib found median RDIs of 89.4%, 69.6% to 70.4%, and 83.9%, respectively. Each trial cited dose reductions most commonly as the result of treatment-related AEs.15,16
Studies on the impact of RDIs on survival outcomes found that higher RDIs may improve overall and progression-free survival. Retrospective studies inspecting lenvatinib in hepatocellular carcinoma (HCC) indicated that an RDI > 70% in the initial 4 weeks resulted in favorable survival outcomes.17 Similarly, a retrospective study investigating sunitinib in RCC found that an RDI > 60% conferred favorable survival outcomes.18 Alghamdi et al noted that patients taking sorafenib for HCC who had RDI > 50% had a favorable trend in survival characteristics. Interestingly, the study found an RDI of 50% to 75% appeared to have better survival than an RDI > 75%.19 The authors of these studies hypothesized that additional dose reductions allowed for longer total time on therapy due to improved tolerability.17-19
This analysis found that the RDIs for most MKI agents at VANTHCS were < 85% and lower than the RDIs found in other review articles and phase 3 trials, with the exceptions of pazopanib in thyroid cancer and sunitinib in gastrointestinal stromal tumor (GIST), thyroid cancer, and neuroendocrine cancer. The reasons for the lower RDIs in this study are likely multifactorial, reflecting patient population characteristics, off-label dosing practices, and HCP experiences with these agents. Many veterans have chronic comorbidities that could contribute to reduced performance status and ability to tolerate these therapies. Despite attempts to preemptively reduce doses for patients and account for potential impaired tolerance, there were patients who required further dose reductions in our study.
Failure to thrive was the most common AE leading to dose adjustment or discontinuation, which illustrates the extensive effects these agents have on patient functioning in a real-world population. Notably though, the RDI for sunitinib was higher in this population because about half of patients were dosed using the off-label recommendation, whereas the prescribing information recommends a more intensive 6-week dosing cycle for certain cancer types.12,13,20 Sorafenib was also often dose-adjusted based on a pharmacokinetic study of sorafenib in renal/hepatic dysfunction, and the RDI likely reflects the off-label prescribing pattern.21
Patients with thyroid cancer were found to have higher RDIs compared with those receiving the same agents for other cancer types. Improved tolerability of MKIs in thyroid cancer may be due to a generally more tolerable disease course. Thyroid cancer is the most common cancer in individuals aged < 40 years, a population that is often more robust with fewer comorbidities. Moreover, the 5-year relative survival rate for thyroid cancer remains > 98%.22 This rate is in contrast to those for other cancer types such as HCC, with a 5-year relative survival rate of only 15%.23
It is challenging to compare the mean and median times on therapy found in this study with those in current literature, as this review included multiple different cancer types for each agent. However, the numbers are generally lower than durations of therapy found across the different disease states and further emphasize the difficulty in tolerating MKIs in the VANTHCS population. Regorafenib had a short duration of time on therapy, which highlights the importance of trials like ReDOS and initiatives such as OCE Project Optimus in helping improve tolerance.7,8,24
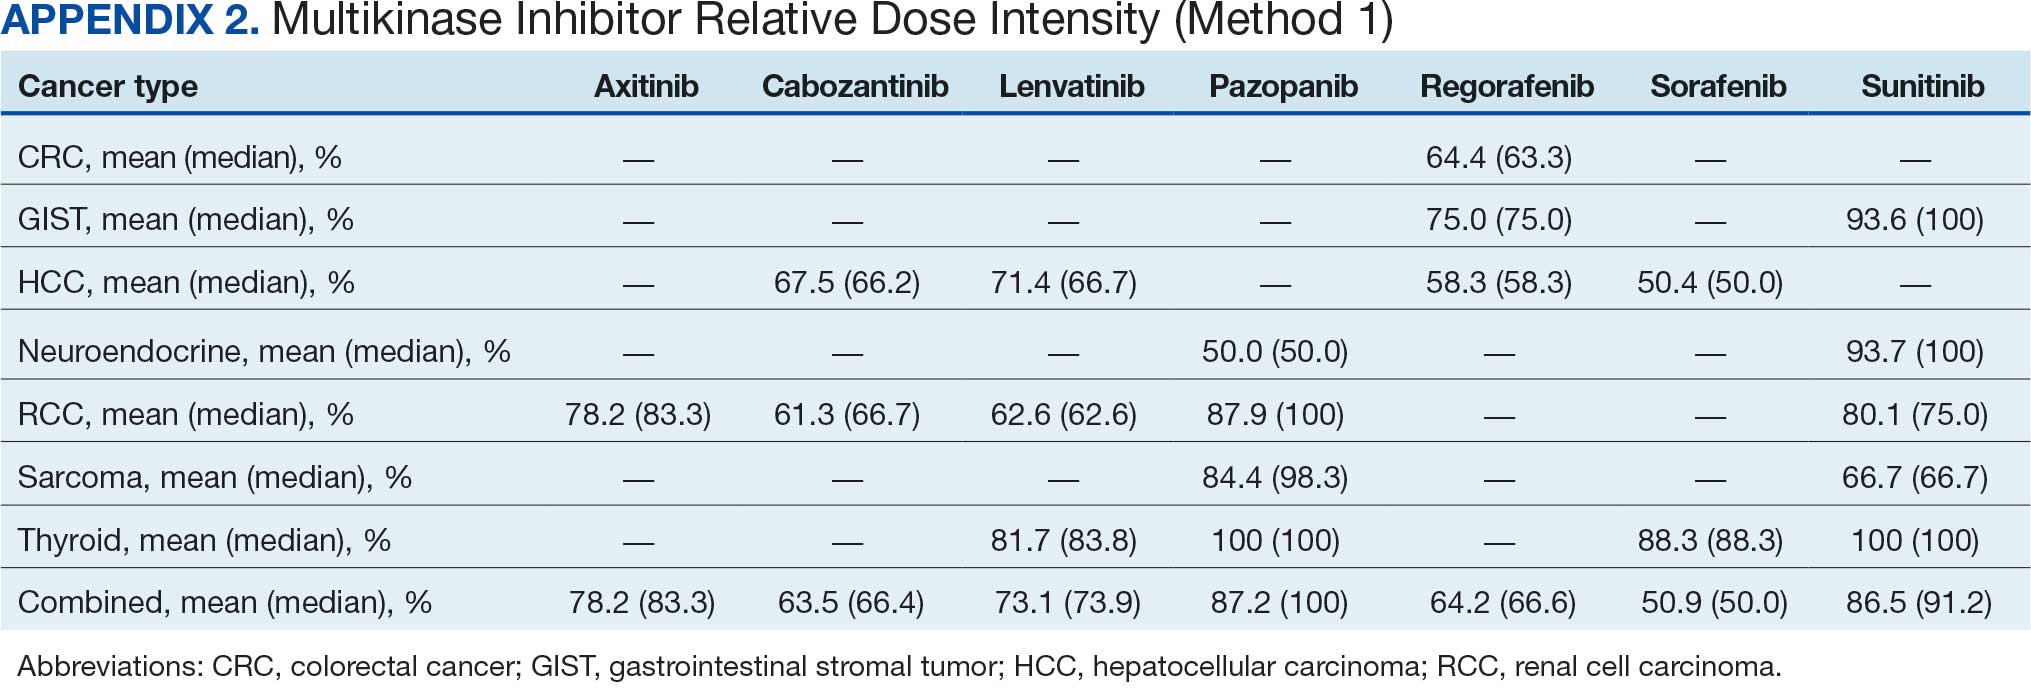
Comparing our results with other studies proved challenging because the RDI calculation methods were not specified. Calculating RDIs in this study using method 1, which does not account for holds, resulted in higher RDIs (Appendix 2). Using method 1, all MKIs had RDIs < 85%, except for pazopanib in thyroid cancer (100%) and RCC (87.9%), and sunitinib in GIST (93.6%), thyroid cancer (100%), and neuroendocrine cancer (93.7%). Notably, using method 1 increased the RDI for pazopanib in neuroendocrine cancer from 5.4% to 50.0%. The low RDI was attributed to a single veteran with a long hold duration, which demonstrates the discrepancy that can occur between the 2 methods.
Limitations
The retrospective design, lack of survival outcomes, and difficulty comparing results with other literature were limitations of this study. Because survival outcomes were not evaluated, future research should seek to investigate how RDIs and dose adjustments made among MKIs can affect survival outcomes in real-world populations. This veteran population with cancer often had multiple chronic comorbidities, which may have contributed to difficulty tolerating MKIs and could have impacted results. Disease-related factors may have influenced the poor tolerance of the MKIs and were not specifically accounted for. Adjustment for comorbidities was not possible because of discrepancies and/or incomplete diagnosis codes and Eastern Cooperative Oncology Group performance status scores documented in patient charts. Therefore, we decided not to report these findings due to potential inaccuracies.
CONCLUSIONS
Results of this study demonstrate that oncology MKI agents used at VANTHCS were difficult for patients to tolerate, leading to suboptimal dosing compared with indicated doses established in clinical trials and prescribing information. Clinicians may use these data to help guide clinical decision-making whenever initiating and managing MKI agents in this population. These findings reinforce that MKI agents are often difficult to tolerate in real-world practice, and indicated doses are often not achieved. Further studies should aim to investigate the effect that various RDIs have on overall survival. Further investigation into different dosing schemes for MKIs to improve tolerability and longer-term use may also prove beneficial.
This analysis may help guide clinicians to carefully approach dosing MKI agents in the veteran population. Given the RDI and AEs, more clinicians may consider starting at lower than indicated doses with the goal to titrate up as tolerated. Additionally, the results highlight the importance of considering palliative care consults and ensuring appropriate supportive care agents are preemptively engaged and adjusted as needed. Approaching dosing and titrations cautiously may help reduce the burden of management on the health care system.
- Frequently asked questions. VA National Oncology Program. 2025. Accessed December 15, 2025. https://www.cancer.va.gov/CANCER/faqs.html
- Torez L. Reigniting the cancer moonshot to beat cancer. VA News. April 20, 2023. Accessed April 6, 2026. https://news.va.gov/118378/reigniting-the-cancer-moonshot-to-beat-cancer
- Shah NN, Casella E, Capozzi D, et al. Improving the safety of oral chemotherapy at an academic medical center. J Oncol Pract. 2016;12:e71-e76. doi:10.1200/JOP.2015.007260
- Hussaarts KGAM, Veerman GDM, Jansman FGA, et al. Clinically relevant drug interactions with multikinase inhibitors: a review. Ther Adv Med Oncol. 2019;11:1758835918818347. doi:10.1177/1758835918818347
- Shyam Sunder S, Sharma UC, Pokharel S. Adverse effects of tyrosine kinase inhibitors in cancer therapy: pathophysiology, mechanisms and clinical management. Signal Transduct Target Ther. 2023;8:262. doi:10.1038/s41392-023-01469-6
- Thomson RJ, Moshirfar M, Ronquillo Y. Tyrosine kinase inhibitors. In: StatPearls [Internet]. StatPearls Publishing; updated July 18, 2023. Accessed December 15, 2025. https://www.ncbi.nlm.nih.gov/books/NBK563322/
- Project Optimus. US Food and Drug Administration. Updated December 6, 2024. Accessed December 15, 2025. https://www.fda.gov/about-fda/oncology-center-excellence/project-optimus
- Optimizing the dosage of human prescription drugs and biological products for the treatment of oncologic diseases: Guidance for Industry. Docket number FDA-2022-D-2827. US Food and Drug Administration. August 2024. Accessed December 15, 2025. https://www.fda.gov/regulatory-information/search-fda-guidance-documents/optimizing-dosage-human-prescription-drugs-and-biological-products-treatment-oncologic-diseases
- Schnadig ID, Hutson TE, Chung H, et al. Dosing patterns, toxicity, and outcomes in patients treated with first-line sunitinib for advanced renal cell carcinoma in community-based practices. Clin Genitourin Cancer. 2014;12:413-421. doi:10.1016/j.clgc.2014.06.015
- Motzer RJ, Hutson TE, Tomczak P, et al. Sunitinib versus interferon alfa in metastatic renal-cell carcinoma. N Engl J Med. 2007;356:115-124. doi:10.1056/nejmoa065044
- Hawn C, Bansal D. Relative dose intensity in oncology trials: a discussion of two approaches. PharmaSUG. 2024. Accessed April 6, 2026. https://pharmasug.org/proceedings/2024/ST/PharmaSUG-2024-ST-297.pdf
- George S, Merriam P, Maki RG, et al. Multicenter phase II trial of sunitinib in the treatment of nongastrointestinal stromal tumor sarcomas. J Clin Oncol. 2009;27:3154-3160. doi:10.1200/jco.2008.20.9890
- George S, Blay JY, Casali PG, et al. Clinical evaluation of continuous daily dosing of sunitinib malate in patients with advanced gastrointestinal stromal tumour after imatinib failure. Eur J Cancer. 2009;45:1959-1968. doi:10.1016/j.ejca.2009.02.011
- Denduluri N, Patt DA, Wang Y, et al. Dose delays, dose reductions, and relative dose intensity in patients with cancer who received adjuvant or neoadjuvant chemotherapy in community oncology practices. J Natl Compr Canc Netw. 2015;13:1383-1393. doi:10.6004/jnccn.2015.0166
- Motzer RJ, Penkov K, Haanen J, et al. Avelumab plus axitinib versus sunitinib for advanced renal-cell carcinoma. N Engl J Med. 2019;380:1103-1115. doi:10.1056/nejmoa1816047
- Motzer R, Alekseev B, Rha SY, et al. Lenvatinib plus pembrolizumab or everolimus for advanced renal cell carcinoma. N Engl J Med. 2021;384:1289-1300. doi:10.1056/nejmoa2035716
- Kirino S, Tsuchiya K, Kurosaki M, et al. Relative dose intensity over the first four weeks of lenvatinib therapy is a factor of favorable response and overall survival in patients with unresectable hepatocellular carcinoma. PloS One. 2020;15:e0231828. doi:10.1371/journal.pone.0231828
- Ishihara H, Takagi T, Kondo T, et al. Decreased relative dose intensity during the early phase of treatment impacts the therapeutic efficacy of sunitinib in metastatic renal cell carcinoma. Jpn J Clin Oncol. 2018;48:667-672. doi:10.1093/jjco/hyy078
- Alghamdi MA, Amaro CP, Lee-Ying R, et al. Effect of sorafenib starting dose and dose intensity on survival in patients with hepatocellular carcinoma: results from a Canadian Multicenter Database. Cancer Med. 2020;9:4918-4928. doi:10.1002/cam4.3228
- Motzer RJ, Rini BI, Bukowski RM, et al. Sunitinib in patients with metastatic renal cell carcinoma. JAMA. 2006;295:2516-2524. doi:10.1001/jama.295.21.2516
- Miller AA, Murry DJ, Owzar K, et al. Phase I and pharmacokinetic study of sorafenib in patients with hepatic or renal dysfunction: CALGB 60301. J Clin Oncol. 2009;27:1800-1805. doi:10.1200/jco.2008.20.0931
- Boucai L, Zafereo M, Cabanillas ME. Thyroid cancer: a review. JAMA. 2024;331:425-435. doi:10.1001/jama.2023.26348
- Amin N, Anwar J, Sulaiman A, et al. Hepatocellular carcinoma: a comprehensive review. Diseases. 2025;13:207. doi:10.3390/diseases13070207
- Bekaii-Saab TS, Ou FS, Ahn DH, et al. Regorafenib dose-optimisation in patients with refractory metastatic colorectal cancer (ReDOS): a randomised, multicentre, open-label, phase 2 study. Lancet Oncol. 2019;20:1070-1082. doi:10.1016/s1470-2045(19)30272-4
The US Department of Veterans Affairs (VA) annually treats around 450,000 veterans with cancer and diagnoses an additional 56,000.1,2 Oral multikinase inhibitors (MKIs) are widely used as targeted therapies for many different malignancies. Despite the ease of oral administration, these agents are often accompanied by significant adverse effects (AEs) and drug-drug interactions.3,4 Common AEs include hypertension, cutaneous reactions, gastrointestinal disturbances, proteinuria, and fatigue. Some serious outcomes that may occur are myocardial infarction, thrombosis, nephrotic syndrome, hemorrhage, hepatotoxicity, and gastrointestinal events.5,6 Due to poor tolerability of these AEs, dose reductions, frequent therapy holds, and discontinuation of therapy may occur.
The US Food and Drug Administration recognizes dosing challenges with novel therapies and has created the Oncology Center of Excellence (OCE) Project Optimus initiative to reform dose optimization in oncology drug development. The initiative aims to shift the focus from establishing dose regimens based on the maximum tolerated doses of cytotoxic chemotherapeutics to an emphasis on maximum efficacy, safety, and tolerability, which better reflect real-world dosing.7,8
MKIs can be challenging to manage because of the frequent toxicity-related dose reductions, interruptions, and discontinuations. In a multicenter retrospective study, Schnadig et al investigated dosing characteristics of first-line sunitinib for advanced renal cell carcinoma (RCC) and found that, among 114 patients who experienced AEs while taking sunitinib, 39.5% had dose reductions, 5.3% delayed therapy, 18.4% required additional supportive medications, and 22.8% discontinued sunitinib.9 Overall survival and median progression-free survival of these patients were lower than reported by Motzer et al in a phase 3 clinical trial.10 Schnadig et al concluded that patients treated with sunitinib for RCC in the community setting required more frequent dose reductions and had less time on therapy compared with patients in clinical trials, which ultimately impacted clinical outcomes.9
At the VA North Texas Health Care System (VANTHCS), patients with cancer have difficulty tolerating MKIs and often require dose alterations and/or discontinuation because of drug intolerance rather than discontinuation due to progression. Frequent dose adjustments for toxicity management can place more strain on patients and health care resources because of additional appointments, clinician time, and emergency department visits. Escalating drug costs can also cause concern when prescription doses are unused or changed frequently.
To capture and quantify prescribing practices and dose adjustments, this study evaluated the tolerability of MKIs at VANTHCS. This analysis may also guide clinicians in the selection of starting doses as well as dose titration expectations to optimize MKI therapy.
METHODS
This single-center, retrospective chart review analyzed patients receiving oral oncology MKIs for various malignancies at VANTHCS between January 1, 2014, and October 31, 2024. Participants included adults aged ≥ 18 years with a prescription for axitinib, cabozantinib, lenvatinib, pazopanib, regorafenib, sorafenib, or sunitinib initiated by the hematology/oncology service at VANTHCS. Patients were included if they had follow-up documentation with the hematology/oncology service and/or other VANTHCS clinicians outlining their course of therapy after MKI initiation. Patients were excluded if they did not have sufficient follow-up documentation (eg, transferred care to a non-VA health care practitioner [HCP], moved to another VA health care system), were enrolled in clinical trials, or were prescribed an MKI from a Care in the Community (CITC) prescriber. Electronic health record review and data collection were performed using the VA Computerized Patient Record System and Research Electronic Data Capture. Data were collected from the time of initiation to cessation of therapy and included information regarding therapy changes, progressive disease, and date of death, when available. Data collected included age, sex, race, comorbidities, date of death, type of malignancy and subtypes, cancer stage, MKI used (ie, drug, dose, frequency, schedule, and indication), dates of medication changes (ie, start, adjustment, hold, discontinuation), concurrent antineoplastic treatments, and AEs documented at times of dose change or interruption.
The primary outcome was MKI tolerance determined using relative dose intensity (RDI) and mean and median time on therapy. Two methods are used to calculate RDI that vary in how they approach time on therapy as outlined in Hawn et al.11 This study used method 2, which accounts for holds in therapy by comparing the actual duration of treatment with the duration expected according to treatment protocol. Method 1 compares the prescribed dose with the administered dose and does not adjust for holds.11 Using method 2, the RDI in this study was calculated by dividing the total actual dose given by the total indicated dose for the malignancy being treated, which accounts for duration of treatment.
The total actual dose was the strength, frequency, and days on therapy for each time frame of treatment multiplied together. This method accounted for all dose adjustments and time periods of treatment holds, including patient self-adjustments, prescriber-directed adjustments, and nonadherence determined by HCP documentation and/or prescription data. Similarly, the indicated total dose was calculated by multiplying the indicated strength, frequency, and all days that treatment should have occurred (time from start to finish). Indicated doses were derived from the prescribing information for each malignancy with the exception of sunitinib, for which the off-label dose of 37.5 mg daily was considered a full dose.12,13 The total indicated dose for axitinib was calculated by considering the dose escalation schedule from the prescribing information.
Patients who required dose reductions due to renal/hepatic impairments or drug-drug interactions had their total indicated dose calculated using dose adjustments listed in the prescribing information. The mean RDI for each MKI agent was calculated by averaging the RDI for each prescription. The overall combined mean RDI included the means of all the MKIs reviewed to avoid skewing the results toward an MKI with more prescriptions. RDIs were also calculated for each cancer type for each agent. Additional descriptive secondary outcomes included rates of AEs and adjustments in doses.
RESULTS
Electronic data extraction identified 278 patients with 366 MKI prescriptions, of which 108 veterans with 158 MKI prescriptions were excluded. The top reason for exclusion was patients managed through CITC. Ultimately, 170 veterans with 208 MKI prescriptions managed by the VANTHCS hematology/oncology clinic were included (Table 1). Among patients receiving MKIs, the mean age was 72.7 years, 98% were male, and 99% had metastatic disease.
The overall combined mean MKI RDI was 67.5% using method 2 and ranged from 85.5% for sunitinib to 49.0% for sorafenib (Figure 1). Additional information regarding mean and median RDIs using method 2 is shown in Figure 1 and further subdivided by cancer type in Table 2. Median RDIs overall were similar to mean RDIs for most agents. Figure 2 indicates the mean and median time on therapy, reflecting time on therapy excluding days therapy was held. The overall combined mean and median days on therapy for all MKIs were 155 days and 95 days, respectively. Mean time on therapy depended on the agent used and ranged from 35 days (regorafenib) to 237 days (cabozantinib).
Of 208 MKI prescriptions, 127 (61.1%) were initiated at a reduced dose due to baseline concerns for tolerance such as performance status, frailty, and prior intolerance of other treatments. Eighty-one prescriptions (38.9%) were initiated at their indicated doses. Ninety prescriptions (43.3%) required dose reductions during treatment. Some MKI prescriptions had multiple dose increases and decreases, which is why RDI more accurately reflects dose adjustments. A total of 376 AEs that contributed to a dose adjustment, hold, or discontinuation occurred across all MKI prescriptions. The most common AEs were 82 failure-to-thrive events (21.8%) (fatigue, malaise, loss of appetite, reduced mobility, global decline), 79 gastrointestinal events (21.0%) (nausea, vomiting, diarrhea, abdominal pain), 62 dermatologic events (16.5%) (rash, hand-foot skin reactions, allergic response), 61 hepatic dysfunction events (16.2%) (liver enzyme elevations, hyperbilirubinemia), 40 cardiovascular events (10.6%) (hypertension, heart failure exacerbations, edema), and 33 renal dysfunction events (8.8%) (acute kidney injury, proteinuria) (Appendix 1).
DISCUSSION
The mean RDI of MKI prescriptions used in the veteran population at VANTHCS was about two-thirds of the indicated dose. These results indicate that most veterans required dose reductions and/or holds due to concerns over initial tolerance/performance status, worsening clinical condition, and/or intolerable AEs attributed to treatment. A retrospective study conducted by Denduluri et al suggested that an RDI of < 85% is a clinically meaningful reduction for traditional chemotherapy based on previous literature.14 However, it is less clear what RDI should be expected specifically for MKIs in real-world populations. The MKI phase 3 approval trials in RCC for axitinib, lenvatinib, and sunitinib found median RDIs of 89.4%, 69.6% to 70.4%, and 83.9%, respectively. Each trial cited dose reductions most commonly as the result of treatment-related AEs.15,16
Studies on the impact of RDIs on survival outcomes found that higher RDIs may improve overall and progression-free survival. Retrospective studies inspecting lenvatinib in hepatocellular carcinoma (HCC) indicated that an RDI > 70% in the initial 4 weeks resulted in favorable survival outcomes.17 Similarly, a retrospective study investigating sunitinib in RCC found that an RDI > 60% conferred favorable survival outcomes.18 Alghamdi et al noted that patients taking sorafenib for HCC who had RDI > 50% had a favorable trend in survival characteristics. Interestingly, the study found an RDI of 50% to 75% appeared to have better survival than an RDI > 75%.19 The authors of these studies hypothesized that additional dose reductions allowed for longer total time on therapy due to improved tolerability.17-19
This analysis found that the RDIs for most MKI agents at VANTHCS were < 85% and lower than the RDIs found in other review articles and phase 3 trials, with the exceptions of pazopanib in thyroid cancer and sunitinib in gastrointestinal stromal tumor (GIST), thyroid cancer, and neuroendocrine cancer. The reasons for the lower RDIs in this study are likely multifactorial, reflecting patient population characteristics, off-label dosing practices, and HCP experiences with these agents. Many veterans have chronic comorbidities that could contribute to reduced performance status and ability to tolerate these therapies. Despite attempts to preemptively reduce doses for patients and account for potential impaired tolerance, there were patients who required further dose reductions in our study.
Failure to thrive was the most common AE leading to dose adjustment or discontinuation, which illustrates the extensive effects these agents have on patient functioning in a real-world population. Notably though, the RDI for sunitinib was higher in this population because about half of patients were dosed using the off-label recommendation, whereas the prescribing information recommends a more intensive 6-week dosing cycle for certain cancer types.12,13,20 Sorafenib was also often dose-adjusted based on a pharmacokinetic study of sorafenib in renal/hepatic dysfunction, and the RDI likely reflects the off-label prescribing pattern.21
Patients with thyroid cancer were found to have higher RDIs compared with those receiving the same agents for other cancer types. Improved tolerability of MKIs in thyroid cancer may be due to a generally more tolerable disease course. Thyroid cancer is the most common cancer in individuals aged < 40 years, a population that is often more robust with fewer comorbidities. Moreover, the 5-year relative survival rate for thyroid cancer remains > 98%.22 This rate is in contrast to those for other cancer types such as HCC, with a 5-year relative survival rate of only 15%.23
It is challenging to compare the mean and median times on therapy found in this study with those in current literature, as this review included multiple different cancer types for each agent. However, the numbers are generally lower than durations of therapy found across the different disease states and further emphasize the difficulty in tolerating MKIs in the VANTHCS population. Regorafenib had a short duration of time on therapy, which highlights the importance of trials like ReDOS and initiatives such as OCE Project Optimus in helping improve tolerance.7,8,24
Comparing our results with other studies proved challenging because the RDI calculation methods were not specified. Calculating RDIs in this study using method 1, which does not account for holds, resulted in higher RDIs (Appendix 2). Using method 1, all MKIs had RDIs < 85%, except for pazopanib in thyroid cancer (100%) and RCC (87.9%), and sunitinib in GIST (93.6%), thyroid cancer (100%), and neuroendocrine cancer (93.7%). Notably, using method 1 increased the RDI for pazopanib in neuroendocrine cancer from 5.4% to 50.0%. The low RDI was attributed to a single veteran with a long hold duration, which demonstrates the discrepancy that can occur between the 2 methods.
Limitations
The retrospective design, lack of survival outcomes, and difficulty comparing results with other literature were limitations of this study. Because survival outcomes were not evaluated, future research should seek to investigate how RDIs and dose adjustments made among MKIs can affect survival outcomes in real-world populations. This veteran population with cancer often had multiple chronic comorbidities, which may have contributed to difficulty tolerating MKIs and could have impacted results. Disease-related factors may have influenced the poor tolerance of the MKIs and were not specifically accounted for. Adjustment for comorbidities was not possible because of discrepancies and/or incomplete diagnosis codes and Eastern Cooperative Oncology Group performance status scores documented in patient charts. Therefore, we decided not to report these findings due to potential inaccuracies.
CONCLUSIONS
Results of this study demonstrate that oncology MKI agents used at VANTHCS were difficult for patients to tolerate, leading to suboptimal dosing compared with indicated doses established in clinical trials and prescribing information. Clinicians may use these data to help guide clinical decision-making whenever initiating and managing MKI agents in this population. These findings reinforce that MKI agents are often difficult to tolerate in real-world practice, and indicated doses are often not achieved. Further studies should aim to investigate the effect that various RDIs have on overall survival. Further investigation into different dosing schemes for MKIs to improve tolerability and longer-term use may also prove beneficial.
This analysis may help guide clinicians to carefully approach dosing MKI agents in the veteran population. Given the RDI and AEs, more clinicians may consider starting at lower than indicated doses with the goal to titrate up as tolerated. Additionally, the results highlight the importance of considering palliative care consults and ensuring appropriate supportive care agents are preemptively engaged and adjusted as needed. Approaching dosing and titrations cautiously may help reduce the burden of management on the health care system.
- Frequently asked questions. VA National Oncology Program. 2025. Accessed December 15, 2025. https://www.cancer.va.gov/CANCER/faqs.html
- Torez L. Reigniting the cancer moonshot to beat cancer. VA News. April 20, 2023. Accessed April 6, 2026. https://news.va.gov/118378/reigniting-the-cancer-moonshot-to-beat-cancer
- Shah NN, Casella E, Capozzi D, et al. Improving the safety of oral chemotherapy at an academic medical center. J Oncol Pract. 2016;12:e71-e76. doi:10.1200/JOP.2015.007260
- Hussaarts KGAM, Veerman GDM, Jansman FGA, et al. Clinically relevant drug interactions with multikinase inhibitors: a review. Ther Adv Med Oncol. 2019;11:1758835918818347. doi:10.1177/1758835918818347
- Shyam Sunder S, Sharma UC, Pokharel S. Adverse effects of tyrosine kinase inhibitors in cancer therapy: pathophysiology, mechanisms and clinical management. Signal Transduct Target Ther. 2023;8:262. doi:10.1038/s41392-023-01469-6
- Thomson RJ, Moshirfar M, Ronquillo Y. Tyrosine kinase inhibitors. In: StatPearls [Internet]. StatPearls Publishing; updated July 18, 2023. Accessed December 15, 2025. https://www.ncbi.nlm.nih.gov/books/NBK563322/
- Project Optimus. US Food and Drug Administration. Updated December 6, 2024. Accessed December 15, 2025. https://www.fda.gov/about-fda/oncology-center-excellence/project-optimus
- Optimizing the dosage of human prescription drugs and biological products for the treatment of oncologic diseases: Guidance for Industry. Docket number FDA-2022-D-2827. US Food and Drug Administration. August 2024. Accessed December 15, 2025. https://www.fda.gov/regulatory-information/search-fda-guidance-documents/optimizing-dosage-human-prescription-drugs-and-biological-products-treatment-oncologic-diseases
- Schnadig ID, Hutson TE, Chung H, et al. Dosing patterns, toxicity, and outcomes in patients treated with first-line sunitinib for advanced renal cell carcinoma in community-based practices. Clin Genitourin Cancer. 2014;12:413-421. doi:10.1016/j.clgc.2014.06.015
- Motzer RJ, Hutson TE, Tomczak P, et al. Sunitinib versus interferon alfa in metastatic renal-cell carcinoma. N Engl J Med. 2007;356:115-124. doi:10.1056/nejmoa065044
- Hawn C, Bansal D. Relative dose intensity in oncology trials: a discussion of two approaches. PharmaSUG. 2024. Accessed April 6, 2026. https://pharmasug.org/proceedings/2024/ST/PharmaSUG-2024-ST-297.pdf
- George S, Merriam P, Maki RG, et al. Multicenter phase II trial of sunitinib in the treatment of nongastrointestinal stromal tumor sarcomas. J Clin Oncol. 2009;27:3154-3160. doi:10.1200/jco.2008.20.9890
- George S, Blay JY, Casali PG, et al. Clinical evaluation of continuous daily dosing of sunitinib malate in patients with advanced gastrointestinal stromal tumour after imatinib failure. Eur J Cancer. 2009;45:1959-1968. doi:10.1016/j.ejca.2009.02.011
- Denduluri N, Patt DA, Wang Y, et al. Dose delays, dose reductions, and relative dose intensity in patients with cancer who received adjuvant or neoadjuvant chemotherapy in community oncology practices. J Natl Compr Canc Netw. 2015;13:1383-1393. doi:10.6004/jnccn.2015.0166
- Motzer RJ, Penkov K, Haanen J, et al. Avelumab plus axitinib versus sunitinib for advanced renal-cell carcinoma. N Engl J Med. 2019;380:1103-1115. doi:10.1056/nejmoa1816047
- Motzer R, Alekseev B, Rha SY, et al. Lenvatinib plus pembrolizumab or everolimus for advanced renal cell carcinoma. N Engl J Med. 2021;384:1289-1300. doi:10.1056/nejmoa2035716
- Kirino S, Tsuchiya K, Kurosaki M, et al. Relative dose intensity over the first four weeks of lenvatinib therapy is a factor of favorable response and overall survival in patients with unresectable hepatocellular carcinoma. PloS One. 2020;15:e0231828. doi:10.1371/journal.pone.0231828
- Ishihara H, Takagi T, Kondo T, et al. Decreased relative dose intensity during the early phase of treatment impacts the therapeutic efficacy of sunitinib in metastatic renal cell carcinoma. Jpn J Clin Oncol. 2018;48:667-672. doi:10.1093/jjco/hyy078
- Alghamdi MA, Amaro CP, Lee-Ying R, et al. Effect of sorafenib starting dose and dose intensity on survival in patients with hepatocellular carcinoma: results from a Canadian Multicenter Database. Cancer Med. 2020;9:4918-4928. doi:10.1002/cam4.3228
- Motzer RJ, Rini BI, Bukowski RM, et al. Sunitinib in patients with metastatic renal cell carcinoma. JAMA. 2006;295:2516-2524. doi:10.1001/jama.295.21.2516
- Miller AA, Murry DJ, Owzar K, et al. Phase I and pharmacokinetic study of sorafenib in patients with hepatic or renal dysfunction: CALGB 60301. J Clin Oncol. 2009;27:1800-1805. doi:10.1200/jco.2008.20.0931
- Boucai L, Zafereo M, Cabanillas ME. Thyroid cancer: a review. JAMA. 2024;331:425-435. doi:10.1001/jama.2023.26348
- Amin N, Anwar J, Sulaiman A, et al. Hepatocellular carcinoma: a comprehensive review. Diseases. 2025;13:207. doi:10.3390/diseases13070207
- Bekaii-Saab TS, Ou FS, Ahn DH, et al. Regorafenib dose-optimisation in patients with refractory metastatic colorectal cancer (ReDOS): a randomised, multicentre, open-label, phase 2 study. Lancet Oncol. 2019;20:1070-1082. doi:10.1016/s1470-2045(19)30272-4
Investigating Real-World Tolerance and Dose Reductions of Oncology Multikinase Inhibitors in a VA Population
Investigating Real-World Tolerance and Dose Reductions of Oncology Multikinase Inhibitors in a VA Population
Impact of VA Hematology/Oncology Clinical Pharmacy Practitioners in the Review of Community Prescriptions for Specialty Medications
The value of a hematology/oncology clinical pharmacy practitioner (CPP) has been validated in several studies documenting their positive impact on patient outcomes, supportive care management, laboratory monitoring, medication error identification, and drug expenditure.1-6 With> 200 oncology-related US Food and Drug Administration approval notifications published from 2020 to 2023, it is no surprise that national trends in oncology drug clinic expenditures increased from $39.9 billion in 2020 to $44.1 billion in 2021.7,8 With the rapidly changing treatment landscape, new drug approvals, and risk of polypharmacy, oral anticancer agents carry a high risk for medication errors.4 Additional challenges include complex dosing regimens and instructions, adherence issues, drug interactions, adjustments for organ dysfunction, and extensive adverse effect (AE) profiles.
Because of the niche and complexity of oral anticancer agents, trained CPPs havehematology/oncology education and expertise that pharmacists without specialized training lack. A survey of 243 nonspecialized community pharmacists that assessed their knowledge of oral anticancer therapies revealed that only about half of the knowledge questions were answered correctly, illustrating an education gap among these pharmacists.9 The Hematology/Oncology Pharmacist Association's suggests that best practices for managing oral oncology therapy should include comprehensive medication review by an oncology-trained pharmacist for each prescription.10
The US Department of Veterans Affairs (VA) community care network, which was established by the MISSION Act, allows covered access for eligible veterans in the local community outside of the VA network. Unfortunately, this dual-system use of health care could increase the risk of poorly coordinated care and has been associated with the risk of inappropriate prescribing.11,12 It is unclear how many private practices enrolled in the community care program have access to oncology-trained pharmacists. Specialized pharmaceutical reviews of oral anticancer medication prescriptions from these practices are vital for veteran care. This study evaluates the clinical and financial interventions of hematology/oncology CPPs review of specialty hematology/oncology prescriptions from community care health care practitioners (HCPs) at the Veterans Affairs North Texas Health Care System (VANTHCS) in Dallas.
METHODS
This study is a retrospective review of Computerized Patient Record System (CPRS) records of patients at VANTHCS from January 1, 2015, to June 30, 2023. Patients included were aged ≥ 18 years, enrolled in the VA community care program, received a specialty hematology/oncology medication that was dispensed through VA pharmacies or VA-contracted pharmacies, and had an hematology/oncology CPP medication review documented in CPRS. The primary aim of this study was to assess the number and types of clinical interventions performed. A clinical intervention was defined as a documented communication attempt with a community care HCP or direct communication with a patient to address a specific medication-related issue noted during CPP review.
Review of specialty hematology/oncology medications by a hematology/oncology CPP included evaluation of therapy indication, such as whether the prescription meets clinical guidelines, VA criteria for use, or other clinical literature as judged appropriate by the CPP. In some cases, the CPP requested that the community care HCP prescribe a more cost-effective or formulary-preferred agent. Each prescription was reviewed for dosage and formulation appropriateness, drug interactions with available medication lists, baseline laboratory test completion, and recommended supportive care medicines. At times, patient counseling is completed as part of the clinical review. When necessary, CPPs could discuss patient cases with a VA-employed oncologist for further oversight regarding appropriateness and safety. Secondary outcomes included the number of interventions accepted or denied by the prescriber provider and cost savings.
Data collected included the type of malignancy, hematology/oncology specialty medication requested, number and type of interventions sent to the community care prescriber, number of interventions accepted or denied by the community care prescriber, and whether the CPP conducted patient counseling or dispensed or denied the product. Cost savings were calculated for medications that were denied or changed to a formulary preferred or cost-effective agent using pricing data from the National Acquisition Center Contract Catalog or Federal Supply Schedule Service as of April 2024.
RESULTS
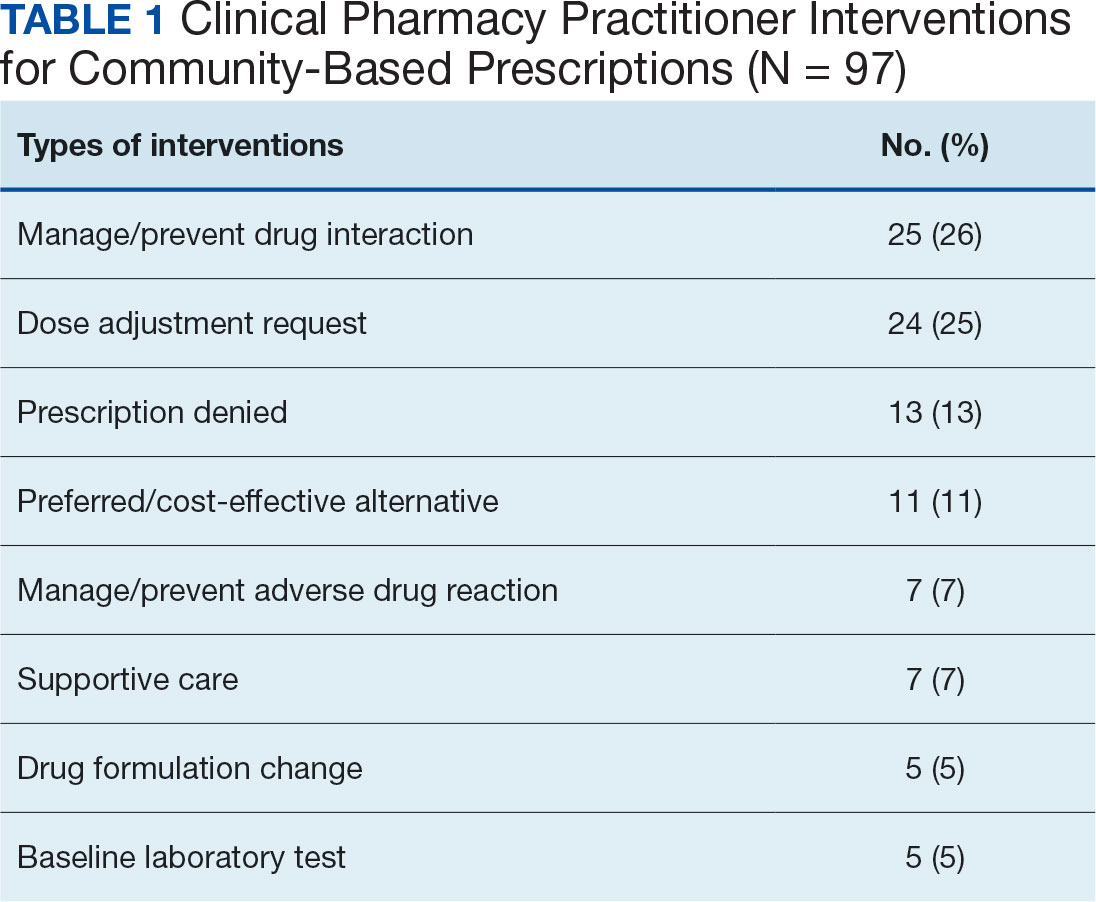
A total of 221 hematology/oncology prescriptions met inclusion criteria. Among patients receiving these prescriptions, the median age was 70 years and 91% were male. The most common malignancies included 31 instances of multiple myeloma (14%), 26 for chronic lymphocytic leukemia (12%), 24 for prostate cancer (11%), 23 for glioblastoma/brain cancer (10%), 18 for renal cell carcinoma (8%), 17 for colorectal cancer (8%), and 15 for acute myeloid leukemia (7%). Clinical interventions by the hematology/oncology CPP were completed for 82 (37%) of the 221 prescriptions. One clinical intervention was communicated directly to the patient, and attempts were made to communicate with the community care HCP for the remaining 81 prescriptions. The CPP documented 97 clinical interventions for the 82 prescriptions (Table 1). The most commonly documented clinical interventions included: 25 for managing/preventing a drug interaction (26%), 24 for dose adjustment request (25%), 13 for prescription denial (13%), and 11 for requesting the use of a preferred or more cost-effective product (11%). Of note, 16 patients (7%) received counseling from the hematology/oncology CPP. Ten patients (5%) received counseling alone with no other intervention and did not meet the definition of a clinical intervention.
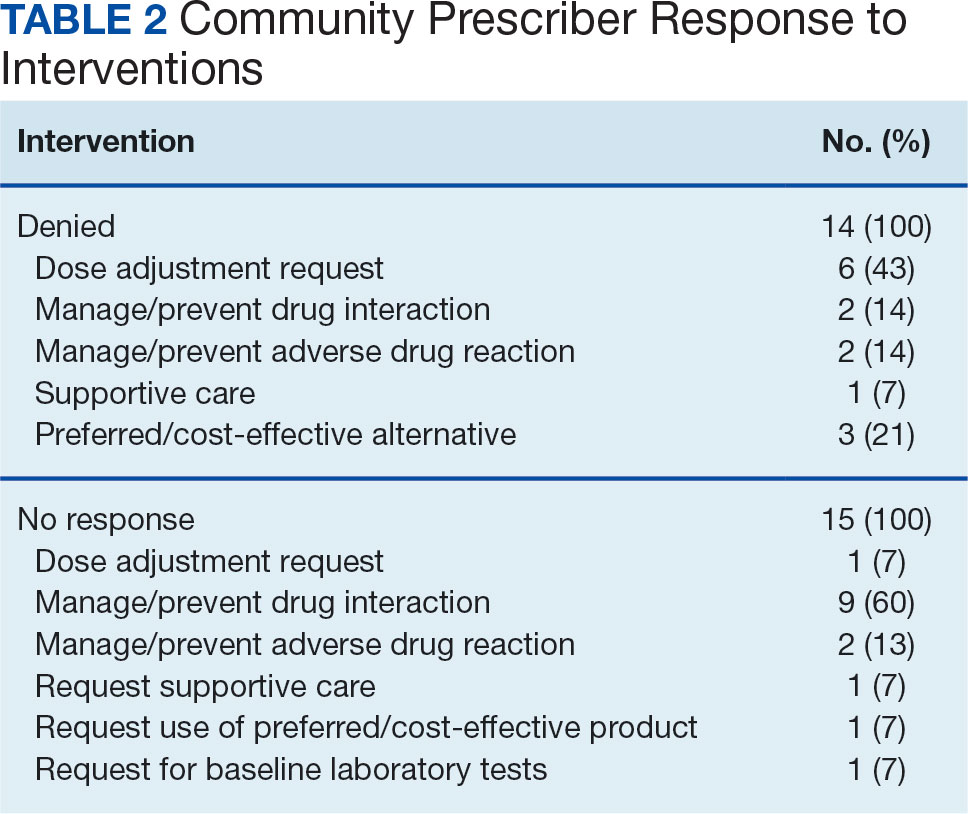
The most frequent prescriptions requiring intervention included 8 for enzalutamide, 7 for venetoclax, 6 for ibrutinib, and 5 each for lenalidomide, cabozantinib, and temozolomide. Among the 97 interventions, 68 were approved (70%), 15 received no response (16%), and 14 were denied by the community care HCP (14%). Despite obtaining no response or intervention denial from the community care HCP, hematology/oncology CPPs could approve these prescriptions if clinically appropriate, and their reasoning was documented. Table 2 further describes the types of interventions that were denied or obtained no response by the community care practitioner. Among the prescriptions denied by the hematology/oncology CPP, 11 were rejected for off-label indications and/or did not have support through primary literature, national guidelines, or VA criteria for use. Only 2 prescriptions were denied for safety concerns.
These documented clinical interventions had financial implications. For drugs with available cost data, requesting the use of a preferred/cost-effective product led to estimated savings of at least $263,536 over the study period with some ongoing cost savings. Prescription denials led to further estimated savings of $186,275 per month, although this is limited by the lack of known costs of alternative therapies the community care physicians chose.
DISCUSSION
More than one-third of prescriptions required clinical interventions, and 70% of these interventions were accepted by the community care prescriber, demonstrating the CPP’s essential role. Results indicate that most CPP clinical interventions involved clarifying and correcting doses, managing pertinent drug interactions, and ensuring appropriate use of medications according to clinical and national VA guidelines. Other studies have examined the impact of CPPs on patient care and cancer treatment.5,6 The randomized, multicenter AMBORA trial found that clinical pharmacist support reduced severe AEs and medication errors related to oral anticancer agents.5 The per-patient mean number of medication errors found by pharmacist review was 1.7 (range, 0 to 9), with most medication errors noted at the prescribing stage.5 Suzuki and colleagues analyzed data from 35,062 chemotherapy regimens and found that 53.1% of the chemotherapy prescriptions were modified because of pharmacist interventions.6 The most common reason for prescription modifications was prescription error.
Most of the clinical interventions in this study were accepted by community HCPs, indicating that these prescribers are receptive to hematology/oncology CPP input. Among those with no response, most were in relation to recommendations regarding drug interactions. In most of these cases, the drug interaction was not clinically concerning enough to require a response before the CPP approved the prescription. Therefore, it is unknown whether the outside HCP implemented the clinical recommendations. The most common types of clinical interventions the community care HCP declined were dose adjustment requests or requests to switch to a more cost-effective/formulary-preferred agent. In these cases, the prescriber’s preference was documented and, if clinically appropriate, approved by the CPP.
Although the financial implications of CPP clinical interventions were only marginally evaluated in this review, results suggest that cost savings by requests to switch to a cost-effective/formulary preferred agent or prescription denials are substantial. Because of changes in prescription costs over time, it is possible that savings from CPP intervention were greater than calculations using current Federal Supply Schedule Service pricing. The total impact of CPP prescription interventions on reducing or preventing hospitalizations or AEs is not known from this review, but other data suggest that cost savings may benefit the system.13,14
Limitations
This study's retrospective design is a limitation because practice patterns at the VANTHCS involving multiple hematology/oncology CPPs review of community care prescriptions might have evolved over time. The total financial implications of CPP interventions cannot fully be elucidated. The cost of alternative therapies used for patients who received a prescription denial is not factored into this review.
Conclusions
VANTHCS CPPs played an essential role in reviewing anticancer medication prescriptions from community care prescribers. In this study, CPP clinical interventions were completed for more than one-third of the prescriptions and the community-based HCP approved most of these interventions. These changes also resulted in financial benefits.
These findings add to the body of literature emphasizing the need for hematology/oncology-trained CPPs to review anticancer prescriptions and treatment plans. Our review could be used to justify CPP involvement in community care specialty medication review at VA facilities that do not currently have CPP involvement.
1. Shah NN, Casella E, Capozzi D, et al. Improving the safety of oral chemotherapy at an academic medical center. J Oncol Pract. 2016;12(1):e71-e76. doi:10.1200/JOP.2015.007260
2. Gatwood J, Gatwood K, Gabre E, Alexander M. Impact of clinical pharmacists in outpatient oncology practices: a review. Am J Health Syst Pharm. 2017;74(19):1549-1557. doi:10.2146/ajhp160475
3. Lankford C, Dura J, Tran A, et al. Effect of clinical pharmacist interventions on cost in an integrated health system specialty pharmacy. J Manag Care Spec Pharm. 2021;27(3):379-384. doi:10.18553/jmcp.2021.27.3.379
4. Schlichtig K, Dürr P, Dörje F, Fromm MF. Medication errors during treatment with new oral anticancer agents: consequences for clinical practice based on the AMBORA Study. Clin Pharmacol Ther. 2021;110(4):1075-1086. doi:10.1002/cpt.2338
5. Dürr P, Schlichtig K, Kelz C, et al. The randomized AMBORA Trial: impact of pharmacological/pharmaceutical care on medication safety and patient-reported outcomes during treatment with new oral anticancer agents. J Clin Oncol. 2021;39(18):1983-1994. doi:10.1200/JCO.20.03088
6. Suzuki S, Chan A, Nomura H, Johnson PE, Endo K, Saito S. Chemotherapy regimen checks performed by pharmacists contribute to safe administration of chemotherapy. J Oncol Pharm Pract. 2017;23(1):18-25. doi:10.1177/1078155215614998
7. Tichy EM, Hoffman JM, Suda KJ, et al. National trends in prescription drug expenditures and projections for 2022. Am J Health Syst Pharm. 2022;79(14):1158-1172. doi:10.1093/ajhp/zxac102
8. US Food and Drug Administration. Oncology (cancer)/hematologic malignancies approval notifications. 2023.
9. O’Bryant CL, Crandell BC. Community pharmacists’ knowledge of and attitudes toward oral chemotherapy. J Am Pharm Assoc (2003). 2008;48(5):632-639. doi:10.1331/JAPhA.2008.07082
10. Mackler E, Segal EM, Muluneh B, Jeffers K, Carmichael J. 2018 hematology/oncology pharmacist association best practices for the management of oral oncolytic therapy: pharmacy practice standard. J Oncol Pract. 2019;15(4):e346-e355. doi:10.1200/JOP.18.00581
11. Thorpe JM, Thorpe CT, Schleiden L, et al. Association between dual use of Department of Veterans Affairs and Medicare part D drug benefits and potentially unsafe prescribing. JAMA Intern Med. 2019;179(11):1584-1586. doi:10.1001/jamainternmed.2019.2788
12. Thorpe JM, Thorpe CT, Gellad WF, et al. Dual health care system use and high-risk prescribing in patients with dementia: a national cohort study. Ann Intern Med. 2017;166(3):157-163. doi:10.7326/M16-0551
13. Chen P-Z, Wu C-C, Huang C-F. Clinical and economic impact of clinical pharmacist intervention in a hematology unit. J Oncol Pharm Pract. 2020;26(4):866-872. doi:10.1177/1078155219875806
14. Dalton K, Byrne S. Role of the pharmacist in reducing healthcare costs: current insights. Integr Pharm Res Pract. 2017;6:37-46. doi:10.2147/IPRP.S108047
The value of a hematology/oncology clinical pharmacy practitioner (CPP) has been validated in several studies documenting their positive impact on patient outcomes, supportive care management, laboratory monitoring, medication error identification, and drug expenditure.1-6 With> 200 oncology-related US Food and Drug Administration approval notifications published from 2020 to 2023, it is no surprise that national trends in oncology drug clinic expenditures increased from $39.9 billion in 2020 to $44.1 billion in 2021.7,8 With the rapidly changing treatment landscape, new drug approvals, and risk of polypharmacy, oral anticancer agents carry a high risk for medication errors.4 Additional challenges include complex dosing regimens and instructions, adherence issues, drug interactions, adjustments for organ dysfunction, and extensive adverse effect (AE) profiles.
Because of the niche and complexity of oral anticancer agents, trained CPPs havehematology/oncology education and expertise that pharmacists without specialized training lack. A survey of 243 nonspecialized community pharmacists that assessed their knowledge of oral anticancer therapies revealed that only about half of the knowledge questions were answered correctly, illustrating an education gap among these pharmacists.9 The Hematology/Oncology Pharmacist Association's suggests that best practices for managing oral oncology therapy should include comprehensive medication review by an oncology-trained pharmacist for each prescription.10
The US Department of Veterans Affairs (VA) community care network, which was established by the MISSION Act, allows covered access for eligible veterans in the local community outside of the VA network. Unfortunately, this dual-system use of health care could increase the risk of poorly coordinated care and has been associated with the risk of inappropriate prescribing.11,12 It is unclear how many private practices enrolled in the community care program have access to oncology-trained pharmacists. Specialized pharmaceutical reviews of oral anticancer medication prescriptions from these practices are vital for veteran care. This study evaluates the clinical and financial interventions of hematology/oncology CPPs review of specialty hematology/oncology prescriptions from community care health care practitioners (HCPs) at the Veterans Affairs North Texas Health Care System (VANTHCS) in Dallas.
METHODS
This study is a retrospective review of Computerized Patient Record System (CPRS) records of patients at VANTHCS from January 1, 2015, to June 30, 2023. Patients included were aged ≥ 18 years, enrolled in the VA community care program, received a specialty hematology/oncology medication that was dispensed through VA pharmacies or VA-contracted pharmacies, and had an hematology/oncology CPP medication review documented in CPRS. The primary aim of this study was to assess the number and types of clinical interventions performed. A clinical intervention was defined as a documented communication attempt with a community care HCP or direct communication with a patient to address a specific medication-related issue noted during CPP review.
Review of specialty hematology/oncology medications by a hematology/oncology CPP included evaluation of therapy indication, such as whether the prescription meets clinical guidelines, VA criteria for use, or other clinical literature as judged appropriate by the CPP. In some cases, the CPP requested that the community care HCP prescribe a more cost-effective or formulary-preferred agent. Each prescription was reviewed for dosage and formulation appropriateness, drug interactions with available medication lists, baseline laboratory test completion, and recommended supportive care medicines. At times, patient counseling is completed as part of the clinical review. When necessary, CPPs could discuss patient cases with a VA-employed oncologist for further oversight regarding appropriateness and safety. Secondary outcomes included the number of interventions accepted or denied by the prescriber provider and cost savings.
Data collected included the type of malignancy, hematology/oncology specialty medication requested, number and type of interventions sent to the community care prescriber, number of interventions accepted or denied by the community care prescriber, and whether the CPP conducted patient counseling or dispensed or denied the product. Cost savings were calculated for medications that were denied or changed to a formulary preferred or cost-effective agent using pricing data from the National Acquisition Center Contract Catalog or Federal Supply Schedule Service as of April 2024.
RESULTS
A total of 221 hematology/oncology prescriptions met inclusion criteria. Among patients receiving these prescriptions, the median age was 70 years and 91% were male. The most common malignancies included 31 instances of multiple myeloma (14%), 26 for chronic lymphocytic leukemia (12%), 24 for prostate cancer (11%), 23 for glioblastoma/brain cancer (10%), 18 for renal cell carcinoma (8%), 17 for colorectal cancer (8%), and 15 for acute myeloid leukemia (7%). Clinical interventions by the hematology/oncology CPP were completed for 82 (37%) of the 221 prescriptions. One clinical intervention was communicated directly to the patient, and attempts were made to communicate with the community care HCP for the remaining 81 prescriptions. The CPP documented 97 clinical interventions for the 82 prescriptions (Table 1). The most commonly documented clinical interventions included: 25 for managing/preventing a drug interaction (26%), 24 for dose adjustment request (25%), 13 for prescription denial (13%), and 11 for requesting the use of a preferred or more cost-effective product (11%). Of note, 16 patients (7%) received counseling from the hematology/oncology CPP. Ten patients (5%) received counseling alone with no other intervention and did not meet the definition of a clinical intervention.
The most frequent prescriptions requiring intervention included 8 for enzalutamide, 7 for venetoclax, 6 for ibrutinib, and 5 each for lenalidomide, cabozantinib, and temozolomide. Among the 97 interventions, 68 were approved (70%), 15 received no response (16%), and 14 were denied by the community care HCP (14%). Despite obtaining no response or intervention denial from the community care HCP, hematology/oncology CPPs could approve these prescriptions if clinically appropriate, and their reasoning was documented. Table 2 further describes the types of interventions that were denied or obtained no response by the community care practitioner. Among the prescriptions denied by the hematology/oncology CPP, 11 were rejected for off-label indications and/or did not have support through primary literature, national guidelines, or VA criteria for use. Only 2 prescriptions were denied for safety concerns.
These documented clinical interventions had financial implications. For drugs with available cost data, requesting the use of a preferred/cost-effective product led to estimated savings of at least $263,536 over the study period with some ongoing cost savings. Prescription denials led to further estimated savings of $186,275 per month, although this is limited by the lack of known costs of alternative therapies the community care physicians chose.
DISCUSSION
More than one-third of prescriptions required clinical interventions, and 70% of these interventions were accepted by the community care prescriber, demonstrating the CPP’s essential role. Results indicate that most CPP clinical interventions involved clarifying and correcting doses, managing pertinent drug interactions, and ensuring appropriate use of medications according to clinical and national VA guidelines. Other studies have examined the impact of CPPs on patient care and cancer treatment.5,6 The randomized, multicenter AMBORA trial found that clinical pharmacist support reduced severe AEs and medication errors related to oral anticancer agents.5 The per-patient mean number of medication errors found by pharmacist review was 1.7 (range, 0 to 9), with most medication errors noted at the prescribing stage.5 Suzuki and colleagues analyzed data from 35,062 chemotherapy regimens and found that 53.1% of the chemotherapy prescriptions were modified because of pharmacist interventions.6 The most common reason for prescription modifications was prescription error.
Most of the clinical interventions in this study were accepted by community HCPs, indicating that these prescribers are receptive to hematology/oncology CPP input. Among those with no response, most were in relation to recommendations regarding drug interactions. In most of these cases, the drug interaction was not clinically concerning enough to require a response before the CPP approved the prescription. Therefore, it is unknown whether the outside HCP implemented the clinical recommendations. The most common types of clinical interventions the community care HCP declined were dose adjustment requests or requests to switch to a more cost-effective/formulary-preferred agent. In these cases, the prescriber’s preference was documented and, if clinically appropriate, approved by the CPP.
Although the financial implications of CPP clinical interventions were only marginally evaluated in this review, results suggest that cost savings by requests to switch to a cost-effective/formulary preferred agent or prescription denials are substantial. Because of changes in prescription costs over time, it is possible that savings from CPP intervention were greater than calculations using current Federal Supply Schedule Service pricing. The total impact of CPP prescription interventions on reducing or preventing hospitalizations or AEs is not known from this review, but other data suggest that cost savings may benefit the system.13,14
Limitations
This study's retrospective design is a limitation because practice patterns at the VANTHCS involving multiple hematology/oncology CPPs review of community care prescriptions might have evolved over time. The total financial implications of CPP interventions cannot fully be elucidated. The cost of alternative therapies used for patients who received a prescription denial is not factored into this review.
Conclusions
VANTHCS CPPs played an essential role in reviewing anticancer medication prescriptions from community care prescribers. In this study, CPP clinical interventions were completed for more than one-third of the prescriptions and the community-based HCP approved most of these interventions. These changes also resulted in financial benefits.
These findings add to the body of literature emphasizing the need for hematology/oncology-trained CPPs to review anticancer prescriptions and treatment plans. Our review could be used to justify CPP involvement in community care specialty medication review at VA facilities that do not currently have CPP involvement.
1. Shah NN, Casella E, Capozzi D, et al. Improving the safety of oral chemotherapy at an academic medical center. J Oncol Pract. 2016;12(1):e71-e76. doi:10.1200/JOP.2015.007260
2. Gatwood J, Gatwood K, Gabre E, Alexander M. Impact of clinical pharmacists in outpatient oncology practices: a review. Am J Health Syst Pharm. 2017;74(19):1549-1557. doi:10.2146/ajhp160475
3. Lankford C, Dura J, Tran A, et al. Effect of clinical pharmacist interventions on cost in an integrated health system specialty pharmacy. J Manag Care Spec Pharm. 2021;27(3):379-384. doi:10.18553/jmcp.2021.27.3.379
4. Schlichtig K, Dürr P, Dörje F, Fromm MF. Medication errors during treatment with new oral anticancer agents: consequences for clinical practice based on the AMBORA Study. Clin Pharmacol Ther. 2021;110(4):1075-1086. doi:10.1002/cpt.2338
5. Dürr P, Schlichtig K, Kelz C, et al. The randomized AMBORA Trial: impact of pharmacological/pharmaceutical care on medication safety and patient-reported outcomes during treatment with new oral anticancer agents. J Clin Oncol. 2021;39(18):1983-1994. doi:10.1200/JCO.20.03088
6. Suzuki S, Chan A, Nomura H, Johnson PE, Endo K, Saito S. Chemotherapy regimen checks performed by pharmacists contribute to safe administration of chemotherapy. J Oncol Pharm Pract. 2017;23(1):18-25. doi:10.1177/1078155215614998
7. Tichy EM, Hoffman JM, Suda KJ, et al. National trends in prescription drug expenditures and projections for 2022. Am J Health Syst Pharm. 2022;79(14):1158-1172. doi:10.1093/ajhp/zxac102
8. US Food and Drug Administration. Oncology (cancer)/hematologic malignancies approval notifications. 2023.
9. O’Bryant CL, Crandell BC. Community pharmacists’ knowledge of and attitudes toward oral chemotherapy. J Am Pharm Assoc (2003). 2008;48(5):632-639. doi:10.1331/JAPhA.2008.07082
10. Mackler E, Segal EM, Muluneh B, Jeffers K, Carmichael J. 2018 hematology/oncology pharmacist association best practices for the management of oral oncolytic therapy: pharmacy practice standard. J Oncol Pract. 2019;15(4):e346-e355. doi:10.1200/JOP.18.00581
11. Thorpe JM, Thorpe CT, Schleiden L, et al. Association between dual use of Department of Veterans Affairs and Medicare part D drug benefits and potentially unsafe prescribing. JAMA Intern Med. 2019;179(11):1584-1586. doi:10.1001/jamainternmed.2019.2788
12. Thorpe JM, Thorpe CT, Gellad WF, et al. Dual health care system use and high-risk prescribing in patients with dementia: a national cohort study. Ann Intern Med. 2017;166(3):157-163. doi:10.7326/M16-0551
13. Chen P-Z, Wu C-C, Huang C-F. Clinical and economic impact of clinical pharmacist intervention in a hematology unit. J Oncol Pharm Pract. 2020;26(4):866-872. doi:10.1177/1078155219875806
14. Dalton K, Byrne S. Role of the pharmacist in reducing healthcare costs: current insights. Integr Pharm Res Pract. 2017;6:37-46. doi:10.2147/IPRP.S108047
Anticoagulation Management Outcomes in Veterans: Office vs Telephone Visits
Oral anticoagulation with warfarin is used for the treatment and prevention of a variety of thrombotic disorders, including deep venous thrombosis (DVT), pulmonary embolism (PE), stroke prevention in atrial fibrillation (AF) and atrial flutter, and other hypercoagulable conditions. Although a mainstay in the treatment for these conditions, warfarin requires close monitoring due to its narrow therapeutic range, extensive drug and dietary interactions, and dosage variability among patients.1 Patients outside the therapeutic range are at risk of having a thrombotic or bleeding event that could lead to hospitalization or fatality.1 To reduce the risk of these events, patients on warfarin are managed by dose adjustment based on the international normalized ratio (INR). Research has shown that patients on warfarin in pharmacist-managed specialty anticoagulation clinics have more consistent monitoring and lower rates of adverse events (AEs) compared with traditional physician or nurse clinics.2-6 Management through these clinics can be achieved through office visits or telephone visits.
There are advantages and disadvantages to each model of anticoagulation management for patients.Telephone clinics provide time and cost savings, increased access to care, and convenience. However, disadvantages include missed phone calls or inability to contact the patient, difficulty for the patient to hear the provider’s instructions over the phone, and patient unavailability when a critical INR is of concern. Office visits are beneficial in that providers can provide both written and verbal instruction to patients, perform visual or physical patient assessments, and provide timely care if needed. Disadvantages of office visits may include long wait times and inconvenience for patients who live far away.
Telephone anticoagulation clinics have been evaluated for their efficacy and cost-effectiveness in several studies.5,7,8 However, few studies are available that compare patient outcomes between office visits and telephone visits. Two prior studies comparing groups of anticoagulation patients managed by telephone or by office visit concluded that there is no difference in outcomes between the 2 management models.9,10 However, a retrospective study by Stoudenmire and colleagues examined extreme INR values (≤ 1.5 or ≥ 4.5) in each management model and found that telephone clinic patients have a significant increase in extreme INR values but no difference in AEs between the 2 management models.11
The VA North Texas Health Care System (VANTHCS) includes a major medical center, 3 outlying medical facilities, and 5 community-based outpatient clinics (CBOCs). A centralized pharmacist-managed anticoagulation clinic is used to manage more than 2,500 VANTHCS anticoagulation patients. To meet the National Patient Safety Goal measures and provide consistent management across the system, all anticoagulation patients from CBOCs and medical facilities are enrolled in the clinic.12 To facilitate access to care, many patients transitioned from office visits to telephone visits. It was essential to evaluate the transition of patients from office to telephone visits to ensure continued stability and continuity of care across both models. The objective of this study was to determine whether a difference in anticoagulation outcomes exists when patients are transitioned from office to telephone visits.
Methods
The VANTHCS anticoagulation clinic policy for office visits requires that patients arrive at the Dallas VAMC 2 hours before their appointment for INR lab draw. During the office visit, the anticoagulation pharmacist evaluates the INR and pertinent changes since the previous visit. The patient is provided verbal instructions and a written dosage adjustment card. Telephone clinic protocol is similar to office visits with a few exceptions. Any patient, regardless of INR stability, may be enrolled in the telephone clinic as long as the patient provides consent and has a working telephone with voice mail. Patients enrolled in the telephone clinic access blood draws at the nearest VA facility and are given a questionnaire that includes pertinent questions asked during an office visit. Anticoagulation pharmacists evaluate the questionnaire and INR then contact the patient within 1 business day to provide the patient with instructions. If a patient fails to answer the telephone, the anticoagulation pharmacist leaves a voicemail message.
Study Design
This retrospective study was conducted by chart review using Computerized Patient Record System (CPRS) at VANTHCS on patients who met inclusion criteria between January 1, 2011 and May 31, 2014, and it was approved by the institutional review board and research and development committee. The study included patients aged ≥ 18 years on warfarin therapy managed by the VANTHCS anticoagulation clinic who were previously managed in office visits for ≥ 180 days before the telephone transition, then in telephone visits for another ≥ 180 days. Only INR values obtained through the VANTHCS anticoagulation clinic were assessed.
Patients were excluded from the study if they were not managed by the VANTHCS anticoagulation clinic or received direct oral anticoagulants (DOACs). The INR values were excluded if they were nonclinic related INR values (ie, results reported that do not reflect management by the anticoagulation clinic), the first INR after hospitalization, or INRs obtained during the first month of initial warfarin treatment for a patient.
For all patients included in the study, demographic information, goal INR range (2 to 3 or 2.5 to 3.5), indication for warfarin therapy, and duration of warfarin therapy (defined as the first prescription filled for warfarin at the VA) were obtained. Individual INR values were obtained for each patient during the period of investigation and type of visit (office or telephone) for each INR drawn was specified. Any major bleeding or thrombotic events (bleed requiring an emergency department [ED] visit, hospitalization, vitamin K administration, blood transfusion, and/or warfarin therapy hold/discontinuation) were documented. Procedures and number of hospitalizations also during the investigation were recorded.
The primary outcomes measures evaluated INRs for time in therapeutic range (TTR) using the Rosendaal method and percentage of INRs within range.13 The therapeutic range was either 2 to 3 or 2.5 to 3.5 (the “strict range” for INR management). Because many patients fluctuate around the strict range and it is common to avoid therapy adjustment based on slightly elevated or lower values, a “nonstrict” range (1.8 to 3.2 or 2.3 to 3.7) also was evaluated.14 The secondary outcomes examined differences between the 2 management models in rates of major AEs, including thrombosis and major bleeding events as defined earlier.Frequencies, percentages, and other descriptive statistics were used to describe nominal data. A paired t test was used to compare TTR of patients transitioned from office to telephone visits. A P value of < .05 was used for statistical significance.
Results
A total of 111 patients met inclusion criteria (Table 1). Most patients were elderly males with AF or atrial flutter as their primary indication for warfarin therapy. No statistically significant difference was found for percentage INRs in strict range (56.8% in office vs 56.9% in telephone, P = .98) or TTR (65.9% in office vs 62.72% in telephone, P = .23) for patients who transitioned from office to telephone visits (Table 2). Similar results were found within the nonstrict range. 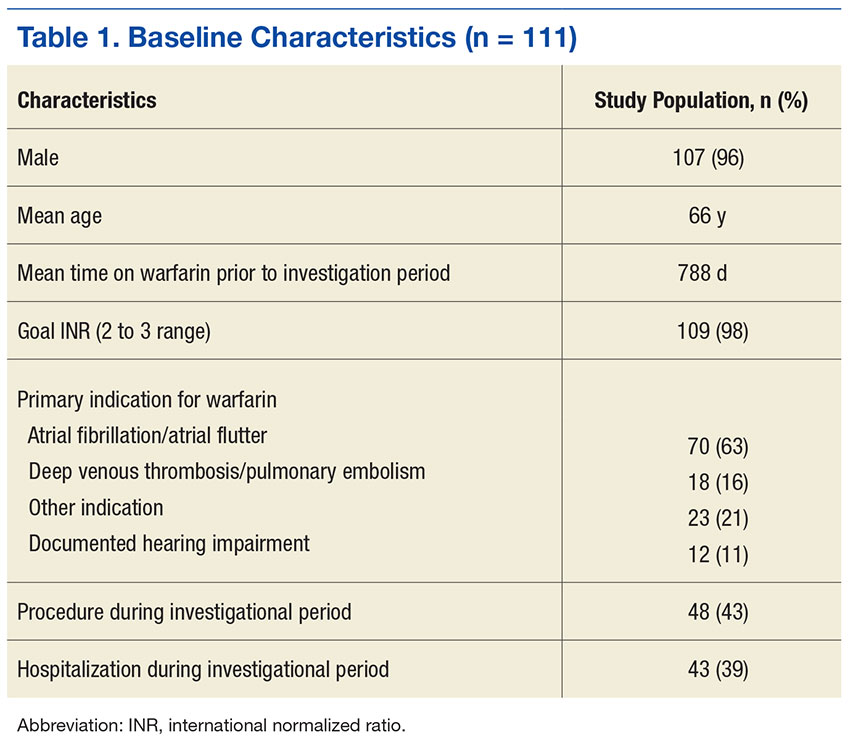
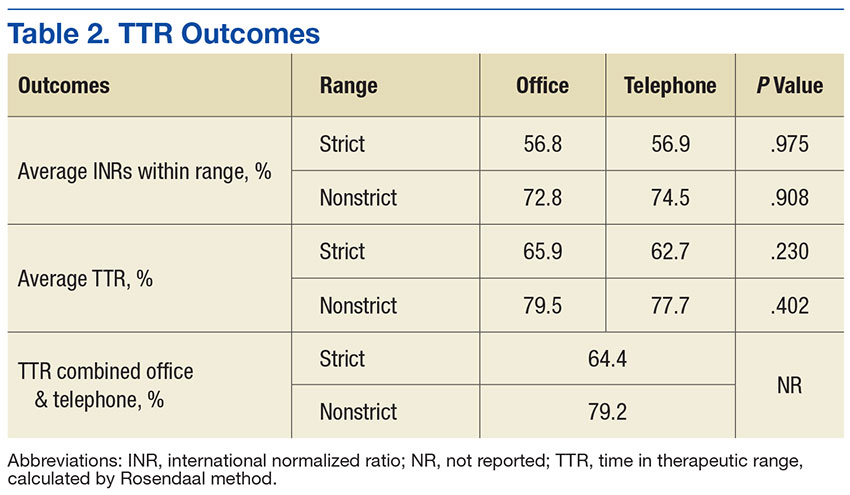
In examining safety, 5 major AEs occurred. One patient had 2 thrombotic pulmonary embolism events. This patient had a history of nonadherence with warfarin therapy. Three major bleeding events occurred (2 in the telephone group and 1 in the office group). Two bleeding events led to ED visits, and 1 event led to hospitalization. Although 43% of patients had a procedure during the study period, only a portion of patients received bridging with low-molecular-weight heparin (LMWH). None of the 3 reported bleeding events discovered during the study were associated with recent LMWH use. No events were fatal (Table 3).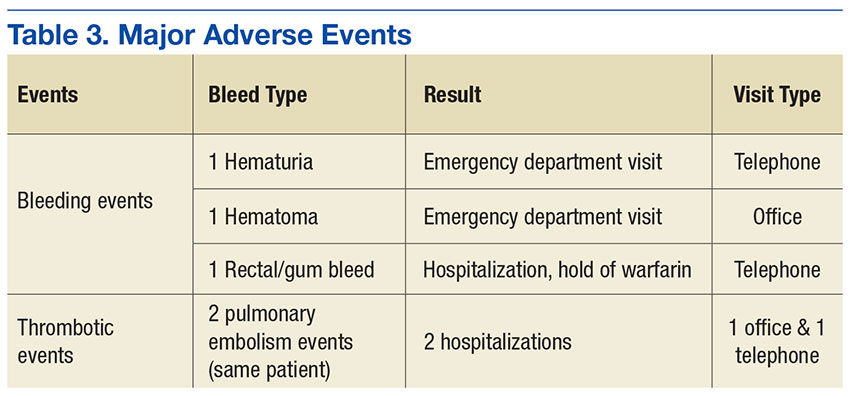
Discussion
This study demonstrates that patients transitioned from office to telephone visits for warfarin management will have no significant change in their TTR. Additionally, patients had similar rates of major AEs before and after transition, although there were few events overall.
Previous research comparing anticoagulation outcomes in telephone vs office visits also has described outcomes to be similar between these 2 management models. Wittkowsky and colleagues examined 2 university-affiliated clinics to evaluate warfarin outcomes and AEs in patients in each management model (office vs telephone) and found no difference in outcomes between the 2 management models.9
Staresinic and colleagues designed a prospective study of 192 patients to evaluate TTR and AEs of the 2 management models at the William S. Middleton Memorial Veterans Hospital in Madison, Wisconsin.10 This study found no difference between the 2 groups in percentage of time maintained within INR range or AEs and concluded that the telephone model was effective for anticoagulant management.
A retrospective study by Stoudenmire and colleagues evaluated office vs telephone management effects on extreme INR values (≤ 1.5 or ≥ 4.5), TTR, and AEs.11 This study found overall TTR and AEs to be similar between groups, but the telephone clinic had a 2-fold increase in extreme INR values compared with the office clinic.11
The current study differs from the previously discussed studies in that it evaluated outcomes for the same patients before and after the transition to telephone. This study did not exclude specific patients from telephone clinic. In the Wittkowsky study, patients were enrolled in the telephone clinic based on criteria such as patient disability or living long distances from the clinic.9 Additionally, in the current study, patients transitioned to telephone visits did not have scheduled office visits for anticoagulation management. In contrast, patients in the Staresinic study had routine anticoagulation office visits every 3 months, thus it was not a true telephone-only clinic.10
This study’s findings support prior studies’ findings that telephone clinics are acceptable for anticoagulation management. Furthermore, safety does not seem to be affected when transitioning patients, although there were few AEs to review. Providers can use telephone clinics to potentially decrease cost and facilitate access to care for patients.
Limitations
Patients were required to be in office and telephone for a sequential 6 months, and this may have produced selection biases toward patients who adhered to appointments and who were on long-term warfarin therapy. Many patients that were excluded from the study transitioned back and forth between the 2 management models. Due to the retrospective nature of this study, the authors were unable to control for all confounding variables. Patients also were not randomly assigned to be transitioned from office to telephone. Although a strength of this study was the limited telephone clinic selection criteria, there may be a few individual situations in which the pharmacist’s clinical judgment influenced the transition to the telephone clinic, creating selection bias.
There may be time bias present as clinical guidelines, providers, and clinic population size differed over the study period and might have influenced management. The population of VA patients was mainly elderly males; therefore, the study results may not be applicable to other populations. Last, the results of the study are reflective of the VANTHCS clinic structure and may not be applicable to other clinic designs.
Conclusion
Veterans in a pharmacist-managed anticoagulation clinic experienced the same outcomes in terms of TTR and major AEs when transitioned from the traditional face-to-face office visits to telephone visits. The study supports the safety and efficacy of transitioning patients from a pharmacist-managed anticoagulation office clinic to telephone clinic.
1. Ansell J, Hirsh J, Hylek E, Jacobson A, Crowther M, Palareti G; American College of Chest Physicians. Pharmacology and management of the vitamin K antagonists: American College of Chest Physicians evidence-based clinical practice guidelines (8th edition). Chest. 2008;133(suppl 6):160S-198S.
2. Rudd KM, Dier JG. Comparison of two different models of anticoagulation management services with usual medical care. Pharmacotherapy. 2010;30(4):330-338.
3. Bungard TJ, Gardner L, Archer SL, et al. Evaluation of a pharmacist-managed anticoagulation clinic: improving patient care. Open Med. 2009;3(1):e16-e21.
4. Chiquette E, Amato MG, Bussey HI. Comparison of an anticoagulation clinic with usual medical care: anticoagulation control, patient outcomes, and health care costs. Arch Intern Med. 1998;158(15):1641-1647.
5. Waterman AD, Banet G, Milligan PE, et al. Patient and physician satisfaction with a telephone-based anticoagulation service. J Gen Intern Med. 2001;16(7):460-463.
6. Hasan SS, Shamala R, Syed IA, et al. Factors affecting warfarin-related knowledge and INR control of patients attending physician- and pharmacist-managed anticoagulation clinics. J Pharm Pract. 2011;24(5):485-493.
7. Hassan S, Naboush A, Radbel J, et al. Telephone-based anticoagulation management in the homebound setting: a retrospective observational study. Int J Gen Med. 2013;6:869-875.
8. Moherman LJ, Kolar MM. Complication rates for a telephone-based anticoagulation service. Am J Health Syst Pharm. 1999;56(15):1540-1542.
9. Wittkowsky AK, Nutescu EA, Blackburn J, et al. Outcomes of oral anticoagulant therapy managed by telephone vs in-office visits in an anticoagulation clinic setting. Chest. 2006;130(5):1385-1389.
10. Staresinic AG, Sorkness CA, Goodman BM, Pigarelli DW. Comparison of outcomes using 2 delivery models of anticoagulation care. Arch Intern Med. 2006;166(9):997-1002.
11. Stoudenmire LG, DeRemer CE, Elewa H. Telephone versus office-based management of warfarin: impact on international normalized ratios and outcomes. Int J Hematol. 2014;100(2):119-124.
12. The Joint Commission. National Patient Safety Goals Effective January 1, 2015. http://www.jointcommission.org/assets/1/6/2015_NPSG_AHC1.PDF. Published 2014. Accessed November 23, 2016.
13. Rosendaal FR, Cannegieter SC, van der Meer FJ, Briët E. A method to determine the optimal intensity of oral anticoagulant therapy. Thromb Haemost. 1993;69(3):236-239.
14. Guyatt GH, Akl EA, Crowther M, Gutterman DD, Schuünemann HJ; American College of Chest Physicians Antithrombotic Therapy and Prevention of Thrombosis Panel. Executive summary: antithrombotic therapy and prevention of thrombosis, 9th ed: American College of Chest Physicians evidence-based clinical practice guidelines. Chest. 2012;141(suppl 2):7S-47S.
Oral anticoagulation with warfarin is used for the treatment and prevention of a variety of thrombotic disorders, including deep venous thrombosis (DVT), pulmonary embolism (PE), stroke prevention in atrial fibrillation (AF) and atrial flutter, and other hypercoagulable conditions. Although a mainstay in the treatment for these conditions, warfarin requires close monitoring due to its narrow therapeutic range, extensive drug and dietary interactions, and dosage variability among patients.1 Patients outside the therapeutic range are at risk of having a thrombotic or bleeding event that could lead to hospitalization or fatality.1 To reduce the risk of these events, patients on warfarin are managed by dose adjustment based on the international normalized ratio (INR). Research has shown that patients on warfarin in pharmacist-managed specialty anticoagulation clinics have more consistent monitoring and lower rates of adverse events (AEs) compared with traditional physician or nurse clinics.2-6 Management through these clinics can be achieved through office visits or telephone visits.
There are advantages and disadvantages to each model of anticoagulation management for patients.Telephone clinics provide time and cost savings, increased access to care, and convenience. However, disadvantages include missed phone calls or inability to contact the patient, difficulty for the patient to hear the provider’s instructions over the phone, and patient unavailability when a critical INR is of concern. Office visits are beneficial in that providers can provide both written and verbal instruction to patients, perform visual or physical patient assessments, and provide timely care if needed. Disadvantages of office visits may include long wait times and inconvenience for patients who live far away.
Telephone anticoagulation clinics have been evaluated for their efficacy and cost-effectiveness in several studies.5,7,8 However, few studies are available that compare patient outcomes between office visits and telephone visits. Two prior studies comparing groups of anticoagulation patients managed by telephone or by office visit concluded that there is no difference in outcomes between the 2 management models.9,10 However, a retrospective study by Stoudenmire and colleagues examined extreme INR values (≤ 1.5 or ≥ 4.5) in each management model and found that telephone clinic patients have a significant increase in extreme INR values but no difference in AEs between the 2 management models.11
The VA North Texas Health Care System (VANTHCS) includes a major medical center, 3 outlying medical facilities, and 5 community-based outpatient clinics (CBOCs). A centralized pharmacist-managed anticoagulation clinic is used to manage more than 2,500 VANTHCS anticoagulation patients. To meet the National Patient Safety Goal measures and provide consistent management across the system, all anticoagulation patients from CBOCs and medical facilities are enrolled in the clinic.12 To facilitate access to care, many patients transitioned from office visits to telephone visits. It was essential to evaluate the transition of patients from office to telephone visits to ensure continued stability and continuity of care across both models. The objective of this study was to determine whether a difference in anticoagulation outcomes exists when patients are transitioned from office to telephone visits.
Methods
The VANTHCS anticoagulation clinic policy for office visits requires that patients arrive at the Dallas VAMC 2 hours before their appointment for INR lab draw. During the office visit, the anticoagulation pharmacist evaluates the INR and pertinent changes since the previous visit. The patient is provided verbal instructions and a written dosage adjustment card. Telephone clinic protocol is similar to office visits with a few exceptions. Any patient, regardless of INR stability, may be enrolled in the telephone clinic as long as the patient provides consent and has a working telephone with voice mail. Patients enrolled in the telephone clinic access blood draws at the nearest VA facility and are given a questionnaire that includes pertinent questions asked during an office visit. Anticoagulation pharmacists evaluate the questionnaire and INR then contact the patient within 1 business day to provide the patient with instructions. If a patient fails to answer the telephone, the anticoagulation pharmacist leaves a voicemail message.
Study Design
This retrospective study was conducted by chart review using Computerized Patient Record System (CPRS) at VANTHCS on patients who met inclusion criteria between January 1, 2011 and May 31, 2014, and it was approved by the institutional review board and research and development committee. The study included patients aged ≥ 18 years on warfarin therapy managed by the VANTHCS anticoagulation clinic who were previously managed in office visits for ≥ 180 days before the telephone transition, then in telephone visits for another ≥ 180 days. Only INR values obtained through the VANTHCS anticoagulation clinic were assessed.
Patients were excluded from the study if they were not managed by the VANTHCS anticoagulation clinic or received direct oral anticoagulants (DOACs). The INR values were excluded if they were nonclinic related INR values (ie, results reported that do not reflect management by the anticoagulation clinic), the first INR after hospitalization, or INRs obtained during the first month of initial warfarin treatment for a patient.
For all patients included in the study, demographic information, goal INR range (2 to 3 or 2.5 to 3.5), indication for warfarin therapy, and duration of warfarin therapy (defined as the first prescription filled for warfarin at the VA) were obtained. Individual INR values were obtained for each patient during the period of investigation and type of visit (office or telephone) for each INR drawn was specified. Any major bleeding or thrombotic events (bleed requiring an emergency department [ED] visit, hospitalization, vitamin K administration, blood transfusion, and/or warfarin therapy hold/discontinuation) were documented. Procedures and number of hospitalizations also during the investigation were recorded.
The primary outcomes measures evaluated INRs for time in therapeutic range (TTR) using the Rosendaal method and percentage of INRs within range.13 The therapeutic range was either 2 to 3 or 2.5 to 3.5 (the “strict range” for INR management). Because many patients fluctuate around the strict range and it is common to avoid therapy adjustment based on slightly elevated or lower values, a “nonstrict” range (1.8 to 3.2 or 2.3 to 3.7) also was evaluated.14 The secondary outcomes examined differences between the 2 management models in rates of major AEs, including thrombosis and major bleeding events as defined earlier.Frequencies, percentages, and other descriptive statistics were used to describe nominal data. A paired t test was used to compare TTR of patients transitioned from office to telephone visits. A P value of < .05 was used for statistical significance.
Results
A total of 111 patients met inclusion criteria (Table 1). Most patients were elderly males with AF or atrial flutter as their primary indication for warfarin therapy. No statistically significant difference was found for percentage INRs in strict range (56.8% in office vs 56.9% in telephone, P = .98) or TTR (65.9% in office vs 62.72% in telephone, P = .23) for patients who transitioned from office to telephone visits (Table 2). Similar results were found within the nonstrict range.
In examining safety, 5 major AEs occurred. One patient had 2 thrombotic pulmonary embolism events. This patient had a history of nonadherence with warfarin therapy. Three major bleeding events occurred (2 in the telephone group and 1 in the office group). Two bleeding events led to ED visits, and 1 event led to hospitalization. Although 43% of patients had a procedure during the study period, only a portion of patients received bridging with low-molecular-weight heparin (LMWH). None of the 3 reported bleeding events discovered during the study were associated with recent LMWH use. No events were fatal (Table 3).
Discussion
This study demonstrates that patients transitioned from office to telephone visits for warfarin management will have no significant change in their TTR. Additionally, patients had similar rates of major AEs before and after transition, although there were few events overall.
Previous research comparing anticoagulation outcomes in telephone vs office visits also has described outcomes to be similar between these 2 management models. Wittkowsky and colleagues examined 2 university-affiliated clinics to evaluate warfarin outcomes and AEs in patients in each management model (office vs telephone) and found no difference in outcomes between the 2 management models.9
Staresinic and colleagues designed a prospective study of 192 patients to evaluate TTR and AEs of the 2 management models at the William S. Middleton Memorial Veterans Hospital in Madison, Wisconsin.10 This study found no difference between the 2 groups in percentage of time maintained within INR range or AEs and concluded that the telephone model was effective for anticoagulant management.
A retrospective study by Stoudenmire and colleagues evaluated office vs telephone management effects on extreme INR values (≤ 1.5 or ≥ 4.5), TTR, and AEs.11 This study found overall TTR and AEs to be similar between groups, but the telephone clinic had a 2-fold increase in extreme INR values compared with the office clinic.11
The current study differs from the previously discussed studies in that it evaluated outcomes for the same patients before and after the transition to telephone. This study did not exclude specific patients from telephone clinic. In the Wittkowsky study, patients were enrolled in the telephone clinic based on criteria such as patient disability or living long distances from the clinic.9 Additionally, in the current study, patients transitioned to telephone visits did not have scheduled office visits for anticoagulation management. In contrast, patients in the Staresinic study had routine anticoagulation office visits every 3 months, thus it was not a true telephone-only clinic.10
This study’s findings support prior studies’ findings that telephone clinics are acceptable for anticoagulation management. Furthermore, safety does not seem to be affected when transitioning patients, although there were few AEs to review. Providers can use telephone clinics to potentially decrease cost and facilitate access to care for patients.
Limitations
Patients were required to be in office and telephone for a sequential 6 months, and this may have produced selection biases toward patients who adhered to appointments and who were on long-term warfarin therapy. Many patients that were excluded from the study transitioned back and forth between the 2 management models. Due to the retrospective nature of this study, the authors were unable to control for all confounding variables. Patients also were not randomly assigned to be transitioned from office to telephone. Although a strength of this study was the limited telephone clinic selection criteria, there may be a few individual situations in which the pharmacist’s clinical judgment influenced the transition to the telephone clinic, creating selection bias.
There may be time bias present as clinical guidelines, providers, and clinic population size differed over the study period and might have influenced management. The population of VA patients was mainly elderly males; therefore, the study results may not be applicable to other populations. Last, the results of the study are reflective of the VANTHCS clinic structure and may not be applicable to other clinic designs.
Conclusion
Veterans in a pharmacist-managed anticoagulation clinic experienced the same outcomes in terms of TTR and major AEs when transitioned from the traditional face-to-face office visits to telephone visits. The study supports the safety and efficacy of transitioning patients from a pharmacist-managed anticoagulation office clinic to telephone clinic.
1. Ansell J, Hirsh J, Hylek E, Jacobson A, Crowther M, Palareti G; American College of Chest Physicians. Pharmacology and management of the vitamin K antagonists: American College of Chest Physicians evidence-based clinical practice guidelines (8th edition). Chest. 2008;133(suppl 6):160S-198S.
2. Rudd KM, Dier JG. Comparison of two different models of anticoagulation management services with usual medical care. Pharmacotherapy. 2010;30(4):330-338.
3. Bungard TJ, Gardner L, Archer SL, et al. Evaluation of a pharmacist-managed anticoagulation clinic: improving patient care. Open Med. 2009;3(1):e16-e21.
4. Chiquette E, Amato MG, Bussey HI. Comparison of an anticoagulation clinic with usual medical care: anticoagulation control, patient outcomes, and health care costs. Arch Intern Med. 1998;158(15):1641-1647.
5. Waterman AD, Banet G, Milligan PE, et al. Patient and physician satisfaction with a telephone-based anticoagulation service. J Gen Intern Med. 2001;16(7):460-463.
6. Hasan SS, Shamala R, Syed IA, et al. Factors affecting warfarin-related knowledge and INR control of patients attending physician- and pharmacist-managed anticoagulation clinics. J Pharm Pract. 2011;24(5):485-493.
7. Hassan S, Naboush A, Radbel J, et al. Telephone-based anticoagulation management in the homebound setting: a retrospective observational study. Int J Gen Med. 2013;6:869-875.
8. Moherman LJ, Kolar MM. Complication rates for a telephone-based anticoagulation service. Am J Health Syst Pharm. 1999;56(15):1540-1542.
9. Wittkowsky AK, Nutescu EA, Blackburn J, et al. Outcomes of oral anticoagulant therapy managed by telephone vs in-office visits in an anticoagulation clinic setting. Chest. 2006;130(5):1385-1389.
10. Staresinic AG, Sorkness CA, Goodman BM, Pigarelli DW. Comparison of outcomes using 2 delivery models of anticoagulation care. Arch Intern Med. 2006;166(9):997-1002.
11. Stoudenmire LG, DeRemer CE, Elewa H. Telephone versus office-based management of warfarin: impact on international normalized ratios and outcomes. Int J Hematol. 2014;100(2):119-124.
12. The Joint Commission. National Patient Safety Goals Effective January 1, 2015. http://www.jointcommission.org/assets/1/6/2015_NPSG_AHC1.PDF. Published 2014. Accessed November 23, 2016.
13. Rosendaal FR, Cannegieter SC, van der Meer FJ, Briët E. A method to determine the optimal intensity of oral anticoagulant therapy. Thromb Haemost. 1993;69(3):236-239.
14. Guyatt GH, Akl EA, Crowther M, Gutterman DD, Schuünemann HJ; American College of Chest Physicians Antithrombotic Therapy and Prevention of Thrombosis Panel. Executive summary: antithrombotic therapy and prevention of thrombosis, 9th ed: American College of Chest Physicians evidence-based clinical practice guidelines. Chest. 2012;141(suppl 2):7S-47S.