User login
Top DEI Topics to Incorporate Into Dermatology Residency Training: An Electronic Delphi Consensus Study
Diversity, equity, and inclusion (DEI) programs seek to improve dermatologic education and clinical care for an increasingly diverse patient population as well as to recruit and sustain a physician workforce that reflects the diversity of the patients they serve.1,2 In dermatology, only 4.2% and 3.0% of practicing dermatologists self-identify as being of Hispanic and African American ethnicity, respectively, compared with 18.5% and 13.4% of the general population, respectively.3 Creating an educational system that works to meet the goals of DEI is essential to improve health outcomes and address disparities. The lack of robust DEI-related curricula during residency training may limit the ability of practicing dermatologists to provide comprehensive and culturally sensitive care. It has been shown that racial concordance between patients and physicians has a positive impact on patient satisfaction by fostering a trusting patient-physician relationship.4
It is the responsibility of all dermatologists to create an environment where patients from any background can feel comfortable, which can be cultivated by establishing patient-centered communication and cultural humility.5 These skills can be strengthened via the implementation of DEI-related curricula during residency training. Augmenting exposure of these topics during training can optimize the delivery of dermatologic care by providing residents with the tools and confidence needed to care for patients of culturally diverse backgrounds. Enhancing DEI education is crucial to not only improve the recognition and treatment of dermatologic conditions in all skin and hair types but also to minimize misconceptions, stigma, health disparities, and discrimination faced by historically marginalized communities. Creating a culture of inclusion is of paramount importance to build successful relationships with patients and colleagues of culturally diverse backgrounds.6
There are multiple efforts underway to increase DEI education across the field of dermatology, including the development of DEI task forces in professional organizations and societies that serve to expand DEI-related research, mentorship, and education. The American Academy of Dermatology has been leading efforts to create a curriculum focused on skin of color, particularly addressing inadequate educational training on how dermatologic conditions manifest in this population.7 The Skin of Color Society has similar efforts underway and is developing a speakers bureau to give leading experts a platform to lecture dermatology trainees as well as patient and community audiences on various topics in skin of color.8 These are just 2 of many professional dermatology organizations that are advocating for expanded education on DEI; however, consistently integrating DEI-related topics into dermatology residency training curricula remains a gap in pedagogy. To identify the DEI-related topics of greatest relevance to the dermatology resident curricula, we implemented a modified electronic Delphi (e-Delphi) consensus process to provide standardized recommendations.
Methods
A 2-round modified e-Delphi method was utilized (Figure). An initial list of potential curricular topics was formulated by an expert panel consisting of 5 dermatologists from the Association of Professors of Dermatology DEI subcommittee and the American Academy of Dermatology Diversity Task Force (A.M.A., S.B., R.V., S.D.W., J.I.S.). Initial topics were selected via several meetings among the panel members to discuss existing DEI concerns and issues that were deemed relevant due to education gaps in residency training. The list of topics was further expanded with recommendations obtained via an email sent to dermatology program directors on the Association of Professors of Dermatology listserve, which solicited voluntary participation of academic dermatologists, including program directors and dermatology residents.
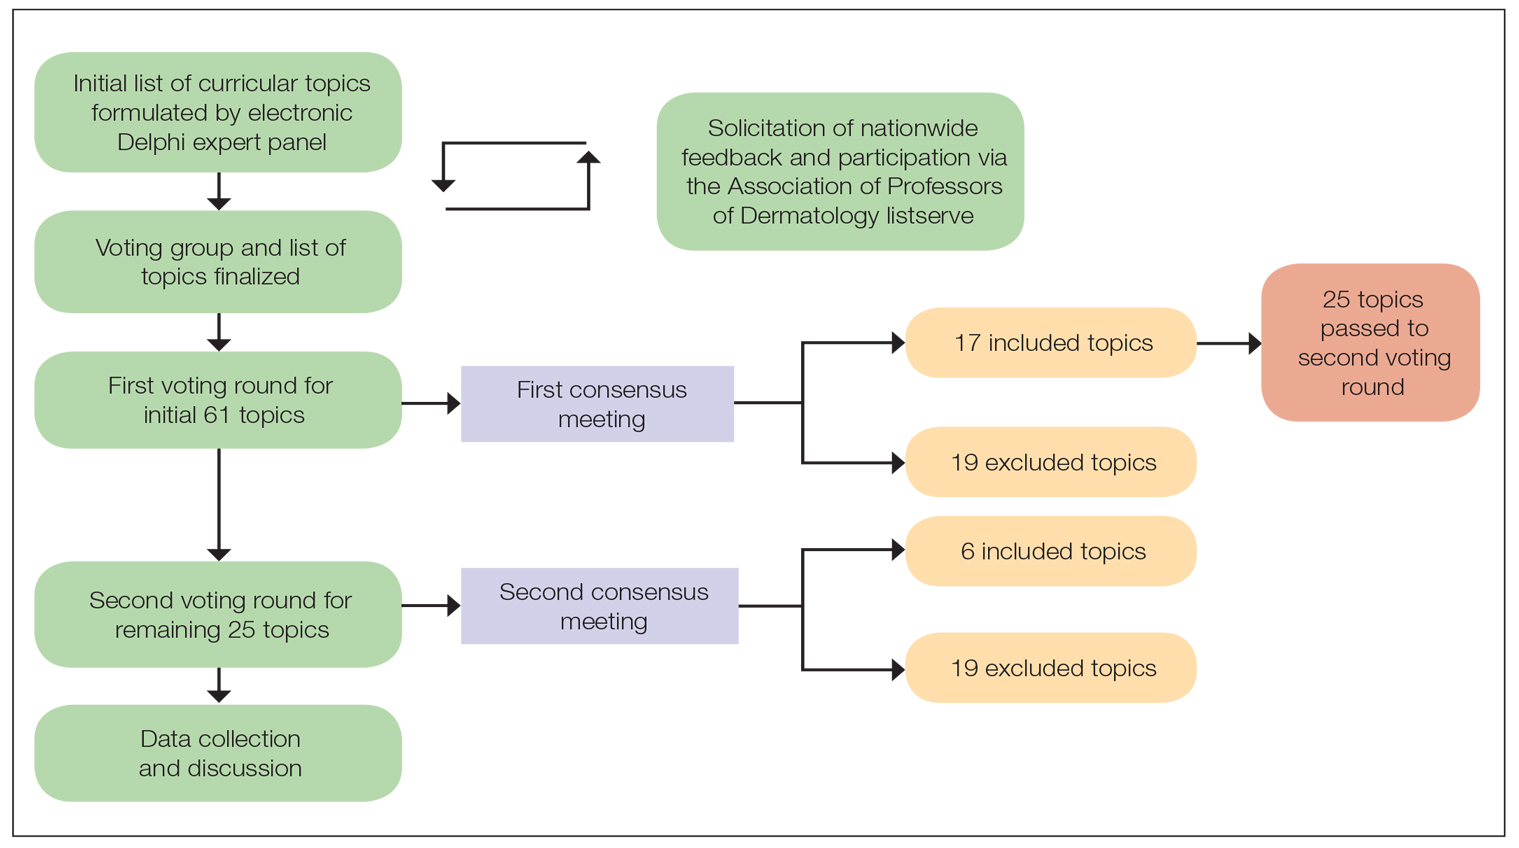
There were 2 voting rounds, with each round consisting of questions scored on a Likert scale ranging from 1 to 5 (1=not essential, 2=probably not essential, 3=neutral, 4=probably essential, 5=definitely essential). The inclusion criteria to classify a topic as necessary for integration into the dermatology residency curriculum included 95% (18/19) or more of respondents rating the topic as probably essential or definitely essential; if more than 90% (17/19) of respondents rated the topic as probably essential or definitely essential and less than 10% (2/19) rated it as not essential or probably not essential, the topic was still included as part of the suggested curriculum. Topics that received ratings of probably essential or definitely essential by less than 80% (15/19) of respondents were removed from consideration. The topics that did not meet inclusion or exclusion criteria during the first round of voting were refined by the e-Delphi steering committee (V.S.E-C. and F-A.R.) based on open-ended feedback from the voting group provided at the end of the survey and subsequently passed to the second round of voting.
Results
Participants—A total of 19 respondents participated in both voting rounds, the majority (80% [15/19]) of whom were program directors or dermatologists affiliated with academia or development of DEI education; the remaining 20% [4/19]) were dermatology residents.
Open-Ended Feedback—Voting group members were able to provide open-ended feedback for each of the sets of topics after the survey, which the steering committee utilized to modify the topics as needed for the final voting round. For example, “structural racism/discrimination” was originally mentioned as a topic, but several participants suggested including specific types of racism; therefore, the wording was changed to “racism: types, definitions” to encompass broader definitions and types of racism.
Survey Results—Two genres of topics were surveyed in each voting round: clinical and nonclinical. Participants voted on a total of 61 topics, with 23 ultimately selected in the final list of consensus curricular topics. Of those, 9 were clinical and 14 nonclinical. All topics deemed necessary for inclusion in residency curricula are presented in eTables 1 and 2.
During the first round of voting, the e-Delphi panel reached a consensus to include the following 17 topics as essential to dermatology residency training (along with the percentage of voters who classified them as probably essential or definitely essential): how to mitigate bias in clinical and workplace settings (100% [40/40]); social determinants of health-related disparities in dermatology (100% [40/40]); hairstyling practices across different hair textures (100% [40/40]); definitions and examples of microaggressions (97.50% [39/40]); definition, background, and types of bias (97.50% [39/40]); manifestations of bias in the clinical setting (97.44% [38/39]); racial and ethnic disparities in dermatology (97.44% [38/39]); keloids (97.37% [37/38]); differences in dermoscopic presentations in skin of color (97.30% [36/37]); skin cancer in patients with skin of color (97.30% [36/37]); disparities due to bias (95.00% [38/40]); how to apply cultural humility and safety to patients of different cultural backgrounds (94.87% [37/40]); best practices in providing care to patients with limited English proficiency (94.87% [37/40]); hair loss in patients with textured hair (94.74% [36/38]); pseudofolliculitis barbae and acne keloidalis nuchae (94.60% [35/37]); disparities regarding people experiencing homelessness (92.31% [36/39]); and definitions and types of racism and other forms of discrimination (92.31% [36/39]). eTable 1 provides a list of suggested resources to incorporate these topics into the educational components of residency curricula. The resources provided were not part of the voting process, and they were not considered in the consensus analysis; they are included here as suggested educational catalysts.
During the second round of voting, 25 topics were evaluated. Of those, the following 6 topics were proposed to be included as essential in residency training: differences in prevalence and presentation of common inflammatory disorders (100% [29/29]); manifestations of bias in the learning environment (96.55%); antiracist action and how to decrease the effects of structural racism in clinical and educational settings (96.55% [28/29]); diversity of images in dermatology education (96.55% [28/29]); pigmentary disorders and their psychological effects (96.55% [28/29]); and LGBTQ (lesbian, gay, bisexual, transgender, and queer) dermatologic health care (96.55% [28/29]). eTable 2 includes these topics as well as suggested resources to help incorporate them into training.
Comment
This study utilized a modified e-Delphi technique to identify relevant clinical and nonclinical DEI topics that should be incorporated into dermatology residency curricula. The panel members reached a consensus for 9 clinical DEI-related topics. The respondents agreed that the topics related to skin and hair conditions in patients with skin of color as well as textured hair were crucial to residency education. Skin cancer, hair loss, pseudofolliculitis barbae, acne keloidalis nuchae, keloids, pigmentary disorders, and their varying presentations in patients with skin of color were among the recommended topics. The panel also recommended educating residents on the variable visual presentations of inflammatory conditions in skin of color. Addressing the needs of diverse patients—for example, those belonging to the LGBTQ community—also was deemed important for inclusion.
The remaining 14 chosen topics were nonclinical items addressing concepts such as bias and health care disparities as well as cultural humility and safety.9 Cultural humility and safety focus on developing cultural awareness by creating a safe setting for patients rather than encouraging power relationships between them and their physicians. Various topics related to racism also were recommended to be included in residency curricula, including education on implementation of antiracist action in the workplace.
Many of the nonclinical topics are intertwined; for instance, learning about health care disparities in patients with limited English proficiency allows for improved best practices in delivering care to patients from this population. The first step in overcoming bias and subsequent disparities is acknowledging how the perpetuation of bias leads to disparities after being taught tools to recognize it.
Our group’s guidance on DEI topics should help dermatology residency program leaders as they design and refine program curricula. There are multiple avenues for incorporating education on these topics, including lectures, interactive workshops, role-playing sessions, book or journal clubs, and discussion circles. Many of these topics/programs may already be included in programs’ didactic curricula, which would minimize the burden of finding space to educate on these topics. Institutional cultural change is key to ensuring truly diverse, equitable, and inclusive workplaces. Educating tomorrow’s dermatologists on these topics is a first step toward achieving that cultural change.
Limitations—A limitation of this e-Delphi survey is that only a selection of experts in this field was included. Additionally, we were concerned that the Likert scale format and the bar we set for inclusion and exclusion may have failed to adequately capture participants’ nuanced opinions. As such, participants were able to provide open-ended feedback, and suggestions for alternate wording or other changes were considered by the steering committee. Finally, inclusion recommendations identified in this survey were developed specifically for US dermatology residents.
Conclusion
In this e-Delphi consensus assessment of DEI-related topics, we recommend the inclusion of 23 topics into dermatology residency program curricula to improve medical training and the patient-physician relationship as well as to create better health outcomes. We also provide specific sample resource recommendations in eTables 1 and 2 to facilitate inclusion of these topics into residency curricula across the country.
- US Census Bureau projections show a slower growing, older, more diverse nation a half century from now. News release. US Census Bureau. December 12, 2012. Accessed August 14, 2024. https://www.census.gov/newsroom/releases/archives/population/cb12243.html#:~:text=12%2C%202012,U.S.%20Census%20Bureau%20Projections%20Show%20a%20Slower%20Growing%2C%20Older%2C%20More,by%20the%20U.S.%20Census%20Bureau
- Lopez S, Lourido JO, Lim HW, et al. The call to action to increase racial and ethnic diversity in dermatology: a retrospective, cross-sectional study to monitor progress. J Am Acad Dermatol. 2020;86:E121-E123. doi:10.1016/j.jaad.2021.10.011
- El-Kashlan N, Alexis A. Disparities in dermatology: a reflection. J Clin Aesthet Dermatol. 2022;15:27-29.
- Laveist TA, Nuru-Jeter A. Is doctor-patient race concordance associated with greater satisfaction with care? J Health Soc Behav. 2002;43:296-306.
- Street RL Jr, O’Malley KJ, Cooper LA, et al. Understanding concordance in patient-physician relationships: personal and ethnic dimensions of shared identity. Ann Fam Med. 2008;6:198-205. doi:10.1370/afm.821
- Dadrass F, Bowers S, Shinkai K, et al. Diversity, equity, and inclusion in dermatology residency. Dermatol Clin. 2023;41:257-263. doi:10.1016/j.det.2022.10.006
- Diversity and the Academy. American Academy of Dermatology website. Accessed August 22, 2024. https://www.aad.org/member/career/diversity
- SOCS speaks. Skin of Color Society website. Accessed August 22, 2024. https://skinofcolorsociety.org/news-media/socs-speaks
- Solchanyk D, Ekeh O, Saffran L, et al. Integrating cultural humility into the medical education curriculum: strategies for educators. Teach Learn Med. 2021;33:554-560. doi:10.1080/10401334.2021.1877711
Diversity, equity, and inclusion (DEI) programs seek to improve dermatologic education and clinical care for an increasingly diverse patient population as well as to recruit and sustain a physician workforce that reflects the diversity of the patients they serve.1,2 In dermatology, only 4.2% and 3.0% of practicing dermatologists self-identify as being of Hispanic and African American ethnicity, respectively, compared with 18.5% and 13.4% of the general population, respectively.3 Creating an educational system that works to meet the goals of DEI is essential to improve health outcomes and address disparities. The lack of robust DEI-related curricula during residency training may limit the ability of practicing dermatologists to provide comprehensive and culturally sensitive care. It has been shown that racial concordance between patients and physicians has a positive impact on patient satisfaction by fostering a trusting patient-physician relationship.4
It is the responsibility of all dermatologists to create an environment where patients from any background can feel comfortable, which can be cultivated by establishing patient-centered communication and cultural humility.5 These skills can be strengthened via the implementation of DEI-related curricula during residency training. Augmenting exposure of these topics during training can optimize the delivery of dermatologic care by providing residents with the tools and confidence needed to care for patients of culturally diverse backgrounds. Enhancing DEI education is crucial to not only improve the recognition and treatment of dermatologic conditions in all skin and hair types but also to minimize misconceptions, stigma, health disparities, and discrimination faced by historically marginalized communities. Creating a culture of inclusion is of paramount importance to build successful relationships with patients and colleagues of culturally diverse backgrounds.6
There are multiple efforts underway to increase DEI education across the field of dermatology, including the development of DEI task forces in professional organizations and societies that serve to expand DEI-related research, mentorship, and education. The American Academy of Dermatology has been leading efforts to create a curriculum focused on skin of color, particularly addressing inadequate educational training on how dermatologic conditions manifest in this population.7 The Skin of Color Society has similar efforts underway and is developing a speakers bureau to give leading experts a platform to lecture dermatology trainees as well as patient and community audiences on various topics in skin of color.8 These are just 2 of many professional dermatology organizations that are advocating for expanded education on DEI; however, consistently integrating DEI-related topics into dermatology residency training curricula remains a gap in pedagogy. To identify the DEI-related topics of greatest relevance to the dermatology resident curricula, we implemented a modified electronic Delphi (e-Delphi) consensus process to provide standardized recommendations.
Methods
A 2-round modified e-Delphi method was utilized (Figure). An initial list of potential curricular topics was formulated by an expert panel consisting of 5 dermatologists from the Association of Professors of Dermatology DEI subcommittee and the American Academy of Dermatology Diversity Task Force (A.M.A., S.B., R.V., S.D.W., J.I.S.). Initial topics were selected via several meetings among the panel members to discuss existing DEI concerns and issues that were deemed relevant due to education gaps in residency training. The list of topics was further expanded with recommendations obtained via an email sent to dermatology program directors on the Association of Professors of Dermatology listserve, which solicited voluntary participation of academic dermatologists, including program directors and dermatology residents.
There were 2 voting rounds, with each round consisting of questions scored on a Likert scale ranging from 1 to 5 (1=not essential, 2=probably not essential, 3=neutral, 4=probably essential, 5=definitely essential). The inclusion criteria to classify a topic as necessary for integration into the dermatology residency curriculum included 95% (18/19) or more of respondents rating the topic as probably essential or definitely essential; if more than 90% (17/19) of respondents rated the topic as probably essential or definitely essential and less than 10% (2/19) rated it as not essential or probably not essential, the topic was still included as part of the suggested curriculum. Topics that received ratings of probably essential or definitely essential by less than 80% (15/19) of respondents were removed from consideration. The topics that did not meet inclusion or exclusion criteria during the first round of voting were refined by the e-Delphi steering committee (V.S.E-C. and F-A.R.) based on open-ended feedback from the voting group provided at the end of the survey and subsequently passed to the second round of voting.
Results
Participants—A total of 19 respondents participated in both voting rounds, the majority (80% [15/19]) of whom were program directors or dermatologists affiliated with academia or development of DEI education; the remaining 20% [4/19]) were dermatology residents.
Open-Ended Feedback—Voting group members were able to provide open-ended feedback for each of the sets of topics after the survey, which the steering committee utilized to modify the topics as needed for the final voting round. For example, “structural racism/discrimination” was originally mentioned as a topic, but several participants suggested including specific types of racism; therefore, the wording was changed to “racism: types, definitions” to encompass broader definitions and types of racism.
Survey Results—Two genres of topics were surveyed in each voting round: clinical and nonclinical. Participants voted on a total of 61 topics, with 23 ultimately selected in the final list of consensus curricular topics. Of those, 9 were clinical and 14 nonclinical. All topics deemed necessary for inclusion in residency curricula are presented in eTables 1 and 2.
During the first round of voting, the e-Delphi panel reached a consensus to include the following 17 topics as essential to dermatology residency training (along with the percentage of voters who classified them as probably essential or definitely essential): how to mitigate bias in clinical and workplace settings (100% [40/40]); social determinants of health-related disparities in dermatology (100% [40/40]); hairstyling practices across different hair textures (100% [40/40]); definitions and examples of microaggressions (97.50% [39/40]); definition, background, and types of bias (97.50% [39/40]); manifestations of bias in the clinical setting (97.44% [38/39]); racial and ethnic disparities in dermatology (97.44% [38/39]); keloids (97.37% [37/38]); differences in dermoscopic presentations in skin of color (97.30% [36/37]); skin cancer in patients with skin of color (97.30% [36/37]); disparities due to bias (95.00% [38/40]); how to apply cultural humility and safety to patients of different cultural backgrounds (94.87% [37/40]); best practices in providing care to patients with limited English proficiency (94.87% [37/40]); hair loss in patients with textured hair (94.74% [36/38]); pseudofolliculitis barbae and acne keloidalis nuchae (94.60% [35/37]); disparities regarding people experiencing homelessness (92.31% [36/39]); and definitions and types of racism and other forms of discrimination (92.31% [36/39]). eTable 1 provides a list of suggested resources to incorporate these topics into the educational components of residency curricula. The resources provided were not part of the voting process, and they were not considered in the consensus analysis; they are included here as suggested educational catalysts.
During the second round of voting, 25 topics were evaluated. Of those, the following 6 topics were proposed to be included as essential in residency training: differences in prevalence and presentation of common inflammatory disorders (100% [29/29]); manifestations of bias in the learning environment (96.55%); antiracist action and how to decrease the effects of structural racism in clinical and educational settings (96.55% [28/29]); diversity of images in dermatology education (96.55% [28/29]); pigmentary disorders and their psychological effects (96.55% [28/29]); and LGBTQ (lesbian, gay, bisexual, transgender, and queer) dermatologic health care (96.55% [28/29]). eTable 2 includes these topics as well as suggested resources to help incorporate them into training.
Comment
This study utilized a modified e-Delphi technique to identify relevant clinical and nonclinical DEI topics that should be incorporated into dermatology residency curricula. The panel members reached a consensus for 9 clinical DEI-related topics. The respondents agreed that the topics related to skin and hair conditions in patients with skin of color as well as textured hair were crucial to residency education. Skin cancer, hair loss, pseudofolliculitis barbae, acne keloidalis nuchae, keloids, pigmentary disorders, and their varying presentations in patients with skin of color were among the recommended topics. The panel also recommended educating residents on the variable visual presentations of inflammatory conditions in skin of color. Addressing the needs of diverse patients—for example, those belonging to the LGBTQ community—also was deemed important for inclusion.
The remaining 14 chosen topics were nonclinical items addressing concepts such as bias and health care disparities as well as cultural humility and safety.9 Cultural humility and safety focus on developing cultural awareness by creating a safe setting for patients rather than encouraging power relationships between them and their physicians. Various topics related to racism also were recommended to be included in residency curricula, including education on implementation of antiracist action in the workplace.
Many of the nonclinical topics are intertwined; for instance, learning about health care disparities in patients with limited English proficiency allows for improved best practices in delivering care to patients from this population. The first step in overcoming bias and subsequent disparities is acknowledging how the perpetuation of bias leads to disparities after being taught tools to recognize it.
Our group’s guidance on DEI topics should help dermatology residency program leaders as they design and refine program curricula. There are multiple avenues for incorporating education on these topics, including lectures, interactive workshops, role-playing sessions, book or journal clubs, and discussion circles. Many of these topics/programs may already be included in programs’ didactic curricula, which would minimize the burden of finding space to educate on these topics. Institutional cultural change is key to ensuring truly diverse, equitable, and inclusive workplaces. Educating tomorrow’s dermatologists on these topics is a first step toward achieving that cultural change.
Limitations—A limitation of this e-Delphi survey is that only a selection of experts in this field was included. Additionally, we were concerned that the Likert scale format and the bar we set for inclusion and exclusion may have failed to adequately capture participants’ nuanced opinions. As such, participants were able to provide open-ended feedback, and suggestions for alternate wording or other changes were considered by the steering committee. Finally, inclusion recommendations identified in this survey were developed specifically for US dermatology residents.
Conclusion
In this e-Delphi consensus assessment of DEI-related topics, we recommend the inclusion of 23 topics into dermatology residency program curricula to improve medical training and the patient-physician relationship as well as to create better health outcomes. We also provide specific sample resource recommendations in eTables 1 and 2 to facilitate inclusion of these topics into residency curricula across the country.
- US Census Bureau projections show a slower growing, older, more diverse nation a half century from now. News release. US Census Bureau. December 12, 2012. Accessed August 14, 2024. https://www.census.gov/newsroom/releases/archives/population/cb12243.html#:~:text=12%2C%202012,U.S.%20Census%20Bureau%20Projections%20Show%20a%20Slower%20Growing%2C%20Older%2C%20More,by%20the%20U.S.%20Census%20Bureau
- Lopez S, Lourido JO, Lim HW, et al. The call to action to increase racial and ethnic diversity in dermatology: a retrospective, cross-sectional study to monitor progress. J Am Acad Dermatol. 2020;86:E121-E123. doi:10.1016/j.jaad.2021.10.011
- El-Kashlan N, Alexis A. Disparities in dermatology: a reflection. J Clin Aesthet Dermatol. 2022;15:27-29.
- Laveist TA, Nuru-Jeter A. Is doctor-patient race concordance associated with greater satisfaction with care? J Health Soc Behav. 2002;43:296-306.
- Street RL Jr, O’Malley KJ, Cooper LA, et al. Understanding concordance in patient-physician relationships: personal and ethnic dimensions of shared identity. Ann Fam Med. 2008;6:198-205. doi:10.1370/afm.821
- Dadrass F, Bowers S, Shinkai K, et al. Diversity, equity, and inclusion in dermatology residency. Dermatol Clin. 2023;41:257-263. doi:10.1016/j.det.2022.10.006
- Diversity and the Academy. American Academy of Dermatology website. Accessed August 22, 2024. https://www.aad.org/member/career/diversity
- SOCS speaks. Skin of Color Society website. Accessed August 22, 2024. https://skinofcolorsociety.org/news-media/socs-speaks
- Solchanyk D, Ekeh O, Saffran L, et al. Integrating cultural humility into the medical education curriculum: strategies for educators. Teach Learn Med. 2021;33:554-560. doi:10.1080/10401334.2021.1877711
PRACTICE POINTS
- Advancing curricula related to diversity, equity, and inclusion in dermatology training can improve health outcomes, address health care workforce disparities, and enhance clinical care for diverse patient populations.
- Education on patient-centered communication, cultural humility, and the impact of social determinants of health results in dermatology residents who are better equipped with the necessary tools to effectively care for patients from diverse backgrounds.
Metformin Led to Improvements in Women with Central Centrifugal Cicatricial Alopecia
TOPLINE:
, in a retrospective case series.
METHODOLOGY:
- Researchers conducted a case series involving 12 Black women in their 30s, 40s, and 50s, with biopsy-confirmed, treatment-refractory CCCA, a chronic inflammatory hair disorder characterized by permanent hair loss, from the Johns Hopkins University alopecia clinic.
- Participants received CCCA treatment for at least 6 months and had stagnant or worsening symptoms before oral extended-release metformin (500 mg daily) was added to treatment. (Treatments included topical clobetasol, compounded minoxidil, and platelet-rich plasma injections.)
- Scalp biopsies were collected from four patients before and after metformin treatment to evaluate gene expression changes.
- Changes in clinical symptoms were assessed, including pruritus, inflammation, pain, scalp resistance, and hair regrowth, following initiation of metformin treatment.
TAKEAWAY:
- Metformin led to significant clinical improvement in eight patients, which included reductions in scalp pain, scalp resistance, pruritus, and inflammation. However, two patients experienced worsening symptoms.
- Six patients showed clinical evidence of hair regrowth after at least 6 months of metformin treatment with one experiencing hair loss again 3 months after discontinuing treatment.
- Transcriptomic analysis revealed 34 upregulated genes, which included upregulated of 23 hair keratin-associated proteins, and pathways related to keratinization, epidermis development, and the hair cycle. In addition, eight genes were downregulated, with pathways that included those associated with extracellular matrix organization, collagen fibril organization, and collagen metabolism.
- Gene set variation analysis showed reduced expression of T helper 17 cell and epithelial-mesenchymal transition pathways and elevated adenosine monophosphate kinase signaling and keratin-associated proteins after treatment with metformin.
IN PRACTICE:
“Metformin’s ability to concomitantly target fibrosis and inflammation provides a plausible mechanism for its therapeutic effects in CCCA and other fibrosing alopecia disorders,” the authors concluded. But, they added, “larger prospective, placebo-controlled randomized clinical trials are needed to rigorously evaluate metformin’s efficacy and optimal dosing for treatment of cicatricial alopecias.”
SOURCE:
The study was led by Aaron Bao, Department of Dermatology, Johns Hopkins University School of Medicine, Baltimore, and was published online on September 4 in JAMA Dermatology.
LIMITATIONS:
A small sample size, retrospective design, lack of a placebo control group, and the single-center setting limited the generalizability of the study findings. In addition, the absence of a validated activity or severity scale for CCCA and the single posttreatment sampling limit the assessment and comparison of clinical symptoms and transcriptomic changes.
DISCLOSURES:
The study was supported by the American Academy of Dermatology. One author reported several ties with pharmaceutical companies, a pending patent, and authorship for the UpToDate section on CCCA.
This article was created using several editorial tools, including AI, as part of the process. Human editors reviewed this content before publication. A version of this article first appeared on Medscape.com.
Breast Cancer Hormone Therapy May Protect Against Dementia
TOPLINE:
with the greatest benefit seen in younger Black women.
METHODOLOGY:
- Hormone-modulating therapy is widely used to treat hormone receptor–positive breast cancer, but the cognitive effects of the treatment, including a potential link to dementia, remain unclear.
- To investigate, researchers used the SEER-Medicare linked database to identify women aged 65 years or older with breast cancer who did and did not receive hormone-modulating therapy within 3 years following their diagnosis.
- The researchers excluded women with preexisting Alzheimer’s disease/dementia diagnoses or those who had received hormone-modulating therapy before their breast cancer diagnosis.
- Analyses were adjusted for demographic, sociocultural, and clinical variables, and subgroup analyses evaluated the impact of age, race, and type of hormone-modulating therapy on Alzheimer’s disease/dementia risk.
TAKEAWAY:
- Among the 18,808 women included in the analysis, 66% received hormone-modulating therapy and 34% did not. During the mean follow-up of 12 years, 24% of hormone-modulating therapy users and 28% of nonusers developed Alzheimer’s disease/dementia.
- Overall, hormone-modulating therapy use (vs nonuse) was associated with a significant 7% lower risk for Alzheimer’s disease/dementia (hazard ratio [HR], 0.93; P = .005), with notable age and racial differences.
- Hormone-modulating therapy use was associated with a 24% lower risk for Alzheimer’s disease/dementia in Black women aged 65-74 years (HR, 0.76), but that protective effect decreased to 19% in Black women aged 75 years or older (HR, 0.81). White women aged 65-74 years who received hormone-modulating therapy (vs those who did not) had an 11% lower risk for Alzheimer’s disease/dementia (HR, 0.89), but the association disappeared among those aged 75 years or older (HR, 0.96; 95% CI, 0.90-1.02). Other races demonstrated no significant association between hormone-modulating therapy use and Alzheimer’s disease/dementia.
- Overall, the use of an aromatase inhibitor or a selective estrogen receptor modulator was associated with a significantly lower risk for Alzheimer’s disease/dementia (HR, 0.93 and HR, 0.89, respectively).
IN PRACTICE:
Overall, the retrospective study found that “hormone therapy was associated with protection against [Alzheimer’s/dementia] in women aged 65 years or older with newly diagnosed breast cancer,” with the decrease in risk relatively greater for Black women and women younger than 75 years, the authors concluded.
“The results highlight the critical need for personalized breast cancer treatment plans that are tailored to the individual characteristics of each patient, particularly given the significantly higher likelihood (two to three times more) of Black women developing [Alzheimer’s/dementia], compared with their White counterparts,” the researchers added.
SOURCE:
The study, with first author Chao Cai, PhD, Department of Clinical Pharmacy and Outcomes Sciences, University of South Carolina, Columbia, was published online on July 16 in JAMA Network Open.
LIMITATIONS:
The study included only women aged 65 years or older, limiting generalizability to younger women. The dataset lacked genetic information and laboratory data related to dementia. The duration of hormone-modulating therapy use beyond 3 years and specific formulations were not assessed. Potential confounders such as variations in chemotherapy, radiation, and surgery were not fully addressed.
DISCLOSURES:
Support for the study was provided by the National Institutes of Health; Carolina Center on Alzheimer’s Disease and Minority Research pilot project; and the Dean’s Faculty Advancement Fund, University of Pittsburgh, Pennsylvania. The authors reported no relevant disclosures.
A version of this article first appeared on Medscape.com.
Trends in Industry Payments to Dermatologists: A 5-Year Analysis of Open Payments Data (2017-2021)
Financial relationships between physicians and industry are prevalent and complex and may have implications for patient care. A 2007 study reported that 94% of 3167 physicians surveyed had established some form of paid relationship with companies in the pharmaceutical industry.1 To facilitate increased transparency around these relationships, lawmakers passed the Physician Payments Sunshine Act in 2010, which requires pharmaceutical companies and device manufacturers to report all payments made to physicians.2 Mandatory disclosures include meals, honoraria, travel expenses, grants, and ownership or investment interests greater than $10. The information is displayed publicly in the Open Payments database (OPD)(https://openpayments-data.cms.gov/), a platform run by the Centers for Medicare and Medicaid Services.
The OPD allows for in-depth analyses of industry payments made to physicians. Many medical specialties—including orthopedics,3-5 plastic surgery,6,7 ophthalmology,8 and gastroenterology9—have published extensive literature characterizing the nature of these payments and disparities in the distribution of payments based on sex, geographic distribution, and other factors. After the first full year of OPD data collection for dermatology in 2014, Feng et al10 examined the number, amount, and nature of industry payments to dermatologists, as well as their geographic distribution for that year. As a follow-up to this initial research, Schlager et al11 characterized payments made to dermatologists for the year 2016 and found an increase in the total payments, mean payments, and number of dermatologists receiving payments compared with the 2014 data.
Our study aimed to characterize the last 5 years of available OPD data—from January 1, 2017, to December 31, 2021—to further explore trends in industry payments made to dermatologists. In particular, we examined the effects of the COVID-19 pandemic on payments as well as sex disparities and the distribution of industry payments.
Methods
We performed a retrospective analysis of the OPD for the general payment datasets from January 1, 2017, to December 31, 2021. The results were filtered to include only payments made to dermatologists, excluding physicians from other specialties, physician assistants, and other types of practitioners. Data for each physician were grouped by National Provider Identifier (NPI) for providers included in the set, allowing for analysis at the individual level. Data on sex were extracted from the National Plan & Provider Enumeration System’s monthly data dissemination for NPIs for July 2023 (when the study was conducted) and were joined to the OPD data using the NPI number reported for each physician. All data were extracted, transformed, and analyzed using R software (version 4.2.1). Figures and visualizations were produced using Microsoft Excel 2016.
Results
In 2017, a total of 358,884 payments were made by industry to dermatologists, accounting for nearly $58.0 million. The mean total value of payments received per dermatologist was $5231.74, and the mean payment amount was $161.49. In 2018, the total number of payments increased year-over-year by 5.5% (378,509 payments), the total value of payments received increased by 7.5% (approximately $62.3 million), and the mean total value of payments received per dermatologist increased by 5.3% ($5508.98). In 2019, the total number of payments increased by 3.0% (389,670 total payments), the total value of payments recieved increased by 13.2% (approximately $70.5 million), and the mean total value of payments received per dermatologist increased by 11.3% ($6133.45). All of these values decreased in 2020, likely due to COVID-19–related restrictions on travel and meetings (total number of payments, 208,470 [−46.5%]; total value of payments received, approximately $37.5 million [−46.9%], mean total value of payments received per dermatologist, $3757.27 [−38.7%]), but the mean payment amount remained stable at $179.47. In 2021, the total number of payments (295,808 [+41.9%]), total value of payments received (approximately $50.3 million [+34.4%]), and mean total value of payments received per dermatologist ($4707.88 [+25.3%]) all rebounded, but not to pre-2020 levels (Table 1). When looking at the geographic distribution of payments, the top 5 states receiving the highest total value of payments during the study period included California ($41.51 million), New York ($32.26 million), Florida ($21.38 million), Texas ($19.93 million), and Pennsylvania ($11.69 million).
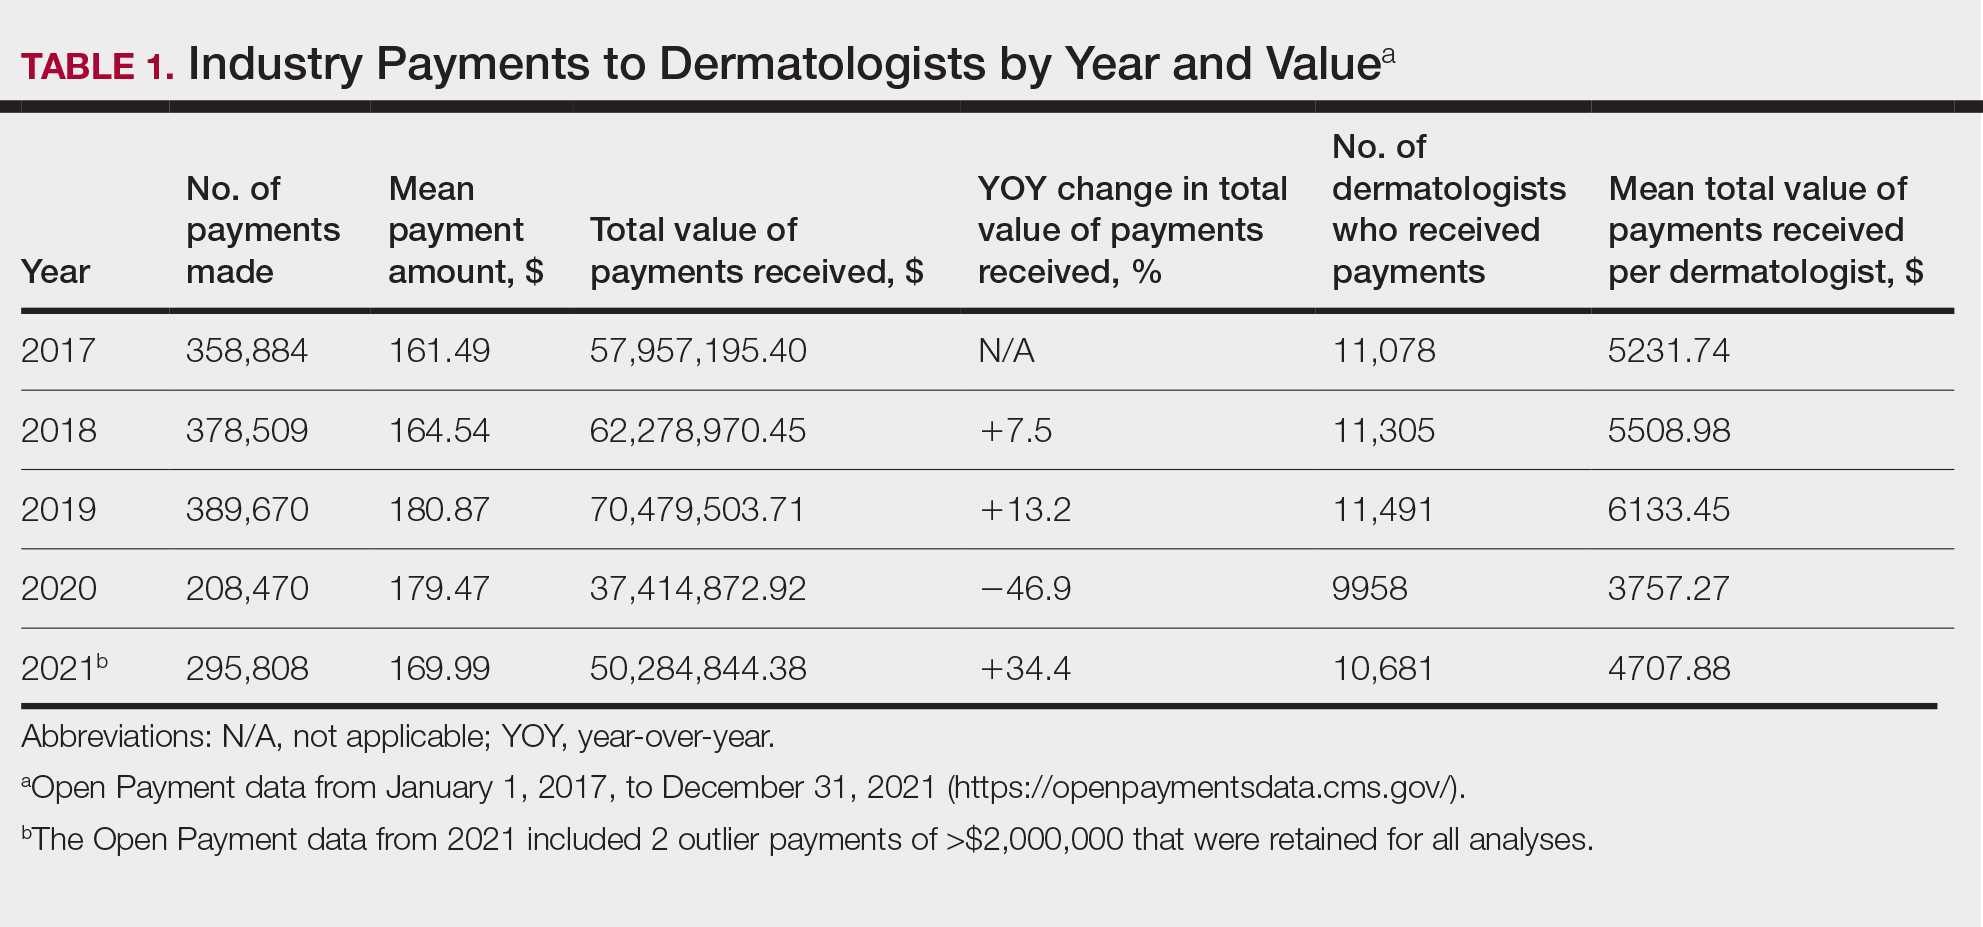
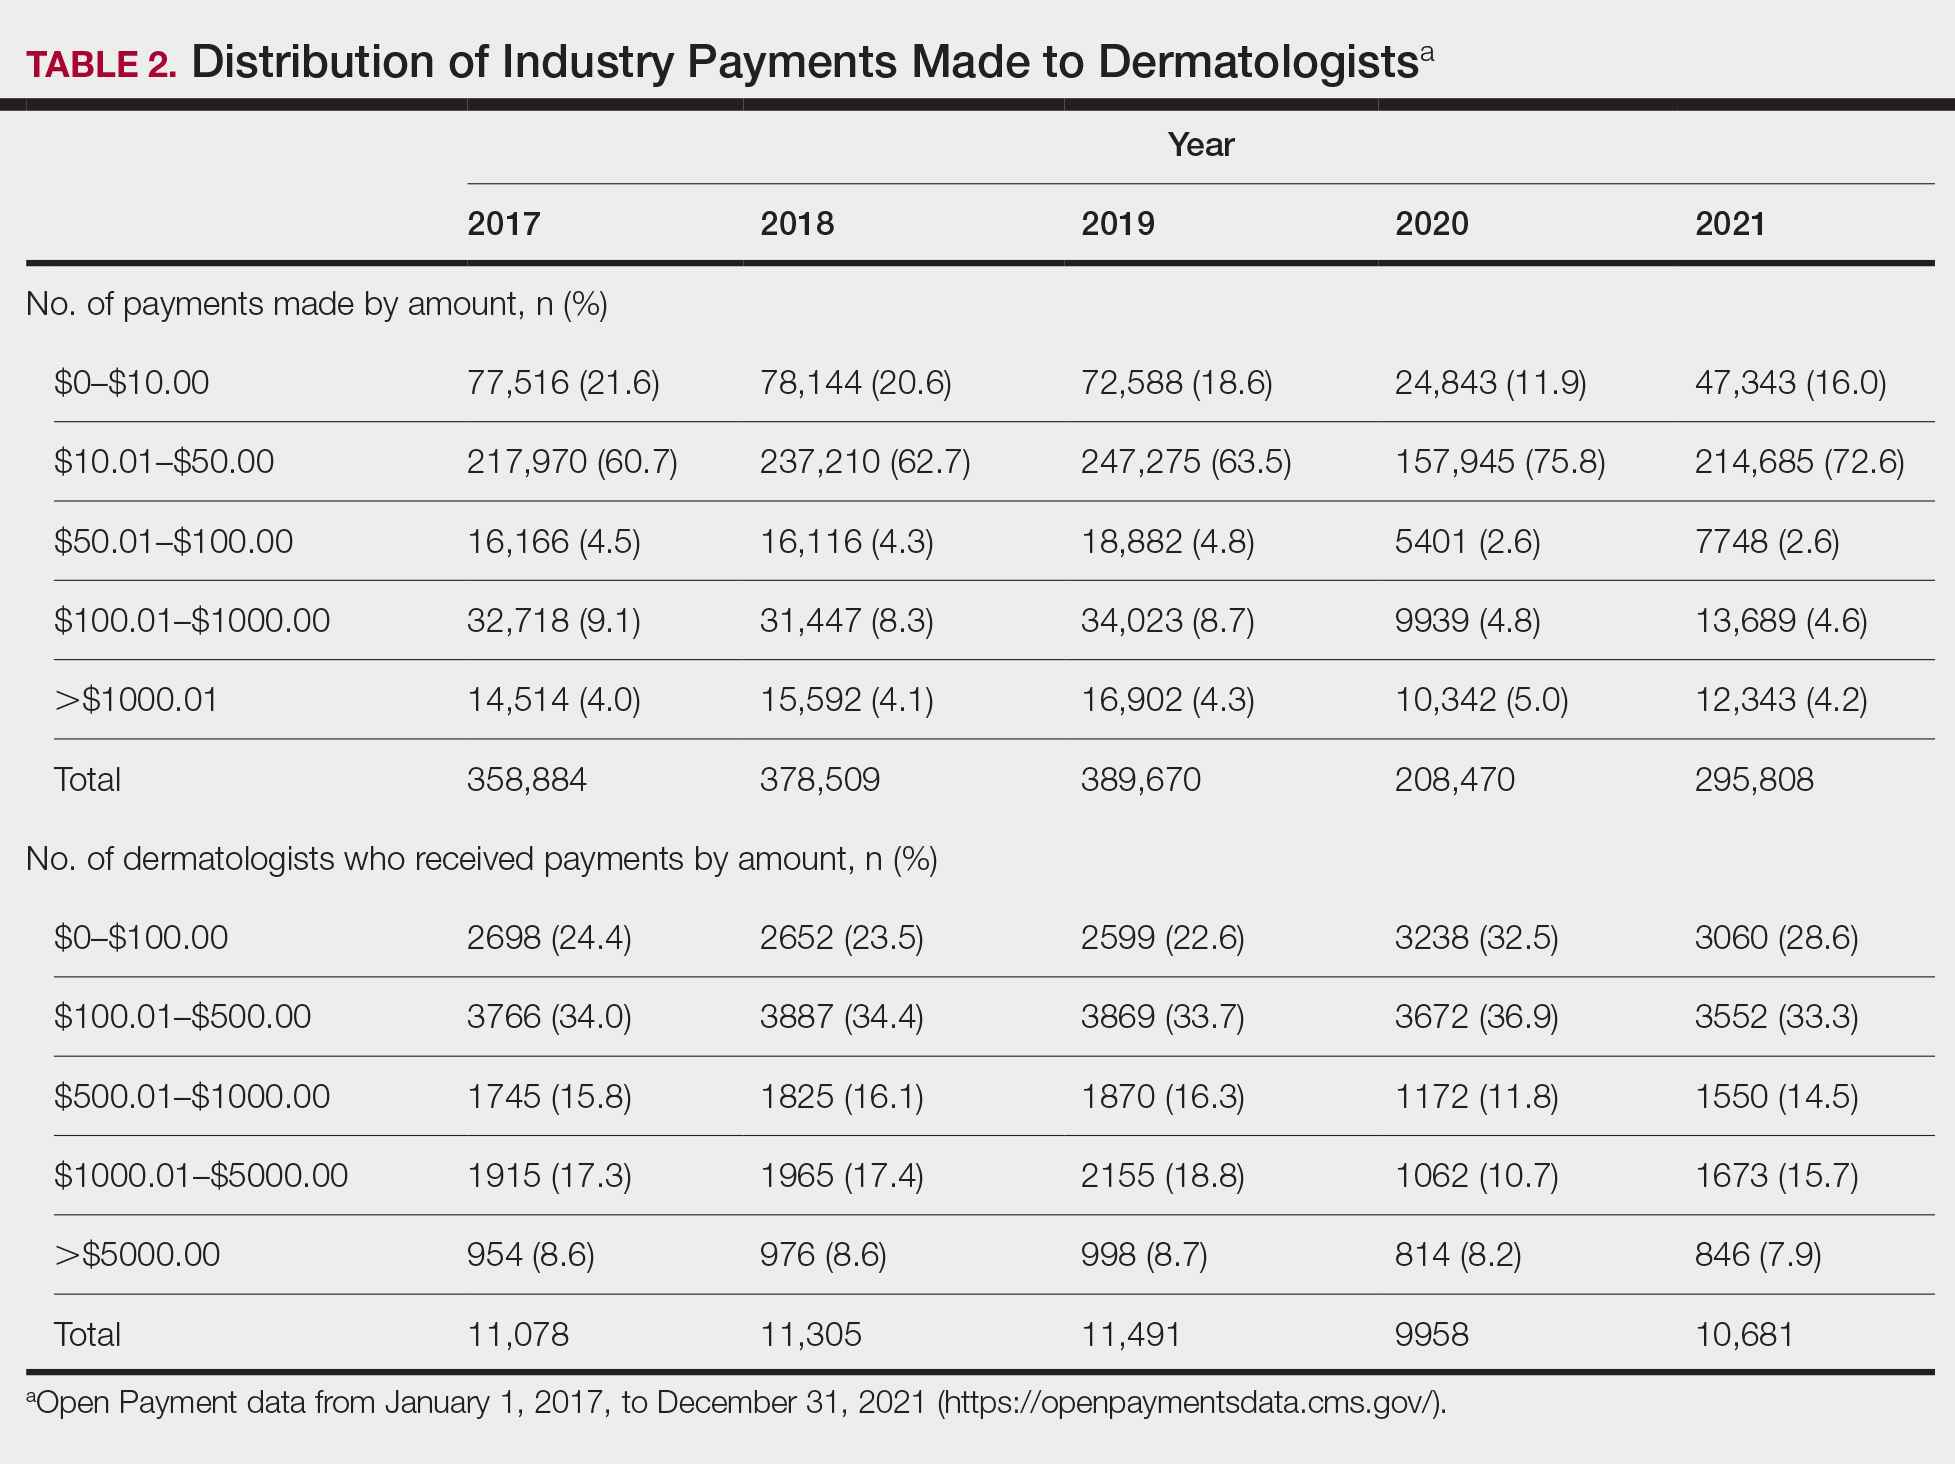
For each year from 2017 to 2021, more than 80% of payments made to dermatologists were less than $50. The majority (60.7%–75.8%) were in the $10 to $50 range. Between 4% and 5% of payments were more than $1000 for each year. Fewer than 10% of dermatologists received more than $5000 in total payments per year. Most dermatologists (33.3%–36.9%) received $100 to $500 per year. The distribution of payments stratified by number of payments made by amount and payment amount per dermatologist is further delineated in Table 2.
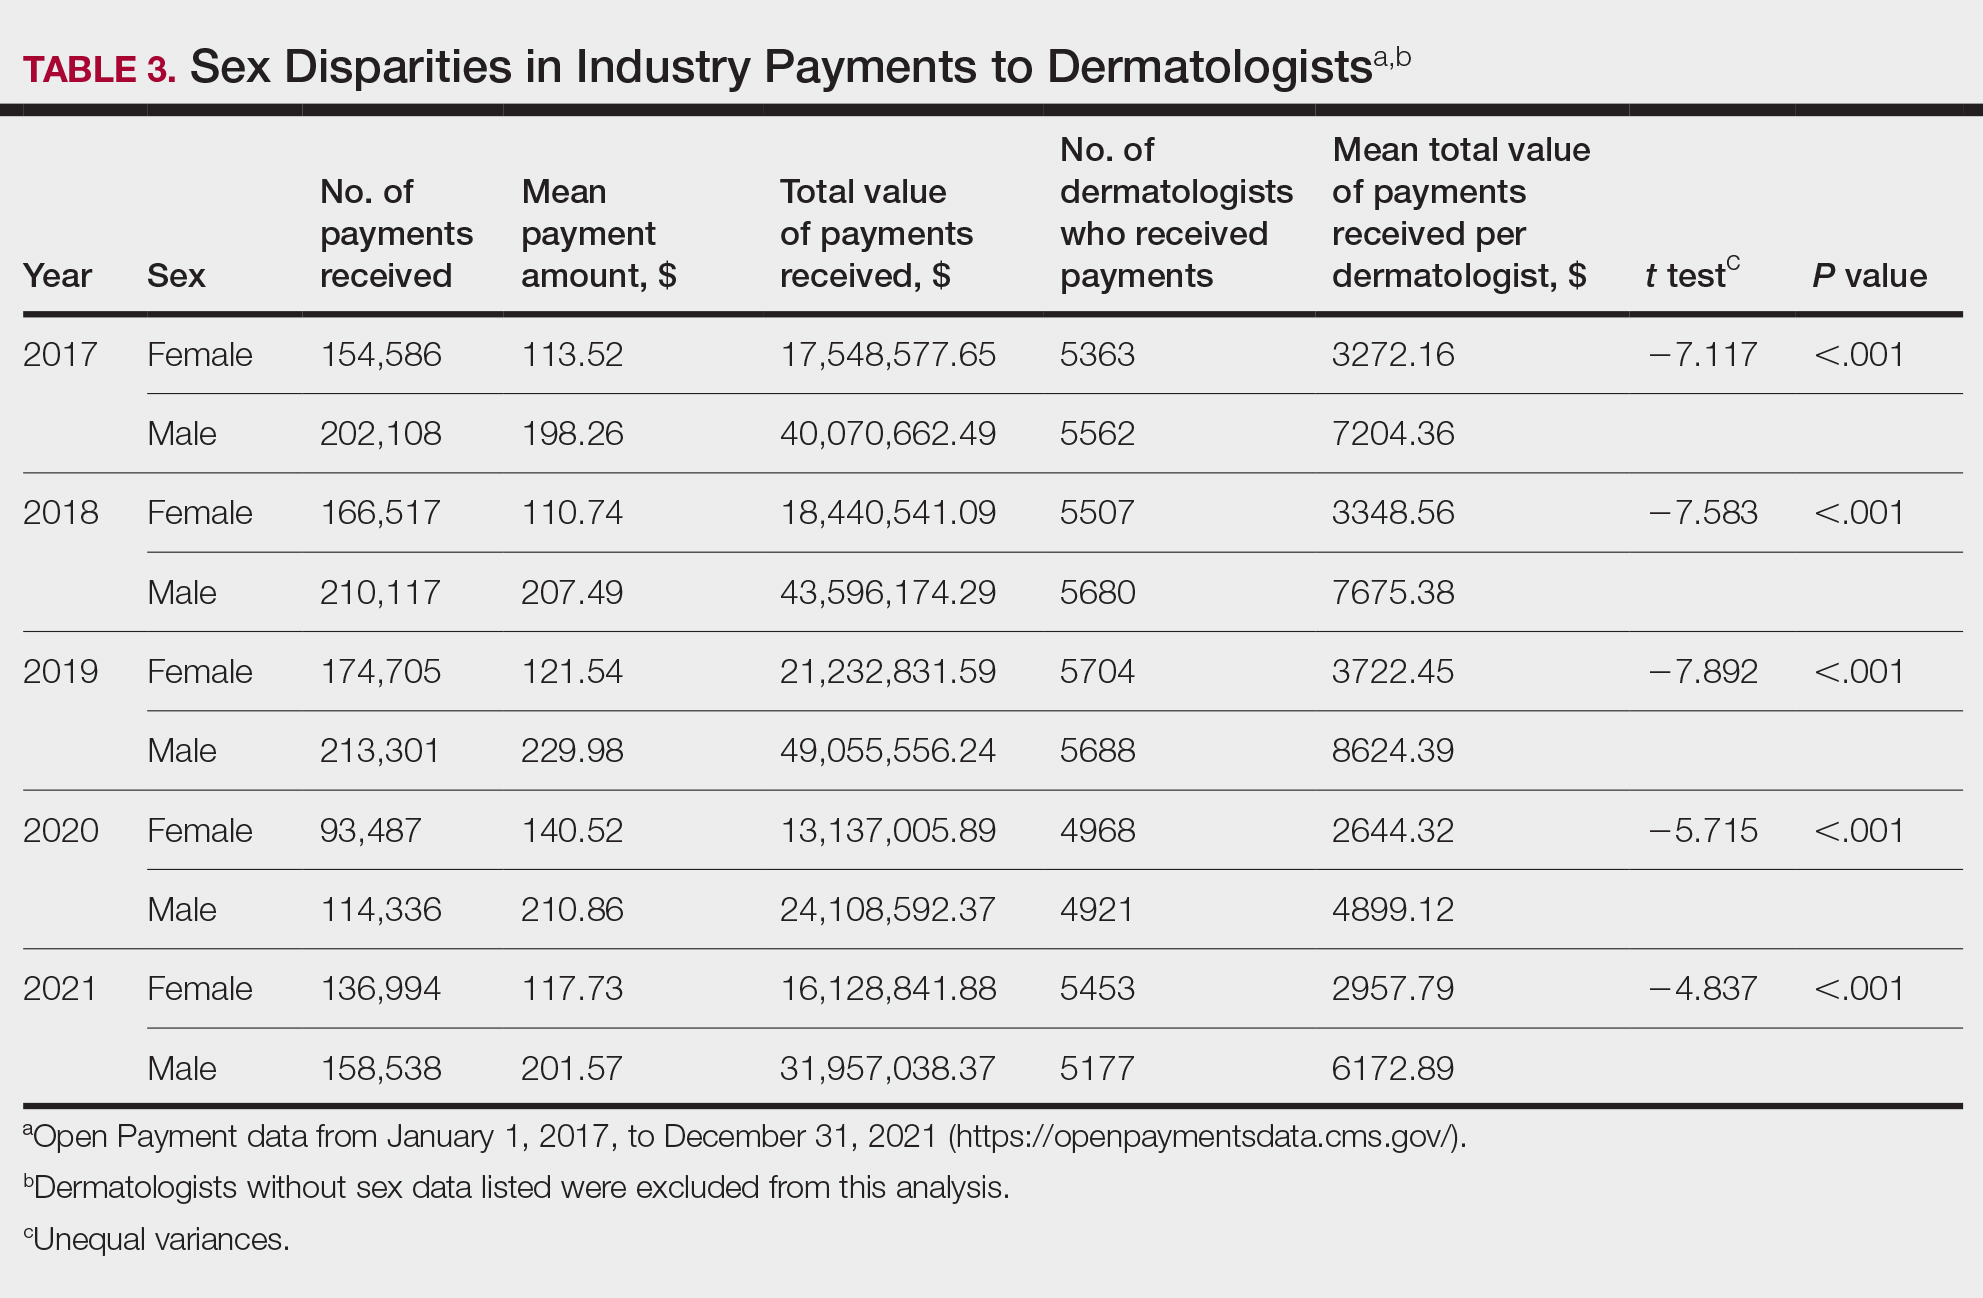
Among dermatologists who received industry payments in 2017, slightly more than half (50.9%) were male; however, male dermatologists accounted for more than $40.1 million of the more than $57.6 million total payments made to dermatologists (69.6%) that year. Male dermatologists received a mean payment amount of $198.26, while female dermatologists received a significantly smaller amount of $113.52 (P<.001). The mean total value of payments received per male dermatologist was $7204.36, while the mean total value for female dermatologists was $3272.16 (P<.001). The same statistically significant disparities in mean payment amount and mean total value of payments received by male vs female dermatologists were observed for every year from 2017 through 2021 (Table 3).
Comment
Benefits of Physician Relationships With Industry—The Physician Payments Sunshine Act increased transparency of industry payments to physicians by creating the OPD through which these relationships can be reported.12 The effects of these relationships on treatment practices have been the subject of many studies in recent years. Some have suggested that industry ties may impact prescription patterns of endorsed medications.13 It also has been reported that the chance of a research study identifying a positive outcome for a particular treatment is higher when the study is funded by a pharmaceutical company compared to other sponsors.14 On the other hand, some researchers have argued that, when established and maintained in an ethical manner, industry-physician relationships may help practitioners stay updated on the newest treatment paradigms and benefit patient care.15 Industry relationships may help drive innovation of new products with direct input from frontline physicians who take care of the patients these products aim to help.
Limitations of the OPD—Critics of the OPD have argued that the reported data lack sufficient context and are not easily interpretable by most patients.16 In addition, many patients might not know about the existence of the database. Indeed, one national survey-based study showed that only 12% of 3542 respondents knew that this information was publicly available, and only 5% knew whether their own physician had received industry payments.17
Increased Payments From Industry—Our analysis builds on previously reported data in dermatology from 2014 to 2016.10,11 We found that the trends of increasing numbers and dollar amounts of payments made by industry to dermatologists continued from 2017 to 2019, which may reflect the intended effects of the Physician Payments Sunshine Act, as more payments are being reported in a transparent manner. It also shows that relationships between industry and dermatologists have become more commonplace over time.
It is important to consider these trends in the context of overall Medicare expenditures and prescription volumes. Between 2008 and 2021, prescription volumes have been increasing at a rate of 1% to 4% per year, with 2020 being an exception as the volume decreased slightly from the year prior due to COVID-19 (−3%). Similarly, total Medicare and Medicaid expenditures have been growing at a rate of almost 5% per year.18 Based on our study results, it appears the total value of payments made between 2017 and 2021 increased at a rate that outpaced prescription volume and expenditures; however, it is difficult to draw conclusions about the relationship between payments made to dermatologists and spending without examining prescriptions specific to dermatologists in the OPD dataset. This relationship could be further explored in future studies.
COVID-19 Restrictions Impacted Payments in 2021—We hypothesize that COVID-19–related restrictions on traveling and in-person meetings led to a decrease in the number of payments, total payment amount, and mean total value of payments received per dermatologist. Notably, compensation for services other than consulting, including speaking fees, had the most precipitous decrease in total payment amount. On the other hand, honoraria and consulting fees were least impacted, as many dermatologists were still able to maintain relationships with industry on an advisory basis without traveling. From 2020 to 2021, the number of total payments and dollar amounts increased with easing of COVID-19 restrictions; however, they had not yet rebounded to 2019 levels during the study period. It will be interesting to continue monitoring these trends once data from future years become available.
Top-Compensated Dermatologists—Our study results also show that for all years from 2017 through 2021, the majority of industry payments were made to a small concentrated percentage of top-compensated dermatologists, which may reflect larger and more frequent payments to those identified by pharmaceutical companies as thought leaders and key opinion leaders in the field or those who are more willing to establish extensive ties with industry. Similarly skewed distributions in payments have been shown in other medical subspecialties including neurosurgery, plastic surgery, otolaryngology, and orthopedics.4,6,19,20 It also is apparent that the majority of compensated dermatologists in the OPD maintain relatively small ties with industry. For every year from 2017 to 2021, more than half of compensated dermatologists received total payments of less than $500 per year, most of which stemmed from the food and beverage category. Interestingly, a prior study showed that patient perceptions of industry-physician ties may be more strongly impacted by the payment category than the amount.21 For example, respondents viewed payments for meals and lodging more negatively, as they were seen more as personal gifts without direct benefit to patients. Conversely, respondents held more positive views of physicians who received free drug samples, which were perceived as benefiting patients, as well as those receiving consulting fees, which were perceived as a signal of physician expertise. Notably, in the same study, physicians who received no payments from industry were seen as honest but also were viewed by some respondents as being inexperienced or uninformed about new treatments.21
The contribution and public perception of dermatologists who conduct investigator-initiated research utilizing other types of funding (eg, government grants) also are important to consider but were not directly assessed within the scope of the current study.
Sex Disparities in Compensation—Multiple studies in the literature have demonstrated that sex inequities exist across medical specialties.22,23 In dermatology, although women make up slightly more than 50% of board-certified dermatologists, they continue to be underrepresented compared with men in leadership positions, academic rank, research funding, and lectureships at national meetings.24-27 In survey-based studies specifically examining gender-based physician compensation, male dermatologists were found to earn higher salaries than their female counterparts in both private practice and academic settings, even after adjusting for work hours, practice characteristics, and academic rank.28,29
Our study contributes to the growing body of evidence suggesting that sex inequities also may exist with regard to financial payments from industry. Our results showed that, although the number of male and female dermatologists with industry relationships was similar each year, the number of payments made and total payment amount were both significantly (P<.001) higher for male dermatologists from 2017 through 2021. In 2021, the mean payment amount ($201.57 for male dermatologists; $117.73 for female dermatologists) and mean total amount of payments received ($6172.89 and $2957.79, respectively) also were significantly higher for male compared with female dermatologists (P<.001). The cause of this disparity likely is multifactorial and warrants additional studies in the future. One hypothesis in the existing literature is that male physicians may be more inclined to seek out relationships with industry; it also is possible that disparities in research funding, academic rank, and speaking opportunities at national conferences detailed previously may contribute to inequities in industry payments as companies seek out perceived leaders in the field.30
Limitations and Future Directions—Several important limitations of our study warrant further consideration. As with any database study, the accuracy of the results presented and the conclusions drawn are highly dependent on the precision of the available data, which is reliant on transparent documentation by pharmaceutical companies and physicians. There are no independent methods of verifying the information reported. There have been reports in the literature questioning the utility of the OPD data and risk for misinterpretation.16,31 Furthermore, the OPD only includes companies whose products are covered by government-sponsored programs, such as Medicare and Medicaid, and therefore does not encompass the totality of industry-dermatologist relationships. We also focused specifically on board-certified dermatologists and did not analyze the extent of industry relationships involving residents, nurses, physician assistants, and other critical members of health care teams that may impact patient care. Differences between academic and private practice payments also could not be examined using the OPD but could present an interesting area for future studies.
Despite these limitations, our study was extensive, using the publicly available OPD to analyze trends and disparities in financial relationships between dermatologists and industry partners from 2017 through 2021. Notably, these findings are not intended to provide judgment or seek to tease out financial relationships that are beneficial for patient care from those that are not; rather, they are intended only to lend additional transparency, provoke thought, and encourage future studies and discussion surrounding this important topic.
Conclusion
Financial relationships between dermatologists and industry are complex and are becoming more prevalent, as shown in our study. These relationships may be critical to facilitate novel patient-centered research and growth in the field of dermatology; however, they also have the potential to be seen as bias in patient care. Transparent reporting of these relationships is an important step in future research regarding the effects of different payment types and serves as the basis for further understanding industry-dermatologist relationships as well as any inequities that exist in the distribution of payments. We encourage all dermatologists to review their public profiles in the OPD. Physicians have the opportunity to review all payment data reported by companies and challenge the accuracy of the data if necessary.
- Campbell EG, Gruen RL, Mountford J, et al. A national survey of physician-industry relationships. N Engl J Med. 2007;356:1742-1750.
- Kirschner NM, Sulmasy LS, Kesselheim AS. Health policy basics: the Physician Payment Sunshine Act and the Open Payments program. Ann Intern Med. 2014;161:519-521.
- Braithwaite J, Frane N, Partan MJ, et al. Review of industry payments to general orthopaedic surgeons reported by the open payments database: 2014 to 2019. J Am Acad Orthop Surg Glob Res Rev. 2021;5:E21.00060.
- Pathak N, Mercier MR, Galivanche AR, et al. Industry payments to orthopedic spine surgeons reported by the open payments database: 2014-2017. Clin Spine Surg. 2020;33:E572-E578.
- Almaguer AM, Wills BW, Robin JX, et al. Open payments reporting of industry compensation for orthopedic residents. J Surg Educ. 2020;77:1632-1637.
- Chao AH, Gangopadhyay N. Industry financial relationships in plastic surgery: analysis of the sunshine act open payments database. Plast Reconstr Surg. 2016;138:341E-348E.
- Khetpal S, Mets EJ, Ahmad M, et al. The open payments sunshine act database revisited: a 5-year analysis of industry payments to plastic surgeons. Plast Reconstr Surg. 2021;148:877E-878E.
- Slentz DH, Nelson CC, Lichter PR. Characteristics of industry payments to ophthalmologists in the open payments database. JAMA Ophthalmol. 2019;137:1038-1044.
- Gangireddy VGR, Amin R, Yu K, et al. Analysis of payments to GI physicians in the United States: open payments data study. JGH Open. 2020;4:1031-1036.
- Feng H, Wu P, Leger M. Exploring the industry-dermatologist financial relationship: insight from the open payment data. JAMA Dermatol. 2016;152:1307-1313.
- Schlager E, Flaten H, St Claire C, et al. Industry payments to dermatologists: updates from the 2016 open payment data. Dermatol Online J. 2018;24:13030/qt8r74w3c4.
- Agrawal S, Brennan N, Budetti P. The Sunshine Act—effects on physicians. N Engl J Med. 2013;368:2054-2057.
- DeJong C, Aguilar T, Tseng CW, et al. Pharmaceutical industry-sponsored meals and physician prescribing patterns for Medicare beneficiaries. JAMA Intern Med. 2016;176:1114-1122.
- Lexchin J, Bero LA, Djulbegovic B, et al. Pharmaceutical industry sponsorship and research outcome and quality: systematic review. BMJ. 2003;326:1167-1170.
- Nakayama DK. In defense of industry-physician relationships. Am Surg. 2010;76:987-994.
- Chimonas S, DeVito NJ, Rothman DJ. Bringing transparency to medicine: exploring physicians’ views and experiences of the sunshine act. Am J Bioeth. 2017;17:4-18.
- Pham-Kanter G, Mello MM, Lehmann LS, et la. Public awareness of and contact with physicians who receive industry payments: a national survey. J Gen Intern Med. 2017;32:767-774.
- National Health Expenditure Fact Sheet. Updated December 13, 2023 Accessed August 9, 2024. https://www.cms.gov/data-research/statistics-trends-and-reports/national-health-expenditure-data/nhe-fact-sheet
- de Lotbiniere-Bassett MP, McDonald PJ. Industry financial relationships in neurosurgery in 2015: analysis of the Sunshine Act Open Payments database. World Neurosurg. 2018;114:E920-E925.
- Pathak N, Fujiwara RJT, Mehra S. Assessment of nonresearch industry payments to otolaryngologists in 2014 and 2015. Otolaryngol Head Neck Surg. 2018;158:1028-1034.
- Perry JE, Cox D, Cox AD. Trust and transparency: patient perceptions of physicians’ financial relationships with pharmaceutical companies. J Law Med Ethics. 2014;42:475-491.
- Freund KM, Raj A, Kaplan SE, et al. Inequities in academic compensation by gender: a follow-up to the national faculty survey cohort study. Acad Med. 2016;91:1068-1073.
- Seabury SA, Chandra A, Jena AB. Trends in the earnings of male and female health care professionals in the United States, 1987 to 2010. JAMA Intern Med. 2013;173:1748-1750.
- Flaten HK, Goodman L, Wong E, et al. Analysis of speaking opportunities by gender at national dermatologic surgery conferences. Dermatol Surg. 2020;46:1195-1201.
- Lobl M, Grinnell M, Higgins S, et al. Representation of women as editors in dermatology journals: a comprehensive review. Int J Womens Dermatol. 2020;6:20-24.
- Stratman H, Stratman EJ. Assessment of percentage of women in the dermatology workforce presenting at American Academy of Dermatology annual meetings, 1992-2017. JAMA Dermatol. 2019;155:384-386.
- Wu AG, Lipner SR. Sex trends in leadership of the American Academy of Dermatology: a cross-sectional study. J Am Acad Dermatol. 2020;83:592-594.
- Weeks WB, Wallace AE. Gender differences in dermatologists’ annual incomes. Cutis. 2007;80:325-332.
- Sachdeva M, Price KN, Hsiao JL, et al. Gender and rank salary trends among academic dermatologists. Int J Womens Dermatol. 2020;6:324-326.
- Rose SL, Sanghani RM, Schmidt C, et al. Gender differences in physicians’ financial ties to industry: a study of national disclosure data. PLoS One. 2015;10:E0129197.
- Santhakumar S, Adashi EY. The physician payment sunshine act: testing the value of transparency. JAMA. 2015;313:23-24.
Financial relationships between physicians and industry are prevalent and complex and may have implications for patient care. A 2007 study reported that 94% of 3167 physicians surveyed had established some form of paid relationship with companies in the pharmaceutical industry.1 To facilitate increased transparency around these relationships, lawmakers passed the Physician Payments Sunshine Act in 2010, which requires pharmaceutical companies and device manufacturers to report all payments made to physicians.2 Mandatory disclosures include meals, honoraria, travel expenses, grants, and ownership or investment interests greater than $10. The information is displayed publicly in the Open Payments database (OPD)(https://openpayments-data.cms.gov/), a platform run by the Centers for Medicare and Medicaid Services.
The OPD allows for in-depth analyses of industry payments made to physicians. Many medical specialties—including orthopedics,3-5 plastic surgery,6,7 ophthalmology,8 and gastroenterology9—have published extensive literature characterizing the nature of these payments and disparities in the distribution of payments based on sex, geographic distribution, and other factors. After the first full year of OPD data collection for dermatology in 2014, Feng et al10 examined the number, amount, and nature of industry payments to dermatologists, as well as their geographic distribution for that year. As a follow-up to this initial research, Schlager et al11 characterized payments made to dermatologists for the year 2016 and found an increase in the total payments, mean payments, and number of dermatologists receiving payments compared with the 2014 data.
Our study aimed to characterize the last 5 years of available OPD data—from January 1, 2017, to December 31, 2021—to further explore trends in industry payments made to dermatologists. In particular, we examined the effects of the COVID-19 pandemic on payments as well as sex disparities and the distribution of industry payments.
Methods
We performed a retrospective analysis of the OPD for the general payment datasets from January 1, 2017, to December 31, 2021. The results were filtered to include only payments made to dermatologists, excluding physicians from other specialties, physician assistants, and other types of practitioners. Data for each physician were grouped by National Provider Identifier (NPI) for providers included in the set, allowing for analysis at the individual level. Data on sex were extracted from the National Plan & Provider Enumeration System’s monthly data dissemination for NPIs for July 2023 (when the study was conducted) and were joined to the OPD data using the NPI number reported for each physician. All data were extracted, transformed, and analyzed using R software (version 4.2.1). Figures and visualizations were produced using Microsoft Excel 2016.
Results
In 2017, a total of 358,884 payments were made by industry to dermatologists, accounting for nearly $58.0 million. The mean total value of payments received per dermatologist was $5231.74, and the mean payment amount was $161.49. In 2018, the total number of payments increased year-over-year by 5.5% (378,509 payments), the total value of payments received increased by 7.5% (approximately $62.3 million), and the mean total value of payments received per dermatologist increased by 5.3% ($5508.98). In 2019, the total number of payments increased by 3.0% (389,670 total payments), the total value of payments recieved increased by 13.2% (approximately $70.5 million), and the mean total value of payments received per dermatologist increased by 11.3% ($6133.45). All of these values decreased in 2020, likely due to COVID-19–related restrictions on travel and meetings (total number of payments, 208,470 [−46.5%]; total value of payments received, approximately $37.5 million [−46.9%], mean total value of payments received per dermatologist, $3757.27 [−38.7%]), but the mean payment amount remained stable at $179.47. In 2021, the total number of payments (295,808 [+41.9%]), total value of payments received (approximately $50.3 million [+34.4%]), and mean total value of payments received per dermatologist ($4707.88 [+25.3%]) all rebounded, but not to pre-2020 levels (Table 1). When looking at the geographic distribution of payments, the top 5 states receiving the highest total value of payments during the study period included California ($41.51 million), New York ($32.26 million), Florida ($21.38 million), Texas ($19.93 million), and Pennsylvania ($11.69 million).
For each year from 2017 to 2021, more than 80% of payments made to dermatologists were less than $50. The majority (60.7%–75.8%) were in the $10 to $50 range. Between 4% and 5% of payments were more than $1000 for each year. Fewer than 10% of dermatologists received more than $5000 in total payments per year. Most dermatologists (33.3%–36.9%) received $100 to $500 per year. The distribution of payments stratified by number of payments made by amount and payment amount per dermatologist is further delineated in Table 2.
Among dermatologists who received industry payments in 2017, slightly more than half (50.9%) were male; however, male dermatologists accounted for more than $40.1 million of the more than $57.6 million total payments made to dermatologists (69.6%) that year. Male dermatologists received a mean payment amount of $198.26, while female dermatologists received a significantly smaller amount of $113.52 (P<.001). The mean total value of payments received per male dermatologist was $7204.36, while the mean total value for female dermatologists was $3272.16 (P<.001). The same statistically significant disparities in mean payment amount and mean total value of payments received by male vs female dermatologists were observed for every year from 2017 through 2021 (Table 3).
Comment
Benefits of Physician Relationships With Industry—The Physician Payments Sunshine Act increased transparency of industry payments to physicians by creating the OPD through which these relationships can be reported.12 The effects of these relationships on treatment practices have been the subject of many studies in recent years. Some have suggested that industry ties may impact prescription patterns of endorsed medications.13 It also has been reported that the chance of a research study identifying a positive outcome for a particular treatment is higher when the study is funded by a pharmaceutical company compared to other sponsors.14 On the other hand, some researchers have argued that, when established and maintained in an ethical manner, industry-physician relationships may help practitioners stay updated on the newest treatment paradigms and benefit patient care.15 Industry relationships may help drive innovation of new products with direct input from frontline physicians who take care of the patients these products aim to help.
Limitations of the OPD—Critics of the OPD have argued that the reported data lack sufficient context and are not easily interpretable by most patients.16 In addition, many patients might not know about the existence of the database. Indeed, one national survey-based study showed that only 12% of 3542 respondents knew that this information was publicly available, and only 5% knew whether their own physician had received industry payments.17
Increased Payments From Industry—Our analysis builds on previously reported data in dermatology from 2014 to 2016.10,11 We found that the trends of increasing numbers and dollar amounts of payments made by industry to dermatologists continued from 2017 to 2019, which may reflect the intended effects of the Physician Payments Sunshine Act, as more payments are being reported in a transparent manner. It also shows that relationships between industry and dermatologists have become more commonplace over time.
It is important to consider these trends in the context of overall Medicare expenditures and prescription volumes. Between 2008 and 2021, prescription volumes have been increasing at a rate of 1% to 4% per year, with 2020 being an exception as the volume decreased slightly from the year prior due to COVID-19 (−3%). Similarly, total Medicare and Medicaid expenditures have been growing at a rate of almost 5% per year.18 Based on our study results, it appears the total value of payments made between 2017 and 2021 increased at a rate that outpaced prescription volume and expenditures; however, it is difficult to draw conclusions about the relationship between payments made to dermatologists and spending without examining prescriptions specific to dermatologists in the OPD dataset. This relationship could be further explored in future studies.
COVID-19 Restrictions Impacted Payments in 2021—We hypothesize that COVID-19–related restrictions on traveling and in-person meetings led to a decrease in the number of payments, total payment amount, and mean total value of payments received per dermatologist. Notably, compensation for services other than consulting, including speaking fees, had the most precipitous decrease in total payment amount. On the other hand, honoraria and consulting fees were least impacted, as many dermatologists were still able to maintain relationships with industry on an advisory basis without traveling. From 2020 to 2021, the number of total payments and dollar amounts increased with easing of COVID-19 restrictions; however, they had not yet rebounded to 2019 levels during the study period. It will be interesting to continue monitoring these trends once data from future years become available.
Top-Compensated Dermatologists—Our study results also show that for all years from 2017 through 2021, the majority of industry payments were made to a small concentrated percentage of top-compensated dermatologists, which may reflect larger and more frequent payments to those identified by pharmaceutical companies as thought leaders and key opinion leaders in the field or those who are more willing to establish extensive ties with industry. Similarly skewed distributions in payments have been shown in other medical subspecialties including neurosurgery, plastic surgery, otolaryngology, and orthopedics.4,6,19,20 It also is apparent that the majority of compensated dermatologists in the OPD maintain relatively small ties with industry. For every year from 2017 to 2021, more than half of compensated dermatologists received total payments of less than $500 per year, most of which stemmed from the food and beverage category. Interestingly, a prior study showed that patient perceptions of industry-physician ties may be more strongly impacted by the payment category than the amount.21 For example, respondents viewed payments for meals and lodging more negatively, as they were seen more as personal gifts without direct benefit to patients. Conversely, respondents held more positive views of physicians who received free drug samples, which were perceived as benefiting patients, as well as those receiving consulting fees, which were perceived as a signal of physician expertise. Notably, in the same study, physicians who received no payments from industry were seen as honest but also were viewed by some respondents as being inexperienced or uninformed about new treatments.21
The contribution and public perception of dermatologists who conduct investigator-initiated research utilizing other types of funding (eg, government grants) also are important to consider but were not directly assessed within the scope of the current study.
Sex Disparities in Compensation—Multiple studies in the literature have demonstrated that sex inequities exist across medical specialties.22,23 In dermatology, although women make up slightly more than 50% of board-certified dermatologists, they continue to be underrepresented compared with men in leadership positions, academic rank, research funding, and lectureships at national meetings.24-27 In survey-based studies specifically examining gender-based physician compensation, male dermatologists were found to earn higher salaries than their female counterparts in both private practice and academic settings, even after adjusting for work hours, practice characteristics, and academic rank.28,29
Our study contributes to the growing body of evidence suggesting that sex inequities also may exist with regard to financial payments from industry. Our results showed that, although the number of male and female dermatologists with industry relationships was similar each year, the number of payments made and total payment amount were both significantly (P<.001) higher for male dermatologists from 2017 through 2021. In 2021, the mean payment amount ($201.57 for male dermatologists; $117.73 for female dermatologists) and mean total amount of payments received ($6172.89 and $2957.79, respectively) also were significantly higher for male compared with female dermatologists (P<.001). The cause of this disparity likely is multifactorial and warrants additional studies in the future. One hypothesis in the existing literature is that male physicians may be more inclined to seek out relationships with industry; it also is possible that disparities in research funding, academic rank, and speaking opportunities at national conferences detailed previously may contribute to inequities in industry payments as companies seek out perceived leaders in the field.30
Limitations and Future Directions—Several important limitations of our study warrant further consideration. As with any database study, the accuracy of the results presented and the conclusions drawn are highly dependent on the precision of the available data, which is reliant on transparent documentation by pharmaceutical companies and physicians. There are no independent methods of verifying the information reported. There have been reports in the literature questioning the utility of the OPD data and risk for misinterpretation.16,31 Furthermore, the OPD only includes companies whose products are covered by government-sponsored programs, such as Medicare and Medicaid, and therefore does not encompass the totality of industry-dermatologist relationships. We also focused specifically on board-certified dermatologists and did not analyze the extent of industry relationships involving residents, nurses, physician assistants, and other critical members of health care teams that may impact patient care. Differences between academic and private practice payments also could not be examined using the OPD but could present an interesting area for future studies.
Despite these limitations, our study was extensive, using the publicly available OPD to analyze trends and disparities in financial relationships between dermatologists and industry partners from 2017 through 2021. Notably, these findings are not intended to provide judgment or seek to tease out financial relationships that are beneficial for patient care from those that are not; rather, they are intended only to lend additional transparency, provoke thought, and encourage future studies and discussion surrounding this important topic.
Conclusion
Financial relationships between dermatologists and industry are complex and are becoming more prevalent, as shown in our study. These relationships may be critical to facilitate novel patient-centered research and growth in the field of dermatology; however, they also have the potential to be seen as bias in patient care. Transparent reporting of these relationships is an important step in future research regarding the effects of different payment types and serves as the basis for further understanding industry-dermatologist relationships as well as any inequities that exist in the distribution of payments. We encourage all dermatologists to review their public profiles in the OPD. Physicians have the opportunity to review all payment data reported by companies and challenge the accuracy of the data if necessary.
- Campbell EG, Gruen RL, Mountford J, et al. A national survey of physician-industry relationships. N Engl J Med. 2007;356:1742-1750.
- Kirschner NM, Sulmasy LS, Kesselheim AS. Health policy basics: the Physician Payment Sunshine Act and the Open Payments program. Ann Intern Med. 2014;161:519-521.
- Braithwaite J, Frane N, Partan MJ, et al. Review of industry payments to general orthopaedic surgeons reported by the open payments database: 2014 to 2019. J Am Acad Orthop Surg Glob Res Rev. 2021;5:E21.00060.
- Pathak N, Mercier MR, Galivanche AR, et al. Industry payments to orthopedic spine surgeons reported by the open payments database: 2014-2017. Clin Spine Surg. 2020;33:E572-E578.
- Almaguer AM, Wills BW, Robin JX, et al. Open payments reporting of industry compensation for orthopedic residents. J Surg Educ. 2020;77:1632-1637.
- Chao AH, Gangopadhyay N. Industry financial relationships in plastic surgery: analysis of the sunshine act open payments database. Plast Reconstr Surg. 2016;138:341E-348E.
- Khetpal S, Mets EJ, Ahmad M, et al. The open payments sunshine act database revisited: a 5-year analysis of industry payments to plastic surgeons. Plast Reconstr Surg. 2021;148:877E-878E.
- Slentz DH, Nelson CC, Lichter PR. Characteristics of industry payments to ophthalmologists in the open payments database. JAMA Ophthalmol. 2019;137:1038-1044.
- Gangireddy VGR, Amin R, Yu K, et al. Analysis of payments to GI physicians in the United States: open payments data study. JGH Open. 2020;4:1031-1036.
- Feng H, Wu P, Leger M. Exploring the industry-dermatologist financial relationship: insight from the open payment data. JAMA Dermatol. 2016;152:1307-1313.
- Schlager E, Flaten H, St Claire C, et al. Industry payments to dermatologists: updates from the 2016 open payment data. Dermatol Online J. 2018;24:13030/qt8r74w3c4.
- Agrawal S, Brennan N, Budetti P. The Sunshine Act—effects on physicians. N Engl J Med. 2013;368:2054-2057.
- DeJong C, Aguilar T, Tseng CW, et al. Pharmaceutical industry-sponsored meals and physician prescribing patterns for Medicare beneficiaries. JAMA Intern Med. 2016;176:1114-1122.
- Lexchin J, Bero LA, Djulbegovic B, et al. Pharmaceutical industry sponsorship and research outcome and quality: systematic review. BMJ. 2003;326:1167-1170.
- Nakayama DK. In defense of industry-physician relationships. Am Surg. 2010;76:987-994.
- Chimonas S, DeVito NJ, Rothman DJ. Bringing transparency to medicine: exploring physicians’ views and experiences of the sunshine act. Am J Bioeth. 2017;17:4-18.
- Pham-Kanter G, Mello MM, Lehmann LS, et la. Public awareness of and contact with physicians who receive industry payments: a national survey. J Gen Intern Med. 2017;32:767-774.
- National Health Expenditure Fact Sheet. Updated December 13, 2023 Accessed August 9, 2024. https://www.cms.gov/data-research/statistics-trends-and-reports/national-health-expenditure-data/nhe-fact-sheet
- de Lotbiniere-Bassett MP, McDonald PJ. Industry financial relationships in neurosurgery in 2015: analysis of the Sunshine Act Open Payments database. World Neurosurg. 2018;114:E920-E925.
- Pathak N, Fujiwara RJT, Mehra S. Assessment of nonresearch industry payments to otolaryngologists in 2014 and 2015. Otolaryngol Head Neck Surg. 2018;158:1028-1034.
- Perry JE, Cox D, Cox AD. Trust and transparency: patient perceptions of physicians’ financial relationships with pharmaceutical companies. J Law Med Ethics. 2014;42:475-491.
- Freund KM, Raj A, Kaplan SE, et al. Inequities in academic compensation by gender: a follow-up to the national faculty survey cohort study. Acad Med. 2016;91:1068-1073.
- Seabury SA, Chandra A, Jena AB. Trends in the earnings of male and female health care professionals in the United States, 1987 to 2010. JAMA Intern Med. 2013;173:1748-1750.
- Flaten HK, Goodman L, Wong E, et al. Analysis of speaking opportunities by gender at national dermatologic surgery conferences. Dermatol Surg. 2020;46:1195-1201.
- Lobl M, Grinnell M, Higgins S, et al. Representation of women as editors in dermatology journals: a comprehensive review. Int J Womens Dermatol. 2020;6:20-24.
- Stratman H, Stratman EJ. Assessment of percentage of women in the dermatology workforce presenting at American Academy of Dermatology annual meetings, 1992-2017. JAMA Dermatol. 2019;155:384-386.
- Wu AG, Lipner SR. Sex trends in leadership of the American Academy of Dermatology: a cross-sectional study. J Am Acad Dermatol. 2020;83:592-594.
- Weeks WB, Wallace AE. Gender differences in dermatologists’ annual incomes. Cutis. 2007;80:325-332.
- Sachdeva M, Price KN, Hsiao JL, et al. Gender and rank salary trends among academic dermatologists. Int J Womens Dermatol. 2020;6:324-326.
- Rose SL, Sanghani RM, Schmidt C, et al. Gender differences in physicians’ financial ties to industry: a study of national disclosure data. PLoS One. 2015;10:E0129197.
- Santhakumar S, Adashi EY. The physician payment sunshine act: testing the value of transparency. JAMA. 2015;313:23-24.
Practice Points
- Industry payments to dermatologists are prevalent and complex and may have implications for patient care.
- To facilitate increased transparency around industry-physician relationships, lawmakers passed the Physician Payments Sunshine Act requiring pharmaceutical companies and device manufacturers to report all payments made to physicians.
- We encourage dermatologists to review their public profiles on the Open Payments database, as physicians have the opportunity to challenge the accuracy of the reported data, if applicable.
Closing the Gap: Priority Zones Identified for CRC Screening in Hispanic/Latino Populations
TOPLINE:
Researchers identified thousands of census tracts as priority zones where improving the screening of colorectal cancer (CRC) may benefit Hispanic or Latino communities.
METHODOLOGY:
- Hispanic or Latino individuals have the lowest rate of CRC screening among the six broader census-designated racial or ethnic groups in the United States, while they face a high proportion of cancer deaths due to CRC.
- Researchers performed a cross-sectional ecologic study using 2021 Centers for Disease Control and Prevention PLACES and 2019 American Community Survey data to identify priority zones for CRC screening where intervention programs may be targeted.
- They analyzed a total of 72,136 US census tracts, representing 98.7% of all US census tracts.
- Nine race and ethnic groups were selected on the basis of the population size and categorizations used in prior research on health or cancer disparity: non-Hispanic Black, non-Hispanic White, Asian, Mexican, Puerto Rican, Cuban, Dominican, Central or South American, and “other race.”
- Geographically weighted regression and Getis-Ord Gi* hot spot procedures were used to identify the screening priority zones for all Hispanic or Latino groups.
TAKEAWAY:
- The analysis identified 6519 hot spot tracts for Mexican, 3477 for Puerto Rican, 3522 for Central or South American, 1069 for Dominican, and 1424 for Cuban individuals. The average rates of screening for CRC were 57.2%, 59.9%, 59.3%, 58.9%, and 60.4%, respectively.
- The percentage of Cuban individuals showed a positive association with the CRC screening rate, while the percentage of Mexican, Puerto Rican, Dominican, and Central or South American Hispanic or Latino individuals and of the uninsured showed a negative association with the CRC screening rate.
- The priority zones for Mexican communities were primarily located in Texas and southwestern United States, while those for Puerto Rican, Central or South American, and other populations were located in southern Florida and the metro areas of New York City and Texas.
IN PRACTICE:
“Our findings and interactive web map may serve as a translational tool for public health authorities, policymakers, clinicians, and other stakeholders to target investment and interventions to increase guideline-concordant CRC screening uptake benefiting specific H/L [Hispanic or Latino] communities in the United States,” the authors wrote. “These data can inform more precise neighborhood-level interventions to increase CRC screening considering unique characteristics important for these H/L [Hispanic or Latino] groups.”
SOURCE:
The study, led by R. Blake Buchalter, PhD, MPH, Center for Populations Health Research, Department of Quantitative Health Sciences, Lerner Research Institute, Cleveland Clinic, Cleveland, was published online in the American Journal of Public Health.
LIMITATIONS:
The study’s cross-sectional design limited the ability to infer causality. The use of census tract-level data did not capture individual-level screening behaviors. The study did not account for nativity status or years of migration owing to the lack of data. The Centers for Disease Control and Prevention PLACES dataset may not represent the actual screening delivered as it is based on survey data.
DISCLOSURES:
The National Cancer Institute partially supported this study. The authors declared no conflicts of interest.
This article was created using several editorial tools, including AI, as part of the process. Human editors reviewed this content before publication. A version of this article first appeared on Medscape.com.
When Childhood Cancer Survivors Face Sexual Challenges
Childhood cancers represent a diverse group of neoplasms, and thanks to advances in treatment, survival rates have improved significantly. Today, more than 80%-85% of children diagnosed with cancer in developed countries survive into adulthood.
This increase in survival has brought new challenges, however. Compared with the general population, childhood cancer survivors (CCS) are at a notably higher risk for early mortality, developing secondary cancers, and experiencing various long-term clinical and psychosocial issues stemming from their disease or its treatment.
Long-term follow-up care for CCS is a complex and evolving field. Despite ongoing efforts to establish global and national guidelines, current evidence indicates that the care and management of these patients remain suboptimal.
The disruptions caused by cancer and its treatment can interfere with normal physiological and psychological development, leading to issues with sexual function. This aspect of health is critical as it influences not just physical well-being but also psychosocial, developmental, and emotional health.
Characteristics and Mechanisms
Sexual functioning encompasses the physiological and psychological aspects of sexual behavior, including desire, arousal, orgasm, sexual pleasure, and overall satisfaction.
As CCS reach adolescence or adulthood, they often face sexual and reproductive issues, particularly as they enter romantic relationships.
Sexual functioning is a complex process that relies on the interaction of various factors, including physiological health, psychosexual development, romantic relationships, body image, and desire.
Despite its importance, the impact of childhood cancer on sexual function is often overlooked, even though cancer and its treatments can have lifelong effects.
Sexual Function in CCS
A recent review aimed to summarize the existing research on sexual function among CCS, highlighting assessment tools, key stages of psychosexual development, common sexual problems, and the prevalence of sexual dysfunction.
The review study included 22 studies published between 2000 and 2022, comprising two qualitative, six cohort, and 14 cross-sectional studies.
Most CCS reached all key stages of psychosexual development at an average age of 29.8 years. Although some milestones were achieved later than is typical, many survivors felt they reached these stages at the appropriate time. Sexual initiation was less common among those who had undergone intensive neurotoxic treatments, such as those diagnosed with brain tumors or leukemia in childhood.
In a cross-sectional study of CCS aged 17-39 years, about one third had never engaged in sexual intercourse, 41.4% reported never experiencing sexual attraction, 44.8% were dissatisfied with their sex lives, and many rarely felt sexually attractive to others. Another study found that common issues among CCS included a lack of interest in sex (30%), difficulty enjoying sex (24%), and difficulty becoming aroused (23%). However, comparing and analyzing these problems was challenging due to the lack of standardized assessment criteria.
The prevalence of sexual dysfunction among CCS ranged from 12.3% to 46.5%. For males, the prevalence ranged from 12.3% to 54.0%, while for females, it ranged from 19.9% to 57.0%.
Factors Influencing Sexual Function
The review identified the following four categories of factors influencing sexual function in CCS: Demographic, treatment-related, psychological, and physiological.
Demographic factors: Gender, age, education level, relationship status, income level, and race all play roles in sexual function.
Female survivors reported more severe sexual dysfunction and poorer sexual health than did male survivors. Age at cancer diagnosis, age at evaluation, and the time since diagnosis were closely linked to sexual experiences. Patients diagnosed with cancer during childhood tended to report better sexual function than those diagnosed during adolescence.
Treatment-related factors: The type of cancer and intensity of treatment, along with surgical history, were significant factors. Surgeries involving the spinal cord or sympathetic nerves, as well as a history of prostate or pelvic surgery, were strongly associated with erectile dysfunction in men. In women, pelvic surgeries and treatments to the pelvic area were commonly linked to sexual dysfunction.
The association between treatment intensity and sexual function was noted across several studies, although the results were not always consistent. For example, testicular radiation above 10 Gy was positively correlated with sexual dysfunction. Women who underwent more intensive treatments were more likely to report issues in multiple areas of sexual function, while men in this group were less likely to have children.
Among female CCS, certain types of cancer, such as germ cell tumors, renal tumors, and leukemia, present a higher risk for sexual dysfunction. Women who had CNS tumors in childhood frequently reported problems like difficulty in sexual arousal, low sexual satisfaction, infrequent sexual activity, and fewer sexual partners, compared with survivors of other cancers. Survivors of acute lymphoblastic leukemia and those who underwent hematopoietic stem cell transplantation (HSCT) also showed varying degrees of impaired sexual function, compared with the general population. The HSCT group showed significant testicular damage, including reduced testicular volumes, low testosterone levels, and low sperm counts.
Psychological factors: These factors, such as emotional distress, play a significant role in sexual dysfunction among CCS. Symptoms like anxiety, nervousness during sexual activity, and depression are commonly reported by those with sexual dysfunction. The connection between body image and sexual function is complex. Many CCS with sexual dysfunction express concern about how others, particularly their partners, perceived their altered body image due to cancer and its treatment.
Physiological factors: In male CCS, low serum testosterone levels and low lean muscle mass are linked to an increased risk for sexual dysfunction. Treatments involving alkylating agents or testicular radiation, and surgery or radiotherapy targeting the genitourinary organs or the hypothalamic-pituitary region, can lead to various physiological and endocrine disorders, contributing to sexual dysfunction. Despite these risks, there is a lack of research evaluating sexual function through the lens of the hypothalamic-pituitary-gonadal axis and neuroendocrine pathways.
This story was translated from Univadis Italy using several editorial tools, including AI, as part of the process. Human editors reviewed this content before publication. A version of this article appeared on Medscape.com.
The Use of Tranexamic Acid and Microneedling in the Treatment of Melasma: A Systematic Review
Melasma (also known as chloasma faciei) is a common chronic skin disorder that results in well-demarcated, hyperpigmented, tan to dark patches that mostly appear in sun-exposed areas such as the face and neck and sometimes the arms. The exact prevalence or incidence is not known but is estimated to be 1% to 50% overall depending on the ethnic population and geographic location.1,2 Melasma predominantly affects women, but research has shown that approximately 10% to 20% of men are affected by this condition.3,4 Although melasma can affect patients of all skin types, it primarily affects those with darker skin tones.5 The groups most often affected are women of Black, Hispanic, Middle Eastern, and Southeast Asian ethnicity. Although the pathogenesis is complex and not fully understood, multiple pathways and etiologies have been theorized to cause melasma. Potential causes include exposure to UV radiation, oral contraceptives, hormonal changes, medications, thyroid dysfunction, genetics, and pregnancy.6,7 Cytokines and growth factors, including adipokine and angiopoietin, synthesized by sebaceous glands play a role in the pathogenic mechanism of melasma. Cytokines and growth factors are hypothesized to modulate the function of melanocytes.8 Both melanocytes and sebocytes are controlled by α–melanocyte-stimulating hormone. Therefore, overexpression of α–melanocyte-stimulating hormone will result in overproduction of these 2 cell types, resulting in melasma. Melasma can be classified into 4 subtypes using Wood lamp examination: epidermal, dermal, mixed, or indeterminate.3 Furthermore, melasma is divided into subgroups based on the location: malar region, mandibular region, and centrofacial patch pattern.9,10 The involvement of sebaceous glands in the pathogenesis of melasma may explain the predilection for the centrofacial region, which is the most common pattern.
The severity of melasma can be assessed using the melasma area and severity index (MASI), which is calculated by subjective assessment of 3 main factors: (1) facial area of involvement; (2) darkness of affected region; and (3) homogeneity, with the extent of melasma indicated by a score ranging from 0 to 48.11 The modified MASI (mMASI) subsequently was introduced to assist with assessing the severity of melasma and creating distinct ranges for mild, moderate, and severe cases, ranging from 0 (mild) to 24 (severe).12 Both indices are used in research to assess the improvement of melasma with treatment.
Patients with melasma report a decrease in quality of life, increased emotional stress, and lower self-esteem due to cosmesis.13 Treatment of melasma can be highly challenging and often is complicated by relapsing. Historically, the treatment of melasma has included the use of chemical lightening agents. Additional treatment options include the use of lasers and complex chemical peels,9,10 but these interventions may result in adverse outcomes for individuals with darker skin tones. The current gold-standard treatment is topical hydroquinone and broad-spectrum sunscreen. Although hydroquinone is effective in the treatment of melasma, relapse is common. The goal of melasma management is not only to treat acute hyperpigmentation but also to prevent relapse. Other therapies that currently are being explored for the clinically sustained treatment of melasma include tranexamic acid (TXA)(trans-4-[aminomethyl]cyclohexanecarboxylic acid),9,10 an antifibrinolytic agent routinely used to prevent blood loss during surgery and in the management of menorrhagia. It is a synthetic derivative of lysine and serves as a potent plasmin inhibitor by blocking the lysine-binding sites of plasminogen molecules, thus preventing the conversion of plasminogen to plasmin. It also prevents fibrinolysis and blood loss.
In addition to its hemostatic properties, TXA has been found to have hypopigmentation properties.14,15 Plasminogen also can be found in human epidermal basal cells and human keratinocytes, and it is postulated that TXA’s interaction with these cells explains its hypopigmentation properties. Both UV radiation and hormones activate plasminogen into plasmin, resulting in the activation of tyrosinase and melanogenesis.14,15 Tranexamic acid is postulated to inhibit the keratinocyte-plasminogen pathway, thus leading to the inhibition of UV-induced and hormone-induced pigmentation. Also, TXA serves as a competitive inhibitor for tyrosinase due to its structural similarity to tyrosine.15 The combination of these 2 mechanisms contributes to the skin-lightening effects of TXA, making it a potential treatment for melasma.
Furthermore, the use of microneedling is being explored as a treatment option for melasma. Microneedling creates microscopic punctures in the skin using tiny needles, resulting in a wound-healing response and skin resurfacing. The microneedling technique is utilized to create small holes in the skin, with needle depths that can be adjusted from 0.5 to 3.5 mm to target different layers of the dermis and allow for discreet application of TXA.16 We sought to look at the current literature on the use and effectiveness of microneedling in combination with TXA to treat melasma and prevent relapse.
Methods
A systematic review was performed of PubMed articles indexed for MEDLINE and Embase in November 2021 to compile available articles that studied TXA and microneedling as a treatment for melasma. The PubMed search terms were (melasma) AND (microneedling* OR ‘tranexamic acid’ OR TXA or TA). The Embase search terms were (cholasma OR melasma) AND (tranexamic acid OR TXA) AND (microneedling)(Figure). The search was then limited to ”randomized controlled trial” and ”clinical trial” in English-language journals. Duplicates were excluded. After thorough evaluation, articles that discussed the use of TXA in combination with treatment options other than microneedling also were excluded.
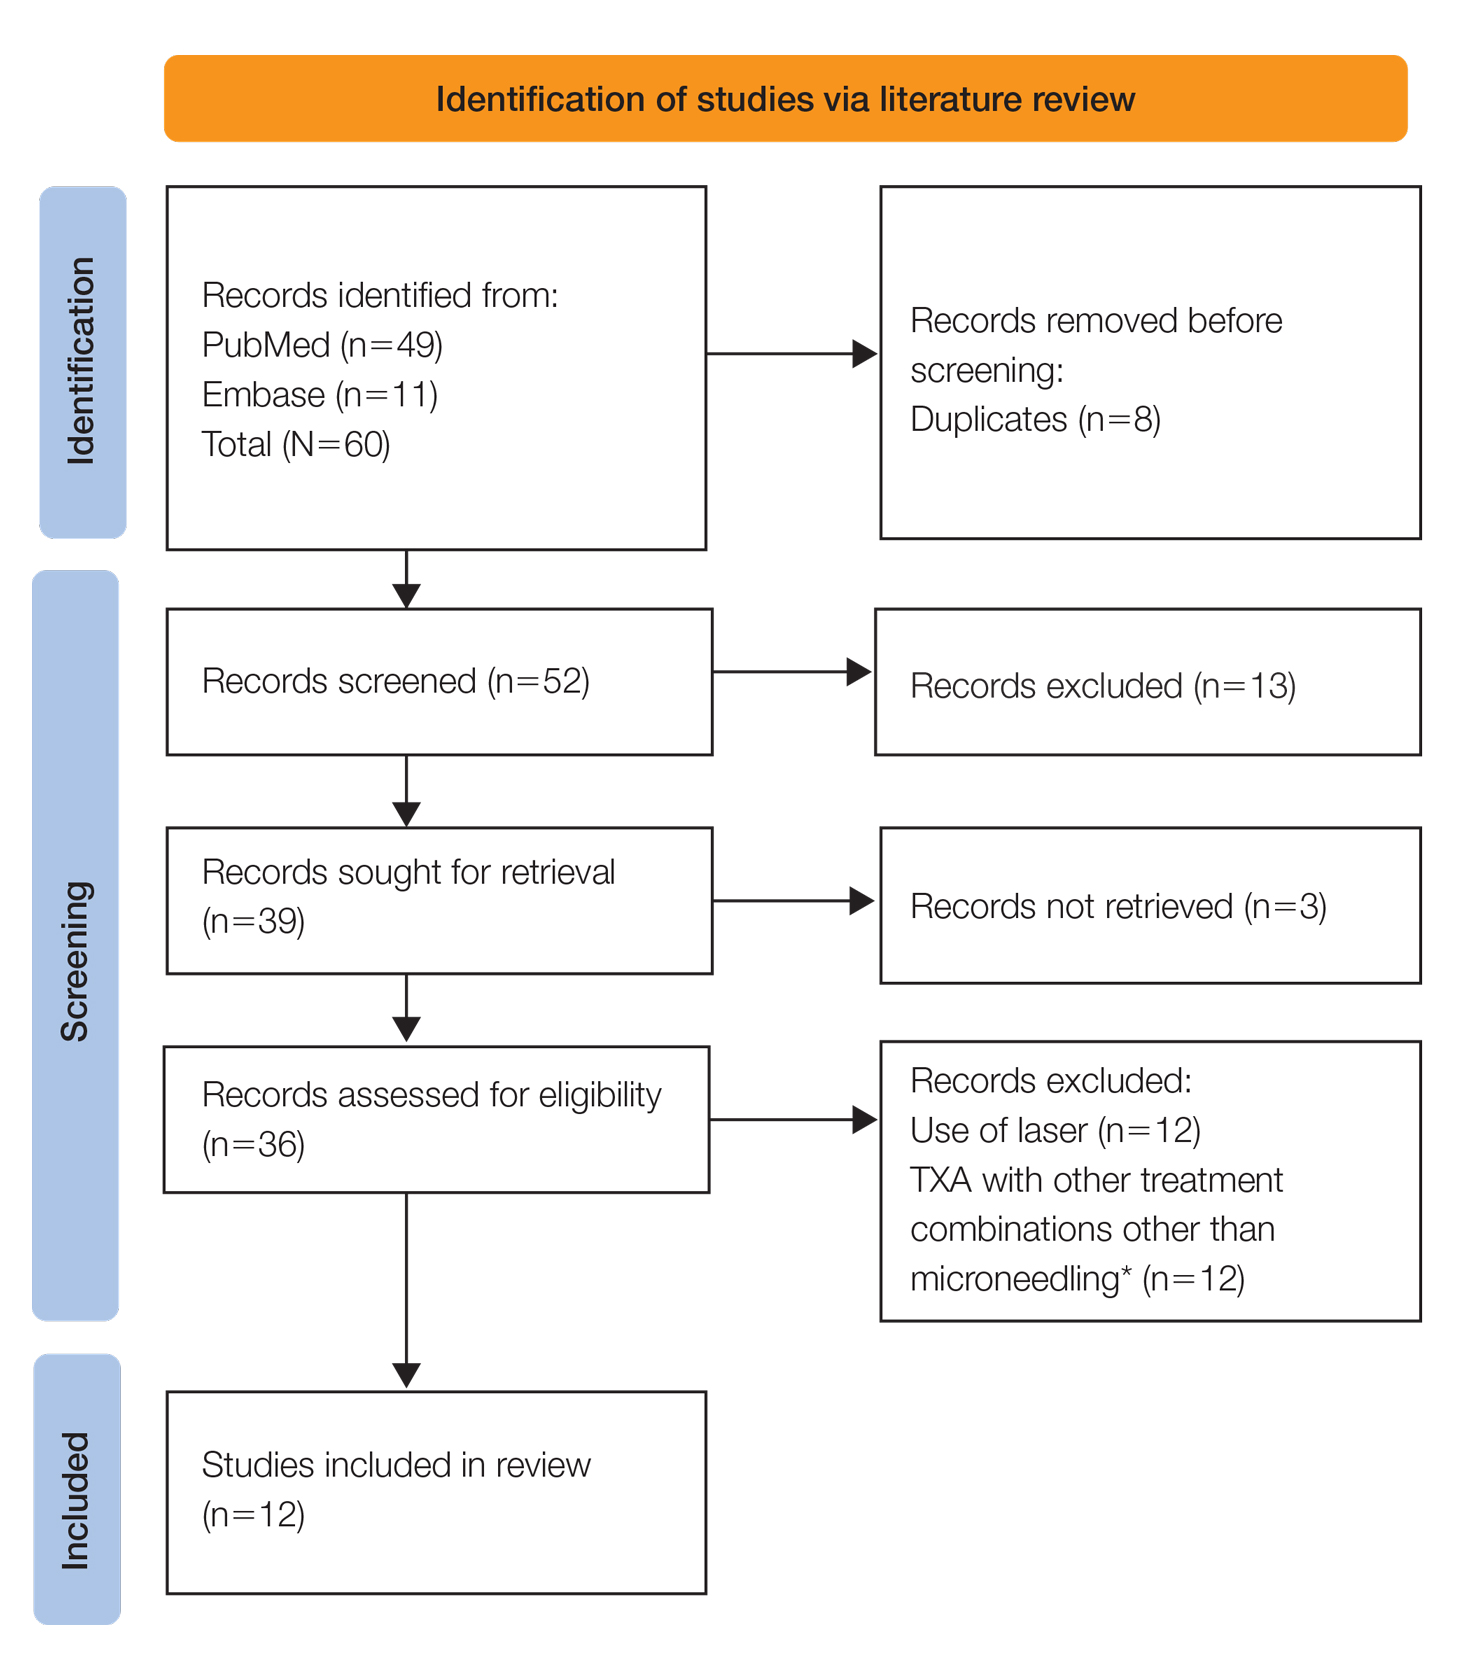
Results
The literature search yielded a total of 12 articles that assessed the effectiveness of TXA and microneedling for the treatment of melasma (Table).17-28 Several articles concluded that TXA was equally effective at reducing melasma lesions when compared with the standard treatment of hydroquinone. Some of the reviewed articles also demonstrated the effectiveness of microneedling in improving melasma lesions as a stand-alone treatment. These studies highlighted the enhanced efficacy of the combined treatment of TXA and microneedling compared with their individual uses.17-28
Comment
Melasma is a common chronic hyperpigmentation disorder, making its treatment clinically challenging. Many patients experience symptom relapses, and limited effective treatment options make achieving complete clearance difficult, underscoring the need for improved therapeutic approaches. Recently, researchers have explored alternative treatments to address the challenges of melasma management. Tranexamic acid is an antifibrinolytic used to prevent blood loss and has emerged as a potential treatment for melasma. Similarly, microneedling—a technique in which multiple punctures are made in the skin to activate and stimulate wound healing and skin rejuvenation—shows promise for melasma.
Oral TXA for Melasma—Oral TXA has been shown to reduce melasma lesions. Del Rosario et al17 recruited 44 women (39 of whom completed the study) with moderate to severe melasma and randomized them into 2 groups: oral TXA and placebo. This study demonstrated a 49% reduction in the mMASI score in all participants taking oral TXA (250 mg twice daily [BID]) compared with an 18% reduction in the control group (placebo capsule BID) after 3 months of treatment. In patients with moderate and severe melasma, 45% and 51% mMASI score reductions were reported in the treatment group, respectively, vs 16% and 19% score reductions in placebo group, respectively. These researchers concluded that oral TXA may be effective at treating moderate to severe melasma. Although patients with severe melasma had a better response to treatment, their improvement was not sustained compared with patients with moderate melasma after a 3-month posttreatment follow-up.17
Microneedling Plus TXA for Melasma—Microneedling alone has been shown to be effective for melasma. El Attar et al18 conducted a split-face study of microneedling (1.5-mm depth) plus topical TXA (0.5 mL)(right side of the face[treatment arm]) compared with microneedling (1.5-mm depth) plus topical vitamin C (0.5 mL)(left side of the face [control group]) in 20 women with melasma. The sessions were repeated every 2 weeks for a total of 6 sessions. Although researchers found no statistically significant differences between the 2 treatment sides, microneedling plus TXA showed a slight advantage over microneedling plus vitamin C in dermoscopic examination. Both sides showed improvement in pigmented lesions, but vitamin C–treated lesions did not show an improvement in vascularity vs TXA.18
Saleh et al19 further showed that combination treatment with microneedling and TXA may improve clinical outcomes better than microneedling alone. Their study demonstrated a reduction in MASI score that was significantly higher in the combination treatment group compared with the microneedling alone group (P=.001). There was a significant reduction in melanoma antigen recognized by T cells 1 (MART-1)–positive cells in the combination treatment group compared with the microneedling alone group (P=.001). Lastly, combined therapy improved melasma patches better than microneedling alone.19
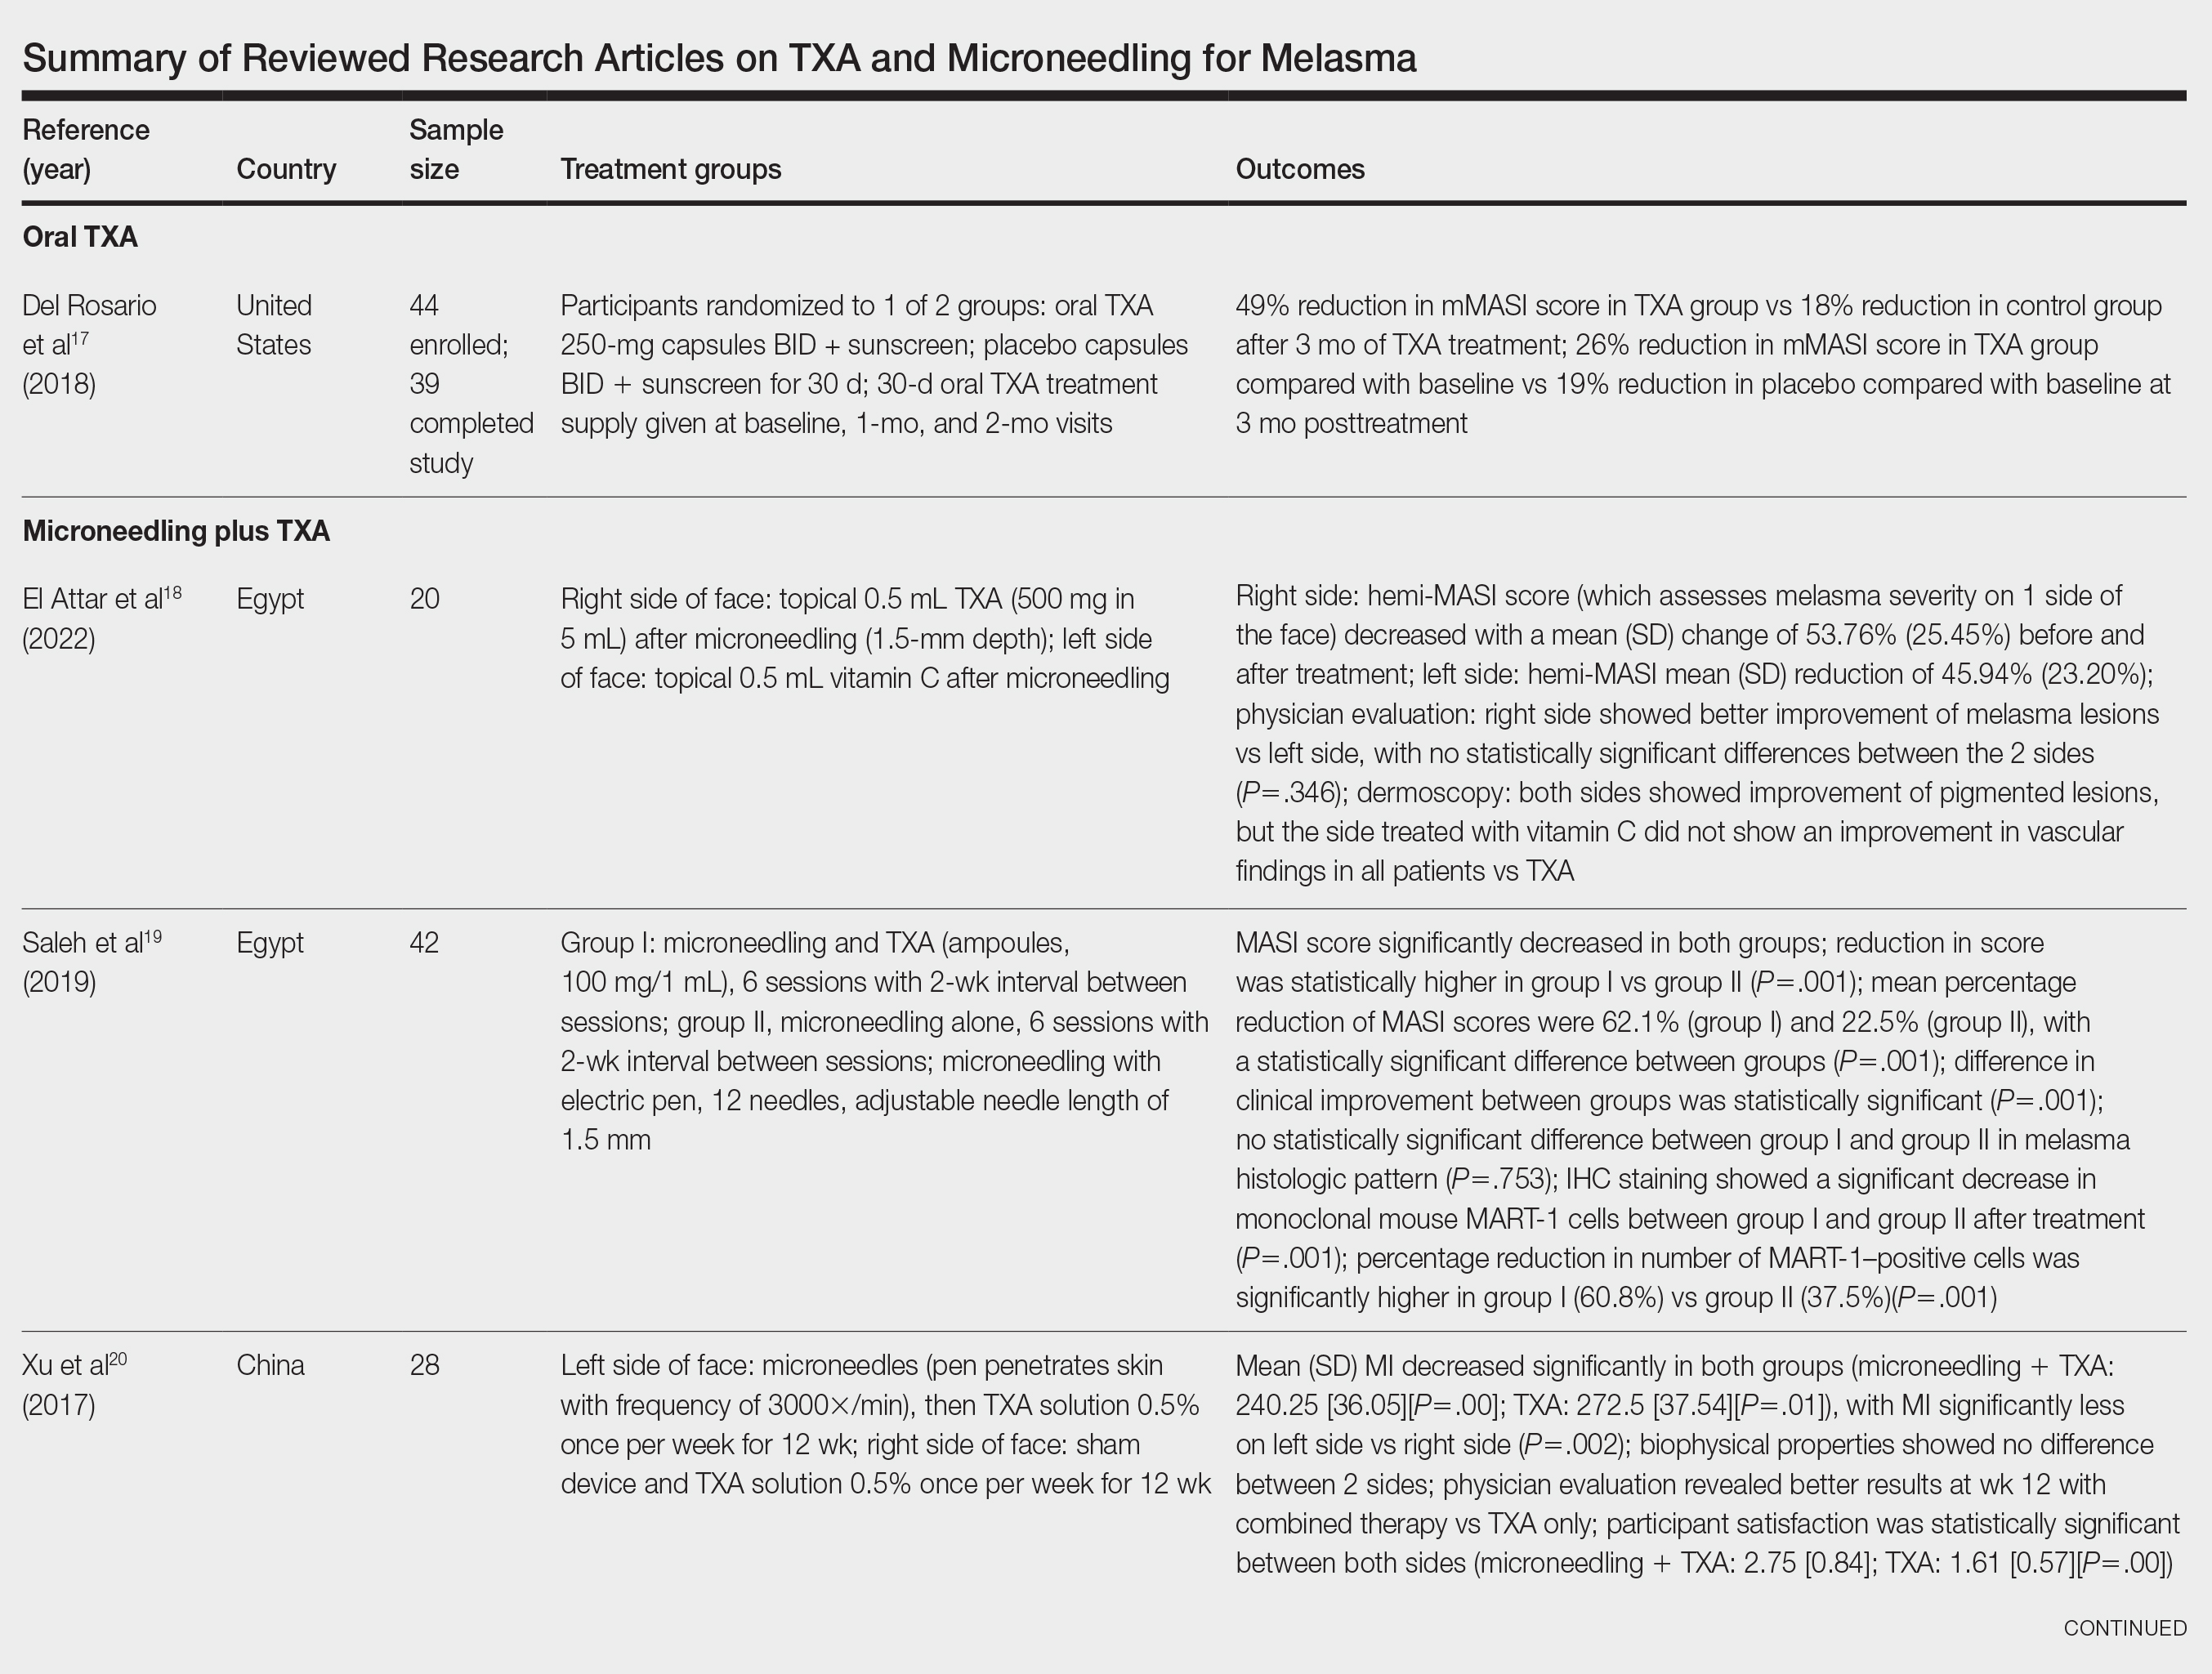
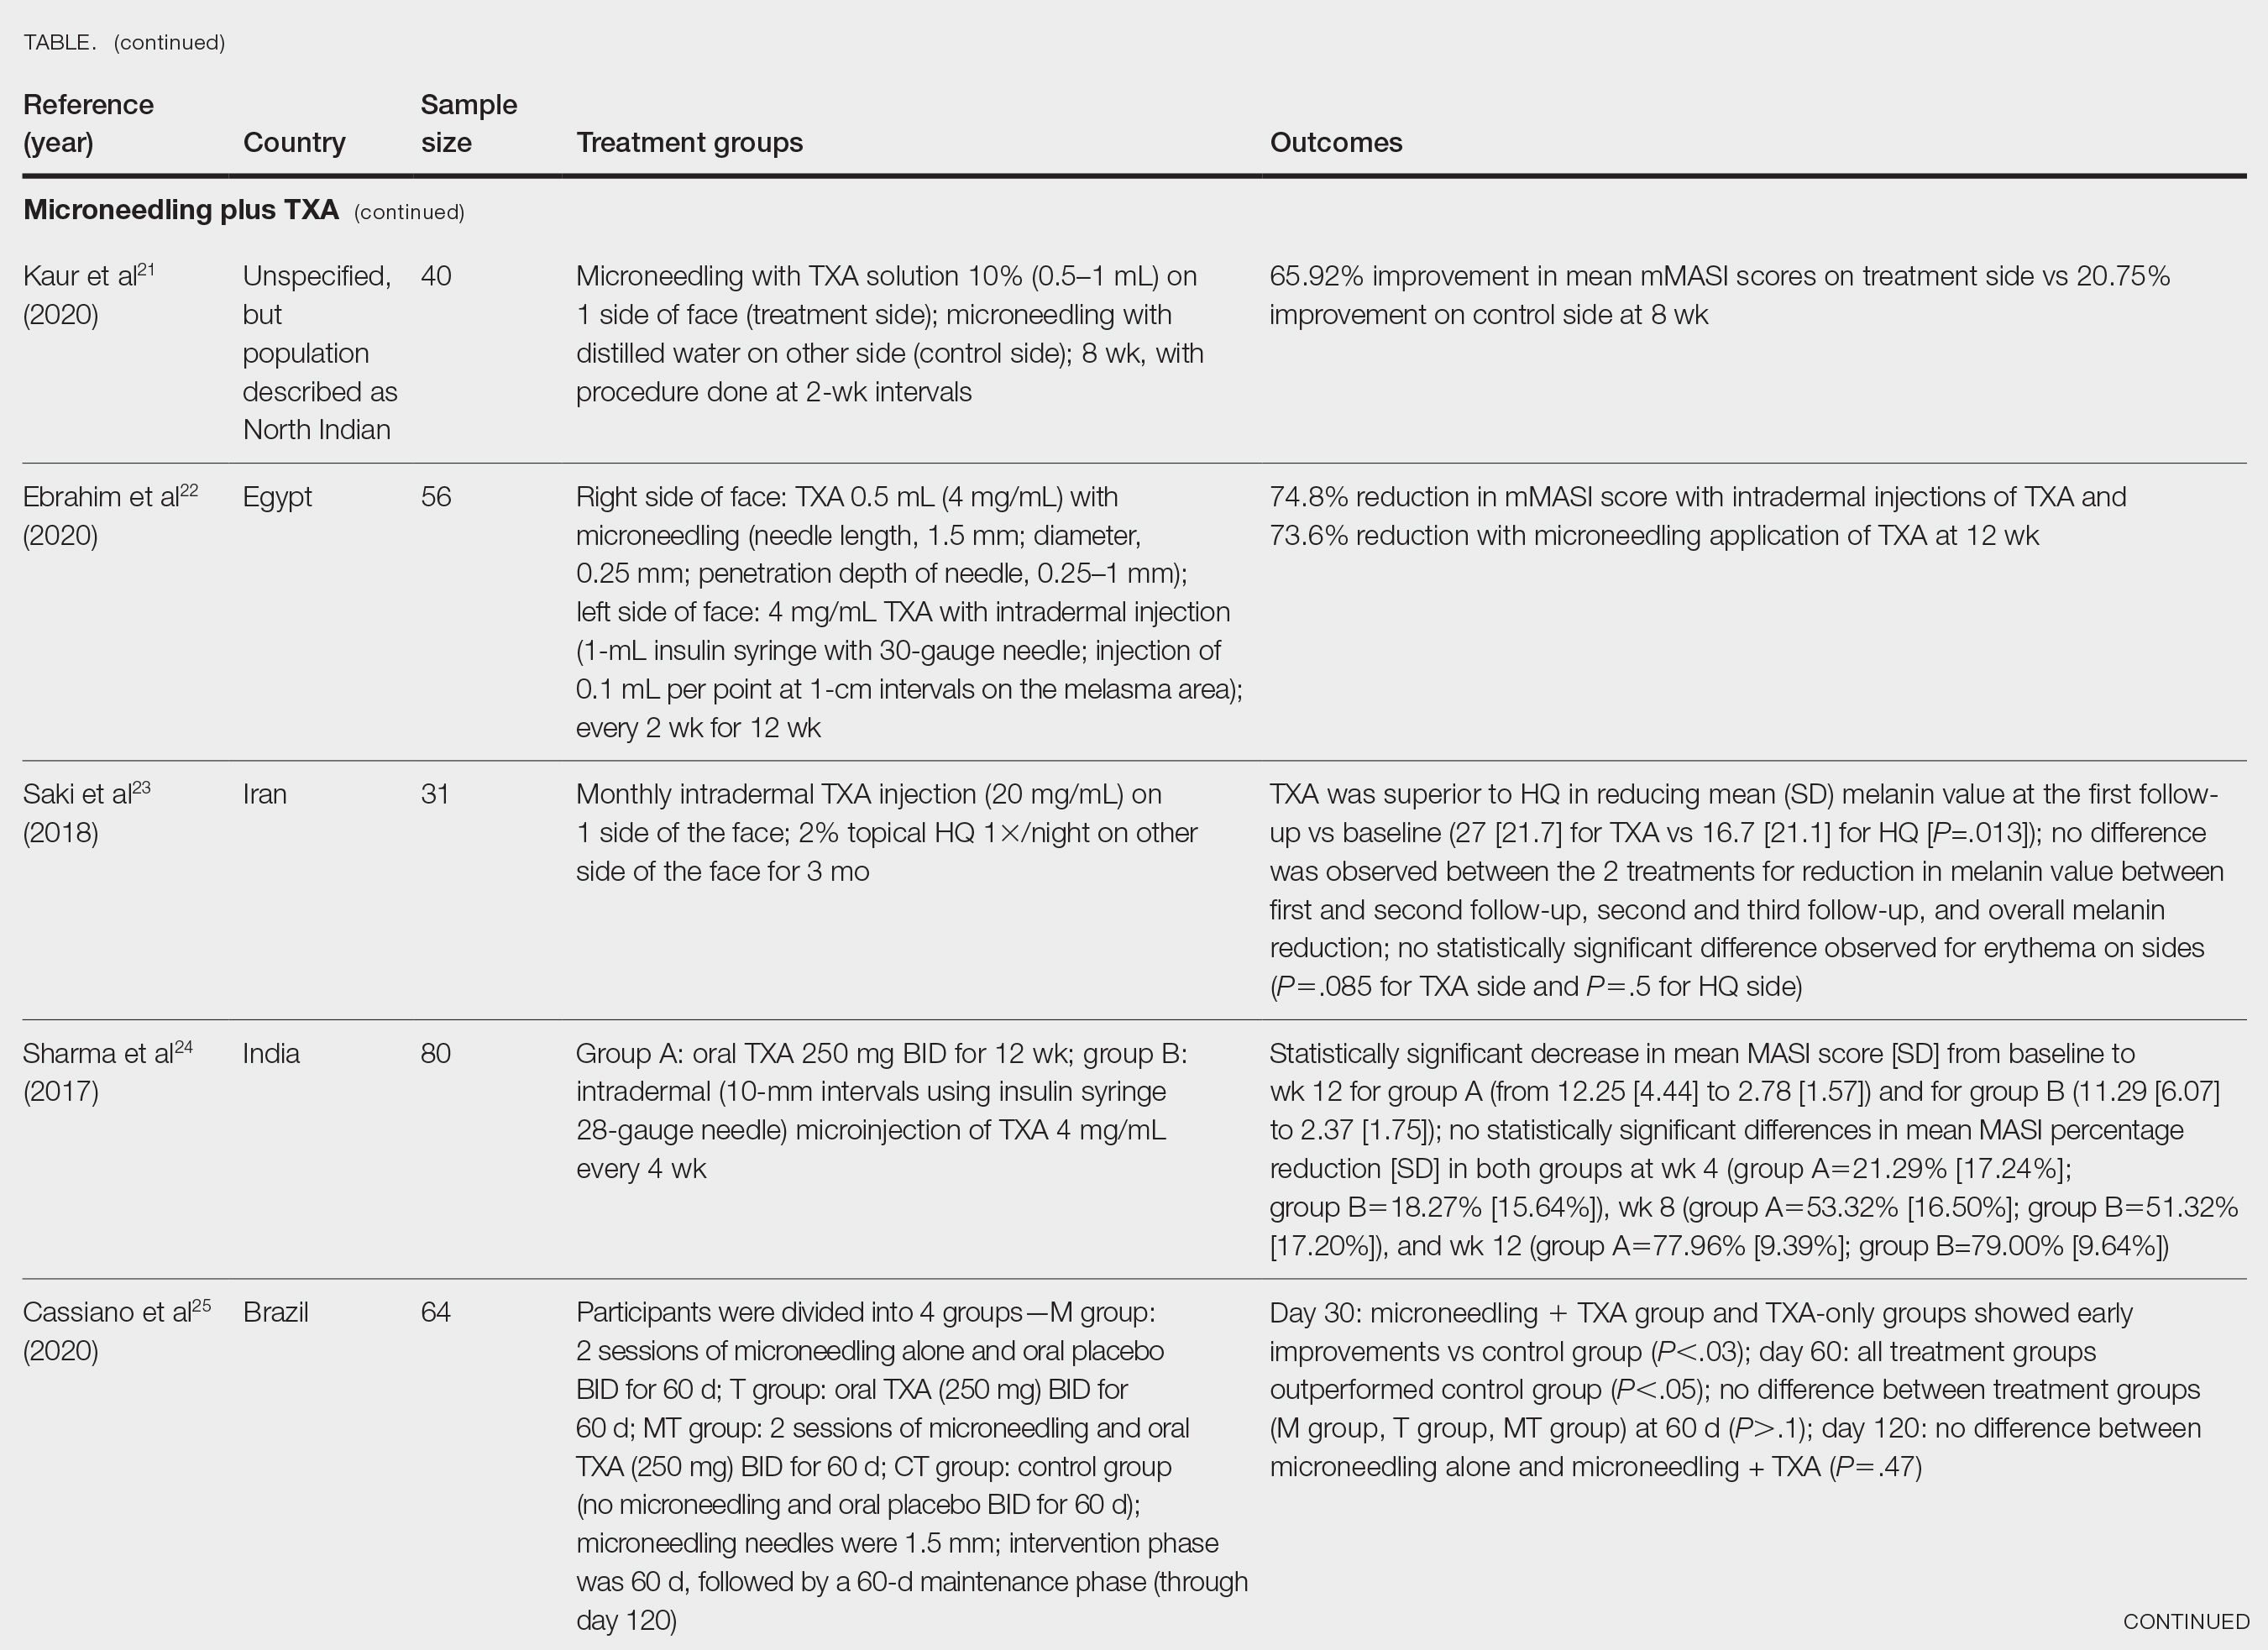
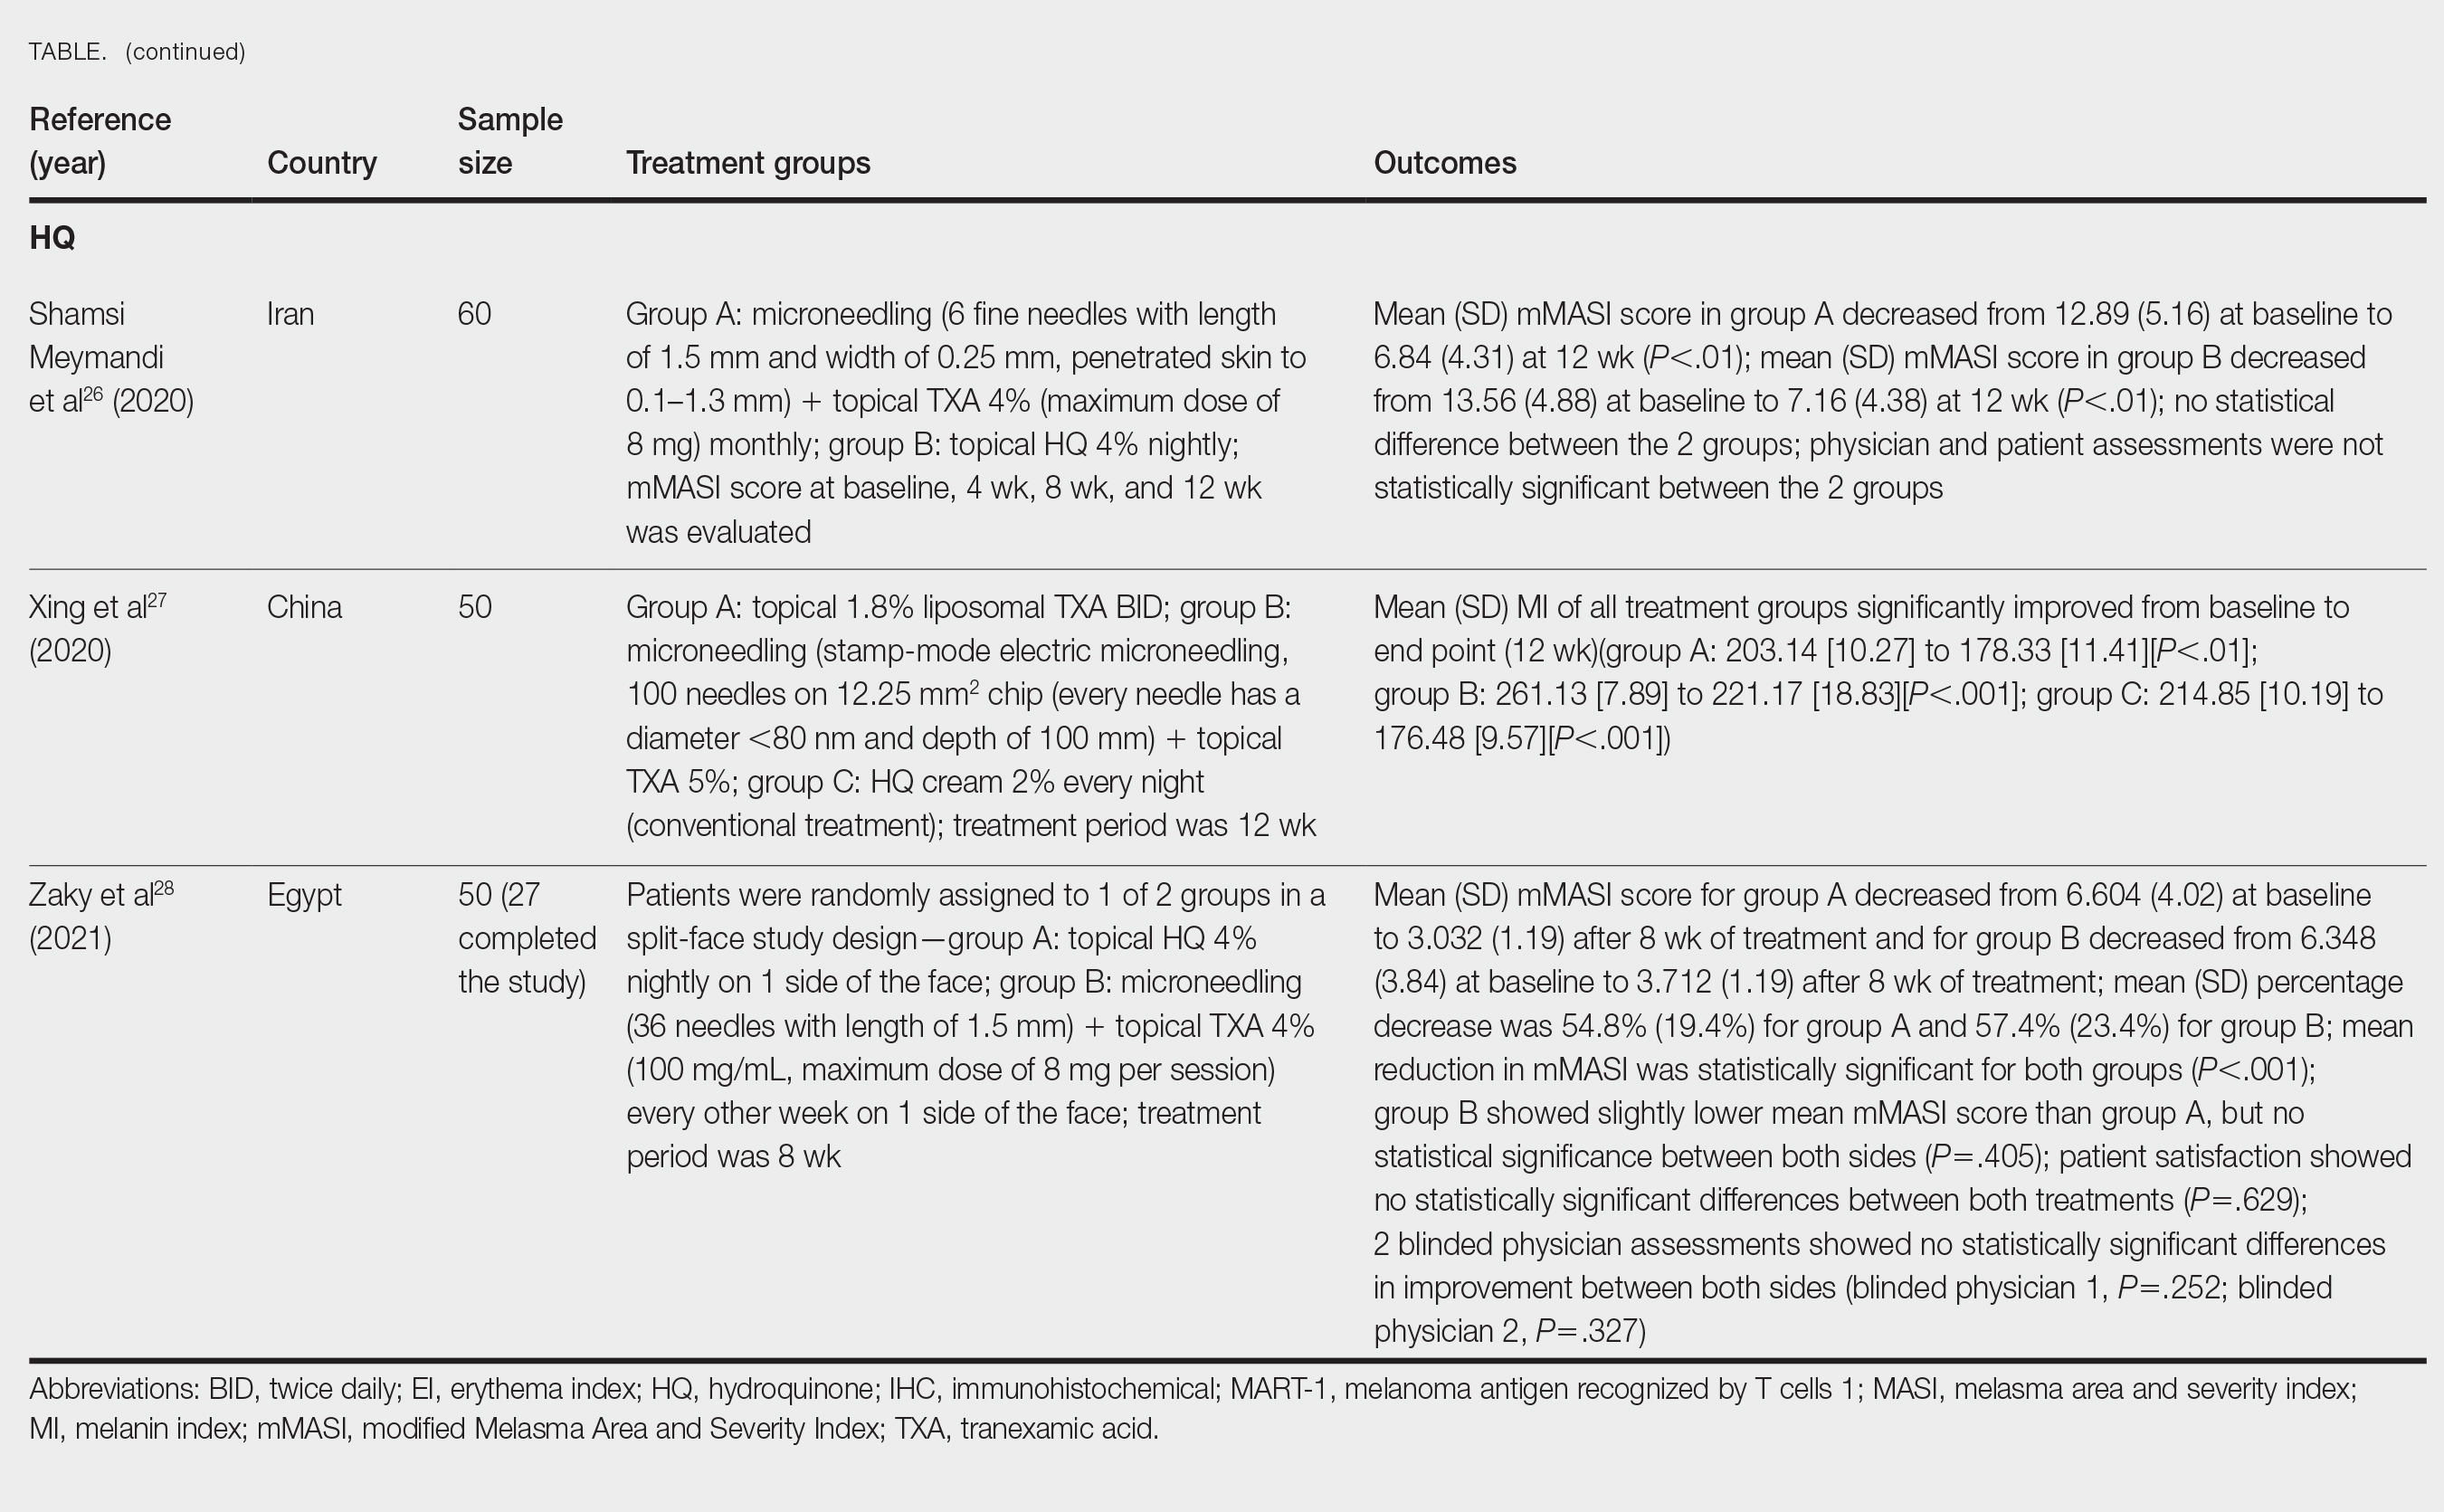
Xu et al20 conducted a split-face study (N=28) exploring the effectiveness of transdermal application of topical TXA using a microarray pen with microneedles (vibration at 3000×/min) plus topical TXA on one side of the face, while the other side received only topical TXA as a control. After 12 weeks of treatment, combination therapy with microneedling and TXA decreased brown spot scores, lowered melanin index (MI) values, improved blinded physician assessment, and improved patient satisfaction vs TXA therapy alone.20
Kaur et al21 conducted a split-face, randomized, controlled trial of microneedling (1-mm depth) with TXA solution 10% vs microneedling (1-mm depth) with distilled water alone for 8 weeks (N=40). They graded participant responses to treatment using reductions in mMASI scores12 at every 2 weeks of follow-up (no response, minimal or poor response=0%–25%; partial or fair response=26%–50%; good response=51%–75%; and excellent response=>75%). They reported an overall reduction in mMASI scores for both the treatment side and the control side in all participants, showing a 65.92% improvement in mean mMASI scores on the treatment side vs 20.75% improvement on the control side at week 8. Both sides showed statistically significant reductions in mean mMASI scores (P<.05). Clinically, 40% (16/40) of participants showed an excellent response to combined treatment compared with 0% (0/40) to microneedling alone. Overall, patient satisfaction was similar across both groups. This study demonstrated that microneedling alone improves melasma, but a combination of microneedling plus TXA showed a better clinical reduction in melasma. However, the researchers did not follow up with participants posttreatment, so it remains unclear if the improved clinical outcomes were sustained long-term.21
Ebrahim et al22 reported that the combination of 0.5 mL TXA (4 mg/mL) and microneedling (0.25- to 1-mm depth) was effective for melasma. Although there was improvement within microneedling and TXA, the study also showed that intradermal injection of TXA was significant in reducing mean mMASI scores and improving melasma (P<.001). The reduction in mMASI scores for the group receiving intradermal injections of TXA (left side; 74.8% reduction in mean mMASI score) vs the group receiving microneedling application of TXA (right side; 73.6% reduction in mean mMASI score) was not statistically significant. These findings suggest that the mode of TXA application may not be critical in determining clinical responses to TXA treatment. Although there was no reported statistically significant difference in clinical outcomes between the 2 treatments, patient satisfaction was higher on the microneedling side. Only 8 of 50 participants (16%) experienced recurrence 3 months posttreatment.22
Saki et al23 compared the efficacy of topical hydroquinone (2%) to intradermal TXA injections in treating melasma. They found intradermal TXA injections to be a clinically effective mode of treatment.23
Sharma et al24 explored the efficacy and safety of oral TXA by randomly assigning 100 Indian patients (20 of whom withdrew before study completion) with melasma into 2 groups: group A received TXA 250 mg twice daily, and group B received intradermal microinjections of TXA (4 mg/mL) every 4 weeks. The MASI scores were assessed at 4-week intervals for a total of 12 weeks. There was a decrease in MASI scores in both groups, and there was no statistically significant difference in mean percentage reduction in MASI scores between the 2 routes of drug administration, further suggesting the effectiveness of TXA independent of administration route. Two patients in group A relapsed at 24 weeks, and there were no relapses in group B, which may suggest a minimal superiority of TXA plus microneedling at providing more sustainable results compared with oral TXA alone. A notable limitation of this study was a high dropout rate as well as lack of long-term follow-up with participants, limiting the generalizability of the conclusions.24
Cassiano et al25 assigned 64 women with melasma to 1 of 3 treatment groups or a control group to compare the effectiveness of microneedling (M group: 1.5 mm; 2 sessions), oral TXA (T group: 250 mg/d twice daily for 60 days), and a combination of microneedling (2 sessions) and oral TXA (MT group: 250 mg/d twice daily for 60 days)with placebo for clinically reducing melasma lesions. The intervention period was 60 days followed by a 60-day maintenance phase for a total study period of 120 days. The researchers evaluated mMASI scores, quality of life, and difference in colorimetric luminosity. All treatment groups showed a reduction in mMASI scores at both 30 days and 60 days, indicating improved melasma severity. The MT and T groups had more significant improvement at 30 days compared with the control group (P<.03), suggesting that microneedling plus TXA and TXA alone promote faster improvement in melasma lesions. By 60 days, the M, T, and MT groups outperformed the control group, with no significant differences between the M, T, and MT groups. However, at the 120-day maintenance follow-up, the T group did not maintain its improvement compared with the control group. The M and MT groups showed no significance difference in effectiveness at 120 days, suggesting that microneedling may promote less frequent relapse and sustained remission compared to TXA alone.25
Hydroquinone for Melasma—Additional studies on the use of TXA treatments show that TXA may be an equally effective alternative to the standard use of hydroquinone treatment. Shamsi Meymandi et al26 did not find a statistically significant difference in treatment with TXA plus microneedling vs the standard regimen of hydroquinone. More importantly, patient and physician satisfaction assessments were similar between the 2 groups. Compared to hydroquinone, nightly treatment is not necessary with microneedling and TXA.26
Xing et al27 supported these conclusions with their study. They compared 3 study arms for a duration of 12 weeks: group A received topical 1.8% liposomal TXA BID, group B received stamp-mode electric microneedling with 5% TXA weekly, and group C applied 2% hydroquinone cream nightly. The study concluded that all 3 groups showed a significant reduction in mean MI by the end of the study, but a better MI improvement was observed in groups B and C (both P<.001) compared with group A (P<.01).27
Zaky et al28 showed that both hydroquinone and combination treatment of TXA plus microneedling are effective at improving melasma lesions. Further studies are needed to definitively conclude if combination treatment is more efficacious than hydroquinone; if the combination is more effective, it provides a treatment option for patients with melasma who may not be good candidates for hydroquinone treatment.
Study Limitations—One limitation in all the studies evaluated is the sample size. Because they all had small sample sizes, it is difficult to definitively conclude that the combination TXA and microneedling is an effective and appropriate treatment for patients with melasma. Furthermore, the quality of these studies was mostly dependent on subjectivity of the mMASI scores. Future large randomized controlled trials with a diverse participant population are needed to assess the effectiveness of TXA and microneedling in melasma treatment.
Another limitation is that many of the studies did not follow the patients longitudinally, which did not allow for an evaluation of whether patients had a relapse of melasma. Due to the chronic nature of melasma and frequent disease recurrence, future longitudinal studies are needed to monitor for disease recurrence.
Conclusion
Tranexamic acid and microneedling are potential treatment options for patients with melasma, and combination therapy appears more effective than either TXA or microneedling alone at providing sustained improvement of melasma lesions. Combination therapy appears safe and well tolerated, but its effect on reducing long-term disease recurrence is yet to be established.
- Neagu N, Conforti C, Agozzino M, et al. Melasma treatment: a systematic review. J Dermatolog Treat. 2022;33:1816-1837. doi:10.1080/09546634.2021.1914313
- Ogbechie-Godec OA, Elbuluk N. Melasma: an up-to-date comprehensive review. Dermatol Ther (Heidelb). 2017;7:305-318. doi:10.1007/s13555-017-0194-1
- Mahajan VK, Patil A, Blicharz L, et al. Medical therapies for melasma. J Cosmet Dermatol. 2022;21:3707-3728. doi:10.1111/jocd.15242
- Rigopoulos D, Gregoriou S, Katsambas A. Hyperpigmentation and melasma. J Cosmet Dermatol. 2007;6:195-202. doi:10.1111/j.1473-2165.2007.00321.x
- Kagha K, Fabi S, Goldman M. Melasma’s impact on quality of life. J Drugs Dermatol. 2020;19:184-187. doi:10.36849/JDD.2020.4663
- Lutfi RJ, Fridmanis M, Misiunas AL, et al. Association of melasma with thyroid autoimmunity and other thyroidal abnormalities and their relationship to the origin of the melasma. J Clin Endocrinol Metab. 1985;61:28-31. doi:10.1210/jcem-61-1-28
- Handel AC, Lima PB, Tonolli VM, et al. Risk factors for facial melasma in women: a case-control study. Br J Dermatol. 2014;171:588-594. doi:10.1111/bjd.13059
- Filoni A, Mariano M, Cameli N. Melasma: how hormones can modulate skin pigmentation. J Cosmet Dermatol. 2019;18:458-463. doi:10.1111/jocd.12877
- Rodrigues M, Pandya AG. Melasma: clinical diagnosis and management options. Australasian J Dermatol. 2015;56:151-163.
- Huerth KA, Hassan S, Callender VD. Therapeutic insights in melasma and hyperpigmentation management. J Drugs Dermatol. 2019;18:718-727.
- Pandya AG, Hynan LS, Bhore R, et al. Reliability assessment and validation of the Melasma Area and Severity Index (MASI) and a new modified MASI scoring method. J Am Acad Dermatol. 2011;64:78-83.e832. doi:10.1016/j.jaad.2009.10.051
- Rodrigues M, Ayala-Cortés AS, Rodríguez-Arámbula A, et al. Interpretability of the modified Melasma Area and Severity Index (mMASI). JAMA Dermatol. 2016;152:1051-1052. doi:10.1001/jamadermatol.2016.1006
- Ikino JK, Nunes DH, da Silva VPM, et al. Melasma and assessment of the quality of life in Brazilian women. An Bras Dermatol. 2015;90:196-200. doi:10.1590/abd1806-4841.20152771
- Taraz M, Niknam S, Ehsani AH. Tranexamic acid in treatment of melasma: a comprehensive review of clinical studies. Dermatolog Ther. 2017;30:E12465. doi:10.1111/dth.12465
- Bala HR, Lee S, Wong C, et al. Oral tranexamic acid for the treatment of melasma: a review. Dermatol Surg. 2018;44:814-825. doi:10.1097/DSS.0000000000001518
- Singh A, Yadav S. Microneedling: advances and widening horizons. Indian Dermatol Online J. 2016;7:244-254. doi:10.4103/2229-5178.185468
- Del Rosario E, Florez-Pollack S, Zapata L, et al. Randomized, placebo-controlled, double-blind study of oral tranexamic acid in the treatment of moderate-to-severe melasma. J Am Acad Dermatol. 2018;78:363-369. doi:10.1016/j.jaad.2017.09.053
- El Attar Y, Doghaim N, El Far N, et al. Efficacy and safety of tranexamic acid versus vitamin C after microneedling in treatment of melasma: clinical and dermoscopic study. J Cosmet Dermatol. 2022;21:2817-2825. doi:10.1111/jocd.14538
- Saleh FY, Abdel-Azim ES, Ragaie MH, et al. Topical tranexamic acid with microneedling versus microneedling alone in treatment of melasma: clinical, histopathologic, and immunohistochemical study. J Egyptian Womens Dermatolog Soc. 2019;16:89-96. doi:10.4103/jewd.jewd_25_19
- Xu Y, Ma R, Juliandri J, et al. Efficacy of functional microarray of microneedles combined with topical tranexamic acid for melasma: a randomized, self-controlled, split-face study. Medicine (Baltimore). 2017;96:e6897. doi:10.1097/MD.0000000000006897
- Kaur A, Bhalla M, Pal Thami G, et al. Clinical efficacy of topical tranexamic acid with microneedling in melasma. Dermatol Surg. 2020;46:E96-E101. doi:10.1097/DSS.0000000000002520
- Ebrahim HM, Said Abdelshafy A, Khattab F, et al. Tranexamic acid for melasma treatment: a split-face study. Dermatol Surg. 2020;46:E102-E107. doi:10.1097/DSS.0000000000002449
- Saki N, Darayesh M, Heiran A. Comparing the efficacy of topical hydroquinone 2% versus intradermal tranexamic acid microinjections in treating melasma: a split-face controlled trial. J Dermatolog Treat. 2018;29:405-410. doi:10.1080/09546634.2017.1392476
- Sharma R, Mahajan VK, Mehta KS, et al. Therapeutic efficacy and safety of oral tranexamic acid and that of tranexamic acid local infiltration with microinjections in patients with melasma: a comparative study. Clin Exp Dermatol. 2017;42:728-734. doi:10.1111/ced.13164
- Cassiano D, Esposito ACC, Hassun K, et al. Efficacy and safety of microneedling and oral tranexamic acid in the treatment of facial melasma in women: an open, evaluator-blinded, randomized clinical trial. J Am Acad Dermatol. 2020;83:1176-1178. doi:10.1016/j.jaad.2020.02.002
- Shamsi Meymandi S, Mozayyeni A, Shamsi Meymandi M, et al. Efficacy of microneedling plus topical 4% tranexamic acid solution vs 4% hydroquinone in the treatment of melasma: a single-blind randomized clinical trial. J Cosmet Dermatol. 2020;19:2906-2911. doi:10.1111/jocd.13392
- Xing X, Chen L, Xu Z, et al. The efficacy and safety of topical tranexamic acid (liposomal or lotion with microneedling) versus conventional hydroquinone in the treatment of melasma. J Cosmet Dermatol. 2020;19:3238-3244. doi:10.1111/jocd.13810
- Zaky MS, Obaid ZM, Khalil EA, et al. Microneedling-assisted topical tranexamic acid solution versus 4% hydroquinone for treating melasma: a split-face randomized study. J Cosmet Dermatol. 2021;20:4011-4016. doi:10.1111/jocd.14440
Melasma (also known as chloasma faciei) is a common chronic skin disorder that results in well-demarcated, hyperpigmented, tan to dark patches that mostly appear in sun-exposed areas such as the face and neck and sometimes the arms. The exact prevalence or incidence is not known but is estimated to be 1% to 50% overall depending on the ethnic population and geographic location.1,2 Melasma predominantly affects women, but research has shown that approximately 10% to 20% of men are affected by this condition.3,4 Although melasma can affect patients of all skin types, it primarily affects those with darker skin tones.5 The groups most often affected are women of Black, Hispanic, Middle Eastern, and Southeast Asian ethnicity. Although the pathogenesis is complex and not fully understood, multiple pathways and etiologies have been theorized to cause melasma. Potential causes include exposure to UV radiation, oral contraceptives, hormonal changes, medications, thyroid dysfunction, genetics, and pregnancy.6,7 Cytokines and growth factors, including adipokine and angiopoietin, synthesized by sebaceous glands play a role in the pathogenic mechanism of melasma. Cytokines and growth factors are hypothesized to modulate the function of melanocytes.8 Both melanocytes and sebocytes are controlled by α–melanocyte-stimulating hormone. Therefore, overexpression of α–melanocyte-stimulating hormone will result in overproduction of these 2 cell types, resulting in melasma. Melasma can be classified into 4 subtypes using Wood lamp examination: epidermal, dermal, mixed, or indeterminate.3 Furthermore, melasma is divided into subgroups based on the location: malar region, mandibular region, and centrofacial patch pattern.9,10 The involvement of sebaceous glands in the pathogenesis of melasma may explain the predilection for the centrofacial region, which is the most common pattern.
The severity of melasma can be assessed using the melasma area and severity index (MASI), which is calculated by subjective assessment of 3 main factors: (1) facial area of involvement; (2) darkness of affected region; and (3) homogeneity, with the extent of melasma indicated by a score ranging from 0 to 48.11 The modified MASI (mMASI) subsequently was introduced to assist with assessing the severity of melasma and creating distinct ranges for mild, moderate, and severe cases, ranging from 0 (mild) to 24 (severe).12 Both indices are used in research to assess the improvement of melasma with treatment.
Patients with melasma report a decrease in quality of life, increased emotional stress, and lower self-esteem due to cosmesis.13 Treatment of melasma can be highly challenging and often is complicated by relapsing. Historically, the treatment of melasma has included the use of chemical lightening agents. Additional treatment options include the use of lasers and complex chemical peels,9,10 but these interventions may result in adverse outcomes for individuals with darker skin tones. The current gold-standard treatment is topical hydroquinone and broad-spectrum sunscreen. Although hydroquinone is effective in the treatment of melasma, relapse is common. The goal of melasma management is not only to treat acute hyperpigmentation but also to prevent relapse. Other therapies that currently are being explored for the clinically sustained treatment of melasma include tranexamic acid (TXA)(trans-4-[aminomethyl]cyclohexanecarboxylic acid),9,10 an antifibrinolytic agent routinely used to prevent blood loss during surgery and in the management of menorrhagia. It is a synthetic derivative of lysine and serves as a potent plasmin inhibitor by blocking the lysine-binding sites of plasminogen molecules, thus preventing the conversion of plasminogen to plasmin. It also prevents fibrinolysis and blood loss.
In addition to its hemostatic properties, TXA has been found to have hypopigmentation properties.14,15 Plasminogen also can be found in human epidermal basal cells and human keratinocytes, and it is postulated that TXA’s interaction with these cells explains its hypopigmentation properties. Both UV radiation and hormones activate plasminogen into plasmin, resulting in the activation of tyrosinase and melanogenesis.14,15 Tranexamic acid is postulated to inhibit the keratinocyte-plasminogen pathway, thus leading to the inhibition of UV-induced and hormone-induced pigmentation. Also, TXA serves as a competitive inhibitor for tyrosinase due to its structural similarity to tyrosine.15 The combination of these 2 mechanisms contributes to the skin-lightening effects of TXA, making it a potential treatment for melasma.
Furthermore, the use of microneedling is being explored as a treatment option for melasma. Microneedling creates microscopic punctures in the skin using tiny needles, resulting in a wound-healing response and skin resurfacing. The microneedling technique is utilized to create small holes in the skin, with needle depths that can be adjusted from 0.5 to 3.5 mm to target different layers of the dermis and allow for discreet application of TXA.16 We sought to look at the current literature on the use and effectiveness of microneedling in combination with TXA to treat melasma and prevent relapse.
Methods
A systematic review was performed of PubMed articles indexed for MEDLINE and Embase in November 2021 to compile available articles that studied TXA and microneedling as a treatment for melasma. The PubMed search terms were (melasma) AND (microneedling* OR ‘tranexamic acid’ OR TXA or TA). The Embase search terms were (cholasma OR melasma) AND (tranexamic acid OR TXA) AND (microneedling)(Figure). The search was then limited to ”randomized controlled trial” and ”clinical trial” in English-language journals. Duplicates were excluded. After thorough evaluation, articles that discussed the use of TXA in combination with treatment options other than microneedling also were excluded.
Results
The literature search yielded a total of 12 articles that assessed the effectiveness of TXA and microneedling for the treatment of melasma (Table).17-28 Several articles concluded that TXA was equally effective at reducing melasma lesions when compared with the standard treatment of hydroquinone. Some of the reviewed articles also demonstrated the effectiveness of microneedling in improving melasma lesions as a stand-alone treatment. These studies highlighted the enhanced efficacy of the combined treatment of TXA and microneedling compared with their individual uses.17-28
Comment
Melasma is a common chronic hyperpigmentation disorder, making its treatment clinically challenging. Many patients experience symptom relapses, and limited effective treatment options make achieving complete clearance difficult, underscoring the need for improved therapeutic approaches. Recently, researchers have explored alternative treatments to address the challenges of melasma management. Tranexamic acid is an antifibrinolytic used to prevent blood loss and has emerged as a potential treatment for melasma. Similarly, microneedling—a technique in which multiple punctures are made in the skin to activate and stimulate wound healing and skin rejuvenation—shows promise for melasma.
Oral TXA for Melasma—Oral TXA has been shown to reduce melasma lesions. Del Rosario et al17 recruited 44 women (39 of whom completed the study) with moderate to severe melasma and randomized them into 2 groups: oral TXA and placebo. This study demonstrated a 49% reduction in the mMASI score in all participants taking oral TXA (250 mg twice daily [BID]) compared with an 18% reduction in the control group (placebo capsule BID) after 3 months of treatment. In patients with moderate and severe melasma, 45% and 51% mMASI score reductions were reported in the treatment group, respectively, vs 16% and 19% score reductions in placebo group, respectively. These researchers concluded that oral TXA may be effective at treating moderate to severe melasma. Although patients with severe melasma had a better response to treatment, their improvement was not sustained compared with patients with moderate melasma after a 3-month posttreatment follow-up.17
Microneedling Plus TXA for Melasma—Microneedling alone has been shown to be effective for melasma. El Attar et al18 conducted a split-face study of microneedling (1.5-mm depth) plus topical TXA (0.5 mL)(right side of the face[treatment arm]) compared with microneedling (1.5-mm depth) plus topical vitamin C (0.5 mL)(left side of the face [control group]) in 20 women with melasma. The sessions were repeated every 2 weeks for a total of 6 sessions. Although researchers found no statistically significant differences between the 2 treatment sides, microneedling plus TXA showed a slight advantage over microneedling plus vitamin C in dermoscopic examination. Both sides showed improvement in pigmented lesions, but vitamin C–treated lesions did not show an improvement in vascularity vs TXA.18
Saleh et al19 further showed that combination treatment with microneedling and TXA may improve clinical outcomes better than microneedling alone. Their study demonstrated a reduction in MASI score that was significantly higher in the combination treatment group compared with the microneedling alone group (P=.001). There was a significant reduction in melanoma antigen recognized by T cells 1 (MART-1)–positive cells in the combination treatment group compared with the microneedling alone group (P=.001). Lastly, combined therapy improved melasma patches better than microneedling alone.19
Xu et al20 conducted a split-face study (N=28) exploring the effectiveness of transdermal application of topical TXA using a microarray pen with microneedles (vibration at 3000×/min) plus topical TXA on one side of the face, while the other side received only topical TXA as a control. After 12 weeks of treatment, combination therapy with microneedling and TXA decreased brown spot scores, lowered melanin index (MI) values, improved blinded physician assessment, and improved patient satisfaction vs TXA therapy alone.20
Kaur et al21 conducted a split-face, randomized, controlled trial of microneedling (1-mm depth) with TXA solution 10% vs microneedling (1-mm depth) with distilled water alone for 8 weeks (N=40). They graded participant responses to treatment using reductions in mMASI scores12 at every 2 weeks of follow-up (no response, minimal or poor response=0%–25%; partial or fair response=26%–50%; good response=51%–75%; and excellent response=>75%). They reported an overall reduction in mMASI scores for both the treatment side and the control side in all participants, showing a 65.92% improvement in mean mMASI scores on the treatment side vs 20.75% improvement on the control side at week 8. Both sides showed statistically significant reductions in mean mMASI scores (P<.05). Clinically, 40% (16/40) of participants showed an excellent response to combined treatment compared with 0% (0/40) to microneedling alone. Overall, patient satisfaction was similar across both groups. This study demonstrated that microneedling alone improves melasma, but a combination of microneedling plus TXA showed a better clinical reduction in melasma. However, the researchers did not follow up with participants posttreatment, so it remains unclear if the improved clinical outcomes were sustained long-term.21
Ebrahim et al22 reported that the combination of 0.5 mL TXA (4 mg/mL) and microneedling (0.25- to 1-mm depth) was effective for melasma. Although there was improvement within microneedling and TXA, the study also showed that intradermal injection of TXA was significant in reducing mean mMASI scores and improving melasma (P<.001). The reduction in mMASI scores for the group receiving intradermal injections of TXA (left side; 74.8% reduction in mean mMASI score) vs the group receiving microneedling application of TXA (right side; 73.6% reduction in mean mMASI score) was not statistically significant. These findings suggest that the mode of TXA application may not be critical in determining clinical responses to TXA treatment. Although there was no reported statistically significant difference in clinical outcomes between the 2 treatments, patient satisfaction was higher on the microneedling side. Only 8 of 50 participants (16%) experienced recurrence 3 months posttreatment.22
Saki et al23 compared the efficacy of topical hydroquinone (2%) to intradermal TXA injections in treating melasma. They found intradermal TXA injections to be a clinically effective mode of treatment.23
Sharma et al24 explored the efficacy and safety of oral TXA by randomly assigning 100 Indian patients (20 of whom withdrew before study completion) with melasma into 2 groups: group A received TXA 250 mg twice daily, and group B received intradermal microinjections of TXA (4 mg/mL) every 4 weeks. The MASI scores were assessed at 4-week intervals for a total of 12 weeks. There was a decrease in MASI scores in both groups, and there was no statistically significant difference in mean percentage reduction in MASI scores between the 2 routes of drug administration, further suggesting the effectiveness of TXA independent of administration route. Two patients in group A relapsed at 24 weeks, and there were no relapses in group B, which may suggest a minimal superiority of TXA plus microneedling at providing more sustainable results compared with oral TXA alone. A notable limitation of this study was a high dropout rate as well as lack of long-term follow-up with participants, limiting the generalizability of the conclusions.24
Cassiano et al25 assigned 64 women with melasma to 1 of 3 treatment groups or a control group to compare the effectiveness of microneedling (M group: 1.5 mm; 2 sessions), oral TXA (T group: 250 mg/d twice daily for 60 days), and a combination of microneedling (2 sessions) and oral TXA (MT group: 250 mg/d twice daily for 60 days)with placebo for clinically reducing melasma lesions. The intervention period was 60 days followed by a 60-day maintenance phase for a total study period of 120 days. The researchers evaluated mMASI scores, quality of life, and difference in colorimetric luminosity. All treatment groups showed a reduction in mMASI scores at both 30 days and 60 days, indicating improved melasma severity. The MT and T groups had more significant improvement at 30 days compared with the control group (P<.03), suggesting that microneedling plus TXA and TXA alone promote faster improvement in melasma lesions. By 60 days, the M, T, and MT groups outperformed the control group, with no significant differences between the M, T, and MT groups. However, at the 120-day maintenance follow-up, the T group did not maintain its improvement compared with the control group. The M and MT groups showed no significance difference in effectiveness at 120 days, suggesting that microneedling may promote less frequent relapse and sustained remission compared to TXA alone.25
Hydroquinone for Melasma—Additional studies on the use of TXA treatments show that TXA may be an equally effective alternative to the standard use of hydroquinone treatment. Shamsi Meymandi et al26 did not find a statistically significant difference in treatment with TXA plus microneedling vs the standard regimen of hydroquinone. More importantly, patient and physician satisfaction assessments were similar between the 2 groups. Compared to hydroquinone, nightly treatment is not necessary with microneedling and TXA.26
Xing et al27 supported these conclusions with their study. They compared 3 study arms for a duration of 12 weeks: group A received topical 1.8% liposomal TXA BID, group B received stamp-mode electric microneedling with 5% TXA weekly, and group C applied 2% hydroquinone cream nightly. The study concluded that all 3 groups showed a significant reduction in mean MI by the end of the study, but a better MI improvement was observed in groups B and C (both P<.001) compared with group A (P<.01).27
Zaky et al28 showed that both hydroquinone and combination treatment of TXA plus microneedling are effective at improving melasma lesions. Further studies are needed to definitively conclude if combination treatment is more efficacious than hydroquinone; if the combination is more effective, it provides a treatment option for patients with melasma who may not be good candidates for hydroquinone treatment.
Study Limitations—One limitation in all the studies evaluated is the sample size. Because they all had small sample sizes, it is difficult to definitively conclude that the combination TXA and microneedling is an effective and appropriate treatment for patients with melasma. Furthermore, the quality of these studies was mostly dependent on subjectivity of the mMASI scores. Future large randomized controlled trials with a diverse participant population are needed to assess the effectiveness of TXA and microneedling in melasma treatment.
Another limitation is that many of the studies did not follow the patients longitudinally, which did not allow for an evaluation of whether patients had a relapse of melasma. Due to the chronic nature of melasma and frequent disease recurrence, future longitudinal studies are needed to monitor for disease recurrence.
Conclusion
Tranexamic acid and microneedling are potential treatment options for patients with melasma, and combination therapy appears more effective than either TXA or microneedling alone at providing sustained improvement of melasma lesions. Combination therapy appears safe and well tolerated, but its effect on reducing long-term disease recurrence is yet to be established.
- Neagu N, Conforti C, Agozzino M, et al. Melasma treatment: a systematic review. J Dermatolog Treat. 2022;33:1816-1837. doi:10.1080/09546634.2021.1914313
- Ogbechie-Godec OA, Elbuluk N. Melasma: an up-to-date comprehensive review. Dermatol Ther (Heidelb). 2017;7:305-318. doi:10.1007/s13555-017-0194-1
- Mahajan VK, Patil A, Blicharz L, et al. Medical therapies for melasma. J Cosmet Dermatol. 2022;21:3707-3728. doi:10.1111/jocd.15242
- Rigopoulos D, Gregoriou S, Katsambas A. Hyperpigmentation and melasma. J Cosmet Dermatol. 2007;6:195-202. doi:10.1111/j.1473-2165.2007.00321.x
- Kagha K, Fabi S, Goldman M. Melasma’s impact on quality of life. J Drugs Dermatol. 2020;19:184-187. doi:10.36849/JDD.2020.4663
- Lutfi RJ, Fridmanis M, Misiunas AL, et al. Association of melasma with thyroid autoimmunity and other thyroidal abnormalities and their relationship to the origin of the melasma. J Clin Endocrinol Metab. 1985;61:28-31. doi:10.1210/jcem-61-1-28
- Handel AC, Lima PB, Tonolli VM, et al. Risk factors for facial melasma in women: a case-control study. Br J Dermatol. 2014;171:588-594. doi:10.1111/bjd.13059
- Filoni A, Mariano M, Cameli N. Melasma: how hormones can modulate skin pigmentation. J Cosmet Dermatol. 2019;18:458-463. doi:10.1111/jocd.12877
- Rodrigues M, Pandya AG. Melasma: clinical diagnosis and management options. Australasian J Dermatol. 2015;56:151-163.
- Huerth KA, Hassan S, Callender VD. Therapeutic insights in melasma and hyperpigmentation management. J Drugs Dermatol. 2019;18:718-727.
- Pandya AG, Hynan LS, Bhore R, et al. Reliability assessment and validation of the Melasma Area and Severity Index (MASI) and a new modified MASI scoring method. J Am Acad Dermatol. 2011;64:78-83.e832. doi:10.1016/j.jaad.2009.10.051
- Rodrigues M, Ayala-Cortés AS, Rodríguez-Arámbula A, et al. Interpretability of the modified Melasma Area and Severity Index (mMASI). JAMA Dermatol. 2016;152:1051-1052. doi:10.1001/jamadermatol.2016.1006
- Ikino JK, Nunes DH, da Silva VPM, et al. Melasma and assessment of the quality of life in Brazilian women. An Bras Dermatol. 2015;90:196-200. doi:10.1590/abd1806-4841.20152771
- Taraz M, Niknam S, Ehsani AH. Tranexamic acid in treatment of melasma: a comprehensive review of clinical studies. Dermatolog Ther. 2017;30:E12465. doi:10.1111/dth.12465
- Bala HR, Lee S, Wong C, et al. Oral tranexamic acid for the treatment of melasma: a review. Dermatol Surg. 2018;44:814-825. doi:10.1097/DSS.0000000000001518
- Singh A, Yadav S. Microneedling: advances and widening horizons. Indian Dermatol Online J. 2016;7:244-254. doi:10.4103/2229-5178.185468
- Del Rosario E, Florez-Pollack S, Zapata L, et al. Randomized, placebo-controlled, double-blind study of oral tranexamic acid in the treatment of moderate-to-severe melasma. J Am Acad Dermatol. 2018;78:363-369. doi:10.1016/j.jaad.2017.09.053
- El Attar Y, Doghaim N, El Far N, et al. Efficacy and safety of tranexamic acid versus vitamin C after microneedling in treatment of melasma: clinical and dermoscopic study. J Cosmet Dermatol. 2022;21:2817-2825. doi:10.1111/jocd.14538
- Saleh FY, Abdel-Azim ES, Ragaie MH, et al. Topical tranexamic acid with microneedling versus microneedling alone in treatment of melasma: clinical, histopathologic, and immunohistochemical study. J Egyptian Womens Dermatolog Soc. 2019;16:89-96. doi:10.4103/jewd.jewd_25_19
- Xu Y, Ma R, Juliandri J, et al. Efficacy of functional microarray of microneedles combined with topical tranexamic acid for melasma: a randomized, self-controlled, split-face study. Medicine (Baltimore). 2017;96:e6897. doi:10.1097/MD.0000000000006897
- Kaur A, Bhalla M, Pal Thami G, et al. Clinical efficacy of topical tranexamic acid with microneedling in melasma. Dermatol Surg. 2020;46:E96-E101. doi:10.1097/DSS.0000000000002520
- Ebrahim HM, Said Abdelshafy A, Khattab F, et al. Tranexamic acid for melasma treatment: a split-face study. Dermatol Surg. 2020;46:E102-E107. doi:10.1097/DSS.0000000000002449
- Saki N, Darayesh M, Heiran A. Comparing the efficacy of topical hydroquinone 2% versus intradermal tranexamic acid microinjections in treating melasma: a split-face controlled trial. J Dermatolog Treat. 2018;29:405-410. doi:10.1080/09546634.2017.1392476
- Sharma R, Mahajan VK, Mehta KS, et al. Therapeutic efficacy and safety of oral tranexamic acid and that of tranexamic acid local infiltration with microinjections in patients with melasma: a comparative study. Clin Exp Dermatol. 2017;42:728-734. doi:10.1111/ced.13164
- Cassiano D, Esposito ACC, Hassun K, et al. Efficacy and safety of microneedling and oral tranexamic acid in the treatment of facial melasma in women: an open, evaluator-blinded, randomized clinical trial. J Am Acad Dermatol. 2020;83:1176-1178. doi:10.1016/j.jaad.2020.02.002
- Shamsi Meymandi S, Mozayyeni A, Shamsi Meymandi M, et al. Efficacy of microneedling plus topical 4% tranexamic acid solution vs 4% hydroquinone in the treatment of melasma: a single-blind randomized clinical trial. J Cosmet Dermatol. 2020;19:2906-2911. doi:10.1111/jocd.13392
- Xing X, Chen L, Xu Z, et al. The efficacy and safety of topical tranexamic acid (liposomal or lotion with microneedling) versus conventional hydroquinone in the treatment of melasma. J Cosmet Dermatol. 2020;19:3238-3244. doi:10.1111/jocd.13810
- Zaky MS, Obaid ZM, Khalil EA, et al. Microneedling-assisted topical tranexamic acid solution versus 4% hydroquinone for treating melasma: a split-face randomized study. J Cosmet Dermatol. 2021;20:4011-4016. doi:10.1111/jocd.14440
Practice Points
- Combination therapy with tranexamic acid (TXA) and microneedling is a safe and effective treatment for melasma.
- Combining TXA with microneedling may result in decreased melasma relapse rates.
Data Trends 2024: Transgender and Gender-Affirming Care
- Herman JL, Flores AR, O’Neill KK. How many adults and youth identify as transgender in the United States? UCLA School of Law Williams Institute. June 2022. Accessed April 15, 2024. https://williamsinstitute.law.ucla.edu/publications/trans-adults-united-states/
Boyer TL, Youk AO, Haas AP, et al. Suicide, homicide, and all-cause mortality among transgender and cisgender patients in the Veterans Health Administration. LGBT Health. 2021;8(3):173-180. doi:10.1089/lgbt.2020.0235
James SE, Herman JL, Rankin S, Keisling M, Mottet L, Anafi M. The report of the 2015 U.S. transgender survey. National Center for Transgender Equality. 2016. https://transequality.org/sites/default/files/docs/usts/USTS-Full-Report-Dec17.pdf
Jasuja GK, Reisman JI, Rao SR, et al. Social stressors and health among older transgender and gender diverse veterans. LGBT Health. 2023;10(2):148-157. doi:10.1089/lgbt.2022.0012
Shane L. VA again delays decision on transgender surgery options. Military Times. February 26, 2024. Accessed April 30, 2024. https://www.militarytimes.com/veterans/2024/02/26/va-again-delays-decision-on-transgender-surgery-options/
Henderson ER, Boyer TL, Wolfe HL, Blosnich JR. Causes of death of transgender and gender diverse veterans. Am J Prev Med. 2024;66(4):664-671. doi:10.1016/j.amepre.2023.11.014
Wolfe HL, Boyer TL, Shipherd JC, Kauth MR, Jasuja GK, Blosnich JR. Barriers and facilitators to gender-affirming hormone therapy in the Veterans Health Administration. Ann Behav Med. 202316;57(12):1014-1023. doi:10.1093/abm/kaad035
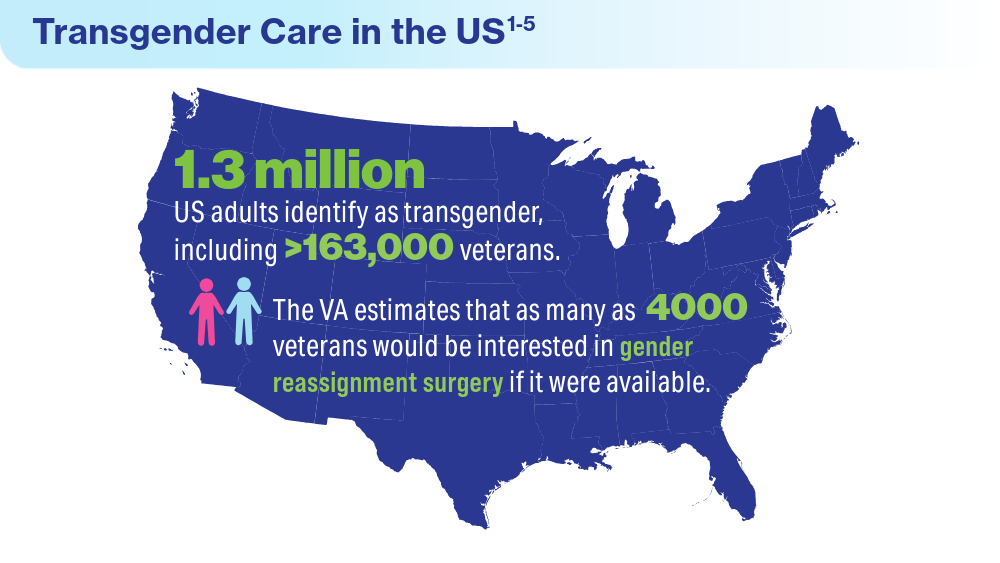

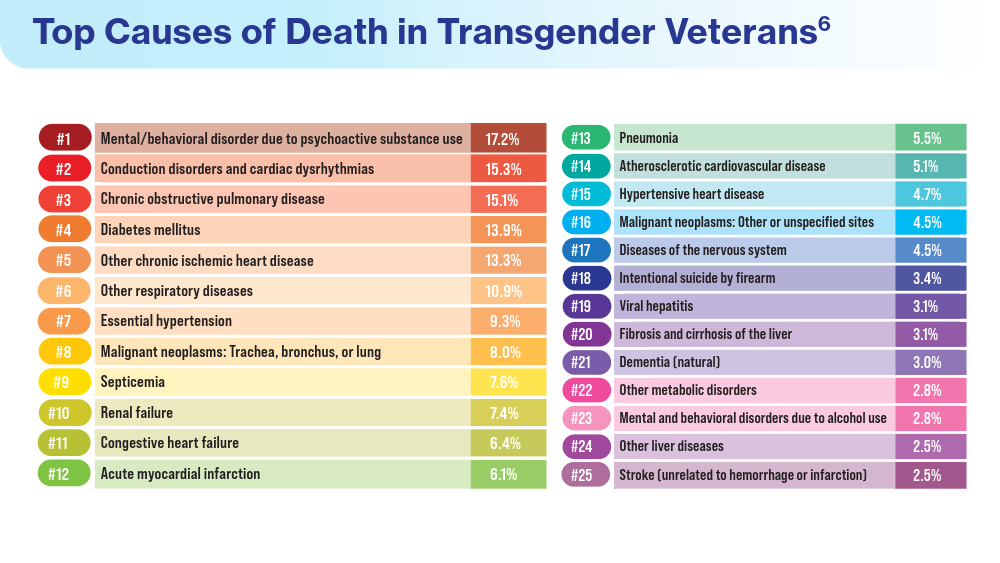
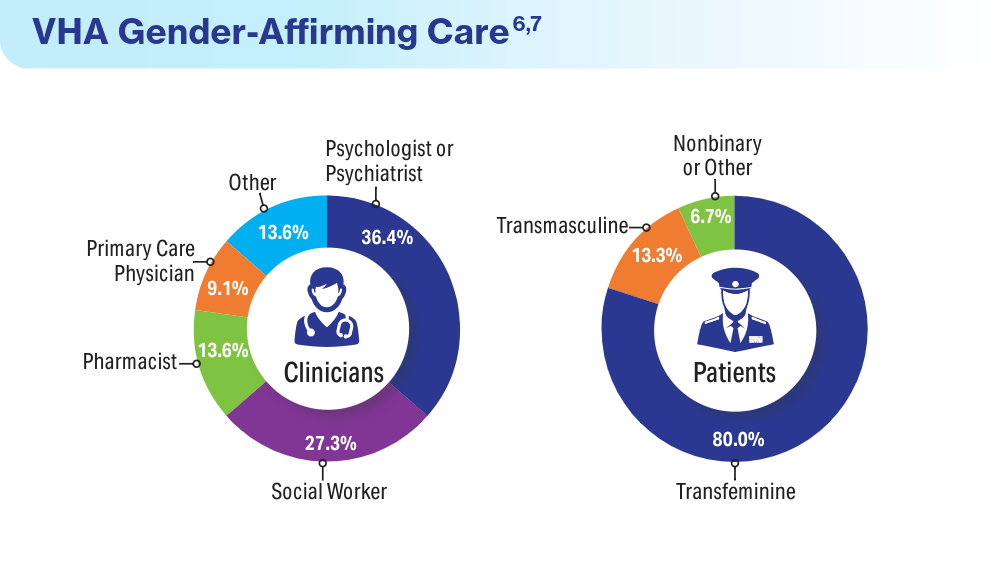
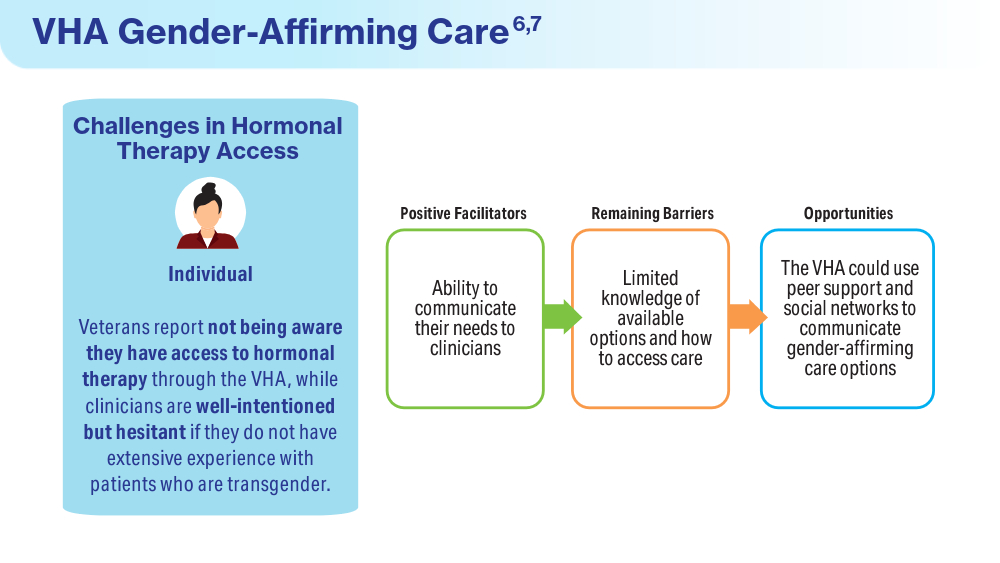
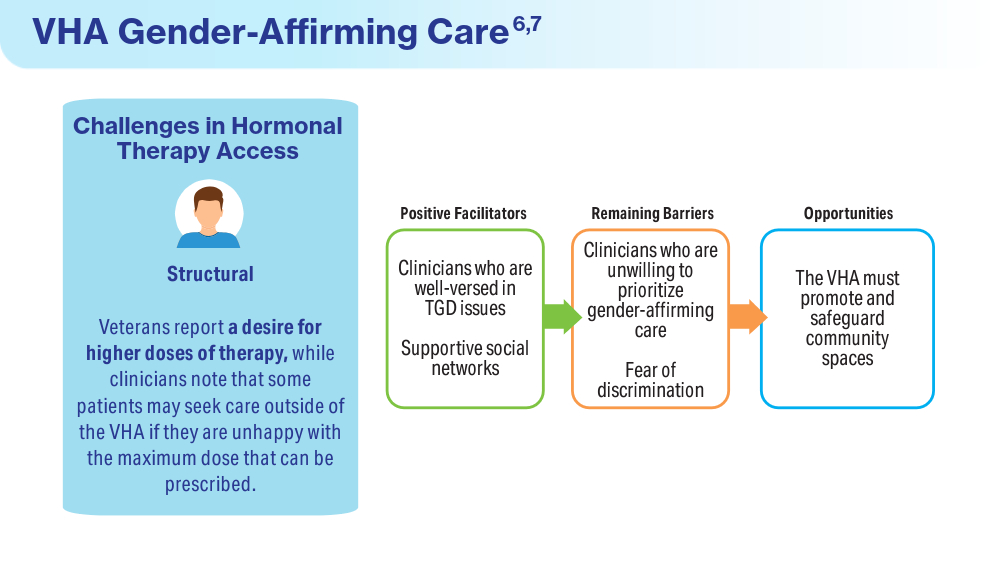
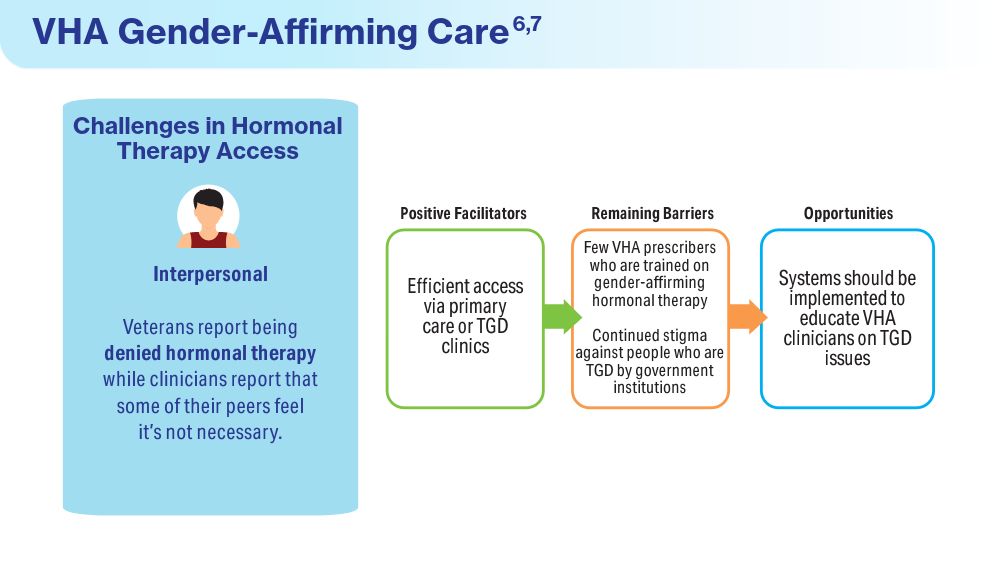
How Common Is Pediatric Emergency Mistriage?
, according to a multicenter retrospective study published in JAMA Pediatrics. Researchers also identified gender, age, race, ethnicity, and comorbidity disparities in those who were undertriaged.
The researchers found that only 34.1% of visits were correctly triaged while 58.5% were overtriaged and 7.4% were undertriaged. The findings were based on analysis of more than 1 million pediatric emergency visits over a 5-year period that used the Emergency Severity Index (ESI) version 4 for triage.
“The ESI had poor sensitivity in identifying a critically ill pediatric patient, and undertriage occurred in 1 in 14 children,” wrote Dana R. Sax, MD, a senior emergency physician at The Permanente Medical Group in northern California, and her colleagues.

“More than 90% of pediatric visits were assigned a mid to low triage acuity category, and actual resource use and care intensity frequently did not align with ESI predictions,” the authors wrote. “Our findings highlight an opportunity to improve triage for pediatric patients to mitigate critical undertriage, optimize resource decisions, standardize processes across time and setting, and promote more equitable care.”
The authors added that the study findings are currently being used by the Permanente system “to develop standardized triage education across centers to improve early identification of high-risk patients.”
Disparities in Emergency Care
The results underscore the need for more work to address disparities in emergency care, wrote Warren D. Frankenberger, PhD, RN, a nurse scientist at Children’s Hospital of Philadelphia, and two colleagues in an accompanying editorial.
“Decisions in triage can have significant downstream effects on subsequent care during the ED visit,” they wrote in their editorial. “Given that the triage process in most instances is fully executed by nurses, nurse researchers are in a key position to evaluate these and other covariates to influence further improvements in triage.” They suggested that use of clinical decision support tools and artificial intelligence (AI) may improve the triage process, albeit with the caveat that AI often relies on models with pre-existing historical bias that may perpetuate structural inequalities.
Study Methodology
The researchers analyzed 1,016,816 pediatric visits at 21 emergency departments in Kaiser Permanente Northern California between January 2016 and December 2020. The patients were an average 7 years old, and 47% were female. The researchers excluded visits that lacked ESI data or had incomplete ED time variables as well as those with patients who left against medical advice, were not seen, or were transferred from another ED.
The study relied on novel definitions of ESI undertriage and overtriage developed through a modified Delphi process by a team of four emergency physicians, one pediatric emergency physician, two emergency nurses, and one pediatric ICU physician. The definition involved comparing ESI levels to the clinical outcomes and resource use.
Resources included laboratory analysis, electrocardiography, radiography, CT, MRI, diagnostic ultrasonography (not point of care), angiography, IV fluids, and IV, intramuscular, or nebulized medications. Resources did not include “oral medications, tetanus immunizations, point-of-care testing, history and physical examination, saline or heparin lock, prescription refills, simple wound care, crutches, splints, and slings.”
Level 1 events were those requiring time-sensitive, critical intervention, including high-risk sepsis. Level 2 events included most level 1 events that occurred after the first hour (except operating room admission or hospital transfer) as well as respiratory therapy, toxicology consult, lumbar puncture, suicidality as chief concern, at least 2 doses of albuterol or continuous albuterol nebulization, a skeletal survey x-ray order, and medical social work consult with an ED length of stay of at least 2 hours. Level 3 events included IV mediation order, any CT order, OR admission or hospital transfer after one hour, or any pediatric hospitalist consult.
Analyzing the ED Visits
Overtriaged cases were ESI level 1 or 2 cases in which fewer than 2 resources were used; level 3 cases where fewer than 2 resources were used and no level 1 or 2 events occurred; and level 4 cases where no resources were used.
Undertriaged cases were defined as the following:
- ESI level 5 cases where any resource was used and any level 1, 2, or 3 events occurred.
- Level 4 cases where more than 1 resource was used and any level 1, 2, or 3 events occurred.
- Level 3 cases where any level 1 event occurred, more than one level 2 event occurred, or any level 2 event occurred and more than one additional ED resource type was used.
- Level 2 cases where any level 1 event occurred.
About half the visits (51%) were assigned ESI 3, which was the category with the highest proportion of mistriage. After adjusting for study facility and triage vital signs, the researchers found that children age 6 and older were more likely to be undertriaged than those younger than 6, particularly those age 15 and older (relative risk [RR], 1.36).
Undertriage was also modestly more likely with male patients (female patients’ RR, 0.93), patients with comorbidities (RR, 1.11-1.2), patients who arrived by ambulance (RR, 1.04), and patients who were Asian (RR, 1.10), Black (RR, 1.05), or Hispanic (RR, 1.04). Undertriage became gradually less likely with each additional year in the study period, with an RR of 0.89 in 2019 and 2020.
Among the study’s limitations were use of ESI version 4, instead of the currently used 5, and the omission of common procedures from the outcome definition that “may systematically bias the analysis toward overtriage,” the editorial noted. The authors also did not include pain as a variable in the analysis, which can often indicate patient acuity.
Further, this study was unable to include covariates identified in other research that may influence clinical decision-making, such as “the presenting illness or injury, children with complex medical needs, and language proficiency,” Dr. Frankenberger and colleagues wrote. “Furthermore, environmental stressors, such as ED volume and crowding, can influence how a nurse prioritizes care and may increase bias in decision-making and/or increase practice variability.”
The study was funded by the Kaiser Permanente Northern California (KPNC) Community Health program. One author had consulting payments from CSL Behring and Abbott Point-of-Care, and six of the authors have received grant funding from the KPNC Community Health program. The editorial authors reported no conflicts of interest.
, according to a multicenter retrospective study published in JAMA Pediatrics. Researchers also identified gender, age, race, ethnicity, and comorbidity disparities in those who were undertriaged.
The researchers found that only 34.1% of visits were correctly triaged while 58.5% were overtriaged and 7.4% were undertriaged. The findings were based on analysis of more than 1 million pediatric emergency visits over a 5-year period that used the Emergency Severity Index (ESI) version 4 for triage.
“The ESI had poor sensitivity in identifying a critically ill pediatric patient, and undertriage occurred in 1 in 14 children,” wrote Dana R. Sax, MD, a senior emergency physician at The Permanente Medical Group in northern California, and her colleagues.
“More than 90% of pediatric visits were assigned a mid to low triage acuity category, and actual resource use and care intensity frequently did not align with ESI predictions,” the authors wrote. “Our findings highlight an opportunity to improve triage for pediatric patients to mitigate critical undertriage, optimize resource decisions, standardize processes across time and setting, and promote more equitable care.”
The authors added that the study findings are currently being used by the Permanente system “to develop standardized triage education across centers to improve early identification of high-risk patients.”
Disparities in Emergency Care
The results underscore the need for more work to address disparities in emergency care, wrote Warren D. Frankenberger, PhD, RN, a nurse scientist at Children’s Hospital of Philadelphia, and two colleagues in an accompanying editorial.
“Decisions in triage can have significant downstream effects on subsequent care during the ED visit,” they wrote in their editorial. “Given that the triage process in most instances is fully executed by nurses, nurse researchers are in a key position to evaluate these and other covariates to influence further improvements in triage.” They suggested that use of clinical decision support tools and artificial intelligence (AI) may improve the triage process, albeit with the caveat that AI often relies on models with pre-existing historical bias that may perpetuate structural inequalities.
Study Methodology
The researchers analyzed 1,016,816 pediatric visits at 21 emergency departments in Kaiser Permanente Northern California between January 2016 and December 2020. The patients were an average 7 years old, and 47% were female. The researchers excluded visits that lacked ESI data or had incomplete ED time variables as well as those with patients who left against medical advice, were not seen, or were transferred from another ED.
The study relied on novel definitions of ESI undertriage and overtriage developed through a modified Delphi process by a team of four emergency physicians, one pediatric emergency physician, two emergency nurses, and one pediatric ICU physician. The definition involved comparing ESI levels to the clinical outcomes and resource use.
Resources included laboratory analysis, electrocardiography, radiography, CT, MRI, diagnostic ultrasonography (not point of care), angiography, IV fluids, and IV, intramuscular, or nebulized medications. Resources did not include “oral medications, tetanus immunizations, point-of-care testing, history and physical examination, saline or heparin lock, prescription refills, simple wound care, crutches, splints, and slings.”
Level 1 events were those requiring time-sensitive, critical intervention, including high-risk sepsis. Level 2 events included most level 1 events that occurred after the first hour (except operating room admission or hospital transfer) as well as respiratory therapy, toxicology consult, lumbar puncture, suicidality as chief concern, at least 2 doses of albuterol or continuous albuterol nebulization, a skeletal survey x-ray order, and medical social work consult with an ED length of stay of at least 2 hours. Level 3 events included IV mediation order, any CT order, OR admission or hospital transfer after one hour, or any pediatric hospitalist consult.
Analyzing the ED Visits
Overtriaged cases were ESI level 1 or 2 cases in which fewer than 2 resources were used; level 3 cases where fewer than 2 resources were used and no level 1 or 2 events occurred; and level 4 cases where no resources were used.
Undertriaged cases were defined as the following:
- ESI level 5 cases where any resource was used and any level 1, 2, or 3 events occurred.
- Level 4 cases where more than 1 resource was used and any level 1, 2, or 3 events occurred.
- Level 3 cases where any level 1 event occurred, more than one level 2 event occurred, or any level 2 event occurred and more than one additional ED resource type was used.
- Level 2 cases where any level 1 event occurred.
About half the visits (51%) were assigned ESI 3, which was the category with the highest proportion of mistriage. After adjusting for study facility and triage vital signs, the researchers found that children age 6 and older were more likely to be undertriaged than those younger than 6, particularly those age 15 and older (relative risk [RR], 1.36).
Undertriage was also modestly more likely with male patients (female patients’ RR, 0.93), patients with comorbidities (RR, 1.11-1.2), patients who arrived by ambulance (RR, 1.04), and patients who were Asian (RR, 1.10), Black (RR, 1.05), or Hispanic (RR, 1.04). Undertriage became gradually less likely with each additional year in the study period, with an RR of 0.89 in 2019 and 2020.
Among the study’s limitations were use of ESI version 4, instead of the currently used 5, and the omission of common procedures from the outcome definition that “may systematically bias the analysis toward overtriage,” the editorial noted. The authors also did not include pain as a variable in the analysis, which can often indicate patient acuity.
Further, this study was unable to include covariates identified in other research that may influence clinical decision-making, such as “the presenting illness or injury, children with complex medical needs, and language proficiency,” Dr. Frankenberger and colleagues wrote. “Furthermore, environmental stressors, such as ED volume and crowding, can influence how a nurse prioritizes care and may increase bias in decision-making and/or increase practice variability.”
The study was funded by the Kaiser Permanente Northern California (KPNC) Community Health program. One author had consulting payments from CSL Behring and Abbott Point-of-Care, and six of the authors have received grant funding from the KPNC Community Health program. The editorial authors reported no conflicts of interest.
FROM JAMA PEDIATRICS

I*DEA in the VA: Optimizing the Physician Workforce to Enhance Quality of Care
Enhancing the quality of care for the evolving American veteran population is critical: many are vulnerable as a result of unique psychological and physical exposures, and many are increasingly coming from populations the federal government considers “potentially vulnerable.”1 To ensure that the needs of veterans enrolled in the Veterans Health Administration (VHA) are met, the US Department of Veterans Affairs (VA) workforce must be aware of shifts in the demographics of those who served.
The I*DEA (inclusion, diversity, equity, and access) Council is a new VHA equity team that aims to eliminate gaps in health care and benefits to ensure that historically underserved veteran communities receive the treatment they need. The Council is the oversight body for veteran and employee-facing I*DEA programs, policies, and initiatives.2 One strategy to achieve better health outcomes for enrolled veterans is to prioritize the VA health care workforce. In this capacity, the I*DEA Council examines obstacles to hiring, promoting, and retaining employees from underserved communities.
This article discusses how diversity encompasses more than gender and ethnicity and proposes applying the following I*DEA strategies to leadership positions within the VA health care workforce: inclusion of diverse perspectives and ideas, equity of opportunities, and accessibility to leadership roles within VHA facilities. Implementing these actions may help attract and retain qualified clinicians as health care leaders and enable the VHA to better serve the diverse veteran population.
Veteran Demographics
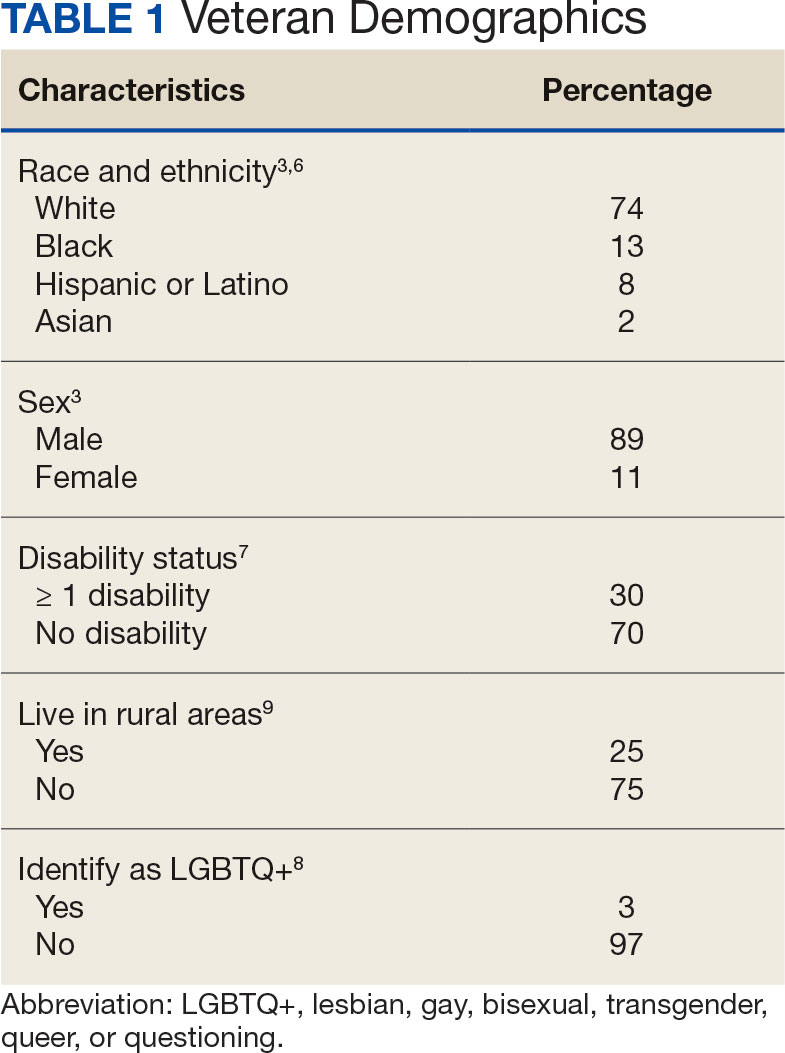
Characteristics of the current population of veterans differ significantly from those of individuals who served in previous eras. Since 2016, Gulf War era veterans have comprised the largest share of the veteran population, even larger than the share of Vietnam War era veterans.3 Among Gulf War veterans, 47% of women and 39% of men are aged < 35 years.4 Another notable change is the increase in the number of female veterans. In 1992, only 4% of veterans were female.5 Now, about 11% of veterans are female, a number projected to grow to 18% by 2046 (Table 1).3
With respect to race and ethnicity, about 74% of the current veteran population identifies as White, 13% as Black, 8% as Hispanic or Latino, and 2% as Asian.3,6 In addition, about 30% of veterans have ≥ 1 disability.7 About 1 million current veterans (3%) identify as lesbian, gay, bisexual, transgender, queer, and/or questioning (LGBTQ+).8 Almost 1 in 4 veterans—about 4.4 million—reside in rural communities, and 55% of these rural veterans are aged > 65 years.9 Of the 4.4 million veterans who live in rural areas, 61% are enrolled in VA health care, and among those individuals 8% are women and 10% are minorities.9
Studies have found that age, sex, race and ethnicity, disability status, and LGBTQ+ identification all significantly affect health care access and outcomes in the general population.10-16 Female patients are more likely to have their symptoms downplayed or dismissed, and are often less likely to receive aggressive treatments when compared with male patients. They are also frequently underrepresented or even excluded from clinical trials.11 Female veterans have unique health care needs and report preferences for being treated by female clinicians.17,18
Higher rates of chronic health conditions and reduced access to mental health services are found among Black Americans compared to White Americans.13 Black veterans are also denied VHA benefits more often than White veterans.19 Patients with disabilities have barriers to accessing care, including difficulty with transportation and a lack of knowledge among clinicians regarding the best course of care.14 Additionally, veterans who identify as LGBTQ+ are less likely than veterans who are cisgender and heterosexual to access Veterans Health Administration (VHA) care.20 Veterans in rural communities experience more challenges to accessing health care; up to one-third of veterans in this population are unable to access the internet at home.9
To optimize care for the evolving veteran population, VHA clinicians and leaders need to be aware of the changing demographic characteristics and unique health care needs of the veteran population. Increased inclusion, diversity, and equity within the health care workforce is associated with improved quality of care, improved clinical outcomes, and have had positive financial effects on health care institutions.21-25
VA Workforce Demographics
According to the VA Office of Resolution Management, Diversity, and Inclusion, at the end of fiscal year 2020 57% of VA employees identified as White, 25% as Black, 8% as Asian, 7% as Hispanic or Latino, 2% as American Indian or Alaskan Native, and 1% belonged to ≥ 2 races.26 Women comprise about 60% of the permanent VA workforce.27 About 12% of VA employees report having a disability, which is similar to the rate of disability among noninstitutionalized civilians in the US (12.7%).28 Five percent of VA employees identified as LGBTQ+.29
Although the general workforce is relatively diverse, there is not as much diversity within VA leadership, and little data exist about the demographic characteristics of VHA physicians. As of September 2020, there were 494 senior executive service and Title 38 (health care workers) senior executive service equivalent leaders in the VHA.26 Almost 78% of these leadership positions belonged to white men and women: about 50% to white men and 28% to white women. In contrast, 8% of these positions were occupied by Black men, 7% by Black women, 3% by Asian men, 2% by Asian women, and 2% by Hispanic or Latino men.26
I*DEA in the VA
The I*DEA Council seeks to eliminate gaps in VHA care and benefits to ensure that historically underserved veteran communities receive fair treatment.30 In addition to continued attention to racial disparities, the new initiative will also examine challenges experienced by other groups, including women, individuals who identify as LGBTQ+, tribal communities, and veterans who live in rural areas, aiming to eliminate disparities that exist within the VHA.
Published in 2021, the I*DEA Action Plan discusses recommendations to enhance inclusion, diversity, equity, and accessibility within the VHA. Its mission statement states that the Council aims to “advance an inclusive environment that values and supports the diverse communities we serve” and “cultivates equitable access to care, benefits and services for all” from 2021 to 2025.31 To achieve better health outcomes for veterans, the I*DEA Council plans to focus on the VHA workforce and examine and address obstacles to hiring, promoting, and retaining employees.31
There are several potential benefits of increased I*DEA integration into the health care workforce.21-25 The inclusion of ideas and perspectives from diverse backgrounds, establishing equity of opportunities for all who are appropriately qualified, and accessibility to leadership roles that enable decision making by fostering culture change are direct components of I*DEA that may be beneficial. Diversity encompasses more than race, ethnicity, and gender, and creating a more diverse workforce involves recruiting qualified clinicians with diverse backgrounds and perspectives. Doing so would better reflect the diversity of veteran patients and could enhance the ability of clinicians to learn from each other and be inclusive, while understanding veterans’ unique barriers to accessing health care.
I*DEA integration may reduce the incidence of microaggressions and help transform workplace culture.32 This would be particularly beneficial for patients, as microaggressions can decrease patient satisfaction and may potentially negatively affect health outcomes.33,34 In addition, health care professionals (HCPs) would benefit from fewer microaggressions in the workplace and this would foster a more positive, supportive work environment and improve morale.
Current VHA workforce data reflect changes in the veteran population. The workforce is relatively diverse regarding race and ethnicity, gender, disability, and LGBTQ+ status. However, room for improvement remains with respect to greater inclusion, diversity of perspectives, equity, and accessibility to leadership positions and decision making roles. This would ultimately benefit and improve care for veterans. Prioritizing this within the VHA, as reflected in one of the I*DEA Task Force recommendations, is of great significance.31
It can be difficult to accurately assess the progress made in implementing I*DEA strategies at individual institutions within the VHA. While demographic diversity can be gauged using employee statistics, assessing perceptions of inclusion, incorporation of diverse perspectives, equity, and accessibility is more challenging. We recommend continuing to administer questions focusing specifically on these perceptions to current HCPs via the VHA annual All Employee Survey.35
Implementation
The VA has begun initiating I*DEA concepts in its workforce, starting with the establishment and usage of Special Emphasis Programs.36 The goal of these programs is to increase the employment of historically marginalized groups, including women, people belonging to racial and ethnic minorities, people with disabilities,and individuals identifying as LGBTQ+.28,37-42 For example, each federal agency has a designated Federal Women’s Program whose responsibilities include helping with the recruitment and advancement of female employees.37
The VHA also has an affirmative action plan with goals for recruiting and retaining individuals with disabilities.28 To strengthen equity and inclusion, the VHA offers multiple educational courses (some mandatory), both virtual and in-person, on topics such as understanding microaggressions, managing implicit bias, and understanding the importance of gender and generational diversity.43 Creating awareness and addressing misconceptions about veteran demographics at VA medical centers is important, as is enhancing awareness among the physician workforce about VA strategies and action plans to increase I*DEA. The VHA has hired officers specifically tasked with focusing on these initiatives.
Workforce Strategies
It is important to recognize overlaps between organizational ethics, quality improvement, and I*DEA initiatives. Establishing an I*DEA Council to ensure the delivery of quality care to veterans is commendable. At the facility level, individual I*DEA officers can make observations and recommendations but are not empowered to effect change. Without participation and buy-in from individuals in leadership positions, the efficacy of I*DEA initiatives is limited.

We propose implementing simple strategies to enhance the inclusion of diverse ideas and perspectives, equity of opportunities, and accessibility to clinical leadership roles within the VHA (Table 2). A competitive selection process with specific, objective criteria to enable the selection of qualified clinical leaders is vital. Specific achievements in or contributions to quality improvement, education, research, professional publications, or diversity enhancing efforts should be required qualifications for clinical leadership roles.44
Establishing term limits for clinical leadership positions—something already being implemented at the National Institutes of Health—would be of tremendous value in the VHA.45-47 Term limits would facilitate I*DEA initiatives and accessibility of leadership roles to qualified clinicians fromvarious demographics. Improving diversity of thought among clinical leaders is especially important, given how buy-in from leadership is critical in transforming the culture of an organization. Term limits would enable access to leadership roles for forward thinking, qualified clinical leaders who could institute and support changes that would promote continuous process improvement initiatives. Leaders could have the option to reapply following the completion of a term, with the ability to demonstrate specific achievements.
Another strategy for increasing equity is to ensure transparency of committee structures, with the rotation of committee members and term limits set for committee chairs whenever possible. This provides access to leadership roles, which enables participation in decision making processes. Residents and fellows who work and train at VA hospitals should have awareness of the facility’s organizational structure and the ability to participate in certain committees. The VHA workforce should be regularly informed about educational opportunities, leadership openings, and I*DEA initiatives to increase their access and use.
Exit interviews for clinicians leaving the VA would enable feedback, provide focused reviews of any problematic issues that need to be addressed, and serve as assessments of organizational ethics.48 Transparency and truth telling could be encouraged by having these exit interviews conducted by staff in the human resources department or others outside the home department of the departing clinician.
Mentorship has played a significant role in exposing individuals from historically underrepresented groups to careers in health care, while also advancing and enhancing their careers after they become health care professionals.49-51 Implementing and publicizing VA and veteran health care-focused mentorship and volunteer programs targeted at local communities, rural areas, schools, undergraduate programs, and medical students could increase the likelihood that students and trainees from these groups are exposed to the VHA which may lead them to join the workforce.
Conclusions
Veterans receiving care from the VHA are becoming increasingly diverse. I*DEA strategies could optimize the VHA workforce and enhance the provision of quality care for veterans. The inclusion of diverse perspectives and backgrounds, equity of opportunities, and accessibility to leadership positions is important. Careful selection of qualified clinical leaders within the VHA—with established term limits for leadership positions, rotation of committee chairs and members, and exit interviews to obtain insights from clinicians who leave the VHA—all align with these strategies. This will foster energy and culture change, create an environment conducive to collaboration, learning, and professional growth and will enable continuous process improvement within individual VA medical centers.
1. US Department of Veterans Affairs, Office of Research & Development. Health equity. Accessed July 1, 2024. https://www.research.va.gov/topics/health_equity.cfm
2. US Department of Veterans Affairs. Equity action plan. Accessed July 1, 2024. https://department.va.gov/wp-content/uploads/2024/02/Department-of-Veterans-Affairs-Equity-Action-Plan.pdf
3. Schaeffer K. The changing face of America’s veteran population. Pew Research Center. March 2021. Updated November 8, 2023. Accessed May 23, 2024. https://www.pewresearch.org/short-reads/2021/04/05/the-changing-face-of-americas-veteran-population/
4. US Department of Labor, Veterans’ Employment and Training Service. 2021 employment situation of women veterans. Accessed May 23, 2024. http://www.dol.gov/agencies/vets/womenveterans/womenveterans-employment
5. US Department of Veterans Affairs, National Center for Veteran Analysis and Statistics. National survey of veterans (NSV9503). Accessed June 20, 2024. https://www.va.gov/vetdata/docs/surveysandstudies/vetpop.pdf
6. US Census Bureau. Veterans Day 2022: November 11. News release. October 26, 2022. Updated April 4, 2024. Accessed May 23, 2024. https://www.census.gov/newsroom/facts-for-features/2022/veterans-day.html
7. ADA National Network. Employment data for veterans with disabilities. 2017. Accessed June 23, 2024. https://adata.org/factsheet/employment-data-veterans-disabilities
8. LGBTQ+ Veterans. DAV. Accessed July 26, 2024. https://www.dav.org/get-help-now/veteran-topics-resources/lgbtq-veterans/
9. US Department of Veterans Affairs, Office of Rural Health. Rural Veterans. Updated May 14, 2024. Accessed June 20, 2024. https://www.ruralhealth.va.gov/aboutus/ruralvets.asp
10. Mikton C, de la Fuente-Núñez V, Officer A, Krug E. Ageism: a social determinant of health that has come of age. Lancet. 2021;397(10282):1333-1334.
doi:10.1016/S0140-6736(21)00524-9
11. Heise L, Greene ME, Opper N, et al. Gender inequality and restrictive gender norms: framing the challenges to health. Lancet. 2019;393(10189):2440-2454.
doi:10.1016/S0140-6736(19)30652-X
12. Egede LE. Race, ethnicity, culture, and disparities in health care. J Gen Intern Med. 2006;21(6):667-669. doi:10.1111/j.1525-1497.2006.0512.x
13. Carratala S, Maxwell C. Health disparities by race and ethnicity. Center for American Progress. Updated May 11, 2020. Accessed June 23, 2024. https://www.americanprogress.org/article/health-disparities-race-ethnicity/
14. Clemente KAP, Silva SVD, Vieira GI, et al. Barriers to the access of people with disabilities to health services: a scoping review. Rev Saude Publica. 2022;56:64.
doi:10.11606/s1518-8787.2022056003893
15. Krehely J. How to close the LGBT health disparities gap. Center for American Progress. December 21, 2009. Accessed May 23, 2024. https://www.americanprogress.org/article/how-to-close-the-lgbt-health-disparities-gap/
16. Dawson L, Frederiksen B, Long M, Ranji U, Kates J. LGBT+ people’s health and experiences accessing care. KFF. July 22, 2021. Accessed May 23, 2024. https://www.kff.org/womens-health-policy/report/lgbt-peoples-health-and-experiences-accessing-care
17. Disabled American Veterans. DAV report spotlights issues facing women veterans. September 12, 2018. Accessed June 23, 2024. https://www.dav.org/learn-more/news/2018/new-report-spotlights-continuing-challenges-facing-women-veterans/
18. Sheahan KL, Goldstein KM, Than CT, et al. Women veterans’ healthcare needs, utilization, and preferences in veterans affairs primary care settings. J Gen Intern Med. 2022;37(Suppl 3):791-798.
doi:10.1007/s11606-022-07585-3
19. Habeshian S. VA denied Black veterans health benefits more often than White vets, data shows. Axios. June 23, 2023. Accessed June 20, 2024. https://www.axios.com/2023/06/23/veterans-benefits-black-white-rate-disproportionate
20. Shipherd JC, Darling JE, Klap RS, Rose D, Yano EM. Experiences in the Veterans Health Administration and impact on healthcare utilization: comparisons between LGBT and non‐LGBT women veterans. LGBT Health. 2018;5(5):303‐311. doi:10.1089/lgbt.2017.0179
21. Gomez LE, Bernet P. Diversity improves performance and outcomes. J Natl Med Assoc. 2019;111(4):383-392. doi:10.1016/j.jnma.2019.01.006
22. Gill GK, McNally MJ, Berman V. Effective diversity, equity, and inclusion practices. Healthc Manage Forum. 2018;31(5):196-199. doi:10.1177/0840470418773785
23. Balinda IG, Reza N. Diversity, equity, inclusion, and belonging in cardiovascular disease fellowship training. Methodist DeBakey Cardiovasc J. 2022;18(3):67-77. doi:10.14797/mdcvj.1080
24. Parsons SK, Fineberg IC, Lin M, Singer M, Tang M, Erban JK. Promoting high-quality cancer care and equity through disciplinary diversity in team composition. J Oncol Pract. 2016;12(11):1141-1147. doi:10.1200/JOP.2016.013920
25. Stanford FC. The importance of diversity and inclusion in the healthcare workforce. J Natl Med Assoc. 2020;112(3):247-249. doi:10.1016/j.jnma.2020.03.014
26. US Department of Veterans Affairs. Diversity and inclusion strategic plan, fiscal years 2021-2022. Accessed May 23, 2024. https://www.va.gov/ORMDI/docs/StrategicPlan.pdf
27. US Department of Veterans Affairs (VA). US EEOC. Accessed July 1, 2024. https://www.eeoc.gov/federal-sector/department-veterans-affairs-va-0
28. US Department of Veterans Affairs, Office of Resolution Management, Diversity & Inclusion (ORMDI). Individuals with disabilities employment program. Updated August 15, 2022. Accessed June 20, 2024. https://www.va.gov/ORMDI/DiversityInclusion/IWD.asp
29. US Department of Veterans Affairs, Office of Resolution Management, Diversity & Inclusion (ORMDI). VA workforce diversity: FY 2022. Accessed July 1, 2024. https://www.va.gov/ORMDI/Diversity_Inclusion.asp
30. US Department of Veterans Affairs. Same mission, new I-DEA: VA supports inclusion, diversity, equity and access. News release. April 28, 2023. Accessed June 20, 2024. https://news.va.gov/118609/same-mission-va-supports-inclusion-diversity/
31. US Department of Veterans Affairs, Office of Resolution Management, Diversity & Inclusion. Inclusion, diversity, equity, & access (I-DEA) action plan. September 2021. Accessed June 20, 2024. https://www.va.gov/ORMDI/docs/VA_I-DEA_Action_Plan-SIGNED.pdf
32. Sue DW, Alsaidi S, Awad MN, Glaeser E, Calle CZ. Disarming racial microaggressions: microintervention strategies for targets, White allies, and bystanders. Am Psychol. 2019;74(1):128-142. doi:10.1037/amp0000296
33. Cruz D, Rodriguez Y, Mastropaolo C. Perceived microaggressions in health care: a measurement study. PLoS One. 2019;14(2):e0211620. doi:10.1371/journal.pone.0211620
 34. Ehie O, Muse I, Hill L, Bastien A. Professionalism: microaggression in the healthcare setting. Curr Opin Anaesthesiol. 2021;34(2):131-136. doi:10.1097/ACO.0000000000000966
35. US Department of Veterans Affairs. VA all employee survey. Accessed May 23, 2024. https://www.data.va.gov/stories/s/VA-All-Employee-Survey-AES-/r32e-j4vj/
36. US Department of Veterans Affairs, Office of Resolution Management, Diversity & Inclusion. Special emphasis programs (ORMDI). Updated May 3, 2023. Accessed June 20, 2024. https://www.va.gov/ORMDI/DiversityInclusion/Special_Emphasis_Programs.asp
37. US Department of Veterans Affairs, Office of Resolution Management, Diversity & Inclusion (ORMDI). Federal women’s program. Updated August 9, 2022. Accessed June 20, 2024. https://www.va.gov/ORMDI/DiversityInclusion/FWP.asp
38. US Department of Veterans Affairs, Office of Resolution Management, Diversity & Inclusion (ORMDI). Hispanic Employment program. Updated May 16, 2024. Accessed June 20, 2024. https://www.va.gov/ORMDI/DiversityInclusion/HEP.asp
39. US Department of Veterans Affairs, Office of Resolution Management, Diversity & Inclusion (ORMDI). American Indian & Alaska Native Program. Updated September 27, 2023. Accessed June 20, 2024. https://www.va.gov/ORMDI/DiversityInclusion/AIAN.asp
40. US Department of Veterans Affairs, Office of Resolution Management, Diversity & Inclusion (ORMDI). Asian American, Native Hawaiian and Pacific Islander program. Updated September 27, 2023. Accessed June 20, 2024. https://www.va.gov/ORMDI/DiversityInclusion/AAPI.asp
41. US Department of Veterans Affairs, Office of Resolution Management, Diversity & Inclusion (ORMDI). Black/African American program. Updated May 3, 2023. Accessed June 20, 2024. https://www.va.gov/ORMDI/DiversityInclusion/Black_African_American.asp
42. US Department of Veterans Affairs, Office of Resolution Management, Diversity & Inclusion (ORMDI). LGBTQ+ program. Updated May 21, 2024. Accessed June 20, 2024. https://www.va.gov/ORMDI/DiversityInclusion/LGBT.asp
43. US Department of Veterans Affairs, Office of Resolution Management, Diversity & Inclusion (ORMDI). Diversity, equity and inclusion training. Updated March 18, 2024. Accessed June 20, 2024. https://www.va.gov/ORMDI/DiversityInclusion/Diversity_Inclusion_Training.asp
44. Rotenstein LS, Reede JY, Jena AB. Addressing workforce diversity - a quality-improvement framework. N Engl J Med. 2021;384(12):1083-1086. doi:10.1056/NEJMp2032224
45. Beeler WH, Mangurian C, Jagsi R. Unplugging the pipeline - a call for term limits in academic medicine. N Engl J Med. 2019;381(16):1508-1511. doi:10.1056/NEJMp1906832
46. Smith DG. Term limits in academic public health administration. Public Health Rep. 2020;135(6):859-863. doi:10.1177/0033354920954495
47. Kaiser J. Shake-up at NIH: Term limits for important positions would open new opportunities for women, minorities. science.org. May 2, 2019. Accessed May 23, 2024. https://www.science.org/content/article/shakeup-nih-term-limits-important-positions-would-open-new-opportunities-women
48. Giacalone RA, Jurkiewicz CL, Knouse SB. Exit surveys as assessments of organizational ethicality. Public Pers Manage. 2003;32(3):397-410. doi:10.1177/009102600303200306
49. Bonifacino E, Ufomata EO, Farkas AH, Turner R, Corbelli JA. Mentorship of underrepresented physicians and trainees in academic medicine: a systematic review. J Gen Intern Med. 2021;36(4):1023-1034. doi:10.1007/s11606-020-06478-7
50. Brown IM. Diversity matters: mentorship is the missing ingredient in DEI. Emergency Medicine News. 2021;43(8):28. doi:10.1097/01.EEM.0000771148.76632.35
51. Sinha A, Kuy S. The future of surgery - increasing diversity, equity, and inclusion through early mentorship. Am J Surg. 2023;225(4):800-802. doi:10.1016/j.amjsurg.2022.12.011
Enhancing the quality of care for the evolving American veteran population is critical: many are vulnerable as a result of unique psychological and physical exposures, and many are increasingly coming from populations the federal government considers “potentially vulnerable.”1 To ensure that the needs of veterans enrolled in the Veterans Health Administration (VHA) are met, the US Department of Veterans Affairs (VA) workforce must be aware of shifts in the demographics of those who served.
The I*DEA (inclusion, diversity, equity, and access) Council is a new VHA equity team that aims to eliminate gaps in health care and benefits to ensure that historically underserved veteran communities receive the treatment they need. The Council is the oversight body for veteran and employee-facing I*DEA programs, policies, and initiatives.2 One strategy to achieve better health outcomes for enrolled veterans is to prioritize the VA health care workforce. In this capacity, the I*DEA Council examines obstacles to hiring, promoting, and retaining employees from underserved communities.
This article discusses how diversity encompasses more than gender and ethnicity and proposes applying the following I*DEA strategies to leadership positions within the VA health care workforce: inclusion of diverse perspectives and ideas, equity of opportunities, and accessibility to leadership roles within VHA facilities. Implementing these actions may help attract and retain qualified clinicians as health care leaders and enable the VHA to better serve the diverse veteran population.
Veteran Demographics
Characteristics of the current population of veterans differ significantly from those of individuals who served in previous eras. Since 2016, Gulf War era veterans have comprised the largest share of the veteran population, even larger than the share of Vietnam War era veterans.3 Among Gulf War veterans, 47% of women and 39% of men are aged < 35 years.4 Another notable change is the increase in the number of female veterans. In 1992, only 4% of veterans were female.5 Now, about 11% of veterans are female, a number projected to grow to 18% by 2046 (Table 1).3
With respect to race and ethnicity, about 74% of the current veteran population identifies as White, 13% as Black, 8% as Hispanic or Latino, and 2% as Asian.3,6 In addition, about 30% of veterans have ≥ 1 disability.7 About 1 million current veterans (3%) identify as lesbian, gay, bisexual, transgender, queer, and/or questioning (LGBTQ+).8 Almost 1 in 4 veterans—about 4.4 million—reside in rural communities, and 55% of these rural veterans are aged > 65 years.9 Of the 4.4 million veterans who live in rural areas, 61% are enrolled in VA health care, and among those individuals 8% are women and 10% are minorities.9
Studies have found that age, sex, race and ethnicity, disability status, and LGBTQ+ identification all significantly affect health care access and outcomes in the general population.10-16 Female patients are more likely to have their symptoms downplayed or dismissed, and are often less likely to receive aggressive treatments when compared with male patients. They are also frequently underrepresented or even excluded from clinical trials.11 Female veterans have unique health care needs and report preferences for being treated by female clinicians.17,18
Higher rates of chronic health conditions and reduced access to mental health services are found among Black Americans compared to White Americans.13 Black veterans are also denied VHA benefits more often than White veterans.19 Patients with disabilities have barriers to accessing care, including difficulty with transportation and a lack of knowledge among clinicians regarding the best course of care.14 Additionally, veterans who identify as LGBTQ+ are less likely than veterans who are cisgender and heterosexual to access Veterans Health Administration (VHA) care.20 Veterans in rural communities experience more challenges to accessing health care; up to one-third of veterans in this population are unable to access the internet at home.9
To optimize care for the evolving veteran population, VHA clinicians and leaders need to be aware of the changing demographic characteristics and unique health care needs of the veteran population. Increased inclusion, diversity, and equity within the health care workforce is associated with improved quality of care, improved clinical outcomes, and have had positive financial effects on health care institutions.21-25
VA Workforce Demographics
According to the VA Office of Resolution Management, Diversity, and Inclusion, at the end of fiscal year 2020 57% of VA employees identified as White, 25% as Black, 8% as Asian, 7% as Hispanic or Latino, 2% as American Indian or Alaskan Native, and 1% belonged to ≥ 2 races.26 Women comprise about 60% of the permanent VA workforce.27 About 12% of VA employees report having a disability, which is similar to the rate of disability among noninstitutionalized civilians in the US (12.7%).28 Five percent of VA employees identified as LGBTQ+.29
Although the general workforce is relatively diverse, there is not as much diversity within VA leadership, and little data exist about the demographic characteristics of VHA physicians. As of September 2020, there were 494 senior executive service and Title 38 (health care workers) senior executive service equivalent leaders in the VHA.26 Almost 78% of these leadership positions belonged to white men and women: about 50% to white men and 28% to white women. In contrast, 8% of these positions were occupied by Black men, 7% by Black women, 3% by Asian men, 2% by Asian women, and 2% by Hispanic or Latino men.26
I*DEA in the VA
The I*DEA Council seeks to eliminate gaps in VHA care and benefits to ensure that historically underserved veteran communities receive fair treatment.30 In addition to continued attention to racial disparities, the new initiative will also examine challenges experienced by other groups, including women, individuals who identify as LGBTQ+, tribal communities, and veterans who live in rural areas, aiming to eliminate disparities that exist within the VHA.
Published in 2021, the I*DEA Action Plan discusses recommendations to enhance inclusion, diversity, equity, and accessibility within the VHA. Its mission statement states that the Council aims to “advance an inclusive environment that values and supports the diverse communities we serve” and “cultivates equitable access to care, benefits and services for all” from 2021 to 2025.31 To achieve better health outcomes for veterans, the I*DEA Council plans to focus on the VHA workforce and examine and address obstacles to hiring, promoting, and retaining employees.31
There are several potential benefits of increased I*DEA integration into the health care workforce.21-25 The inclusion of ideas and perspectives from diverse backgrounds, establishing equity of opportunities for all who are appropriately qualified, and accessibility to leadership roles that enable decision making by fostering culture change are direct components of I*DEA that may be beneficial. Diversity encompasses more than race, ethnicity, and gender, and creating a more diverse workforce involves recruiting qualified clinicians with diverse backgrounds and perspectives. Doing so would better reflect the diversity of veteran patients and could enhance the ability of clinicians to learn from each other and be inclusive, while understanding veterans’ unique barriers to accessing health care.
I*DEA integration may reduce the incidence of microaggressions and help transform workplace culture.32 This would be particularly beneficial for patients, as microaggressions can decrease patient satisfaction and may potentially negatively affect health outcomes.33,34 In addition, health care professionals (HCPs) would benefit from fewer microaggressions in the workplace and this would foster a more positive, supportive work environment and improve morale.
Current VHA workforce data reflect changes in the veteran population. The workforce is relatively diverse regarding race and ethnicity, gender, disability, and LGBTQ+ status. However, room for improvement remains with respect to greater inclusion, diversity of perspectives, equity, and accessibility to leadership positions and decision making roles. This would ultimately benefit and improve care for veterans. Prioritizing this within the VHA, as reflected in one of the I*DEA Task Force recommendations, is of great significance.31
It can be difficult to accurately assess the progress made in implementing I*DEA strategies at individual institutions within the VHA. While demographic diversity can be gauged using employee statistics, assessing perceptions of inclusion, incorporation of diverse perspectives, equity, and accessibility is more challenging. We recommend continuing to administer questions focusing specifically on these perceptions to current HCPs via the VHA annual All Employee Survey.35
Implementation
The VA has begun initiating I*DEA concepts in its workforce, starting with the establishment and usage of Special Emphasis Programs.36 The goal of these programs is to increase the employment of historically marginalized groups, including women, people belonging to racial and ethnic minorities, people with disabilities,and individuals identifying as LGBTQ+.28,37-42 For example, each federal agency has a designated Federal Women’s Program whose responsibilities include helping with the recruitment and advancement of female employees.37
The VHA also has an affirmative action plan with goals for recruiting and retaining individuals with disabilities.28 To strengthen equity and inclusion, the VHA offers multiple educational courses (some mandatory), both virtual and in-person, on topics such as understanding microaggressions, managing implicit bias, and understanding the importance of gender and generational diversity.43 Creating awareness and addressing misconceptions about veteran demographics at VA medical centers is important, as is enhancing awareness among the physician workforce about VA strategies and action plans to increase I*DEA. The VHA has hired officers specifically tasked with focusing on these initiatives.
Workforce Strategies
It is important to recognize overlaps between organizational ethics, quality improvement, and I*DEA initiatives. Establishing an I*DEA Council to ensure the delivery of quality care to veterans is commendable. At the facility level, individual I*DEA officers can make observations and recommendations but are not empowered to effect change. Without participation and buy-in from individuals in leadership positions, the efficacy of I*DEA initiatives is limited.
We propose implementing simple strategies to enhance the inclusion of diverse ideas and perspectives, equity of opportunities, and accessibility to clinical leadership roles within the VHA (Table 2). A competitive selection process with specific, objective criteria to enable the selection of qualified clinical leaders is vital. Specific achievements in or contributions to quality improvement, education, research, professional publications, or diversity enhancing efforts should be required qualifications for clinical leadership roles.44
Establishing term limits for clinical leadership positions—something already being implemented at the National Institutes of Health—would be of tremendous value in the VHA.45-47 Term limits would facilitate I*DEA initiatives and accessibility of leadership roles to qualified clinicians fromvarious demographics. Improving diversity of thought among clinical leaders is especially important, given how buy-in from leadership is critical in transforming the culture of an organization. Term limits would enable access to leadership roles for forward thinking, qualified clinical leaders who could institute and support changes that would promote continuous process improvement initiatives. Leaders could have the option to reapply following the completion of a term, with the ability to demonstrate specific achievements.
Another strategy for increasing equity is to ensure transparency of committee structures, with the rotation of committee members and term limits set for committee chairs whenever possible. This provides access to leadership roles, which enables participation in decision making processes. Residents and fellows who work and train at VA hospitals should have awareness of the facility’s organizational structure and the ability to participate in certain committees. The VHA workforce should be regularly informed about educational opportunities, leadership openings, and I*DEA initiatives to increase their access and use.
Exit interviews for clinicians leaving the VA would enable feedback, provide focused reviews of any problematic issues that need to be addressed, and serve as assessments of organizational ethics.48 Transparency and truth telling could be encouraged by having these exit interviews conducted by staff in the human resources department or others outside the home department of the departing clinician.
Mentorship has played a significant role in exposing individuals from historically underrepresented groups to careers in health care, while also advancing and enhancing their careers after they become health care professionals.49-51 Implementing and publicizing VA and veteran health care-focused mentorship and volunteer programs targeted at local communities, rural areas, schools, undergraduate programs, and medical students could increase the likelihood that students and trainees from these groups are exposed to the VHA which may lead them to join the workforce.
Conclusions
Veterans receiving care from the VHA are becoming increasingly diverse. I*DEA strategies could optimize the VHA workforce and enhance the provision of quality care for veterans. The inclusion of diverse perspectives and backgrounds, equity of opportunities, and accessibility to leadership positions is important. Careful selection of qualified clinical leaders within the VHA—with established term limits for leadership positions, rotation of committee chairs and members, and exit interviews to obtain insights from clinicians who leave the VHA—all align with these strategies. This will foster energy and culture change, create an environment conducive to collaboration, learning, and professional growth and will enable continuous process improvement within individual VA medical centers.
1. US Department of Veterans Affairs, Office of Research & Development. Health equity. Accessed July 1, 2024. https://www.research.va.gov/topics/health_equity.cfm
2. US Department of Veterans Affairs. Equity action plan. Accessed July 1, 2024. https://department.va.gov/wp-content/uploads/2024/02/Department-of-Veterans-Affairs-Equity-Action-Plan.pdf
3. Schaeffer K. The changing face of America’s veteran population. Pew Research Center. March 2021. Updated November 8, 2023. Accessed May 23, 2024. https://www.pewresearch.org/short-reads/2021/04/05/the-changing-face-of-americas-veteran-population/
4. US Department of Labor, Veterans’ Employment and Training Service. 2021 employment situation of women veterans. Accessed May 23, 2024. http://www.dol.gov/agencies/vets/womenveterans/womenveterans-employment
5. US Department of Veterans Affairs, National Center for Veteran Analysis and Statistics. National survey of veterans (NSV9503). Accessed June 20, 2024. https://www.va.gov/vetdata/docs/surveysandstudies/vetpop.pdf
6. US Census Bureau. Veterans Day 2022: November 11. News release. October 26, 2022. Updated April 4, 2024. Accessed May 23, 2024. https://www.census.gov/newsroom/facts-for-features/2022/veterans-day.html
7. ADA National Network. Employment data for veterans with disabilities. 2017. Accessed June 23, 2024. https://adata.org/factsheet/employment-data-veterans-disabilities
8. LGBTQ+ Veterans. DAV. Accessed July 26, 2024. https://www.dav.org/get-help-now/veteran-topics-resources/lgbtq-veterans/
9. US Department of Veterans Affairs, Office of Rural Health. Rural Veterans. Updated May 14, 2024. Accessed June 20, 2024. https://www.ruralhealth.va.gov/aboutus/ruralvets.asp
10. Mikton C, de la Fuente-Núñez V, Officer A, Krug E. Ageism: a social determinant of health that has come of age. Lancet. 2021;397(10282):1333-1334.
doi:10.1016/S0140-6736(21)00524-9
11. Heise L, Greene ME, Opper N, et al. Gender inequality and restrictive gender norms: framing the challenges to health. Lancet. 2019;393(10189):2440-2454.
doi:10.1016/S0140-6736(19)30652-X
12. Egede LE. Race, ethnicity, culture, and disparities in health care. J Gen Intern Med. 2006;21(6):667-669. doi:10.1111/j.1525-1497.2006.0512.x
13. Carratala S, Maxwell C. Health disparities by race and ethnicity. Center for American Progress. Updated May 11, 2020. Accessed June 23, 2024. https://www.americanprogress.org/article/health-disparities-race-ethnicity/
14. Clemente KAP, Silva SVD, Vieira GI, et al. Barriers to the access of people with disabilities to health services: a scoping review. Rev Saude Publica. 2022;56:64.
doi:10.11606/s1518-8787.2022056003893
15. Krehely J. How to close the LGBT health disparities gap. Center for American Progress. December 21, 2009. Accessed May 23, 2024. https://www.americanprogress.org/article/how-to-close-the-lgbt-health-disparities-gap/
16. Dawson L, Frederiksen B, Long M, Ranji U, Kates J. LGBT+ people’s health and experiences accessing care. KFF. July 22, 2021. Accessed May 23, 2024. https://www.kff.org/womens-health-policy/report/lgbt-peoples-health-and-experiences-accessing-care
17. Disabled American Veterans. DAV report spotlights issues facing women veterans. September 12, 2018. Accessed June 23, 2024. https://www.dav.org/learn-more/news/2018/new-report-spotlights-continuing-challenges-facing-women-veterans/
18. Sheahan KL, Goldstein KM, Than CT, et al. Women veterans’ healthcare needs, utilization, and preferences in veterans affairs primary care settings. J Gen Intern Med. 2022;37(Suppl 3):791-798.
doi:10.1007/s11606-022-07585-3
19. Habeshian S. VA denied Black veterans health benefits more often than White vets, data shows. Axios. June 23, 2023. Accessed June 20, 2024. https://www.axios.com/2023/06/23/veterans-benefits-black-white-rate-disproportionate
20. Shipherd JC, Darling JE, Klap RS, Rose D, Yano EM. Experiences in the Veterans Health Administration and impact on healthcare utilization: comparisons between LGBT and non‐LGBT women veterans. LGBT Health. 2018;5(5):303‐311. doi:10.1089/lgbt.2017.0179
21. Gomez LE, Bernet P. Diversity improves performance and outcomes. J Natl Med Assoc. 2019;111(4):383-392. doi:10.1016/j.jnma.2019.01.006
22. Gill GK, McNally MJ, Berman V. Effective diversity, equity, and inclusion practices. Healthc Manage Forum. 2018;31(5):196-199. doi:10.1177/0840470418773785
23. Balinda IG, Reza N. Diversity, equity, inclusion, and belonging in cardiovascular disease fellowship training. Methodist DeBakey Cardiovasc J. 2022;18(3):67-77. doi:10.14797/mdcvj.1080
24. Parsons SK, Fineberg IC, Lin M, Singer M, Tang M, Erban JK. Promoting high-quality cancer care and equity through disciplinary diversity in team composition. J Oncol Pract. 2016;12(11):1141-1147. doi:10.1200/JOP.2016.013920
25. Stanford FC. The importance of diversity and inclusion in the healthcare workforce. J Natl Med Assoc. 2020;112(3):247-249. doi:10.1016/j.jnma.2020.03.014
26. US Department of Veterans Affairs. Diversity and inclusion strategic plan, fiscal years 2021-2022. Accessed May 23, 2024. https://www.va.gov/ORMDI/docs/StrategicPlan.pdf
27. US Department of Veterans Affairs (VA). US EEOC. Accessed July 1, 2024. https://www.eeoc.gov/federal-sector/department-veterans-affairs-va-0
28. US Department of Veterans Affairs, Office of Resolution Management, Diversity & Inclusion (ORMDI). Individuals with disabilities employment program. Updated August 15, 2022. Accessed June 20, 2024. https://www.va.gov/ORMDI/DiversityInclusion/IWD.asp
29. US Department of Veterans Affairs, Office of Resolution Management, Diversity & Inclusion (ORMDI). VA workforce diversity: FY 2022. Accessed July 1, 2024. https://www.va.gov/ORMDI/Diversity_Inclusion.asp
30. US Department of Veterans Affairs. Same mission, new I-DEA: VA supports inclusion, diversity, equity and access. News release. April 28, 2023. Accessed June 20, 2024. https://news.va.gov/118609/same-mission-va-supports-inclusion-diversity/
31. US Department of Veterans Affairs, Office of Resolution Management, Diversity & Inclusion. Inclusion, diversity, equity, & access (I-DEA) action plan. September 2021. Accessed June 20, 2024. https://www.va.gov/ORMDI/docs/VA_I-DEA_Action_Plan-SIGNED.pdf
32. Sue DW, Alsaidi S, Awad MN, Glaeser E, Calle CZ. Disarming racial microaggressions: microintervention strategies for targets, White allies, and bystanders. Am Psychol. 2019;74(1):128-142. doi:10.1037/amp0000296
33. Cruz D, Rodriguez Y, Mastropaolo C. Perceived microaggressions in health care: a measurement study. PLoS One. 2019;14(2):e0211620. doi:10.1371/journal.pone.0211620
34. Ehie O, Muse I, Hill L, Bastien A. Professionalism: microaggression in the healthcare setting. Curr Opin Anaesthesiol. 2021;34(2):131-136. doi:10.1097/ACO.0000000000000966
35. US Department of Veterans Affairs. VA all employee survey. Accessed May 23, 2024. https://www.data.va.gov/stories/s/VA-All-Employee-Survey-AES-/r32e-j4vj/
36. US Department of Veterans Affairs, Office of Resolution Management, Diversity & Inclusion. Special emphasis programs (ORMDI). Updated May 3, 2023. Accessed June 20, 2024. https://www.va.gov/ORMDI/DiversityInclusion/Special_Emphasis_Programs.asp
37. US Department of Veterans Affairs, Office of Resolution Management, Diversity & Inclusion (ORMDI). Federal women’s program. Updated August 9, 2022. Accessed June 20, 2024. https://www.va.gov/ORMDI/DiversityInclusion/FWP.asp
38. US Department of Veterans Affairs, Office of Resolution Management, Diversity & Inclusion (ORMDI). Hispanic Employment program. Updated May 16, 2024. Accessed June 20, 2024. https://www.va.gov/ORMDI/DiversityInclusion/HEP.asp
39. US Department of Veterans Affairs, Office of Resolution Management, Diversity & Inclusion (ORMDI). American Indian & Alaska Native Program. Updated September 27, 2023. Accessed June 20, 2024. https://www.va.gov/ORMDI/DiversityInclusion/AIAN.asp
40. US Department of Veterans Affairs, Office of Resolution Management, Diversity & Inclusion (ORMDI). Asian American, Native Hawaiian and Pacific Islander program. Updated September 27, 2023. Accessed June 20, 2024. https://www.va.gov/ORMDI/DiversityInclusion/AAPI.asp
41. US Department of Veterans Affairs, Office of Resolution Management, Diversity & Inclusion (ORMDI). Black/African American program. Updated May 3, 2023. Accessed June 20, 2024. https://www.va.gov/ORMDI/DiversityInclusion/Black_African_American.asp
42. US Department of Veterans Affairs, Office of Resolution Management, Diversity & Inclusion (ORMDI). LGBTQ+ program. Updated May 21, 2024. Accessed June 20, 2024. https://www.va.gov/ORMDI/DiversityInclusion/LGBT.asp
43. US Department of Veterans Affairs, Office of Resolution Management, Diversity & Inclusion (ORMDI). Diversity, equity and inclusion training. Updated March 18, 2024. Accessed June 20, 2024. https://www.va.gov/ORMDI/DiversityInclusion/Diversity_Inclusion_Training.asp
44. Rotenstein LS, Reede JY, Jena AB. Addressing workforce diversity - a quality-improvement framework. N Engl J Med. 2021;384(12):1083-1086. doi:10.1056/NEJMp2032224
45. Beeler WH, Mangurian C, Jagsi R. Unplugging the pipeline - a call for term limits in academic medicine. N Engl J Med. 2019;381(16):1508-1511. doi:10.1056/NEJMp1906832
46. Smith DG. Term limits in academic public health administration. Public Health Rep. 2020;135(6):859-863. doi:10.1177/0033354920954495
47. Kaiser J. Shake-up at NIH: Term limits for important positions would open new opportunities for women, minorities. science.org. May 2, 2019. Accessed May 23, 2024. https://www.science.org/content/article/shakeup-nih-term-limits-important-positions-would-open-new-opportunities-women
48. Giacalone RA, Jurkiewicz CL, Knouse SB. Exit surveys as assessments of organizational ethicality. Public Pers Manage. 2003;32(3):397-410. doi:10.1177/009102600303200306
49. Bonifacino E, Ufomata EO, Farkas AH, Turner R, Corbelli JA. Mentorship of underrepresented physicians and trainees in academic medicine: a systematic review. J Gen Intern Med. 2021;36(4):1023-1034. doi:10.1007/s11606-020-06478-7
50. Brown IM. Diversity matters: mentorship is the missing ingredient in DEI. Emergency Medicine News. 2021;43(8):28. doi:10.1097/01.EEM.0000771148.76632.35
51. Sinha A, Kuy S. The future of surgery - increasing diversity, equity, and inclusion through early mentorship. Am J Surg. 2023;225(4):800-802. doi:10.1016/j.amjsurg.2022.12.011